community banks and rural development: research … · system (board), the federal deposit ......
TRANSCRIPT

Community Banks and Rural Development: Research Relating to Proposals to Revise the Regulations That Implement the Community Reinvestment Act
Robert B. Avery, Glenn B. Canner, and Shannon C. Mok, of the Division of Research and Statistics, and Dan S. Sokolov, of the Division of Consumer and Community Affairs, prepared this article. Onka L. Tenkean provided research assistance.
Since 1977, the Community Reinvestment Act (CRA) has required that federally insured bank-ing institutions—commercial banks and savings associations—be evaluated on their records of help-ing to meet the credit needs of their local communi-ties, including low- and moderate-income (hereafter, lower-income) neighborhoods. In 1995, the four fed-eral agencies responsible for bank supervision sub-stantially revised the regulations that implement the CRA.
[footnote] 1. The agencies are the Board of Governors of the Federal Reserve System (Board), the Federal Deposit Insurance Corporation (FDIC), the Office of the Comptroller of the Currency (OCC), and the Office of Thrift Supervision (OTS). [end of footnote.]
The revisions were intended to emphasize performance rather than process, to reduce unneces-sary regulatory burden, and to increase consistency in CRA evaluations.
Under the 1995 regulations, "large" institutions, generally those with assets of $250 million or more, have been evaluated under a three-part test, whereas "small" institutions, generally those with assets of less than $250 million, have been subject to compara-tively streamlined evaluations. Large institutions have been required to report data annually on certain types of CRA-related loans (small-business, small-farm, and community development loans) and on the geographic areas (for example, census tracts) that constitute their local communities, whereas small institutions have been exempt from such reporting.
In 2001, the agencies began reviewing the CRA regulations to determine whether they were success-ful in meeting the objectives that the agencies set forth in 1995. The review focused in part on the possibility of extending the eligibility for streamlined examinations and the exemption from data reporting
to more institutions. In 2004 and 2005, the agencies put forth several proposals to implement these changes by raising the asset-size threshold from $250 million to $500 million or $1 billion. The proposals, and the public's comments on them, paid particular attention to how and when to evaluate the community development performance of banking institutions with assets of less than $1 billion, espe-cially in rural areas, where such institutions have a proportionately larger presence than in urban areas. A related but separate issue that the agencies presented for public comment was how to define which bank activities in rural areas should be considered commu-nity development in CRA evaluations.
We have evaluated a large amount of data to gain insight into the potential effects of these proposals, and in this article we report the key findings of our research. Our intent is to inform deliberation over the recent proposals, not to advocate any particular view.
BRIEF DESCRIPTION OF THE CRA
The CRA encourages federally insured banking insti-tutions to help meet the credit needs of their commu-nities, including lower-income neighborhoods, in a way that is consistent with the safe and sound oper-ation of those institutions.
[footnote] 2. For a more expansive overview of the history of the CRA, see Griffith L. Garwood and Dolores S. Smith (1993), ' 'The Community Reinvestment Act: Evolution and Current Issues,'' Federal Reserve Bulletin, vol. 79 (April), pp. 251-67. [end of footnote.]
In particular, the CRA directs the federal agencies responsible for bank supervision (1) to assess through examinations every institution's record of meeting such community credit needs and (2) to consider the institution's CRA record when evaluating its application for deposit insurance or for a charter, branch or other deposit facility, office relocation, or merger or acquisition.
The CRA gives the agencies broad discretion to implement the law. For example, the act does not

define ''low- or moderate-income neighborhood" or a banking institution's ''community''; rather, the act leaves those definitions to the agencies. The act also leaves to the agencies the establishment of criteria for rating an institution's record of meeting its commu-nity's credit needs. Each agency has separate rule-writing authority for the institutions it supervises; but with one recent exception, the four agencies have adopted identical regulations.
[footnote] 3. Office of the Comptroller of the Currency, Board of Governors of the Federal Reserve System, Federal Deposit Insurance Corpora-tion, Office of Thrift Supervision (1995), ''Community Reinvestment Act Regulations," Federal Register, vol. 60 (May 4), pp. 22156, 22178. [end of footnote.]
The 1995 regulations establish objective standards for measuring performance. Rather than providing specific lending thresholds for particular CRA rat-ings, however, the standards are flexible and are applied in the context of information about an insti-tution, its community, and its competitors (broadly referred to as the institution's ''performance con-text'' ). Moreover, the standards relate not only to the quantity of an institution's activities (for example, the dollar amount of mortgage loans extended) but also to the quality of those activities (that is, their correlation with the community's needs for credit).
Examiners evaluate institutions primarily on their performance in their local communities, which the regulations define as the institutions' "assessment areas.'' Assessment areas encircle an institution's deposit-taking facilities, such as its branches and, if applicable, its automated teller machines (ATMs). Assessment areas are composed of census tracts or aggregations of census tracts, such as counties or metropolitan statistical areas. Examiners consider an institution' s performance outside its assessment area only in limited circumstances.
Transparency is an important aspect of the regu-lations. Every institution's CRA rating—either ''out-standing," ''satisfactory," "needs to improve,'' or ''substantial noncompliance''—is made public, as is a written evaluation that explains the basis of the rating.
[footnote] 4. CRA ratings, the type of evaluation (for example, small-institution or large-institution), the date of the evaluation, and the name of the agency that conducted the evaluation are available from the Federal Financial Institutions Examination Council (FFIEC) at www.ffiec.gov. Comprehensive written evaluations, including ''sub-ratings,'' are available through links from the FFIEC' s website to the websites of the supervisory agencies, which post the evaluations as PDF files. The sub-ratings are available in written form only; they are unavailable in a quantitative, easy-to-use format that would facilitate analysis. [end of footnote.]
small-business and small-farm loans by individual census tract. They must also report the total num-ber and dollar amount, but not the geographic dis-tribution, of their community development loans. In addition, if an institution is subject to the reporting requirements of the Home Mortgage Disclosure Act (HMDA), it is required to disclose detailed informa-tion about its mortgage loans; if the institution is also large for CRA purposes, it must report geographic information for rural mortgage loans, which it other-wise does not need to report.
[footnote] 5. Institutions that are large under the CRA and are covered by HMDA must report the census tracts of all properties for which loans have been extended or for which loan applications have been received unless the loan is made or the application is received in a county with a population of 30,000 or less, in which case reporting the census tract is optional. Small institutions covered by HMDA may, but need not, report the property locations (census tracts and counties) for their rural loans. [end of footnote.]
The criteria in the 1995 regulations for evaluating an institution's performance incorporate four key distinctions. First, the criteria distinguish large bank-ing institutions from small ones. Large banking institutions are subject to a three-part test that looks at lending, investments, and services, whereas small banking institutions face a streamlined test that concentrates on lending (see boxes ''The Large-Institution Evaluation'' and ''The Small-Institution Evaluation''). Moreover, large banking institutions must report data to the agencies; small banking insti-tutions need not do so.
Second, the criteria distinguish among types of banking activity: lending, investing, and providing services. The regulations require the agencies to give large banking institutions explicit sub-ratings on each of these types of activity. Although small banking institutions are not usually evaluated on their invest-ments or services, they may improve their chances of receiving an ''outstanding'' CRA rating if they elect to be evaluated in those areas.
Third, the evaluation criteria reflect a distinction between area-based and recipient-based measures of performance. The CRA's measure of area is the census tract. Key area-based criteria in CRA evaluations include the proportion of an institution's retail loans, and the proportion of its branches, in lower-income census tracts. Categories of census tract income are determined by the ratio of a census tract's median family income to the median family income of the relevant surrounding area as estab-lished at the most recent decennial census. The ranges are 0-49 percent (low), 50-79 percent (moderate), 80-119 percent (middle), and 120 percent or more (upper). For a census tract in a metropolitan (urban) area, the relevant surrounding area is the metropoli-

tan area. For a census tract in a nonmetropolitan (rural) area, the relevant surrounding area is the entire nonmetropolitan region of the state. Baseline classifications of census tract income change every ten years with the release of the census.6
[footnote] 6 . S o m e t rac t c l a s s i f i ca t ions a d j u s t m o r e f r e q u e n t l y t h a n o n c e a d e c a d e b e c a u s e of c h a n g e s in t h e b o u n d a r i e s of m e t r o p o l i t a n a r eas . [end of footnote.]
[beginning of box] The Large-Institution Evaluation
The regulations that implement the CRA establish three tests by which the performance of most large retail bank-ing institutions is evaluated: a lending test, an investment test, and a service test.
The lending test measures lending activity for many types of loan, including home mortgage, small-business, and small-farm loans. The assessment criteria are the proportion of an institution's loans in its assessment areas, the distribution of lending across borrowers of different incomes, the distribution of lending across cen-sus tracts of different incomes, the extent of community development lending, and the use of innovative or flex-ible lending practices to address the credit needs of lower-income individuals or areas.
The investment test considers a banking institution' s qualified investments that benefit its assessment area or a broader statewide or regional area that includes its assess-ment area. A qualified investment is a lawful investment, deposit, membership share, or grant that has community development as its primary purpose.
The service test considers the availability of an institu-tion's system for delivering retail banking services and judges the extent of its community development services and their innovativeness and responsiveness. Among the assessment criteria for retail banking services are the geographic distribution of an institution's branches and the availability and effectiveness of alternative systems for delivering retail banking services, such as automated teller machines, in lower-income areas and to lower-income persons. [end of box.]
[beginning of box] The Small-Institution Evaluation
Small institutions are eligible for streamlined CRA evalu-ations and are exempt from CRA data reporting obliga-tions. The performance of a small institution is measured by its efforts to help meet the credit needs of its assess-ment area. These efforts are evaluated according to the following criteria:
• the institution's overall ratio of loan dollars to deposits • the percentage of loans or, as appropriate, other
lending-related activities in the assessment area • the institution's record of lending to borrowers of dif-
ferent income levels and to businesses and farms of different sizes
• the geographic distribution of the institution's loans • the institution's record of responding to written com-
plaints about its performance in helping to meet credit needs in assessment areas [end of box.]
In addition to area-based measures of performance, CRA evaluations use analogous recipient-based mea-sures. Examples include the proportion of an insti-tution' s loans extended to lower-income borrowers (in the case of mortgage and consumer loans) and to enterprises of different sizes (in the case of small-business and small-farm loans) and the proportion of an institution's services offered to lower-income indi-viduals. The evaluation criteria classify borrowers by income in relation to the median family income of the relevant surrounding area. In doing so, the criteria use the same percentage breakdowns used to classify census tracts by income and the same metropolitan-nonmetropolitan distinction to construct the baseline.
The main difference between the classifications for borrowers and those for census tracts is that baseline classifications for borrowers are updated every year, when the Department of Housing and Urban Devel-opment publishes the estimates of area family income, whereas those for census tracts are updated every ten years.
Fourth, the evaluation criteria distinguish between retail activities, which are often regarded as the tra-ditional business of a banking institution, and com-munity development activities, which are intended primarily to improve the welfare of lower-income people or areas. The regulation recognizes four cate-gories of community development activity, three of which (affordable housing, community services, and economic development through small-business or small-farm financing) target certain recipients— lower-income people, small businesses, or small farms—and one of which (revitalization and stabili-zation) targets certain areas—lower-income census tracts. For a large institution, community develop-ment performance is a factor in the CRA sub-rating on each of the three activity-based tests (lending, investment, and service). In the case of the invest-ment test, the sub-rating depends entirely on the institution's record of making community develop-ment investments, whereas in the case of the lending and service tests, the sub-rating depends, respec-tively, on the institution's record of providing retail and community development loans and on its record of providing retail and community development services.
For a small institution, unlike for a large one, community development performance is not a man-
datory part of the evaluation. But a small institution may choose to be evaluated on its community devel-opment loans, investments, or services as a basis for possibly boosting the institution's rating from ''satis-factory'' to ''outstanding.''
THE AGENCIES' PROPOSALS TO AMEND THE CRA REGULATIONS
In 1995, when the four banking agencies adopted major amendments to the regulations that implement the CRA, they committed themselves to reviewing the amended regulations to assess the regulations' effectiveness in emphasizing performance over process, promoting consistency in evaluations, and eliminating unnecessary regulatory burden.
[footnote] 7. OCC, Board, FDIC, OTS (1995), ''Community Reinvestment Act Regulations," pp. 22156, 22178. [end of footnote.]
They began that review in July 2001 with the publication in the Federal Register of an advance notice of pro-posed rulemaking.
[footnote] 8. Office of the Comptroller of the Currency, Board of Governors of the Federal Reserve System, Federal Deposit Insurance Corpora-tion, Office of Thrift Supervision (2001), ''Community Reinvestment Act Regulations,'' advance notice of proposed rulemaking, Federal Register, vol. 66 (July 19), p. 37602. [end of footnote.]
Since early 2004, the agencies have issued several proposals.
Recent CRA Proposals
In February 2004, the banking agencies issued identi-cal proposals to amend their respective CRA regula-tions to increase the number of institutions classified as small.
[footnote] 9. Office of the Comptroller of the Currency, Board of Governors of the Federal Reserve System, Federal Deposit Insurance Corpora-tion, Office of Thrift Supervision (2004), ''Community Reinvestment Act Regulations,'' Federal Register, vol. 69 (Feb. 6), p. 5729. [end of footnote.]
Under the 1995 regulations, an institution is defined as small if it has less than $250 million in assets and is not a member of a holding company that has $1 billion or more in assets. Institutions not defined as small are classified as large.
[footnote] 10. To be considered large, an institution must fail to meet the criteria for a small institution as of December 31 of both of the previous two calendar years. [end of footnote.]
The four agencies proposed to expand the definition of ''small institution'' to cover those institutions with assets of up to $500 million and to eliminate the holding company criterion.
Commenters on that proposal were deeply split. Industry commenters, seeking to reduce their regu-latory burden, wanted to raise the large-institution threshold higher than was proposed (as high as $2 bil-lion). But community groups opposed any increase
in the threshold, asserting that an increase would lead institutions newly classified as small to reduce their investments in community development.
In July 2004, the OTS announced that it would raise the large-institution threshold for savings asso-ciations to $1 billion, the OCC announced that it would refrain from adopting the February proposal, and the Board stated that it would formally with-draw the proposal from consideration.
[footnote] 11. The OTS implemented its increase in a final rule published on August 18, 2004. See Office of Thrift Supervision (2004), ' 'Commu-nity Reinvestment Act Regulations,'' Federal Register, vol. 69 (Aug. 18), p. 51155. [end of footnote.]
The Board explained that raising the large-institution threshold to $500 million was not guaranteed to yield signifi-cant cost savings for institutions and that it might significantly reduce investments in community development in some rural communities.
[footnote] 12. See Board of Governors of the Federal Reserve System (2004), press release, July 16, www.federalreserve.gov/boarddocs/press/all/ 2004. [end of footnote.]
A month later, the FDIC issued a new proposal to raise the large-institution threshold to $1 billion for FDIC-supervised institutions and to continue to evaluate institutions with assets between $250 mil-lion and $1 billion on their community development records but on a modified basis.
[footnote] 13. Federal Deposit Insurance Corporation (2004), ' 'Commu-nity Reinvestment Act Regulations,'' Federal Register, vol. 69 (Aug. 20), p. 51611. [end of footnote.]
Again, commenters were divided over the proposal. Many industry com-menters opposed evaluating these institutions on their community development records; many community group commenters contended that the proposed evaluation was not rigorous.
Also in August 2004, the FDIC proposed that a bank activity that benefits an individual or a com-munity in a rural area be considered community development under the CRA, even if neither the individual nor the community is of lower income. Commenters also split on that proposal. Some expressed concern that the agency would give CRA recognition to bank investments in affluent rural areas. Some supported the proposal, how-ever, because they favored recognizing institu-tions' support of infrastructure, business develop-ment, and other needs in rural areas as community development.
In November 2004, the OTS, too, proposed to recognize as community development a bank activity that benefits an individual or a community in a rural area, even if neither the individual nor the commu-nity is of lower income.
[footnote] 14. Office of Thrift Supervision (2004), ''Community Reinvest-ment Act—Community Development, Assigned Ratings,'' Federal Register, vol. 69 (Nov. 24), p. 68257. [end of footnote.]

The Three-Agency Proposal of February 2005
In February 2005, the Board, the OCC, and the FDIC published for public comment a joint proposal, which again addressed the definitions of ''small institution'' and ''community development'' in rural areas. The proposal would modify the CRA regulations in three ways:
1. It would raise the asset threshold for a large insti-tution from $250 million to $1 billion and would eliminate the holding company criterion. Thus, all banking institutions with less than $1 billion in assets would be exempt from CRA data reporting obligations.
2. It would create a subcategory of small institutions called ''intermediate small institutions,'' those with assets between $250 million and $1 billion, and would subject such institutions to a two-part evaluation.
[footnote] 15. T h e p r o p o s a l w o u l d l e a v e u n c h a n g e d t h e c r i t e r i a f o r e v a l u a t i n g s m a l l i n s t i t u t ions ( those w i t h l ess t h a n $ 2 5 0 mi l l i on i n a s se t s ) ; as n o t e d earl ier , t h e s e c r i te r ia c o n c e n t r a t e on re ta i l l e n d i n g (see b o x ' ' T h e S m a l l - I n s t i t u t i o n E v a l u a t i o n ' ' ) . T h e p r o p o s a l w o u l d a l s o l e a v e u n c h a n g e d t h e c r i te r ia f o r e v a l u a t i n g l a r g e in s t i t u t ions ( those w i t h m o r e t h a n $ 1 b i l l i on in asse t s ) , w h i c h w o u l d c o n t i n u e t o b e s u b j e c t t o a t h r e e - p a r t e v a l u a t i o n ( see b o x ' ' T h e L a r g e - I n s t i t u t i o n E v a l u a t i o n ' ' ) . [end of footnote.]
• One part would evaluate the institution's retail lending. The evaluation would use the criteria now used for small institutions (those with less than $250 million in assets)—for example, the ratio of overall loan dollars to deposits and the distribution of loans across borrowers and areas of different relative incomes. Those criteria dif-fer little in substance from the criteria applied to the retail lending of large institutions, but the evaluation of small institutions' retail lending is, in practice, more streamlined because of their exemption from the requirement to collect or report data on loans and assessment areas.
• A second part, given equal weight in assign-ing an overall CRA rating, would evaluate an intermediate small institution's community development record. Instead of considering that record in three separate tests (as does the large-institution evaluation, which now applies to intermediate small institutions), the evaluation would gather into one test all community devel-opment activities, regardless of type, including lending, investing, and providing services.
3. It would revise the definition of ''community development'' in rural areas—for institutions of
any size. The definition in the 1995 regulations imposes a lower-income restriction on bank activi-ties that may be credited as community develop-ment in CRA evaluations: Such activities must primarily benefit either lower-income people or lower-income areas. The agencies proposed to relax that restriction in rural areas. • Under the proposal, bank activities would be
considered community development if they revitalized or stabilized any ''underserved rural area'' or provided affordable housing for any individual in any such area, even if the area was not defined as ''low or moderate income.'' The agencies sought comment on how to identify underserved rural areas not already classified as lower-income tracts. The agencies specifically sought comment on criteria adapted from the Community Development Financial Institutions Fund's definition of an ''investment area.'' The criteria, as adapted, would identify as under-served an area that has at least one of the following characteristics: (1) an unemployment rate of at least 1.5 times the national average, (2) a poverty rate of 20 percent or more, or (3) a population loss of 10 percent or more between the previous and most recent decennial cen-suses or a net migration loss of 5 percent or more over the five-year period preceding the most recent census.
• The agencies also sought comment on an alter-native proposal to liberalize the definition of a ''low or moderate income'' rural census tract in one of two ways, at least for the purpose of determining which area-based activities in rural areas are considered community devel-opment: (1) change the baseline for defining rural tract incomes from the nonmetropolitan state median income to the statewide median income, which is the higher of the two statistics in all but one state, or (2) raise the ''low or moderate income'' limit from its current level of 80 percent.
EFFECTS OF RAISING THE ASSET-SIZE THRESHOLD
As noted earlier, the 2005 proposal would raise the asset-size threshold for a large institution from $250 million to $1 billion and would eliminate the holding company criterion. Institutions with asset sizes below the $1 billion threshold would be subject to a streamlined CRA lending test equivalent to that now used for small institutions; they would also be

exempt from the evaluation of branching under the service test now applied to institutions with assets of more than $250 million.
[footnote] 16. Under the proposal, intermediate small institutions would not be subject to the large-institution service test. The service test evalu-ates, among other things, the geographic distribution of an institu-tion's branches and its record of opening and closing branches, as well as its record of providing community development services—that is, financial services targeted to lower-income people. Under the pro-posal, the branching of intermediate small institutions would no longer be evaluated although, under the proposed community develop-ment test, the community development services of such institutions would be. [end of footnote.]
The proposal would also create a new community development test for inter-mediate small institutions.
In the first part of this section, we analyze several issues related to this portion of the proposal.
[footnote] 17. For convenience, our research ignored the changes that the OTS made to its regulations and assumed that the OTS regulations are the 1995 regulations. [end of footnote.]
First, we identify and describe the institutions and banking markets that would be affected by raising the thresh-old to $1 billion and eliminating the holding com-pany criterion. Second, we examine the potential effect of using a streamlined version of the CRA lending test and eliminating the service (branching) test for institutions with asset sizes below the thresh-old. Specifically, we examine the effect of the current $250 million threshold on the retail lending and branching activities of institutions within a narrow range of the current threshold. Third, we consider whether the role of community development lending in CRA ratings has been significant.
Parties Affected by Raising the Threshold and Eliminating the Holding Company Criterion
Raising the threshold and eliminating the holding company criterion would affect both banking institu-tions and the communities they serve. Using 2003 as a test year, we looked at the characteristics of institu-tions that would have been subject to a different CRA evaluation process had the regulations proposed in February 2005 been in effect.
[footnote] 18. We used 2003 as a test year because at press time it was the latest year for which public data on retail lending activities related to the CRA were available. [end of footnote.]
We also identified the local banking markets that might have been most affected had the threshold been raised.
Banking Institutions
As of December 31, 2003, 9,095 banking institutions were subject to the CRA (table 1). We estimate that,
of those, 1,621 institutions that were considered large as of that date would be considered intermediate small or small under the agencies' 2005 CRA pro-posal (columns 1-3). These ''status-changing'' insti-tutions constituted 18 percent of all institutions sub-ject to the CRA, and they held 13 percent of the deposits held by all such institutions. Intermediate small institutions consisted of 1,264 institutions that had between $250 million and $1 billion in assets (column 2) and 116 institutions that had more than $1 billion in assets but which would not be consid-ered large under the proposal because of a proposed requirement to exceed the asset threshold for two consecutive years (column 3). The "newly small'' institutions consisted of the 241 institutions that had assets of less than $250 million but which nonethe-less were subject to the large-institution CRA exami-nation in 2003, generally because they were part of a bank holding company with assets of more than $1 billion (column 1).
[footnote] 19. Fourteen of the 241 institutions were not part of a multibank holding company. They had exceeded the asset-size threshold for the large-institution examination as of the beginning of 2003, but their assets had fallen below $250 million as of the end of the year. Under the 1995 regulations, these institutions had reverted to the small-institution examination as of the beginning of 2004. [end of footnote.]
These institutions would be considered small under the 2005 proposal.
[footnote] 20. Nearly 380 of the status-changing institutions, although cov-ered by the large-institution examination as of December 31, 2003, had last been evaluated under the CRA as small banking institutions (data shown under the ''small-institution'' subcategory); consequently, they had not yet been evaluated as ''large.'' [end of footnote.]
The 1,621 status-changing institutions differ from other CRA-covered institutions along a number of dimensions. First, 28 percent of the status-changing institutions had headquarters in nonmetropolitan areas, compared with 7 percent of institutions with assets exceeding $1 billion and 52 percent of small banking institutions. Of the status-changing institu-tions with headquarters in nonmetropolitan areas, 60 percent had headquarters in exurban counties (non-metropolitan counties adjacent to metropolitan areas) and 40 percent in remote counties (counties not adja-cent to metropolitan areas).
[footnote] 21. In classifying rural counties, the U.S. Department of Agricul-ture makes the distinction between exurban and remote, among others. [end of footnote.]
Second, 14 percent of the status-changing institutions had ''outstanding'' CRA performance ratings at their last examinations, compared with 37 percent of larger institutions and 11 percent of small institutions.

Table 1. B a n k i n g inst i tut ions covered by the C R A , g rouped by selected character is t ics and d is t r ibuted by asset size, as of D e c e m b e r 31, 2003 Number except as noted
Characteristic
Type of institution, by asset size (millions of dollars)
Large Institution[see footnote]1 Less than 250 [see footnote]2
Type of institution, by asset size (millions of dollars)
Large Institution[see footnote]1
250-1,000
Type of institution, by asset size (millions of dollars)
Large Institution[see footnote]1
More than 1,000
Recent [ see footnote]3
Type of institution, by asset size (millions of dollars)
Large Institution[see footnote]1 More Than 1,000
Nonrecent
Type of institution, by asset size (millions of dollars)
Small Institution[see footnote]1
Less than 150
Type of institution, by asset size (millions of dollars)
Small Institution[see footnote]1
150-250
Type of institution, by asset size (millions of dollars) Small Institution[see footnote]1
More than 250[see footnote]4
Total
Number
Total
Percent
M E M O : Share
of deposits (percent)
Location (headquarters) Urban (metropolitan area)
Center city 71 463 53 316 766 294 121 2,084 22.9 74.7 Location (headquarters) Urban (metropolitan area) Suburban 81 456 47 101 1,633 415 153 2,886 31.7 15.0 Location (headquarters) Rural [see footnote]5
Exurban 61 199 10 23 1,649 273 67 2,282 25.1 5.8 Location (headquarters) Rural Remote 28 144 5 8 1,417 182 41 1,825 20.1 3.7 Location (headquarters) U.S.-affiliated area[see footnote]6 0 2 1 9 6 0 0 18 .2 .8
Rating on most recent CRA exam Outstanding 34 164 26 168 573 165 50 1,180 13.0 54.3 Rating on most recent CRA exam Satisfactory 185 1,050 84 282 4,405 918 293 7,217 79.4 42.9 Rating on most recent CRA exam Needs to improve 0 7 1 0 27 0 1 36 .4 .1 Rating on most recent CRA exam Substantial noncompliance 0 0 0 1 3 0 0 4 .0 .0 Rating on most recent CRA exam None (no exam in 5 years) 22 43 5 6 463 81 38 658 7.2 2.7
Type of most recent CRA exam Large-institution 129 909 95 412 6 2 2 1,555 17.1 80.2 Type of most recent CRA exam Small-institution 79 291 9 3 4,973 1,075 339 6,769 74.4 12.8 Type of most recent CRA exam Other[see footnote]7 11 21 7 36 29 6 3 113 1.2 4.3 Type of most recent CRA exam None (no exam in 5 years) 22 43 5 6 463 81 38 658 7.2 2.7
Current regulator[see footnote]8
Board 20 162 14 62 497 124 46 925 10.2 17.4 Current regulator FDIC 136 639 57 163 3,413 627 222 5,257 57.8 24.4 Current regulator OCC 70 298 22 145 1,100 280 77 1,992 21.9 44.1 Current regulator OTS 15 165 23 87 461 133 37 921 10.1 14.2
All Number 241 1,264 116 457 5,471 1,164 382 9,095 100 100 All Percent 2.7 13.9 1.3 5.0 60.1 12.8 4.2
. . . 100 100
M E M O Median number of days between exams 1,703 963 927 1,035 1,734 1,734 1,657 1,645
. . . . . .
MEMO Share of deposits (percent) .5 9.6 2.9 75.6 6.0 3.6 1.9 . . .
100 100
NOTE. Here and in subsequent tables, ' 'CRA' ' means Community Reinvest-ment Act, and components may not sum to totals because of rounding.
[footnote] 1. Large institutions are banking institutions that reported 2003 data on small-business, small-farm, or community development lending as required of large institutions under the CRA. All other institutions are small institutions. [end of footnote.]
[footnote] 2. These institutions are generally part of multibank holding companies with assets of more than $1 billion and are currently covered by the large-institution CRA exam. [end of footnote.]
[footnote] 3. ' 'Recent ' ' institutions are banking institutions that had more than $1 bil-lion in assets as of December 31, 2003, but not in the two consecutive years before 2003. If the asset-size threshold had been raised to $1 billion as of year-end 2003, these institutions would not yet have qualified for the large-institution CRA exam. [end of footnote.]
[footnote] 4. These institutions had more than $250 million in assets as of Decem-ber 31, 2003, but failed to qualify for the large-institution CRA exam because they had not held this amount of assets for two consecutive years. [end of footnote.]
[footnote] 5. Exurban areas are counties adjacent to metropolitan areas; remote areas are counties not adjacent to metropolitan areas. [end of footnote.]
[footnote] 6. In this article, U.S.-affiliated areas consist of American Samoa, Guam, the Commonwealth of the Northern Mariana Islands, Puerto Rico, and the U.S. Virgin Islands. [end of footnote.]
[footnote] 7. ' 'Other' ' exams cover strategic-plan, wholesale, and limited-purpose institutions. A strategic-plan institution develops its own plan, subject to the approval of a supervising agency, for evaluating its CRA performance. A wholesale institution does not extend home mortgage, small-business, small-farm, or consumer loans to retail customers; a limited-purpose institution offers
a narrow product line, such as one composed of credit card or motor vehicle loans, to a regional or broader market. Exams for wholesale and limited-purpose institutions are limited to community development activities. [end of footnote.]
[footnote] 8. Current regulators are the Board of Governors of the Federal Reserve System (Board), the Federal Deposit Insurance Corporation (FDIC), the Office of the Comptroller of the Currency (OCC), and the Office of Thrift Supervision (OTS). [end of footnote.]
. . . Not applicable. SOURCES. Here and in subsequent tables, except as noted, analyses
incorporate data f rom one or more of the following sources: unemployment, Bureau of Labor Statistics (2002); assets and business loans (as of June 30, 2003; data adjusted through December 31, 2003, to reflect changes in bank-ing institution structure), Consolidated Reports of Condition and Income (Call Report), Federal Deposit Insurance Corporation (2003); branches and deposits (as of June 30, 2003; data adjusted through December 31, 2003, to reflect changes in banking institution structure), Summary of Deposits, Federal Deposit Insurance Corporation (2003); filings under the Home Mortgage Disclosure Act and the Community Reinvestment Act, Federal Financial Insti-tutions Examination Council (2003); metropolitan statistical areas, Office of Management and Budget (2004); census tracts, U.S. Census Bureau (2000); net migration, Estimated Components of Population Change, Population Estimates program, U.S. Census Bureau (2000); poverty, Small Area Income and Poverty Estimates program, U.S. Census Bureau (2002); rural area designations, Urban Influence Codes, Economic Research Service, U.S. Department of Agriculture (2003).
Local Banking Markets Another way to look at the effect of raising the threshold is in terms of local banking markets. There
is no universally accepted geographic definition of local banking markets, but the Federal Reserve Banks have constructed a list of local banking market defini-tions for reviews of the competitive effects of pro-posed mergers and acquisitions, and we used these
definitions in our analysis.
[footnote] 22. Local banking markets are not necessarily equivalent to CRA assessment areas. Unlike CRA assessment areas, local banking mar-kets are not drawn from the perspective of a particular institution. [end of footnote.]
Not all parts of the country have been defined for this purpose; however,

the 1,873 defined markets account for 96.7 percent of the branches and 97.7 percent of the deposits held by banking institutions nationwide (table 2). Seventy percent of banking markets are rural, but such mar-kets account for a relatively small proportion of bank-ing deposits nationwide (about one-eighth—data omitted from table) because most people and busi-nesses are located in metropolitan areas.
Table 2. Bank branches and deposits, grouped by location and distributed by market status of location, as of December 31, 2003
Item Urban Rural
Exurban
Rural
Remote
U.S.-affiliated
area Total
Branches Number
In defined markets . . 66,815 10,234 7,806 0 84,855 Branches Number
Not in defined markets 612 1,034 606 641 2,893
Branches Number Total 67,427 11,268 8,412 641 87,748
Branches Percent In defined markets 99.1 90.8 92.8 0 96.7
Branches Percent Not in defined markets
.9 9.2 7.2 100 3.3 Branches Percent Total 100 100 100 100 100
Share of deposits (percent) In defined markets 99.4 91.8 92.7 0 97.7 Share of deposits (percent)
Not in defined markets .6 8.2 7.3 100 2.3 Share of deposits
(percent) Total 100 100 100 100 100
M E M O Number of defined
markets 563 693 617 0 1,873 MEMO Share of deposits in
defined markets (percent) 88.7 6.9 4.4 0 100
MEMO Share of deposits not in defined markets (percent) 21.1 26.3 14.9 37.7 100
MEMO Average number of banking institution headquarters per defined market 19.1 7.0 6.3 0 10.4
NOTE. In this article, markets are those defined as local banking markets by the Federal Reserve Banks; these defined areas do not cover all parts of the country. For markets that span more than one type of area, location is deter-mined by the area with the largest percentage of market deposits. For defini-tions of ' 'exurban' ' and ' 'remote,' ' see table 1, note 5. For definition of ''U.S.-affiliated area,'' see table 1, note 6.
For the market analysis, we focused on markets in which status-changing institutions play a signifi-cant role. We used two methods to characterize the roles of status-changing institutions in their mar-kets: the percentage of a market's deposits held by status-changing institutions and the determination of whether a status-changing institution is the largest institution in the market.
The first method, the ''market-share method,'' clas-sifies markets by the percentage of each market's deposits held by status-changing institutions. This method assumes that an institution's propensity to invest in its market is directly related to its share of the market's deposits. (Here, we use the word ''invest'' in its broadest sense to include extensions of credit, services, grants, and equity investments.) The method further assumes that all institutions that shift from a large-institution examination to a small-institution examination experience the same propor-tional change in their propensity to invest in the market. These assumptions imply that the markets with the greatest presence (as measured by share of market deposits) of status-changing institutions will experience the largest proportional changes in bank-ing institutions' lending and investing in the market.
The second method of market analysis, the ''largest-institution method,'' classifies markets by the size of the largest institution with a presence (office) in the market regardless of the market share of that institution. This method assumes that if raising the threshold has an effect, the effect is particularly large in those markets that go from having one or more institutions that are subject to the three-part large-institution examination to having no such institutions. As noted earlier, the market-share method identifies the share of market deposits held by status-changing institutions (table 3).
Table 3. Banking markets grouped by location and distributed by share of market deposits held by institutions that would shift from large-institution to small-institution CRA examinations under the agencies' 2005 proposal, as of December 31, 2003 Percent except as noted
Location of market1
Share of market deposits affected (percent) 0 Share of market deposits affected (percent)
1 -10
Share of market deposits affected (percent)
11 - 2 0
Share of market deposits affected (percent)
21 - 5 0
Share of market deposits affected (percent) 51-100
Total
Urban Number 88 145 123 173 34 563 Urban Percent 15.6 25.8 21.9 30.7 6.0 100 Urban Percent weighted by market deposits .7 60.8 26.3 11.1 1.1 100
Rural Exurban
Number 215 100 95 196 87 693 Rural Exurban Percent 31.0 14.4 13.7 28.3 12.6 100 Rural Exurban Percent weighted by market deposits 16.9 28.9 14.1 28.5 11.5 100 Rural Remote
Number 218 61 88 185 65 617 Rural Remote Percent 35.3 9.9 14.3 30.0 10.5 100 Rural Remote Percent weighted by market deposits 17.7 15.7 17.3 39.6 9.8 100
All Number 521 306 306 554 186 1,873 All Percent 27.8 16.3 16.3 29.6 9.9 100 All Percent weighted by market deposits 2.6 56.6 25.0 13.6 2.2 100
NOTE. See note to table 2. [footnote] 1. The weighting factor for the weighted percentages is the amount of depos-its in the market location as a share of total deposits. [end of footnote.]

As of December 31, 2003, 28 percent of the nation's 1,873 banking markets (with 3 percent of nationwide deposits) had no status-changing institution located within the market (column 1). Under either the market-share or the largest-institution method, those mar-kets would presumably be unaffected by raising the threshold to $1 billion. In another one-third of markets (with 82 percent of nationwide deposits), status-changing institutions held less than 20 per-cent of deposits and thus, under the market-share method, would likely not see major effects (col-umns 2 and 3). But in roughly 10 percent of mar-kets (with 2 percent of nationwide deposits),
status-changing institutions held more than 50 per-cent of market deposits and, consequently, those mar-kets have the potential to be most affected (col-umn 5).
Table 4. Banking markets, grouped by location and distributed by change in CRA reporting status of largest banking institution with an office in the market, as of December 31, 2003 Percent except as noted
Location of market Remains small
Large changes
to small
Remains large Total
Urban Number 25 19 519 563 Urban Percent 4.4 3.4 92.2 100 Urban Percent weighted
by market deposits .1 .1 99.9 100
Rural Exurban
Number 51 50 592 693 Rural Exurban Percent 7.4 7.2 85.4 100 Rural Exurban Percent weighted
by market deposits 2.2 3.0 94.8 100 Rural Remote
Number 98 89 430 617 Rural Remote Percent 15.9 14.4 69.7 100 Rural Remote Percent weighted
by market deposits 4.3 7.5 88.2 100
All Number 174 158 1,541 1,873
All Percent 9.3 8.4 82.3 100 All Percent weighted
by market deposits .4 .6 99.0 100
NOTE. See notes to table 3.
Table 5. Characteristics of counties in markets considered potentially most affected by an increase in the large-institution threshold to $1 billion, by method of market analysis Percent except as noted
Characteristic
Method of market analysis and location of market [ s e e f o o t n o t e ] 1
Market-share
Urban
Method of market analysis and location of market[see footnote]1
Market-share
Rural
Method of market analysis and location of market[see footnote]1
Largest-institution
Urban
Method of market analysis and location of market[see footnote]1
Largest Institution
Rural
National average for rural counties
Demographic Poverty rate, 2002 12.6 14.0 12.5 16.0 15.0 Demographic Income per capita, 2001 (dollars) 24,304 25,481 21,827 21,040 21,908 Demographic Real income growth rate
1996-2001 6.8 7.0 6.2 5.7 1.7 Demographic Real income growth rate 1981-2001 33.3 33.0 30.0 26.9 28.1
Demographic Unemployment rate, 2001 5.2 5.4 5.4 5.4 5.7 Demographic Population growth rate
1996-2001 5.8 2.8 4.6 -.1 1.7 Demographic Population growth rate 1981-2001 22.6 22.5 13.5 .1 10.5
Demographic Net migration rate, 1995-99 [see footnote]2 2.4 1.6 4.5 .7 1.2
Banking Branches per 10,000 persons
Number, 2003 4.0 5.0 4.6 6.2 5.4 Banking Branches per 10,000 persons Change, 1998-2003 -.3 -.2 - .3 .0 - .1 Banking Deposits
Per capita (thousands of dollars), 2003 12.8 14.5 10.9 15.2 14.0 Banking Deposits Change, 1998-2003 -.1 -.2 - .1 .0 - .1
MEMO: Counties (data as of 2000) Number 56 199 14 160 2,051 3
MEMO: Counties (data as of 2000) Percent with no lower-income tracts 21.4 48.2 50.0 55.0 48.23
MEMO: Counties (data as of 2000) Percent with only lower-income tracts .0 3.0 7.1 7.5 5.53
[footnote] 1. For markets that span more than one type of area, location is deter-mined by the area with the largest percentage of market deposits. Hence, rural counties may be located in urban markets. When market boundaries do not correspond to county boundaries, the county is assigned to the market with the largest share of deposits. Under the market-share method, potentially most-affected markets are markets in which status-changing institutions (those with assets between $250 million and $1 billion) held more than 50 percent of market
deposits. Under the large-institution method, potentially most-affected mar-kets are markets in which the largest institution with an office in the market was a status-changing institution (one with assets between $250 million and $1 billion). [end of footnote.]
[footnote] 2. Net migration rate is calculated as the difference in migration between 1999 and 1995 relative to the estimated population in 1997. [end of footnote.] [footnote] 3. U.S. total. [end of footnote.]

1. Banking markets analyzed by the market-share method: Share of deposits held by status-changing institutions, as of December 31, 2003
[Map of the United States, with blue marking the areas with at least 50 percent (potentially most-affected markets) and the rest of the space marked in white, representing less than 50 percent. Most of the map is white, with a few blue patches in Washington state, Idaho, California, Utah, Montana, Wyoming, Colorado, New Mexico, North Dakota, South Dakota, Nebraska, Kansas, Oklahoma, Texas, Minnesota, Iowa, Missouri, Arkansas, Louisiana, Wisconsin, Illinois, Indiana, Kentucky, Tennessee, Mississippi, Alabama, Florida, Georgia, South Carolina, North Carolina, Virginia, Delaware, New York, Pennsylvania, Connecticut, Massachusetts, Vermont, New Hampshire, and Maine. Maine had the largest amount of blue, and it along with New Hampshire and Massachusetts all had almost half the state in blue.]
NOTE. See table 5, note 1.

2. Banking markets analyzed by the largest-institution method: Current status of largest institution and the effect on reporting status of raising the asset-size threshold, as of December 31, 2003
[Map of the United States, with white marking small-stays small, blue marking large-changes to small (potentially most-affected markets) and black marking large-stays large. Alaska is about 2/3 black and 1/3 white, Hawaii is all black. The rest of the map is all black, with a few blue and white patches in Washington State, California, Montana, Utah, Colorado, New Mexico, North Dakota, South Dakota, Nebraska, Minnesota, Iowa, Montana, Arkansas, Louisiana, Mississippi, Alabama, Georgia, South Carolina, Tennessee, Kentucky, Virginia, Indiana. There are particularly large groupings of the white and blue in Kansas, Oklahoma, and Texas. There are only white patches in West Virginia, Nevada, Idaho, and Michigan. There are blue patches only in Wyoming, Ohio, North Carolina, and Florida.]
NOTE. See table 5, note 1.
The largest-institution method yields a different group of potentially most affected markets (table 4). The largest institution was a status-changing institu-tion in about 8 percent of all markets (with less than 1 percent of nationwide deposits) (column 2).
Although there is little overlap between the groups of potentially most affected markets defined by the two methods, the groups have several characteristics in common (table 5). In both groups, the markets are overwhelmingly rural, are served by few banking institutions (data omitted from table), have unem-ployment rates near the national rural average, and have bank branches per capita similar to the national rural average. Yet the groups of markets differ in key respects. Whereas population growth is much higher than the national rural average in the potentially most affected markets identified by the market-share method, it is notably lower than the national rural average in such markets identified by the largest-institution method. Moreover, under the market-share method, the potentially most affected markets are scattered throughout the country (figure 1), but under the largest-institution method, such markets are con-centrated substantially in the Great Plains region, with much smaller concentrations in Iowa, Louisiana, Kentucky-Tennessee, and southern Georgia-northern Florida (figure 2).
[footnote] 23. The figures use counties, which approximate, rather than precisely match, banking markets. [end of footnote.]
Results of Threshold Tests
The 2005 proposal would subject intermediate small banking institutions to the streamlined lending test currently applied to smaller institutions and would eliminate the service (branching) test for intermediate small institutions. Testing directly to determine how those changes would affect activities of intermedi-ate small institutions is impossible. However, an inference might be drawn from the effect of the current $250 million threshold on the retail lending and branching activities of institutions with assets near this threshold. Of particular interest are the retail lending activities covered by both the large-institution and the streamlined lending tests. Our tests compare the retail lending and branching of institu-tions just above and just below the current large-institution threshold of $250 million (table 6). Institu-
tions ''just below'' the threshold are defined here as those that had between $150 million and $250 mil-lion in assets as of December 31, 2003, and were deemed small as of that date and for the purposes of their most recent CRA performance evaluation (group 1); institutions ''just above'' the threshold are defined as those that had between $250 million and $350 million in assets and were deemed large as of that date and for the purposes of their most recent examination (group 2).
Banking institutions in these two groups were restricted to institutions that were independent of multibank holding companies, that had a CRA exam-ination completed between January 1, 1999, and June 30, 2004, and that received a ''satisfactory" CRA performance rating on their most recent exami-nation in that period. Institutions with ''outstanding'' ratings were excluded to control for the possibility that such institutions were influenced less by the nature of their CRA examinations and more by other factors, such as institution philosophy, than were institutions with ''satisfactory" ratings. Institutions with less than ''satisfactory" ratings were excluded for similar reasons. Institutions with headquarters in U.S.-affiliated areas were also excluded.
The threshold test relies on sources of data that provide the same types of information for institutions just above the threshold as for institutions just below. The information consists of five balance sheet ratios constructed from dollar values provided in Call Report data supplied to federal banking agencies.24
[footnote] 24. ''Call Report'' is the informal name for the Report of Condition and Income, which commercial banking institutions must file each quarter with federal and state banking agencies. It is essentially equivalent to the Thrift Financial Report, which savings institutions must file each quarter with the Office of Thrift Supervision. [end of footnote.]
The ratios compose two categories: loan dollars to deposits (overall; consumer; and business, including small commercial and industrial [C&I], small com-mercial real estate [CRE], and small farm) and mort-gage dollars to deposits (one- to four-family and multifamily).
In addition, five measures of retail lending to lower-income populations were constructed from fil-ings pursuant to HMDA: the percentage of an institu-tion's home-purchase and home-improvement loans extended to lower-income borrowers or census tracts and a comparable calculation for loans extended for multifamily housing in lower-income census tracts. Each of the HMDA-based measures was expressed as the difference between the percentage of the insti-tution's retail loans made to lower-income borrowers (or borrowers that live in lower-income tracts) and the percentage of the families that live in the areas

served by the institution who have lower incomes (or live in lower-income tracts). Because of limitations on reporting requirements for rural institutions under HMDA, the comparisons that use the HMDA-based lower-income lending measures were restricted to retail lending activities in urban areas.
Table 6. Lending and branching activities of banking institutions with asset sizes close to the current large-institution threshold for CRA exams, as of December 31, 2003 Percent except as noted
Item
Asset size (millions of dollars) 150-250
( Group 1) Asset size
(millions of dollars)
250-350 (Group 2)
Asset size (millions of dollars)
350-450 (Group 3)
Asset size (millions of dollars) Less than 250 [see footnote]2
(Group 4) MEMO:
Crossed threshold after end of 2001[see footnote]1
2001
MEMO: Crossed threshold after end of 2001[see footnote]1
2003
Ratio of loan dollars to deposits, by type of loan All 78.6 [see footnotes]a,capital B 83.7 c 78.5 88.5 85.3 85.4 Ratio of loan dollars to deposits, by type of loan Consumer 5.6 [see footnotes]a,capital B 7.0 c 5.0 8.6 6.4 [see footnote]d 5.1 Ratio of loan dollars to deposits, by type of loan Business [see footnote]3
Commercial and industrial Overall 11.2 9.9 10.3 12.3 11.4 10.7
Ratio of loan dollars to deposits, by type of loan Business [see footnote]3 Commercial and industrial Small 9.3 [see footnote]a 7.5 7.5 9.7 9.3 8.0 Ratio of loan dollars to deposits, by type of loan Business [see footnote]3 Commercial real estate
Overall 19.0 20.9 19.8 20.4 17.9[see footnote]d 20.9 Ratio of loan dollars to deposits, by type of loan Business [see footnote]3 Commercial real estate Small 13.9 13.1 11.8 13.2 12.8 13.5
Ratio of loan dollars to deposits, by type of loan Business [see footnote]3 Farm [see footnote]4
Overall 5.5[see footnote]a 3.3 3.8 6.0 6.9 6.4 Ratio of loan dollars to deposits, by type of loan Business [see footnote]3 Farm [see footnote]4 Small 6.6[see footnote]a 4.1 5.9 5.6 8.4 7.3
Ratio of mortgage dollars to deposits, by type of mortgage 1 - 4 family 27.0 [see f o o t n o t e s ] a , b 29.9 27.6 31.8 33.0 29.9 Ratio of mortgage dollars to deposits, by type of mortgage Multifamily 2.2 2.6 2.5 2.2 4.0 4.7
Loans to lower-income borrowers (percentage points) [see footnote]5
Home-purchase - 3 . 7 - 3 . 3 - 3 . 2 - 4 . 5
. . . . . .
Loans to lower-income borrowers (percentage points) [see footnote]5 Home-improvement 10.0 10.8 7.6 4.6 . . . . . .
Loans in lower-income areas[see footnote]5
Home-purchase - 7 . 8 - 1 0 . 6 - 4 . 8 -14 .2
. . . . . .
Loans in lower-income areas[see footnote]5 Home-improvement - 4 . 5 - 7 . 5 - 6 . 9 - . 7 . . . . . .
Loans in lower-income areas[see footnote]5 Multifamily 1.6 7.3 8.1 - . 6 . . . . . .
Branching activity [see footnote]6
Branches per $100 million of deposits (number) 2.9 2.7 2.7 3.0 3.1 2.9 Branching activity [see footnote]6 Branches in lower-income areas (percentage points) - 1 . 7 1.0 - 3 . 5 - 1 . 8
. . . . . . Branching activity [see footnote]6 Branches in lower-income areas (percentage points) 5-year change in such branches .0 - 1 . 0 - 2 . 0 - 1 . 5
. . . . . .
Number of institutions 646 72 142 49 100 100
NOTE. Data are group means adjusted for state, institution (savings associa-tion or commercial bank), location (center city, suburban, exurban, or remote), and charter effects. Analysis is restricted to institutions that were examined in the past five years, that were in existence for at least one year, and that received a ' 'satisfactory' ' rating on the small- or large-institution exam. Data exclude institutions with headquarters in U.S.-affiliated areas and strategic-plan, wholesale, and limited-purpose institutions (see table 1, note 7).
[footnote] 1. Data are for the 100 banking institutions that were subject to the small-institution evaluation in 2001 but were subject to the large-institution evalua-tion in 2002 and 2003. Differences are omitted for retail loans extended to lower-income borrowers, retail loans extended in lower-income areas, and some categories of branching activity because the lower-income classifications of 2001 were based on the 1990 census, whereas those of 2003 were based on the 2000 census. [end of footnote.]
[footnote] 2. These institutions are part of multibank holding companies with assets of more than $1 billion and are currently covered by the large-institution CRA exam. [end of footnote.]
[footnote] 3. Business loan ratios are calculated as of June 30, 2001, or June 30, 2003, for comparability with small-loan data. Data have been adjusted through December 2001 or December 2003 to reflect changes in banking institution structure. [end of footnote.]
[footnote] 4. Farm lending is measured only for rural commercial banks. Small farm contains some loans not in overall farm. [end of footnote.]
[footnote] 5. Data cover only urban tracts and institutions that report data under the Home Mortgage Disclosure Act. Data are the difference between the average percentage of lending to borrowers in lower-income census tracts and the aver-age percentage of families that live in lower-income census tracts in the areas that the institutions serve. [end of footnote.]
[footnote] 6. Branch data are measured as of June 30, 1998; June 30, 2001; or June 30, 2003. Data have been adjusted through December 1998, December 2001, or December 2003 to reflect changes in banking institution structure. Data on lower-income areas are the difference between the percentage of branches in lower-income census tracts and the percentage of families that live in lower-income census tracts in the areas that the institutions serve. [end of footnote.]
[footnote] a. Difference between group 1 and group 2 is statistically significant at the 10 percent level. [end of footnote.]
[footnote] b. Difference between group 1 and group 4 is statistically significant at the 10 percent level. [end of footnote.]
[footnote] uppoercase B. Difference between group 1 and group 4 is statistically significant at the 1 percent level. [end of footnote.]
[footnote] c. Difference between group 2 and group 3 is statistically significant at the 10 percent level. [end of footnote.]
[footnote] d. Difference between ratio in 2001 and that in 2003 is statistically significant at the 10 percent level. [end of footnote.]
. . . Not applicable.
We present means of these metrics for the groups above and below the threshold, adjusted to remove effects related to state, institution type (savings association or commercial bank), and headquarters
location (center city, suburban, exurban, remote) as rough controls for economic and demographic fac-tors.
[footnote] 25. Every institution in the analysis had at least one comparable institution on the other side of the threshold in the same state, of the same institution type, and in the same area type. [end of footnote.]
The results are of three types. First, overall C&I lending, CRE lending (overall or small), multi-family housing, and the HMDA data measures show no statistically significant differences. Second, the

other business loan categories do show differences that are statistically significant; however, the direc-tion of the differences is the opposite of what would have been expected had the differences been caused by tougher evaluation criteria in the large-institution evaluation.
Third, statistically significant differences exist in the groups' ratios of overall loan dollars to deposits, consumer loan dollars to deposits, and one- to four-family mortgage dollars to deposits, and these differ-ences go in the direction that might suggest a thresh-old effect. To confirm that this result reflects differ-ences in CRA evaluation criteria and not merely in asset size, we conducted an additional comparison test. We constructed a third group of banking insti-tutions that had between $350 million and $450 mil-lion in assets and that otherwise met the same require-ments as the institutions in group 2 (group 3). A comparison of adjusted means for group 3 with those for group 2 isolates the effects of size differences because banking institutions in both groups are sub-ject to the same type of CRA evaluation. Institutions in group 3 have lower ratios of overall loan dollars to deposits, consumer loan dollars to deposits, and one- to four-family mortgage dollars to deposits than have institutions in group 2 (and, in two out of three cases, lower than those of group 1 institutions), an indication that the difference between groups 1 and 2 may be caused by a factor other than the difference in CRA examination types.
We also compared adjusted means for groups 1 and 2 (and for groups 2 and 3) on three measures of branching activity: (1) the number of branches per $100 million of deposits, (2) the difference between the percentage of branches in lower-income census tracts and the percentage of the population that lives in lower-income census tracts in the areas that the institutions serve, and (3) the five-year change in the percentage of branches in lower-income areas. None of the three measures shows a significant difference among any of the groups.
As a further test for the effects of differences in CRA evaluation types, we compared independent institutions that had between $150 million and $250 million in assets (group 1) with similarly sized institutions that were subject to the large-institution evaluation criteria because of their affiliation with holding companies with assets of $1 billion or more (group 4). The ratios of overall loan dollars to depos-its, consumer loan dollars to deposits, and one- to four-family mortgage dollars to deposits are the only measures with a statistically significant difference: Group 4 has higher ratios than does group 1. One should interpret these results cautiously, as they may
mean only that banking institutions in holding com-panies are more likely than independent banking institutions to raise funds through wholesale, non-deposit markets and to be institutions focused on retail lending.
A final test for the effects of differences in CRA evaluation types examined whether banking institu-tions that passed the $250 million threshold mea-surably changed their retail lending and branching activities. Specifically, one hundred institutions cov-ered by the large-institution CRA evaluation (though not necessarily yet evaluated as large institutions) at the end of 2002 and at the end of 2003 had been subject to the small-institution evaluation in 2001. This test, unlike the other tests, looked for any change in an individual institution's behavior induced by a change in evaluation type. We restricted the compari-son to institutions covered by the large-institution examination for both 2002 and 2003 to ensure that ample time had elapsed for behavioral changes to result in measurable changes in balance sheet vari-ables. We found only two statistically significant changes in retail lending or branching behavior as an institution passed through the $250 million threshold (compare columns 5 and 6), but the changes were in opposite directions: Consumer lending fell, and over-all CRE lending rose.
[footnote] 26. We refrained from conducting the comparison for any of the measures that use lower-income classifications because 2001 classifi-cations were based on the 1990 census and 2003 classifications were based on the 2000 census. The change in classifications makes a comparison of lower-income activity in 2001 with lower-income activity in 2003 problematic. [end of footnote.]
Taken together, the threshold tests provide little evidence that the nature of the CRA examination influences the retail lending and branching activities of banking institutions in the size range near the $250 million threshold. However, the threshold tests have an important limitation. The tests are limited to inferences about the behavior of institutions around the margin of the current threshold, $250 million. They suggest that raising the threshold some amount above $250 million would not have a significant effect on retail lending or branching. However, they fail to reveal what amount of increase in the thresh-old, if any, would result in a significant effect.
The Role of Community Development Lending
The 1995 regulations require that, for a large institu-tion, community development lending be evaluated as only one component of the CRA lending test, which includes a wide range of other, retail types of

lending (see box ''The Large-Institution Evalua-tion" ). Under the 2005 proposal, intermediate small institutions would be subject to a new community development test. Instead of considering community development loans, investments, and services in three separate tests, the proposal is for the three types of activity to be considered in a single test. The proposal responds in part to the argument that com-munity development lending is more like community development investments—both are primarily for the benefit of lower-income people or areas—than like retail lending. It also responds to the argument that evaluating community development investments separately from retail lending places too much emphasis on investment vehicles, especially for smaller institutions that have limited experience with and opportunities for investments and substantially more experience with and opportunities for retail lending.
We could not test for the effects of adopting a community development test on community develop-ment loans, investments, or services. We could, how-ever, consider whether the number or dollar amount of community development loans have played a significant role in CRA ratings. Our sample was restricted to institutions examined under the large-institution examination between January 1, 2001, and December 31, 2003. We looked at the institutions' community development lending records over the same period (table 7). The data suggest that an insti-tution' s community development lending record is largely unrelated to its overall CRA rating. The lack of relationship is most apparent among institutions with assets of more than $5 billion: Nearly one-half
of the institutions with ''outstanding" ratings had community development lending activity in the bot-tom half of their asset-size group. Among intermedi-ate small institutions, those with ''outstanding" rat-ings were a little more likely than their counterparts with ''satisfactory" ratings to do community develop-ment lending. However, fully one-fourth of the insti-tutions rated ''outstanding'' in this category did no community development lending, and about 40 per-cent had community development lending activity in the bottom half of their asset-size group.
Table 7. Rating on most recent CRA exam and community development lending during 2001-03 at large institutions, by rating and asset size of institution, as of December 31, 2003 Percent except as noted
Number of institutions and status of community
development lending, by CRA rating
Asset size of institution (millions of dollars)
2 5 0 -500
Asset size of institution (millions of dollars)
500 -1,000
Asset size of institution (millions of dollars)
1,000-5,000
Asset size of institution (millions of dollars)
More than
5,000
Outstanding Number of institutions 23 50 92 65 Outstanding Made no loans 26.1 22.0 8.7 6.2 Outstanding Ranked in bottom half of asset-size class 39.1 44.0 38.0 46.2
Satisfactory Number of institutions 241 316 254 69 Satisfactory Made no loans 29.9 19.0 11.0 5.8 Satisfactory Ranked in bottom half of asset-size class 51.0 51.0 54.3 53.6
NOTE. Analysis is restricted to institutions that were subject to the large-institution CRA exam each year f rom 2001 through 2003, that were in exist-ence for at least one year, that received an ' 'outstanding' ' or ' 'satisfactory' ' rat-ing on the exam, and that had assets of more than $250 million in 2003. Data exclude strategic-plan, wholesale, or limited-purpose institutions (see table 1, note 7) and institutions with headquarters in U.S.-affiliated areas.
Although the data provide no information about how community development lending should be treated in CRA evaluations, they do suggest that such lending is not currently critical in overall CRA rat-ings. The likely explanation is that, because examin-ers consider community development loans as part of a comprehensive lending test, other types of lend-ing may have compensated for an institution's lack of community development loans. Another possi-bility is that, despite the mandate of the regulations to treat community development loans and commu-nity development investments separately, examiners implicitly treat them as substitutes.
[footnote] 27. Some empirical support exists for the substitutability explana-tion. We examined the CRA performance evaluation reports (PEs) for the twenty-three institutions in our sample that had assets between $250 million and $500 million and that received ''outstanding'' CRA ratings (column 1, row 1, of table 7). There is a mild negative correlation (-.2) between the dollar volume of community develop-ment lending and the investments reported in the PEs. However, some evidence also suggests that the substitutability explanation applies only to smaller institutions. An examination of the dollar volume of community development lending and the investments reported in the PEs of the fifty institutions in our sample that had assets between $500 million and $1 billion and that received ''outstanding'' CRA ratings (column 2, row 1) shows a significant positive correlation of .5. [end of footnote.]
COMMUNITY DEVELOPMENT AND RURAL AREAS
Another part of the agencies' 2005 proposal would expand the definition of ''community development'' in rural, though not urban, areas. This part of the proposal would cover banking institutions of all sizes, not just intermediate small institutions.
The Problem and the Agencies' Proposed Solution
The regulations' current definition of ''community development'' is identical for urban and rural areas. As noted earlier, the definition covers four categories of activity, three of which (affordable housing, com-

munity services, and economic development) are defined in terms of the activity' s targeting of certain recipients (lower-income people, small businesses, or small farms) and the fourth of which (revitalization and stabilization) is defined in terms of the activity' s targeting of certain areas—namely, lower-income census tracts.
Some have said that the lower-income-area limita-tion in the fourth category, revitalization and stabili-zation, may unduly constrain the effectiveness of the regulations in promoting community development activities in rural areas. In response to such concerns, the agencies proposed to expand the definition of ''community development'' to include revitalizing or
stabilizing activities in underserved rural areas. No such change was proposed for urban areas.
Table 8. Distribution of census tracts, population, and families, by location of tract and tract income relative to wider area, as of December 31, 2003 Percent except as noted
Census tract location and percent of median family income in area [see footnote]1
Census tracts
Number
Census tracts
Percent Popu-lation Families
Memo: Families
with incomes
less than
80 percent of MSA
or non-MSA median [see footnote]2
Urban Center city tracts
Income relative to M S A
Less than 50 3,437 13.1 10.0 8.7 78.2 Urban Center city tracts
Income relative to MSA 5 0 - 7 9
8,004 30.5 29.7 27.7 60.5 Urban Center city tracts
Income relative to MSA 80-90
2,622 10.0 10.4 10.3 45.8 Urban Center city tracts
Income relative to MSA 90 -100
2,503 9.5 10.0 10.2 39.4 Urban Center city tracts
Income relative to MSA 100-119
3,898 14.8 16.3 17.4 31.6 Urban Center city tracts
Income relative to MSA 120 or more
5,814 22.1 23.6 25.7 19.0 Urban Center city tracts
Income relative to MSA Total
26,278 100 100 100 42.7 Urban Center city tracts Income relative to
state Less than 80
10,938 41.6 37.8 34.8 64.8 Urban Center city tracts Income relative to
state 80 -99
4,851 18.5 19.2 19.3 42.9 Urban Center city tracts Income relative to
state 100-119
3,900 14.8 15.9 16.7 31.8 Urban Center city tracts Income relative to
state 120 or more
6,589 25.1 27.0 29.2 18.0 Urban Center city tracts Income relative to
state Total
26,278 100 100 100 41.4 Urban Suburban tracts
Income relative to M S A
Less than 50 444 1.7 1.2 1.0 76.9 Urban Suburban tracts Income relative to
M S A 5 0 - 7 9 4,456 16.9 15.9 14.6 57.9
Urban Suburban tracts Income relative to
MSA80-90 3,384 12.9 12.5 12.3 45.6
Urban Suburban tracts Income relative to
MSA90-100 4,069 15.5 15.5 15.5 38.9
Urban Suburban tracts Income relative to
MSA100-119 6,563 25.0 25.6 26.2 30.7
Urban Suburban tracts Income relative to
MSA120 or more 7,382 28.1 29.2 30.4 18.5
Urban Suburban tracts Income relative to
MSATotal 26,298 100 100 100 34.5
Urban Suburban tracts Income relative to state
Less than 80 4,592 17.5 15.9 14.4 59.7 Urban Suburban tracts Income relative to state 80 -99 6,333 24.1 23.5 23.3 42.2 Urban Suburban tracts Income relative to state 100-119 6,100 23.2 23.8 24.1 30.8 Urban Suburban tracts Income relative to state 120 or more 9,273 35.3 36.8 38.2 17.6 Urban Suburban tracts Income relative to state Total 26,298 100 100 100 32.6
Rural Exurban tracts
Income relative to non -MSA
Less than 50 57 .7 .5 .4 72.9 Rural Exurban tracts
Income relative to non-MSA 5 0 - 7 9
912 11.9 10.5 9.8 55.1 Rural Exurban tracts
Income relative to non-MSA 80-90
1,157 15.1 14.4 14.1 45.8 Rural Exurban tracts
Income relative to non-MSA 90 -100
1,780 23.2 22.7 22.8 39.8 Rural Exurban tracts
Income relative to non-MSA 100-119
2,720 35.5 36.9 37.4 32.6 Rural Exurban tracts
Income relative to non-MSA 120 or more
1,035 13.5 15.0 15.5 23.7 Rural Exurban tracts
Income relative to non-MSA Total
7,661 100 100 100 37.1 Rural Exurban tracts Income relative to
state Less than 80
3,051 39.8 37.5 36.3 57.4 Rural Exurban tracts Income relative to
state 80 -99
3,394 44.3 45.0 45.7 43.4 Rural Exurban tracts Income relative to
state 100-119
1,006 13.1 14.5 14.9 33.0 Rural Exurban tracts Income relative to
state 120 or more
210 2.7 3.0 3.1 22.9 Rural Exurban tracts Income relative to
state Total
7,661 100 100 100 46.3 Rural Remote tracts
Income relative to non -MSA
Less than 50 39 .8 .6 .4 72.0 Rural Remote tracts
Income relative to non-MSA 5 0 - 7 9
794 17.1 15.0 14.4 55.8 Rural Remote tracts
Income relative to non-MSA 80-90
927 19.9 18.7 18.7 46.1 Rural Remote tracts
Income relative to non-MSA 90 -100
1,136 24.4 23.4 23.8 39.9 Rural Remote tracts
Income relative to non-MSA 100-119
1,285 27.6 29.6 30.0 32.9 Rural Remote tracts
Income relative to non-MSA 120 or more
469 10.1 12.7 12.8 23.3 Rural Remote tracts
Income relative to non-MSA Total
4,650 100 100 100 39.3 Rural Remote tracts Income relative to
state Less than 80 2,240 48.2 44.6 43.9 58.6
Rural Remote tracts Income relative to state 80 -99 1,764 37.9 38.4 38.9 43.7 Rural Remote tracts Income relative to state 100-119 487 10.5 12.5 12.6 33.1 Rural Remote tracts Income relative to state 120 or more 159 3.4 4.6 4.5 23.5 Rural Remote tracts Income relative to state Total 4,650 100 100 100 48.0
Table 8.—Continued
Percent except as noted
Census tract location and percent of median family income in area[see footnote]1
Census tracts
Number
Census tracts
Percent Popu-lation Families
Memo: Families
with incomes
less than
80 percent of MSA
or non-MSA median[see footnote]2
Total urban Income relative to M S A
Less than 50 3,881 7.4 5.4 4 .4 78.0 Total urban Income relative to MSA 5 0 - 7 9
12,460 23.7 22.4 20.4 59.5 Total urban Income relative to MSA 80-90
6,006 11.4 11.5 11.4 45.7 Total urban Income relative to MSA 90 -100
6,572 12.5 12.9 13.1 39.1 Total urban Income relative to MSA 100-119
10,461 19.9 21.3 22.3 31.0 Total urban Income relative to MSA 120 or more
13,196 25.1 26.6 28.3 18.7 Total urban Income relative to MSA Total
52,576 100 100 100 38.2 Total urban Income relative to
state Less than 80 15,530 29.5 26.2 23.5 63.1
Total urban Income relative to state 80 -99 11,184 21.3 21.5 21.5 42.5 Total urban Income relative to state 100-119 10,000 19.0 20.1 20.8 31.2 Total urban Income relative to state 120 or more 15,862 30.2 32.2 34.2 17.7 Total urban Income relative to state Total 52,576 100 100 100 36.5
Total rural Income relative to non-MSA
Less than 50 96 .8 .5 .4 72.6 Total rural Income relative to non-MSA 5 0 - 7 9
1,706 13.9 12.1 11.4 55.4 Total rural Income relative to non-MSA 80-90
2,084 16.9 15.9 15.7 45.9 Total rural Income relative to non-MSA 90 -100
2,916 23.7 22.9 23.1 39.8 Total rural Income relative to non-MSA 100-119
4,005 32.5 34.4 34.9 32.7 Total rural Income relative to non-MSA 120 or more
1,504 12.2 14.2 14.6 23.6 Total rural Income relative to non-MSA Total
12,311 100 100 100 37.9 Total rural Income relative to
state Less than 80 5,291 43.0 40.0 39.0 57.9
Total rural Income relative to state 80 -99 5,158 41.9 42.7 43.3 43.5 Total rural Income relative to state 100-119 1,493 12.1 13.8 14.1 33.1 Total rural Income relative to state 120 or more 369 3.0 3.5 3.6 23.1 Total rural Income relative to state Total 12,311 100 100 100 46.9
NOTE. Data f r o m the 2000 census are reported for census tracts and metropoli tan statistical areas as determined by 2004 definitions. Data exclude census tracts in U.S.-affiliated areas.
[footnote] 1. Income standard is the median family income in the metropolitan statisti-cal area (MSA), nonmetropoli tan port ion of the state (non-MSA), or state in which the census tract is located. [end of footnote.]
[footnote] 2. For calculations in this column, even when tracts are classified by state standards, families are still classified by the income in the M S A or non -MSA in which the family is located. [end of footnote.]

The problem that the agencies sought to address stems in part from the way rural census tracts are classified. As applied to rural areas, the 1995 regula-tions' system for classifying census-tract income has two defining characteristics. The first characteristic is that the system ignores the fact that rural areas are generally poorer than urban areas. Forty-three per-cent of rural census tracts in the United States (containing 40 percent of the rural population) have a median family income below 80 percent of the median family income of the state in which the tracts are located; in contrast, 30 percent of urban census tracts (containing 26 percent of the urban population) have a median family income below 80 percent of the statewide median (table 8, ''Total rural'' and ''Total urban'' categories). But the 1995 regulations classify rural census tracts relative only to a state's rural median income, not relative to the median income of the entire state, including its urban areas. Thus, the current rule classifies only 15 percent of rural tracts, not 43 percent, as lower income. In contrast, despite the higher absolute incomes of urban areas, double the proportion of urban tracts (31 percent), which are classified relative to the relevant metropolitan area income, are currently classified as lower income.
The second characteristic is that the census tract identifies pockets of lower-income populations less effectively in rural areas than in urban areas. Com-pared with urban census tracts, rural tracts are drawn
over relatively large geographic areas, have lower population densities, and often have relatively hetero-geneous populations that, when averaged, tend toward the middle (table 9). Indeed, 73 percent of all rural tracts are defined as middle income; in contrast, 44 percent of urban tracts are defined as such (percentages derived from table 8).
Table 9. Characteristics of census tracts and the share of selected areas and of banking institutions without lower-income tracts, by location of tract, as of December 31, 2003 Percent except as noted
Item Urban
Center city
Urban
Suburban
Rural
Exurban
Rural
Remote total Urban
Total
Rural total All
Characteristic of census tract Number of tracts 26,278 26,298 7,661 4,650 52,576 12,311 64,887 Characteristic of census tract Average land area per tract (square miles) 5.5 28.5 147.8 322.7 17.0 213.9 54.3 Characteristic of census tract Average population density per tract
(population per square mile) 9,812.3 3,097.3 494.5 423.4 6,454.4 467.7 5,318.4 Characteristic of census tract Average population per tract 4,145.3 4,693.8 4,163.7 3,639.6 4,419.6 3,965.7 4,333.4 Characteristic of census tract Percent of national population 38.7 43.9 11.3 6.0 82.6 17.4 100.0
Share without lower-income census tracts Area County 12.0 31.9 56.9 61.3 18.0 59.0 44.8 Share without lower-income census tracts Individual assessment area of large institution[see footnote]1 6.2 26.5 45.1 45.7 13.8 43.8 23.4 Share without lower-income census tracts Aggregate
assessment area Large institution 5.8 14.3 36.0 32.7 5.4 30.2 13.9 Share without lower-income census tracts Aggregate assessment area Small institution[see footnote]2
. . . . . . 55.0 56.9 7.9 53.9 28.3
NOTE. Data exclude U.S.-affiliated areas and tracts without income information.
[footnote]1. An assessment area consists of the area in which a banking institution has its main office, branches, and deposit-taking automated teller machines, as well as the surrounding areas in which the institution has originated or purchased a substantial portion of its loans. Assessment areas reported in the 2003 geographies, which were determined from information supplied by the U.S. Census Bureau, the U.S. Department of Agriculture, and the Office of Manage-
ment and Budget, have been mapped onto the 2004 tract definitions, which use the Office of Management and Budget' s 2004 designations of metropolitan statistical areas. Large institutions report their assessment areas each year and may have multiple assessment areas corresponding to cities or states. [end of footnote.]
[footnote]2. Aggregate assessment areas were approximated by the counties in which small institutions had branches. [end of footnote.]
. . . Not applicable.
The large size of rural census tracts and the relative heterogeneity within them have another consequence: uneven distribution of lower-income tracts among areas that define banking institutions' markets, such as counties and assessment areas. Most rural counties (almost 60 percent) have no tracts that are classified as lower income under the current definition; in con-trast, only 18 percent of urban counties are without any such tracts (table 9). About 44 percent of the rural assessment areas that large institutions reported under the CRA regulation in 2003 lacked any tracts classified as lower income, whereas only 14 percent of the urban assessment areas that these institutions reported lacked any such tracts. Small institutions do not report their assessment areas, though the areas are described in their performance evaluations. A rough approximation of a small institution's assess-ment areas—one that uses the counties in which its branches are located—suggests that 54 percent of small institutions also lack any lower-income tracts in rural areas.
The relative lack of lower-income tracts in rural areas could have different consequences. Banking institutions might invest less, or less efficiently, in

community-improving activities in rural areas than they might under a standard more appropriate for rural community development. Or they might shift more of their community-improving loans or invest-ments to urban areas than they might under a stan-dard that would give more equal area-based CRA consideration in urban and rural areas. A third possi-bility is that, even if the first and second possibilities failed to occur, banking institutions might receive inadequate recognition of their community-improving activities in rural areas because the activities did not meet the exact requirements to qualify as community development.
Perhaps to address these possible consequences, the 2005 proposal would expand, in two ways, the criteria under which banking institutions receive CRA consideration for community-improving activi-ties in rural areas. First, CRA consideration would be available for activities that revitalize or stabilize ''underserved rural areas,'' in the words of the pro-posal, even if the areas lack lower-income tracts. Second, the proposal would extend CRA consid-eration to affordable housing for any individual in an underserved rural area. The 1995 regulations limit affordable housing consideration to housing for lower-income individuals; consideration does not depend on where the lower-income individuals reside. The proposal would leave unchanged the rec-ognition of community development activities in urban areas and the non-community-development CRA measures.
In this section, we analyze several issues related to the agencies' proposal to expand the criteria for recognizing rural community-improving activities as community development. First, we test the pro-posal's premise that the 1995 regulations ''disfavor'' community-improving activities in rural areas rela-tive to those in urban areas. Second, we explore the implications of various options to revise the regula-tions on which the agencies sought public comment.
Concern about Whether the 1995 Regulations ''Disfavor'' Rural Areas
Research on the question of whether the 1995 reg-ulations disfavor rural areas is constrained by the difficulties in gathering comprehensive data on community-improving activities that fail to qualify for CRA consideration and by the lack of geographic data on community development loans, investments, and services. However, geographic data are available for all other CRA-related loan products and branches, such as loans to purchase or improve homes or to finance small businesses or small farms. We used
these data to test whether large institutions whose assessment areas include both urban and rural areas (''urban-rural institutions'') appear to favor urban areas over rural areas in retail lending and branching activities. We also tested whether large institutions with headquarters in rural areas (''rural institutions'') were less likely than similarly situated institutions with headquarters in urban areas (''urban institu-tions'' ) (1) to receive ''outstanding'' CRA ratings or (2) to engage in community development lending.
The first test was based on the distribution of urban-rural institutions' activities between urban and rural parts of their assessment areas. We restricted the analysis to institutions covered by the large-institution examination as of December 31, 2003, because such institutions are required to report the geographic location of most of their CRA-related loans, with the notable exception of community development loans. The test involved two distinct comparisons. First, the test compared the distribution of numbers of retail loans between urban and rural parts with the distributions of offices, populations (families), and housing structures (owner-occupied or multifamily) between the parts. This comparison tested whether urban-rural institutions extend retail loans in the same proportion to the offices, pop-ulations, and housing structures of those areas (table 10).
[footnote] 28. We also conducted a similar analysis that restricted the comparisons to retail loans, retail loan dollars, offices, families, hous-ing structures, and deposits in lower-income tracts. The results for this comparison are substantially the same as those for the comparison based on the full set of census tracts. [end of footnote.]
Second, the test compared, for various types of retail loan in those institutions' assessment areas, the distribution of loan dollars between urban and rural parts with the distribution of deposits between the parts. The comparison tested whether urban-rural institutions extend loan dollars in the same proportion that they receive deposits in rural and urban areas (table 11). We conducted both com-parisons separately for banking institutions in four asset-size categories: $250 million to $500 million, $500 million to $1 billion, $1 billion to $5 billion, and more than $5 billion.
We found that remote areas receive more retail loans as measured against the distributions of offices, populations, and housing structures and more loan dollars as measured against the distribution of depos-its than do urban areas in the aggregate for bank-ing institutions of every size category and for retail loans of almost every type considered (tables 10 and 11). For example, urban-rural institutions with assets between $500 million and $1 billion received 13.6 percent of their deposits from branches in
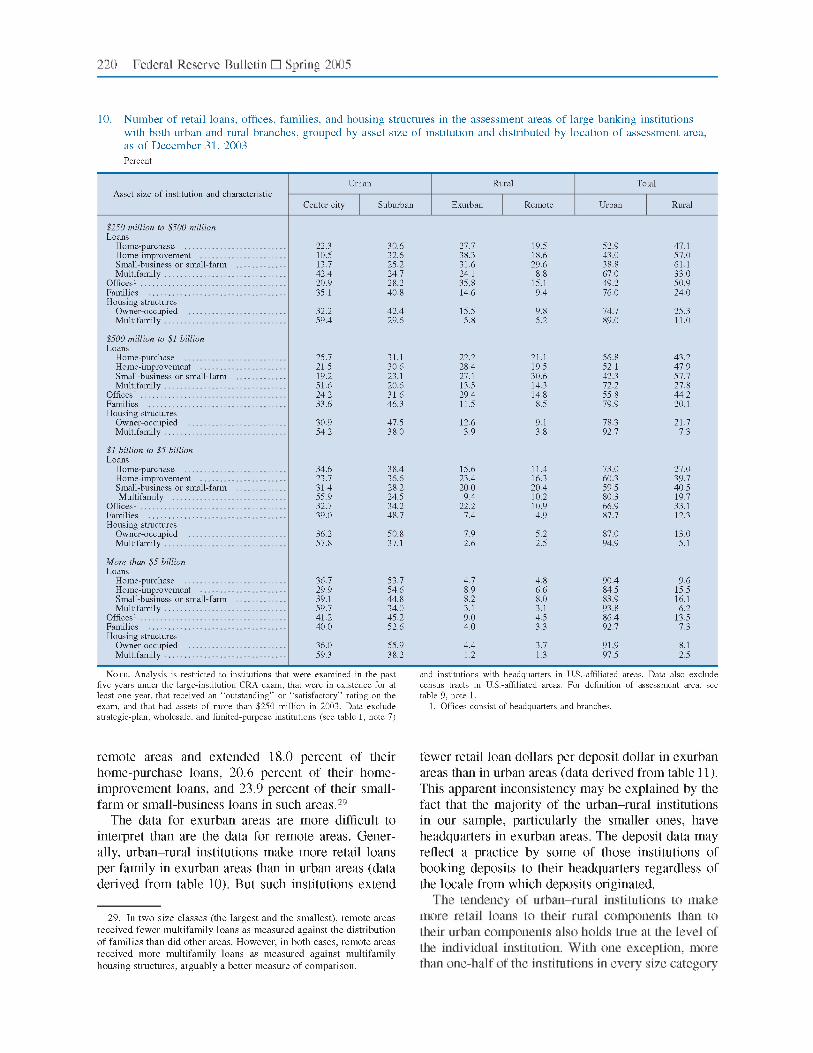
remote areas and extended 18.0 percent of their home-purchase loans, 20.6 percent of their home-improvement loans, and 23.9 percent of their small-farm or small-business loans in such areas.
[footnote] 29. In two size classes (the largest and the smallest), remote areas received fewer multifamily loans as measured against the distribution of families than did other areas. However, in both cases, remote areas received more multifamily loans as measured against multifamily housing structures, arguably a better measure of comparison. [end of footnote.]
The data for exurban areas are more difficult to interpret than are the data for remote areas. Gener-ally, urban-rural institutions make more retail loans per family in exurban areas than in urban areas (data derived from table 10).
Table 10. Number of retail loans, offices, families, and housing structures in the assessment areas of large banking institutions with both urban and rural branches, grouped by asset size of institution and distributed by location of assessment area, as of December 31, 2003 Percent
Asset size of institution and characteristic Urban
Center city
Urban
Suburban
Rural
Exurban
Rural
Remote
Total
Urban
Total
Rural
$250 million to $500 million Loans
Home-purchase 22.3 30.6 27.7 19.5 52.9 47.1 $250 million to $500 million Loans Home-improvement 10.5 32.6 38.3 18.6 43.0 57.0 $250 million to $500 million Loans Small-business or small-farm 13.7 25.2 31.6 29.6 38.8 61.1 $250 million to $500 million Loans Multifamily 42.4 24.7 24.1 8.8 67.0 33.0 $250 million to $500 million Offices[see footnote]1 20.9 28.2 35.8 15.1 49.2 50.9 $250 million to $500 million Families 35.1 40.8 14.6 9.4 76.0 24.0 $250 million to $500 million Housing structures
Owner-occupied 32.2 42.4 15.5 9.8 74.7 25.3 $250 million to $500 million Housing structures Multifamily 59.4 29.6 5.8 5.2 89.0 11.0
$500 million to $1 billion Loans
Home-purchase 25.7 31.1 22.2 21.1 56.8 43.2 $500 million to $1 billion Loans Home-improvement 21.5 30.6 28.4 19.5 52.1 47.9 $500 million to $1 billion Loans Small-business or small-farm 19.2 23.1 27.1 30.6 42.3 57.7 $500 million to $1 billion Loans Multifamily 51.6 20.6 13.5 14.3 72.2 27.8 $500 million to $1 billion Offices[see footnote]1 24.2 31.6 29.4 14.8 55.8 44.2 $500 million to $1 billion Families 33.6 46.3 11.5 8.5 79.9 20.1 $500 million to $1 billion Housing structures
Owner-occupied 30.9 47.5 12.6 9.1 78.3 21.7 $500 million to $1 billion Housing structures Multifamily 54.2 38.0 3.9 3.8 92.7 7.3
$1 billion to $5 billion Loans
Home-purchase 34.6 38.4 15.6 11.4 73.0 27.0 $1 billion to $5 billion Loans Home-improvement 23.7 36.6 23.4 16.3 60.3 39.7 $1 billion to $5 billion Loans Small-business or small-farm 31.4 28.2 20.0 20.4 59.5 40.5 $1 billion to $5 billion Loans Multifamily 55.9 24.5 9.4 10.2 80.3 19.7 $1 billion to $5 billion Offices[see footnote]1 32.7 34.2 22.2 10.9 66.9 33.1 $1 billion to $5 billion Families 39.0 48.7 7.4 4.9 87.7 12.3 $1 billion to $5 billion Housing structures
Owner-occupied 36.2 50.8 7.9 5.2 87.0 13.0 $1 billion to $5 billion Housing structures Multifamily 57.8 37.1 2.6 2.5 94.9 5.1
More than $5 billion Loans
Home-purchase 36.7 53.7 4.7 4.8 90.4 9.6 More than $5 billion Loans Home-improvement 29.9 54.6 8.9 6.6 84.5 15.5 More than $5 billion Loans Small-business or small-farm 39.1 44.8 8.2 8.0 83.9 16.1 More than $5 billion Loans Multifamily 59.7 34.0 3.1 3.1 93.8 6.2 More than $5 billion Offices[see footnote]1 41.2 45.2 9.0 4.5 86.4 13.5 More than $5 billion Families 40.0 52.6 4.0 3.3 92.7 7.3 More than $5 billion Housing structures
Owner-occupied 36.0 55.9 4.4 3.7 91.9 8.1 More than $5 billion Housing structures Multifamily 59.3 38.2 1.2 1.3 97.5 2.5
NOTE. Analysis is restricted to institutions that were examined in the past five years under the large-institution CRA exam, that were in existence for at least one year, that received an ' 'outstanding' ' or ' 'satisfactory' ' rating on the exam, and that had assets of more than $250 million in 2003. Data exclude strategic-plan, wholesale, and limited-purpose institutions (see table 1, note 7)
and institutions with headquarters in U.S.-affiliated areas. Data also exclude census tracts in U.S.-affiliated areas. For definition of assessment area, see table 9, note 1.
[footnote] 1. Offices consist of headquarters and branches. [end of footnote.]
But such institutions extend
fewer retail loan dollars per deposit dollar in exurban areas than in urban areas (data derived from table 11). This apparent inconsistency may be explained by the fact that the majority of the urban-rural institutions in our sample, particularly the smaller ones, have headquarters in exurban areas. The deposit data may reflect a practice by some of those institutions of booking deposits to their headquarters regardless of the locale from which deposits originated.

Table 11. Retail loan amounts and deposits in the assessment areas of large banking institutions with urban and rural branches, grouped by asset size of institution and distributed by location of assessment area, as of December 31, 2003 Percent
Asset size of institution and loan amounts and deposits
Urban
Center city
Urban
Suburban
Rural
Exurban
Rural
Remote
Total
Urban
Total
Rural
$250 million to $500 million Loans
Home-purchase 24.9 34.4 24.8 16.0 59.2 40.8 $250 million to $500 million Loans Home-improvement 12.1 40.6 33.0 14.2 52.7 47.3 $250 million to $500 million Loans Small-business or small-farm 19.4 26.0 27.0 27.6 45.3 54.7 $250 million to $500 million Loans Multifamily 38.0 32.9 23.9 5.2 71.0 29.0 $250 million to $500 million Deposits 20.1 23.7 40.3 15.9 43.8 56.2
$500 million to $1 billion Loans
Home-purchase 27.2 36.0 18.8 18.0 63.2 36.8 $500 million to $1 billion Loans Home-improvement 20.7 31.6 27.1 20.6 52.3 47.7 $500 million to $1 billion Loans Small-business or small-farm 26.6 25.7 23.7 23.9 52.3 47.6 $500 million to $1 billion Loans Multifamily 58.9 20.5 9.8 10.7 79.4 20.5 $500 million to $1 billion Deposits 29.8 29.1 27.5 13.6 58.9 41.1
$1 billion to $5 billion Loans
Home-purchase 34.9 43.3 12.0 9.7 78.2 21.7 $1 billion to $5 billion Loans Home-improvement 24.5 43.5 19.2 12.8 68.0 32.0 $1 billion to $5 billion Loans Small-business or small-farm 40.0 32.2 14.3 13.6 72.2 27.9 $1 billion to $5 billion Loans Multifamily 57.8 29.4 6.0 6.8 87.2 12.8 $1 billion to $5 billion Deposits 43.3 29.3 18.8 8.5 72.6 27.3
More than $5 billion Loans
Home-purchase 36.5 57.1 2.9 3.4 93.6 6.4 More than $5 billion Loans Home-improvement 27.1 61.1 6.2 5.5 88.2 11.7 More than $5 billion Loans Small-business or small-farm 41.7 43.6 7.4 7.2 85.3 14.6 More than $5 billion Loans Multifamily 59.8 37.2 1.3 1.7 97.0 3.0 More than $5 billion Deposits 59.8 32.7 5.2 2.3 92.5 7.5
NOTE. See general note to table 10.
The tendency of urban-rural institutions to make more retail loans to their rural components than to their urban components also holds true at the level of the individual institution. With one exception, more than one-half of the institutions in every size category
extended more retail loans per family, per owner-occupied housing structure, or per multifamily hous-ing structure to the rural parts of their assessment areas than to the urban parts (table 12). The exception was multifamily loans for institutions in the smallest size category. When measured in terms of retail loan dollars per deposit dollar, the results were somewhat mixed. For example, the rural parts appeared to get more home-improvement loans but fewer home-purchase loans than did the urban parts.
[footnote] 30. The calculations of retail loan dollars per deposit dollars tend to show higher lending to the urban part than do the calculations of retail loan numbers per population because retail loans in urban areas are generally larger than in rural areas, a reflection of higher property values. [end of footnote.]
The second test compared rural institutions with similarly situated urban institutions in two respects: the likelihood of receiving an ''outstanding'' CRA rating and the level of engagement in community development lending. The sample in this test used the same size categories as the sample in the first test and was also restricted to institutions covered under the large-institution evaluation procedures. The second test, however, eliminated the requirement that an institution have both urban and rural parts in its assessment areas.
The evidence suggests that rural banking insti-tutions with assets of less than $1 billion are not less likely to receive ''outstanding'' ratings than are urban institutions with assets of less than $1 billion (table 13). Exurban institutions with assets between $250 million and $500 million are somewhat less likely to receive ''outstanding'' ratings than are their urban counterparts, but exurban institutions with assets between $500 million and $1 billion are sig-nificantly more likely to do so. Few institutions with assets exceeding $1 billion have headquarters in rural areas; those in that category are less likely to receive ''outstanding'' CRA ratings than are institutions that have assets exceeding $1 billion and headquarters in urban areas.
The evidence offers modest support for the conclu-sion that rural institutions do less community devel-opment lending than do similarly sized urban institu-tions. In each asset-size category under $5 billion, the percentage of rural institutions that reported no com-munity development lending in 2003 was comparable to the percentage of similarly sized urban institutions that did so (data derived from table 13). However, for every asset-size category, with one exception, rural institutions that reported community develop-ment lending for 2003 made a smaller dollar amount

of community development loans than did urban institutions. The exception was remote institutions with assets between $500 million and $1 billion. These institutions had higher community develop-ment loan dollar amounts than did the combination of same-sized center-city and suburban institutions.
Table 12. Proportion of large banking institutions with both urban and rural branches that overserve parts of their assessment areas in terms of either number of loans or loan amount, by asset size of institution, type of loan, and location of assessment area, as of December 31, 2003 Percent
Loan measure and loan type
Exurban
Rural
Remote Total Urban
Number of loans, by asset size of institution $250 million to $500 million
Home-purchase 55.6 35.5 62.9 37.1 Number of loans, by asset size of institution $250 million to $500 million Home-improvement
63.2 35.1 77.2 22.8 Number of loans, by asset size of institution $250 million to $500 million Small-business or
small-farm 51.8 38.7 59.9 40.1 Number of loans, by asset size of institution $250 million to $500 million Multifamily 32.1 17.3 43.2 56.8 Number of loans, by asset size of institution $500 million to $1 billion Home-purchase
53.8 43.2 65.1 34.9 Number of loans, by asset size of institution $500 million to $1 billion Home-improvement
55.3 42.7 68.0 32.0 Number of loans, by asset size of institution $500 million to $1 billion Small-business or
small-farm 56.2 43.8 66.9 33.1 Number of loans, by asset size of institution $500 million to $1 billion Multifamily 39.3 29.5 53.6 46.4 Number of loans, by asset size of institution $1 billion to $5 billion Home-purchase 65.8 44.7 71.1 28.9
Number of loans, by asset size of institution $1 billion to $5 billion Home-improvement
67.6 47.9 76.8 23.2 Number of loans, by asset size of institution $1 billion to $5 billion Small-business or
small-farm 60.8 45.8 67.3 32.7 Number of loans, by asset size of institution $1 billion to $5 billion Multifamily 40.6 32.3 53.4 46.6 Number of loans, by asset size of institution More than $5 billion Home-purchase 49.5 49.5 53.8 46.2
Number of loans, by asset size of institution More than $5 billion Home-improvement
66.7 51.9 64.2 35.8 Number of loans, by asset size of institution More than $5 billion Small-business or
small-farm 64.0 64.0 67.4 32.6 Number of loans, by asset size of institution More than $5 billion Multifamily 51.8 43.5 61.2 38.8
Loan amount, by asset size of institution $250 million to $500 million
Home-purchase 29.0 32.3 37.9 62.1 Loan amount, by asset size of institution $250 million to $500 million Home-improvement
39.5 37.7 52.6 47.4 Loan amount, by asset size of institution $250 million to $500 million Small-business or
small-farm 28.5 37.2 48.2 51.8 Loan amount, by asset size of institution $250 million to $500 million Multifamily 19.8 17.3 29.6 70.4 Loan amount, by asset size of institution $500 million to $1 billion Home-purchase
26.0 37.9 44.4 55.6 Loan amount, by asset size of institution $500 million to $1 billion Home-improvement
36.7 38.0 52.7 47.3 Loan amount, by asset size of institution $500 million to $1 billion Small-business or
small-farm 31.5 43.8 49.4 50.6 Loan amount, by asset size of institution $500 million to $1 billion Multifamily 23.2 21.4 34.8 65.2 Loan amount, by asset size of institution $1 billion to $5 billion Home-purchase 30.3 46.1 41.4 58.6
Loan amount, by asset size of institution $1 billion to $5 billion Home-improvement
50.0 49.3 62.0 38.0 Loan amount, by asset size of institution $1 billion to $5 billion Small-business or
small-farm 26.8 47.1 41.8 58.2 Loan amount, by asset size of institution $1 billion to $5 billion Multifamily 15.0 22.6 26.3 73.7 Loan amount, by asset size of institution More than $5 billion Home-purchase 34.4 62.4 50.5 49.5
Loan amount, by asset size of institution More than $5 billion Home-improvement
54.3 77.8 66.7 33.3 Loan amount, by asset size of institution More than $5 billion Small-business or
small-farm 40.4 75.3 69.7 30.3 Loan amount, by asset size of institution More than $5 billion Multifamily 11.8 31.8 21.2 78.8
NOTE. See general note to table 10. Overserving by an institution in part of its assessment areas is measured by the ratio of the number of loans or the aggregate loan amount in that part to the number of owner-occupied housing structures (in the case of home-purchase and home-improvement loans), or to the number of families (in the case of small-business or small-farm loans), or to the number of multifamily housing structures (in the case of multifamily loans) in that part. An institution overserves in part of its assessment areas for a particular loan type if the ratio in the part, either for number of loans or loan amount, exceeds the average ratio for all the institution's assessment areas.
Table 13. Share of large banking institutions that received an ''outstanding'' rating on their most recent large-institution CRA exam and the extent of community development lending among large institutions, by asset size of institution and location of headquarters, as of December 31, 2003
Characteristic and asset size of institution
Urban
Center city
Urban
Suburban
Rural
Exurban
Rural
Remote
' 'Outstanding" rating $250 million to $500 million
Number 137 163 95 62 ''Outstanding" rating
$250 million to $500 million Percent 8.0 9.8 6.3 14.5
''Outstanding" rating $500 million to $1 billion Number 184 171 47 39
''Outstanding" rating $500 million to $1 billion Percent 13.0 13.5 29.8 15.4 ''Outstanding" rating $1 billion to $5 billion Number 217 113 32 12
''Outstanding" rating $1 billion to $5 billion Percent 29.0 28.3 3.1 16.2 ''Outstanding" rating More than $5 billion Number 144 24 7 1
''Outstanding" rating More than $5 billion Percent 52.1 45.8 .0 .0
Made community development loans in 2003[see footnote]1
$250 million to $500 million Percent 63.0 53.8 56.3 53.8
Made community development loans in 2003[see footnote]1 $250 million to $500 million Average amount (thousands of dollars)
3,833 3,164 2,074 1,346 Made community development
loans in 2003[see footnote]1 $500 million to $1 billion Percent 74.7 65.3 55.6 73.5
Made community development loans in 2003[see footnote]1 $500 million to $1 billion Average amount (thousands of dollars)
7,321 5,117 2,363 7,009 Made community development
loans in 2003[see footnote]1 $1 billion to $5 billion Percent 84.0 74.5 68.0 72.7
Made community development loans in 2003[see footnote]1 $1 billion to $5 billion Average amount (thousands of dollars)
24,073 22,106 9,070 13,338 Made community development
loans in 2003[see footnote]1 More than $5 billion Percent 90.8 84.2 100.0 100.0
Made community development loans in 2003[see footnote]1 More than $5 billion Average amount (thousands of dollars)
291,814 188,318 19,945 6,716
NOTE. See general note to table 10. [footnote] 1. Average amount of loans was among institutions with such lending. [end of footnote.]
This evidence on community development lending, however, is indirect and inconclusive. For example, it excludes any measure of community development investments or services. Moreover, because we lack information about the location of community devel-opment loans, inferences drawn from locations of institutions' headquarters are subject to dispute.
In sum, the retail lending and branching measures used here provide little evidence that banking insti-tutions collectively or individually underserve rural areas, with the possible exception of community development lending. Moreover, there is no evidence that a lower percentage of rural-based institutions receive ''outstanding'' CRA performance ratings (at least for such institutions with less than $1 billion in assets).
Rural Areas That Would Be Affected by the Agencies' Proposed Options
The agencies sought comment on several alternative definitions of CRA-eligible rural census tracts. Each

alternative satisfies five basic principles. First, each alternative would permit an institution to know, when it decided to make a loan or investment, whether or not the loan or investment would qualify as com-munity development. Second, each alternative would rely on measures that change no more often than annually and in most cases change much less fre-quently than that. Third, each alternative would rely on purely objective statistical criteria that could be applied mechanically and without judgment. Fourth, each alternative would be easy to apply: Any required calculations would be straightforward or would be obviated by the government' s publication of a list of eligible areas. Fifth, each alternative would rely on readily available, government-produced data.
The three alternatives that we considered were (1) moving the income threshold for CRA-eligible rural tracts from 80 percent to 90 percent or 100 per-cent of the statewide nonmetropolitan median family income, (2) changing the baseline for determining the CRA eligibility of rural tracts from the statewide nonmetropolitan median family income to the state-wide median family income, and (3) adopting a modi-fied version of the criteria used by the Community Development Financial Institutions Fund (CDFI Fund) to identify ''investment areas.''
The fund uses four alternative criteria of interest here to classify geographic areas (tracts, counties, or other aggregations) as investment areas. According to the fund, an area qualifies as an investment area if it has (1) a median family income that is less than 80 percent of the relevant metropolitan median family income or the national metropolitan median family income, whichever is higher, in the case of a metro-politan area, or a median family income that is less than 80 percent of the relevant statewide nonmetro-politan median family income or the national non-metropolitan median family income, whichever is higher, in the case of a nonmetropolitan area; (2) an unemployment rate of at least 1.5 times the national average; (3) a poverty rate of 20 percent or more; (4) a population loss of 10 percent or more between the previous and most recent censuses or a net migra-tion loss of 5 percent or more over the five-year period preceding the most recent census.
[footnote] 31. Community Development Financial Institutions Fund, U.S. Department of the Treasury (2004), ''Community Development Finan-cial Institutions Program,'' Federal Register, vol. 69 (May 11), p. 26259. The fund's definition of an investment area contains an additional criterion, which states that the area has ''significant unmet needs for loans, equity investments, or financial services.'' We disre-garded this criterion because the fund refrained from defining it in objective, quantitative terms. [end of footnote.]
Data for unemployment, poverty, and population are updated
annually at the county level and decennially at the tract level.
To permit comparison with the current rule, we modified the fund's criteria. Instead of using the fund' s income criterion, we used the CRA' s. That is, we treated as CRA-eligible any tracts currently classi-fied as lower income (using, in rural areas, the current CRA baseline of the nonmetropolitan statewide median family income) and any tracts currently clas-sified as middle income that are located in a county that meets any of criteria 2 through 4. Thus, in this article, when we refer to the ''modified CDFI Fund criteria,'' we use a modification of the first fund criterion, the one based on income.
There are two key differences between the fund' s criteria, which use non-income measures of commu-nity need, and the other alternatives, each of which relies solely on a relative tract-income criterion. First, the fund' s criteria use measures for which data are at the county level, not the tract level. Second, the fund' s county-level criteria use measures that are updated annually; income data at the tract level, in contrast, are updated only every ten years.
[footnote] 32. The two population criteria that we use in our adaptation of the fund's criteria are based on 2000 census data. [end of footnote.]
Con-sequently, the way in which the fund' s criteria iden-tify CRA-eligible areas is different from that in which the income-based alternatives do, and the difference can result in different outcomes.
Our analysis expands on the agencies' proposal in two main respects. The agencies proposed to apply the alternatives outlined earlier only to rural areas and only for the purpose of qualifying activities as community development. Our analysis evaluates the alternatives on those terms but goes beyond those terms. In particular, we show the implications of adopting these alternatives in urban areas, divided into central-city and suburban components, and in rural areas, divided into exurban and remote compo-nents. We also show the implications of adopting the alternatives for the purpose of evaluating other CRA-related activities, such as retail lending (table 14).
We computed the effects of the alternatives on the coverage of rural and urban census tracts and on the retail lending activities that would have counted as CRA-related if the alternatives had been in effect in 2003 (we assumed that banking institutions had not altered their behavior). We compared each alternative with actual 2003 retail lending activities adjusted for changes, implemented in 2004, in the definitions and boundaries of metropolitan statistical areas.
[footnote] 33. Institutions that filed 2003 HMDA and CRA small-business data used census tract definitions based on the 2000 census. Metropoli-tan area boundaries based on the 2000 census were not implemented

for filings related to HMDA and the CRA until 2004. In constructing the numbers we report here, we use the 2004 definitions of metropoli-tan statistical areas. [end of footnote.]
Table 14. Comparison of effects, on census tracts and on counties, of options for defining census tracts as CRA-eligible, by location of tract, as of December 31, 2003 Percent
Item Urban
Center city
Urban
Suburban
Rural
Exurban
Rural
Remote Total Urban
Total
Rural Total All
Current rule Less than 80 percent of MSA or non-MSA median [see footnote]1
CRA-eligible tracts 43.5 18.6 12.6 17.9 31.1 14.6 28.0 Current rule
Less than 80 percent of MSA or non-MSA median[see footnote]1CRA-eligible tracts Population 39.7 17.2 11.1 15.6 27.7 12.6 25.1
Current rule Less than 80 percent of MSA or non-MSA median[see footnote]1CRA-eligible tracts Loans
Small-business or small-farm 30.7 16.7 10.9 13.1 22.5 11.9 15.8
Current rule Less than 80 percent of MSA or non-MSA median[see footnote]1CRA-eligible tracts Loans Home-purchase
20.3 13.8 9.1 12.7 16.8 10.7 12.9 Current rule
Less than 80 percent of MSA or non-MSA median[see footnote]1CRA-eligible tracts Loans Multifamily 43.2 23.0 14.9 13.3 33.5 14.3 25.5
Current rule Less than 80 percent of MSA or non-MSA median[see footnote]1CRA-eligible tracts Branches
33.1 20.6 13.8 15.7 25.8 14.7 18.6 Current rule
Less than 80 percent of MSA or non-MSA median[see footnote]1CRA-eligible tracts Deposits 38.9 22.1 15.2 16.7 30.0 15.9 20.9
Current rule Less than 80 percent of MSA or non-MSA median[see footnote]1Counties without CRA-eligible tracts
12.0 31.9 56.9 61.3 18.0 59.0 44.8 Current rule
Less than 80 percent of MSA or non-MSA median[see footnote]1Counties with only CRA-eligible tracts .6 2.8 1.7 4.8 2.4 3.2 2.9
Options Less than 90 percent of MSA or non-MSA median [see footnote]1
CRA-eligible tracts 53.5 31.5 27.8 37.8 42.5 31.6 40.4 Options
Less than 90 percent of MSA or non-MSA median[see footnote]1 CRA-eligible tracts Population 50.1 29.7 25.4 34.3 39.3 28.5 37.4
Options Less than 90 percent of MSA or non-MSA median[see footnote]1 CRA-eligible tracts Loans
Small-business or small-farm 41.2 33.5 27.4 36.4 38.7 31.6 34.2
Options Less than 90 percent of MSA or non-MSA median[see footnote]1 CRA-eligible tracts Loans Home-purchase
30.2 30.4 25.2 34.7 33.0 29.5 30.7 Options
Less than 90 percent of MSA or non-MSA median[see footnote]1 CRA-eligible tracts Loans Multifamily 54.7 39.6 28.2 30.7 48.0 29.1 40.1
Options Less than 90 percent of MSA or non-MSA median[see footnote]1 CRA-eligible tracts Branches
43.9 39.7 32.3 40.8 43.9 36.4 39.0 Options
Less than 90 percent of MSA or non-MSA median[see footnote]1 CRA-eligible tracts Deposits 50.0 41.5 33.7 41.6 48.3 37.5 41.3
Options Less than 90 percent of MSA or non-MSA median[see footnote]1 Counties without CRA-eligible tracts
8.5 13.2 29.5 31.3 5.9 30.4 21.9 Options
Less than 90 percent of MSA or non-MSA median[see footnote]1 Counties with only CRA-eligible tracts 1.9 9.7 6.8 18.3 8.5 12.4 11.1
Options Less than 100 percent of MSA or non-MSA median [see footnote]1
CRA-eligible tracts 63.0 47.0 51.0 62.3 55.0 55.3 55.1 Options Less than 100 percent of MSA or non-MSA median[see footnote]1 CRA-eligible tracts Population 60.0 45.2 48.1 57.7 52.1 51.4 52.0 Options Less than 100 percent of MSA or non-MSA median[see footnote]1 CRA-eligible tracts Loans
Small-business or small-farm 52.5 54.2 52.8 65.8 56.7 58.8 58.1 Options Less than 100 percent of MSA or non-MSA median[see footnote]1 CRA-eligible tracts Loans Home-purchase 42.4 49.8 50.7 62.4 50.2 56.1 54.0 Options Less than 100 percent of MSA or non-MSA median[see footnote]1 CRA-eligible tracts Loans Multifamily 65.9 58.9 49.7 53.8 63.9 51.2 58.6 Options Less than 100 percent of MSA or non-MSA median[see footnote]1 CRA-eligible tracts Branches 56.1 59.7 58.3 69.4 61.7 63.6 63.0 Options Less than 100 percent of MSA or non-MSA median[see footnote]1 CRA-eligible tracts Deposits 60.7 60.9 59.7 69.8 64.9 64.6 64.7 Options Less than 100 percent of MSA or non-MSA median[see footnote]1 Counties without CRA-eligible tracts 5.8 3.2 10.0 10.3 1.3 10.1 7.1 Options Less than 100 percent of MSA or non-MSA median[see footnote]1 Counties with only CRA-eligible tracts 4.1 20.4 21.3 42.3 17.1 31.5 26.5
Options Less than 80 percent of state median [see footnote]2
CRA-eligible tracts 41.6 17.5 39.8 48.2 29.5 43.0 32.1 Options Less than 80 percent of state median [see footnote]2 CRA-eligible tracts Population 37.8 15.9 37.5 44.6 26.2 40.0 28.6 Options Less than 80 percent of state median [see footnote]2 CRA-eligible tracts Loans
Small-business or small-farm 32.4 15.9 40.0 46.9 21.4 43.2 35.2 Options Less than 80 percent of state median [see footnote]2 CRA-eligible tracts Loans Home-purchase 22.0 13.8 38.3 45.5 16.4 41.6 32.8 Options Less than 80 percent of state median [see footnote]2 CRA-eligible tracts Loans Multifamily 44.1 21.4 38.3 37.6 32.3 38.0 34.7 Options Less than 80 percent of state median [see footnote]2 CRA-eligible tracts Branches 34.6 19.6 46.2 51.8 24.8 48.9 40.5 Options Less than 80 percent of state median [see footnote]2 CRA-eligible tracts Deposits 40.4 20.9 47.3 52.4 28.7 49.8 42.4 Options Less than 80 percent of state median [see footnote]2 Counties without CRA-eligible tracts 12.2 37.4 18.7 24.4 23.2 21.5 22.1 Options Less than 80 percent of state median [see footnote]2 Counties with only CRA-eligible tracts 1.2 3.2 15.3 28.2 2.8 21.6 15.0
Options Modified CDFI Fund criteria[see footnote]3
Combined CRA-eligible tracts 49.1 22.9 29.6 38.1 36.0 32.8 35.4 Options Modified CDFI Fund criteria[see footnote]3
Combined CRA-eligible tracts Population 45.1 21.5 27.9 34.5 32.6 30.2 32.1 Options Modified CDFI Fund criteria[see footnote]3
Combined CRA-eligible tracts Loans Small-business or small-farm 36.4 22.5 31.1 38.6 28.0 34.6 32.2 Options Modified CDFI Fund criteria[see footnote]3
Combined CRA-eligible tracts Loans Home-purchase 26.6 20.3 30.3 36.1 23.3 33.0 29.6 Options Modified CDFI Fund criteria[see footnote]3
Combined CRA-eligible tracts Loans Multifamily 49.0 28.8 29.1 31.3 39.1 29.9 35.3 Options Modified CDFI Fund criteria[see footnote]3
Combined CRA-eligible tracts Branches 38.9 26.5 33.9 41.3 31.6 37.5 35.4 Options Modified CDFI Fund criteria[see footnote]3
Combined CRA-eligible tracts Deposits 44.2 27.9 34.9 42.1 35.4 38.3 37.3 Options Modified CDFI Fund criteria[see footnote]3
Combined Counties without CRA-eligible tracts 11.2 29.6 45.9 44.1 16.9 45.1 35.3 Options Modified CDFI Fund criteria[see footnote]3
Combined Counties with only CRA-eligible tracts 1.6 7.8 24.3 33.7 6.8 28.9 21.2

14.—Continued
Item Urban
Center city
Urban
Suburban
Rural
Exurban
Rural
Remote Total Urban
Total
Rural Total All
Modified CDFI Fund criteria Unemployment
CRA-eligible tracts 46.0 20.5 23.7 26.8 33.3 24.9 31.7 Modified CDFI Fund criteria Unemployment CRA-eligible tracts Population 42.1 19.1 22.4 24.3 29.9 23.1 28.7 Modified CDFI Fund criteria Unemployment CRA-eligible tracts Loans
Small-business or small-farm 33.2 20.0 23.7 22.8 25.5 23.3 24.1 Modified CDFI Fund criteria Unemployment CRA-eligible tracts Loans Home-purchase 22.9 17.6 22.2 23.4 20.4 22.8 21.9 Modified CDFI Fund criteria Unemployment CRA-eligible tracts Loans Multifamily 45.7 26.4 24.5 21.9 36.6 23.6 31.1 Modified CDFI Fund criteria Unemployment CRA-eligible tracts Branches 35.3 23.9 26.4 25.1 28.7 25.8 26.8 Modified CDFI Fund criteria Unemployment CRA-eligible tracts Deposits 40.8 25.3 27.6 25.9 32.7 26.8 28.9
Modified CDFI Fund criteria Counties without CRA-eligible tracts 11.6 30.6 49.3 55.9 17.3 52.5 40.3 Modified CDFI Fund criteria Counties with only CRA-eligible tracts 1.2 5.7 14.7 16.3 5.1 15.5 11.8
Modified CDFI Fund criteria Poverty CRA-eligible tracts 45.5 19.1 19.0 25.8 32.3 21.6 30.3
Modified CDFI Fund criteria Poverty CRA-eligible tracts Population 41.5 17.7 17.3 23.7 28.9 19.5 27.2 Modified CDFI Fund criteria Poverty CRA-eligible tracts Loans
Small-business or small-farm 31.6 17.7 18.0 22.4 23.5 20.1 21.3 Modified CDFI Fund criteria Poverty CRA-eligible tracts Loans Home-purchase 21.2 15.1 17.1 21.6 18.1 19.2 18.8 Modified CDFI Fund criteria Poverty CRA-eligible tracts Loans Multifamily 44.3 23.6 19.8 19.7 34.3 19.8 28.2 Modified CDFI Fund criteria Poverty CRA-eligible tracts Branches 33.7 21.7 20.9 25.1 26.9 22.9 24.3 Modified CDFI Fund criteria Poverty CRA-eligible tracts Deposits 39.4 23.2 22.1 25.9 31.0 23.9 26.4
Modified CDFI Fund criteria Counties without CRA-eligible tracts 12.0 31.5 54.9 57.0 17.8 55.9 42.7 Modified CDFI Fund criteria Counties with only CRA-eligible tracts .6 4.4 12.3 17.6 3.9 14.9 11.1
Modified CDFI Fund criteria Population loss CRA-eligible tracts 47.8 21.0 15.2 25.7 34.4 19.2 31.5
Modified CDFI Fund criteria Population loss CRA-eligible tracts Population 43.5 19.4 13.3 22.0 30.7 16.3 28.2 Modified CDFI Fund criteria Population loss CRA-eligible tracts Loans
Small-business or small-farm 33.9 18.8 14.5 24.9 24.7 19.4 21.3 Modified CDFI Fund criteria Population loss CRA-eligible tracts Loans Home-purchase 24.1 16.0 12.9 22.3 19.3 17.2 17.9 Modified CDFI Fund criteria Population loss CRA-eligible tracts Loans Multifamily 46.2 25.1 16.5 20.5 35.9 18.0 28.4 Modified CDFI Fund criteria Population loss CRA-eligible tracts Branches 36.7 22.7 17.8 28.3 28.2 22.9 24.7 Modified CDFI Fund criteria Population loss CRA-eligible tracts Deposits 42.3 24.2 19.1 29.2 32.3 24.0 26.9
Modified CDFI Fund criteria Counties without CRA-eligible tracts 11.6 31.1 54.1 51.2 17.8 52.7 40.6 Modified CDFI Fund criteria Counties with only CRA-eligible tracts 1.0 3.9 5.7 17.8 3.1 11.6 8.6
M E M O Number of tracts 26,278 26,298 7,661 4,650 52,576 12,311 64,887
NOTE. See general note to table 9, and for description of lending and branch data reported in 2003 geographies, see related description for assessment areas in table 9, note 1. Analysis is restricted to lending done within assessment areas and excludes institutions not covered by the CRA.
[footnote] 1. Median family income in census tract as a percentage of the median family income in the metropolitan statistical area (MSA) or nonmetropolitan portion of the state (non-MSA) in which the census tract is located. [end of footnote.]
[footnote] 2. Median family income in census tract as a percentage of the median fam-ily income in the state in which the census tract is located. [end of footnote.]
[footnote] 3. For description of modification to CDFI Fund criteria, see text. CDFI Fund Community Development Financial Institutions Fund. [end of footnote.]
Each of the proposals would substantially increase the number of rural tracts that are CRA-eligible—that is, eligible for area-based community development activities. Currently, 14.6 percent of rural census tracts are classified as CRA-eligible; these tracts contain 12.6 percent of the rural population. Raising the threshold to 90 percent for rural areas would roughly equate the percentages of urban and rural tracts classified as CRA-eligible, at about 31 percent; raising the threshold to 100 percent would qualify 55 percent of rural tracts as CRA-eligible. Similarly, changing the baseline for classifying rural tracts to the state-
wide median but retaining the 80 percent threshold-would qualify 43 percent of rural tracts as CRA-eligible.
[footnote] 3 4 . R h o d e I s l a n d is t h e o n l y s t a t e in w h i c h t h e n o n m e t r o p o l i t a n a r e a m e d i a n i n c o m e is h i g h e r t h a n t h e o v e r a l l s ta te m e d i a n i n c o m e . [end of footnote.]
We also calculated the effects of adopting the modified CDFI Fund criteria. Using the criteria to identify middle-income tracts that would be CRA-eligible would classify 33 percent of rural census tracts as lower income, a proportion nearly equal to the 31 percent of urban census tracts currently classi-fied as CRA-eligible (see ''Current rule'' and ''Modi-fied CDFI Fund criteria'' categories). When each of the unemployment, poverty, and population loss criteria is applied separately, the proportion of rural tracts classified as CRA-eligible is 25 percent, 22 per-
cent, and 19 percent respectively. Applying the modified CDFI Fund criteria to urban tracts would have a comparatively modest effect, increasing the number of urban tracts classified as CRA-eligible from 31 percent to 36 percent. The general patterns described in this paragraph and in the previous one are also found when the unit of analysis is the propor-tion of population in CRA-eligible tracts.
We also profiled the economic and demographic characteristics of the tracts now classified as lower income and of the additional tracts that would be CRA-eligible under each of the alternatives (table 15).

Table 15. Characteristics of CRA-eligible census tracts and counties and of those that would be added under options for defining census tracts as CRA-eligible, by location of tract, as of December 31, 2003 Percent except as noted
Item
Urban
Center city
Urban
Suburban
Rural
Exurban
Rural
Remote Total Urban
Total
Rural Total All
Current rule Less than 80 percent of MSA or non-MSA median[see footnote]1
Tract (average characteristics) Number added 11,441 4,900 969 833 16,341 1,802 18,143 Current rule Less than 80 percent of MSA or non-MSA median[see footnote]1
Tract (average characteristics) Share of families with income Less than or equal to poverty level 23.9 15.6 22.9 23.1 21.4 23.0 21.6
Current rule Less than 80 percent of MSA or non-MSA median[see footnote]1
Tract (average characteristics) Share of families with income Less than 50 percent of MSA or non-MSA median[see footnote]1 43.8 35.3 34.5 34.7 41.3 34.6 40.6 Current rule Less than 80 percent of MSA or non-MSA median[see footnote]1
Tract (average characteristics) Share of families with income Between 50 percent and 80 percent of MSA or non-MSA median[see footnote]1 22.7 24.8 22.2 22.6 23.3 22.4 23.2 Current rule Less than 80 percent of MSA or non-MSA median[see footnote]1
Tract (average characteristics) Median family income (dollars) 30,067 36,343 27,741 27,090 31,949 27,440 31,501 Current rule Less than 80 percent of MSA or non-MSA median[see footnote]1
Tract (average characteristics) Median relative to MSA or non-MSA 57.5 66.6 69.6 69.0 60.2 69.3 61.1 Current rule Less than 80 percent of MSA or non-MSA median[see footnote]1
Tract (average characteristics) Housing Median house value (dollars) 98,973 94,019 53,528 51,056 97,480 52,389 92,969
Current rule Less than 80 percent of MSA or non-MSA median[see footnote]1
Tract (average characteristics) Housing Median house age (years) 30.6 33.1 33.9 35.1 31.4 34.5 31.7 Current rule Less than 80 percent of MSA or non-MSA median[see footnote]1
Tract (average characteristics) Housing Occupancy by owner 35.3 48.1 53.5 53.3 39.2 53.5 40.6 Current rule Less than 80 percent of MSA or non-MSA median[see footnote]1
Tract (average characteristics) Housing Vacancy rate[see footnote]2 9.8 9.2 15.6 18.4 9.7 16.9 10.4 Current rule Less than 80 percent of MSA or non-MSA median[see footnote]1
Tract (average characteristics) Population Over age 65 10.7 12.7 14.1 14.6 11.3 14.4 11.6
Current rule Less than 80 percent of MSA or non-MSA median[see footnote]1
Tract (average characteristics) Population Minority[see footnote]3 66.7 45.9 40.8 33.4 60.4 37.4 58.1 Current rule Less than 80 percent of MSA or non-MSA median[see footnote]1 County (average characteristics)
Population change, 1990-2000 1.1 1.2 1.1 1.0 1.1 1.1 1.1 Current rule Less than 80 percent of MSA or non-MSA median[see footnote]1 County (average characteristics) Net migration rate, 1995-99 [see footnote]4 -1 .3 2.4 .8 - . 9 - . 2 .0 - . 2
Current rule Less than 80 percent of MSA or non-MSA median[see footnote]1 County (average characteristics) Poverty rate, 2002 14.1 11.4 17.5 19.3 13.3 18.3 13.8 Current rule Less than 80 percent of MSA or non-MSA median[see footnote]1 County (average characteristics) Unemployment rate, 2001 6.0 5.6 7.6 7.2 5.9 7.4 6.1
Options Less than 90 percent of MSA median or non-MSA median[see footnote]1
Tract (average characteristics) Number added 2,622 3,384 1,157 927 6,006 2,084 8,090 Options Less than 90 percent of MSA median or non-MSA median[see footnote]1
Tract (average characteristics) Share of families with income Less than or equal to poverty level 10.0 8.2 13.7 13.3 9.0 13.5 10.2
Options Less than 90 percent of MSA median or non-MSA median[see footnote]1
Tract (average characteristics) Share of families with income Less than 50 percent of MSA or non-MSA median[see footnote]1 23.9 22.8 24.4 24.1 23.3 24.3 23.5 Options Less than 90 percent of MSA median or non-MSA median[see footnote]1
Tract (average characteristics) Share of families with income Between 50 percent and 80 percent of MSA or non-MSA median[see footnote]1 21.9 22.9 21.4 21.9 22.4 21.6 22.2 Options Less than 90 percent of MSA median or non-MSA median[see footnote]1
Tract (average characteristics) Median family income (dollars) 44,231 45,911 34,668 34,489 45,178 34,588 42,450 Options Less than 90 percent of MSA median or non-MSA median[see footnote]1
Tract (average characteristics) Median family income (dollars) Median relative to MSA or non-MSA 85.1 85.2 85.6 85.3 85.2 85.5 85.3 Options Less than 90 percent of MSA median or non-MSA median[see footnote]1
Tract (average characteristics) Housing Median house value (dollars) 121,304 103,360 64,487 59,496 111,172 62,269 98,569
Options Less than 90 percent of MSA median or non-MSA median[see footnote]1
Tract (average characteristics) Housing Median house age (years) 34.1 35.9 37.2 38.2 35.1 37.6 35.7 Options Less than 90 percent of MSA median or non-MSA median[see footnote]1
Tract (average characteristics) Housing Occupancy by owner 52.3 63.8 61.3 59.3 58.8 60.4 59.2 Options Less than 90 percent of MSA median or non-MSA median[see footnote]1
Tract (average characteristics) Housing Vacancy rate[see footnote]2 6.4 8.1 15.4 18.6 7.3 16.8 9.8 Options Less than 90 percent of MSA median or non-MSA median[see footnote]1
Tract (average characteristics) Population Over age 65 13.0 14.0 15.8 16.7 13.6 16.2 14.2
Options Less than 90 percent of MSA median or non-MSA median[see footnote]1
Tract (average characteristics) Population Minorit[see footnote]y3 40.5 24.7 19.7 15.6 31.6 17.9 28.1 Options Less than 90 percent of MSA median or non-MSA median[see footnote]1 County (average characteristics)
Population change, 1990-2000 1.1 1.2 1.1 1.0 1.1 1.1 1.1 Options Less than 90 percent of MSA median or non-MSA median[see footnote]1 County (average characteristics) Net migration rate, 1995-99 [see footnote]4 .1 3.0 2.4 .3 1.8 1.5 1.7 Options Less than 90 percent of MSA median or non-MSA median[see footnote]1 County (average characteristics) Poverty rate, 2002 13.0 10.5 14.7 15.4 11.6 15.0 12.5 Options Less than 90 percent of MSA median or non-MSA median[see footnote]1 County (average characteristics) Unemployment rate, 2001 5.8 5.4 6.6 6.1 5.6 6.3 5.8
Options Less than 100 percent of MSA median or non-MSA median[see footnote]1
Tract (average characteristics) Number added 5,125 7,453 2,937 2,063 12,578 5,000 17,578 Options Less than 100 percent of MSA median or non-MSA median[see footnote]1
Tract (average characteristics) Share of families with income Less than or equal to poverty level 9.0 7.1 11.9 11.7 7.9 11.8 9.0
Options Less than 100 percent of MSA median or non-MSA median[see footnote]1
Tract (average characteristics) Share of families with income Less than 50 percent of MSA or non-MSA median[see footnote]1 21.8 20.3 21.7 21.8 20.9 21.7 21.1 Options Less than 100 percent of MSA median or non-MSA median[see footnote]1
Tract (average characteristics) Share of families with income Between 50 percent and 80 percent of MSA or non-MSA median[see footnote]1 20.9 21.6 20.4 20.8 21.3 20.6 21.1 Options Less than 100 percent of MSA median or non-MSA median[see footnote]1
Tract (average characteristics) Median family income (dollars) 46,727 48,883 36,962 36,682 48,004 36,847 44,830 Options Less than 100 percent of MSA median or non-MSA median[see footnote]1
Tract (average characteristics) Median family income (dollars) Median relative to MSA or non-MSA 89.0 90.6 91.3 90.6 90.3 91.0 90.5 Options Less than 100 percent of MSA median or non-MSA median[see footnote]1
Tract (average characteristics) Housing Median house value (dollars) 125,857 110,561 68,236 64,522 116,781 66,704 102,523
Options Less than 100 percent of MSA median or non-MSA median[see footnote]1
Tract (average characteristics) Housing Median house age (years) 34.6 36.1 37.4 38.5 35.5 37.8 36.2 Options Less than 100 percent of MSA median or non-MSA median[see footnote]1
Tract (average characteristics) Housing Occupancy by owner 54.6 66.4 63.0 61.1 61.6 62.2 61.8 Options Less than 100 percent of MSA median or non-MSA median[see footnote]1
Tract (average characteristics) Housing Vacancy rate[see footnote]2 6.1 7.5 15.0 17.5 7.0 16.1 9.6 Options Less than 100 percent of MSA median or non-MSA median[see footnote]1
Tract (average characteristics) Population Over age 65 13.2 13.7 15.7 16.8 13.5 16.1 14.3
Options Less than 100 percent of MSA median or non-MSA median[see footnote]1
Tract (average characteristics) Population Minority[see footnote]3 37.2 21.5 16.6 13.5 27.9 15.3 24.4 Options Less than 100 percent of MSA median or non-MSA median[see footnote]1 County (average characteristics)
Population change, 1990-2000 1.1 1.2 1.1 1.0 1.1 1.1 1.1 Options Less than 100 percent of MSA median or non-MSA median[see footnote]1 County (average characteristics) Net migration rate, 1995-99 [see footnote]4 .2 2.8 2.3 .5 1.7 1.5 1.7 Options Less than 100 percent of MSA median or non-MSA median[see footnote]1 County (average characteristics) Poverty rate, 2002 12.8 10.3 14.1 14.4 11.3 14.2 12.1 Options Less than 100 percent of MSA median or non-MSA median[see footnote]1 County (average characteristics) Unemployment rate, 2001 5.8 5.3 6.4 5.7 5.5 6.1 5.7
See footnotes on page 228.

Table 15.—Continued
Percent except as noted
Item
Urban
Center city
Urban
Suburban
Rural
Exurban
Rural
Remote Total Urban
Total
Rural Total All
Less than 80 percent of state median[see footnote]5
Tract (average characteristics) Number added 902 1,100 2,082 1,407 2,002 3,489 5,491
Less than 80 percent of state median[see footnote]5
Tract (average characteristics) Share of families with income Less than or equal to poverty level 14.2 11.8 12.7 12.4 12.9 12.6 12.7 Less than 80 percent of state median[see footnote]5
Tract (average characteristics) Share of families with income Less than 50 percent of MSA or non-MSA median[see footnote]1 23.9 22.9 22.5 22.6 23.4 22.6 22.9 Less than 80 percent of state median[see footnote]5
Tract (average characteristics) Share of families with income Between 50 percent and 80 percent of MSA or non-MSA median[see footnote]1 20.6 21.2 20.5 21.1 20.9 20.7 20.8 Less than 80 percent of state median[see footnote]5
Tract (average characteristics) Median family income (dollars) 37,626 39,441 35,969 35,755 38,623 35,883 36,882 Less than 80 percent of state median[see footnote]5
Tract (average characteristics) Median family income (dollars) Median relative to MSA or non-MSA 88.0 88.6 90.3 89.0 88.3 89.7 89.2 Less than 80 percent of state median[see footnote]5
Tract (average characteristics) Housing Median house value (dollars) 98,707 92,916 66,651 62,111 95,517 64,821 76,000 Less than 80 percent of state median[see footnote]5
Tract (average characteristics) Housing Median house age (years) 32.9 35.5 37.4 38.2 34.3 37.7 36.5 Less than 80 percent of state median[see footnote]5
Tract (average characteristics) Housing Occupancy by owner 51.7 59.6 61.9 60.8 56.1 61.4 59.5 Less than 80 percent of state median[see footnote]5
Tract (average characteristics) Housing Vacancy rate[see footnote]2 7.6 9.9 15.7 18.1 8.8 16.6 13.8 Less than 80 percent of state median[see footnote]5
Tract (average characteristics) Population Over age 65 12.8 14.1 15.9 16.7 13.5 16.2 15.3 Less than 80 percent of state median[see footnote]5
Tract (average characteristics) Population Minority[see footnote]3 48.5 33.9 18.7 14.5 40.5 17.0 25.6 Less than 80 percent of state median[see footnote]5 County (average characteristics)
Population change, 1990-2000 1.1 1.1 1.1 1.1 1.1 1.1 1.1 Less than 80 percent of state median[see footnote]5 County (average characteristics) Net migration rate, 1995-99 [see footnote]4 - . 8 .6 2.5 .9 .0 1.9 1.2 Less than 80 percent of state median[see footnote]5 County (average characteristics) Poverty rate, 2002 16.6 14.0 14.6 15.0 15.2 14.7 14.9 Less than 80 percent of state median[see footnote]5 County (average characteristics) Unemployment rate, 2001 7.2 6.9 6.5 6.0 7.1 6.3 6.6
Modified CDFI Fund criteria[see footnote]6
Combined Tract (average characteristics)
Number added 1,466 1,133 1,296 939 2,599 2,235 4,834 Modified CDFI Fund criteria[see footnote]6
Combined Tract (average characteristics) Share of families with income
Less than or equal to poverty level
10.8 9.2 13.6 13.3 10.1 13.5 11.7 Modified CDFI Fund criteria[see footnote]6
Combined Tract (average characteristics) Share of families with income Less than 50 percent of MSA or non-MSA median[see footnote]1
20.8 18.4 21.6 22.0 19.8 21.8 20.7 Modified CDFI Fund criteria[see footnote]6
Combined Tract (average characteristics) Share of families with income Between 50 percent and 80 percent of MSA or non-MSA median[see footnote]1
18.4 19.0 18.4 19.2 18.6 18.8 18.7 Modified CDFI Fund criteria[see footnote]6
Combined Tract (average characteristics) Median family income (dollars)
46,066 46,384 36,635 36,788 46,204 36,699 41,810 Modified CDFI Fund criteria[see footnote]6
Combined Tract (average characteristics) Median family income (dollars) Median relative to MSA or non-MSA
97.2 99.5 96.7 94.3 98.2 95.7 97.1 Modified CDFI Fund criteria[see footnote]6
Combined Tract (average characteristics) Housing
Median house value (dollars)
125,820 107,152 66,391 62,328 117,679 64,686 93,151 Modified CDFI Fund criteria[see footnote]6
Combined Tract (average characteristics) Housing Median house age (years)
34.8 35.2 36.9 38.1 35.0 37.4 36.1 Modified CDFI Fund criteria[see footnote]6
Combined Tract (average characteristics) Housing Occupancy by owner
53.8 65.2 64.4 60.8 58.8 62.9 60.7 Modified CDFI Fund criteria[see footnote]6 Combined
Tract (average characteristics) Housing Vacancy rate[see footnote]2 6.6 8.2 15.2 18.3 7.3 16.5 11.6
Modified CDFI Fund criteria[see footnote]6
Combined Tract (average characteristics) Population
Over age 65
13.7 13.0 14.7 15.9 13.4 15.2 14.3 Modified CDFI Fund criteria[see footnote]6 Combined
Tract (average characteristics) Population Minority[see footnote]3 47.2 32.2 25.6 19.6 40.6 23.1 32.5
Modified CDFI Fund criteria[see footnote]6 Combined County (average characteristics) Population change, 1990-2000 1.1 1.1 1.1 1.0 1.1 1.1 1.1 Modified CDFI Fund criteria[see footnote]6
Combined County (average characteristics) Net migration rate, 1995-99 [see footnote]4 -4 .7 - 1 . 6 .9 -2.1 - 3 . 4 - . 3 -2.0 Modified CDFI Fund criteria[see footnote]6
Combined County (average characteristics) Poverty rate, 2002 18.6 14.9 17.6 17.0 17.0 17.3 17.2 Modified CDFI Fund criteria[see footnote]6
Combined County (average characteristics) Unemployment rate, 2001 7.8 8.1 8.6 7.3 7.9 8.0 8.0
Modified CDFI Fund criteria[see footnote]6 Unemployment Tract (average characteristics)
Number added 653 502 848 412 1,155 1,260 2,415 Modified CDFI Fund criteria[see footnote]6 Unemployment
Tract (average characteristics) Share of families with income Less than or equal to poverty level
13.3 11.4 12.4 13.5 12.5 12.8 12.6 Modified CDFI Fund criteria[see footnote]6 Unemployment
Tract (average characteristics) Share of families with income Less than 50 percent of MSA or non-MSA median[see footnote]1 21.8 19.8 21.0 22.3 20.9 21.5 21.2
Modified CDFI Fund criteria[see footnote]6 Unemployment Tract (average characteristics) Share of families with income Between 50 percent and 80 percent of MSA or non-MSA median[see footnote]1
17.5 19.0 18.7 19.4 18.1 18.9 18.6 Modified CDFI Fund criteria[see footnote]6 Unemployment
Tract (average characteristics) Median family income (dollars) 44,263 43,430 37,586 37,341 43,901 37,506 40,564
Modified CDFI Fund criteria[see footnote]6 Unemployment Tract (average characteristics) Median family income (dollars) Median relative to MSA or non-MSA
98.1 98.0 96.8 93.6 98.0 95.7 96.8 Modified CDFI Fund criteria[see footnote]6 Unemployment
Tract (average characteristics) Housing Median house value (dollars)
157,326 110,582 71,274 72,214 136,980 71,581 102,828 Modified CDFI Fund criteria[see footnote]6 Unemployment
Tract (average characteristics) Housing Median house age (years) 33.8 34.0 37.5 38.3 33.9 37.8 35.9
Modified CDFI Fund criteria[see footnote]6 Unemployment Tract (average characteristics) Housing Occupancy by owner
49.4 64.1 65.8 60.3 55.8 64.0 60.1 Modified CDFI Fund criteria[see footnote]6 Unemployment
Tract (average characteristics) Housing Vacancy rate[see footnote]2 6.4 10.2 14.5 20.5 8.0 16.5 12.4
Modified CDFI Fund criteria[see footnote]6 Unemployment Tract (average characteristics) Population Over age 65 12.9 11.9 15.0 15.5 12.4 15.2 13.9
Modified CDFI Fund criteria[see footnote]6 Unemployment Tract (average characteristics) Population Minority[see footnote]3
53.2 33.9 21.4 22.0 44.9 21.6 32.7 Modified CDFI Fund criteria[see footnote]6 Unemployment County (average characteristics) Population change, 1990-2000 1.1 1.2 1.1 1.1 1.2 1.1 1.1 Modified CDFI Fund criteria[see footnote]6 Unemployment County (average characteristics) Net migration rate, 1995-99 [see footnote]4 -2.0 2.4 2.1 .8 - . 1 1.7 .8 Modified CDFI Fund criteria[see footnote]6 Unemployment County (average characteristics) Poverty rate, 2002 21.5 16.0 16.3 17.2 19.1 16.6 17.8 Modified CDFI Fund criteria[see footnote]6 Unemployment County (average characteristics) Unemployment rate, 2001 9.9 10.8 10.0 10.2 10.3 10.0 10.2
See footnotes on page 228.

Table 15.—Continued
Percent except as noted
Item
Urban
Center city
Urban
Suburban
Rural
Exurban
Rural
Remote Total Urban
Total
Rural Total All
Poverty Tract (average characteristics)
Number added 521 131 485 368 652 853 1,505 Poverty Tract (average characteristics) Share of families with income
Less than or equal to poverty level 15.0 18.8 17.4 18.1 15.8 17.7 16.9
Poverty Tract (average characteristics) Share of families with income Less than 50 percent of MSA or non-MSA median [see footnote]1
23.1 22.6 24.1 24.9 23.0 24.4 23.8 Poverty
Tract (average characteristics) Share of families with income Between 50 percent and 80 percent of MSA or non-MSA median [see footnote]1 17.1 18.3 17.6 18.4 17.3 17.9 17.7
Poverty Tract (average characteristics) Median family income (dollars)
42,919 34,671 33,820 32,122 41,262 33,087 36,629 Poverty
Tract (average characteristics) Median family income (dollars) Median relative to MSA or non-MSA 97.3 96.0 95.0 91.8 97.1 93.7 95.1 Poverty
Tract (average characteristics) Housing Median house value (dollars)
165,803 74,434 56,220 51,471 147,360 54,172 94,491 Poverty
Tract (average characteristics) Housing Median house age (years) 33.7 31.2 35.9 36.5 33.2 36.2 34.9
Poverty Tract (average characteristics) Housing Occupancy by owner
45.9 61.1 63.7 63.9 49.0 63.8 57.4 Poverty
Tract (average characteristics) Housing Vacancy rate[see footnote]2 6.7 11.9 16.0 15.5 7.7 15.8 12.3
Poverty Tract (average characteristics) Population
Over age 65 12.8 11.1 14.3 14.7 12.5 14.5 13.6
Poverty Tract (average characteristics) Population Minority [ see footnote]3
60.9 59.1 37.7 28.7 60.6 33.8 45.4 Poverty County (average characteristics)
Population change, 1990-2000 1.1 1.2 1.1 1.0 1.1 1.1 1.1 Poverty County (average characteristics) Net migration rate, 1995-99 [see footnote]4 - 4 . 0 1.3 .6 - . 6 - 2 . 9 .1 - 1 . 2 Poverty County (average characteristics) Poverty rate, 2002 24.7 24.0 22.3 23.2 24.6 22.7 23.5 Poverty County (average characteristics) Unemployment rate, 2001 9.0 11.5 7.8 7.7 9.5 7.8 8.5
Population loss Tract (average characteristics)
Number added 1,124 613 194 364 1,737 558 2,295 Population loss
Tract (average characteristics) Share of families with income Less than or equal to poverty level
9.3 7.1 14.1 11.1 8.5 12.1 9.4 Population loss
Tract (average characteristics) Share of families with income Less than 50 percent of MSA or non-MSA median [see footnote]1 20.8 17.0 21.1 20.2 19.4 20.5 19.7
Population loss Tract (average characteristics) Share of families with income Between 50 percent and 80 percent of MSA or non-MSA median [see footnote]1
18.6 19.0 18.0 19.3 18.7 18.9 18.7 Population loss
Tract (average characteristics) Median family income (dollars) 48,241 49,149 36,513 39,179 48,561 38,252 46,055
Population loss Tract (average characteristics) Median family income (dollars) Median relative to MSA or non-MSA
96.9 101.1 98.7 96.5 98.3 97.3 98.1 Population loss
Tract (average characteristics) Housing Median house value (dollars)
135,845 106,363 55,698 59,298 125,444 58,046 109,067 Population loss
Tract (average characteristics) Housing Median house age (years) 35.8 36.3 35.6 38.2 36.0 37.3 36.3 Population loss
Tract (average characteristics) Housing Occupancy by owner 52.5 65.9 58.8 58.9 57.3 58.8 57.6
Population loss Tract (average characteristics) Housing Vacancy rate[see footnote]2
6.2 6.5 16.7 17.2 6.3 17.0 8.9 Population loss
Tract (average characteristics) Population Over age 65
14.5 14.0 14.3 16.4 14.3 15.7 14.6 Population loss
Tract (average characteristics) Population Minority [ see footnote]3 44.6 30.3 28.1 17.6 39.5 21.2 35.1
Population loss County (average characteristics) Population change, 1990-2000 1.0 1.0 1.0 .9 1.0 .9 1.0 Population loss County (average characteristics) Net migration rate, 1995-99 [see footnote]4 - 6 . 8 - 6 . 1 - 7 . 1 - 7 . 6 - 6 . 6 - 7 . 4 - 6 . 8 Population loss County (average characteristics) Poverty rate, 2002 18.2 13.8 17.0 14.5 16.6 15.4 16.3 Population loss County (average characteristics) Unemployment rate, 2001 6.8 6.1 6.3 5.1 6.6 5.5 6.3
NOTE. Data exclude tracts in U.S.-affiliated areas and tracts without income information.
[footnote] 1. See table 14, note 1. [end of footnote.] [footnote] 2. Vacant housing units as a percentage of total housing units. [end of footnote.] [footnote] 3. Non-whites or people of Hispanic origin. [end of footnote.]
[footnote] 4. Difference between net migration in 1999 and net migration in 1995 as a percentage of the population in 1997. [end of footnote.]
[footnote] 5. See table 14, note 2. [end of footnote.] [footnote] 6. For description of modification to CDFI Fund criteria, see text. CDFI Fund Community Development Financial Institutions Fund. [end of footnote.]
The profile reveals that, in rural areas, the exurban and remote tracts currently classified as lower income have similar average characteristics along most dimensions (although the number of tracts in exurban and remote areas is different). In urban areas, however, the center-city and suburban tracts with this classification are largely dissimilar. Further, a comparison of lower-income tracts in urban and rural areas reveals differences in most characteristics.
The differences between suburban and exurban tracts are a case in point: Exurban tracts have higher poverty rates, vacancy rates, and unemployment rates and lower absolute incomes, house values, and population growth rates than do suburban tracts. Although the specific tracts added by each alternative are different, their economic and demographic characteristics are similar. Under any of the alterna-
tives for expanding the class of rural CRA-eligible tracts, the rural tracts that would be newly classi-fied as CRA-eligible show more-favorable economic characteristics than do the rural tracts currently classi-fied as such. The relationship of the newly classified rural CRA-eligible tracts to urban tracts currently classified as CRA-eligible is complicated. Under any of the alternatives, the newly added rural CRA-eligible tracts would have lower poverty, unemploy-ment, and population growth rates and higher owner-occupancy and vacancy rates than would the current urban CRA-eligible tracts; median incomes for both types of tract would be about the same. Moreover, the rural tracts that would be added under the alternatives that contribute the most rural tracts (100 percent
of median family income and 80 percent of statewide median family income) show, not unexpectedly, the most-favorable economic characteristics.
When compared with the current rule (figure 3), each alternative adds a different set of newly CRA-eligible rural tracts with significantly different geo-graphic distributions. That is, with one exception, each alternative—raising the threshold from the current level to 90 percent (figure 4) or 100 percent (figure 5), changing the baseline to the statewide median income (figure 6), and adding the CDFI Fund's non-income criteria to the current 80 percent income rule (figure 7)—adds a set of tracts that differs from the other sets in terms of composi-tion (the tracts that make it up), economic and
demographic characteristics, and location.

3. Census tracts in rural counties: Share that is CRA-eligible under current rule, as of December 31, 2003
[Map of the United States with color patches marking Counties: white is urban, light blue is rural none, dark blue is rural less than 25 percent, black is rural at least 25 percent. Alaska is mostly black with patches in the other colors. Hawaii has a large island in black, a smaller island in white, and all the rest in dark blue. The continental states have mixes of all colors, with larger patches in the west than the east, and a larger percentage of space in the light blue color.]
NOTE. Under the current rule, a rural census tract is CRA-eligible if the median family income in the tract is less than 80 percent of the median family income in the nonmetropolitan portion of the state.

4. Census tracts in rural counties: Share that is CRA-eligible if the income standard is set to less than 90 percent of the median in the nonmetropolitan portion of the state, as of December 31, 2003
[Map of the United States with color patches marking Counties: white is urban, light blue is rural none, dark blue is rural less than 25 percent, black is rural at least 25 percent. Alaska is mostly black with patches in the other colors. Hawaii has a large and smaller island in black, a smaller island in white, and all the rest in dark blue. The continental states have mixes of all colors, with larger patches in the west than the east, and a larger percentage in black.]
NOTE . Under this option, a rural census tract would be CRA-eligible if the median family income in the tract was less than 90 percent of the median family income in the nonmetropolitan portion of the state.

5. Census tracts in rural counties: Share that is CRA-eligible if the income standard is set to less than 100 percent of the median in the nonmetropolitan portion of the state, as of December 31, 2003
[Map of the United States with color patches marking Counties: white is urban, light blue is rural none, dark blue is rural less than 25 percent, black is rural at least 25 percent. Alaska is mostly black with patches in the other colors. Hawaii has most islands in black, and one smaller island in white. The continental states have mixes of all colors, with larger patches in the west than the east, and a larger percentage in black and white.]
NOTE. Under this option, a rural census tract would be CRA-eligible if the median family income in the tract was less than 100 percent of the median family income in the nonmetropolitan portion of the state.

6. Census tracts in rural counties: Share that is CRA-eligible if the current 80 percent income standard is broadened f rom the nonmetropolitan portion of the state to the entire state, as of December 31, 2003
[Map of the United States with color patches marking Counties: white is urban, light blue is rural none, dark blue is rural less than 25 percent, black is rural at least 25 percent. Alaska is mostly black with patches in the other colors. Hawaii has a large and smaller island in black, a smaller island in white, and all the rest in dark blue. The continental states have mixes of all colors, with larger patches in the west than the east, and a larger percentage in black and white.]
NOTE. Under this option, a rural census tract would be CRA-eligible if the median family income in the tract was less than 80 percent of the median family income in the entire state.

7. Census tracts in rural counties: Share that would be CRA-eligible if the standard is broadened f rom the current 80 percent income standard to include any of the CDFI Fund's non-income criteria, as of December 31, 2003
[Map of the United States with color patches marking Counties: white is urban, light blue is rural none, dark blue is rural less than 25 percent, black is rural at least 25 percent. Alaska is mostly black with patches in the other colors. Hawaii has a large and smaller island in black, a smaller island in white, and all the rest in dark blue. The continental states have mixes of all colors, with larger patches in the west than the east, and a larger percentage in light blue.]
N O T E . Under this option, a rural census tract would be CRA-eligible if it met the income criteria specified by the current rule (see note to figure 3) or if it met one of the following non-income criteria established by the Community Development Financial Institutions Fund (CDFI Fund) for determining an investment area: an unemployment rate of at least 1.5 times the national average; a poverty rate of 20 percent or more; or a population loss of 10 percent or more between the previous and most-recent censuses or a net migration loss of 5 percent or more over the five-year period preceding the most recent census (see text discussion of table 14).
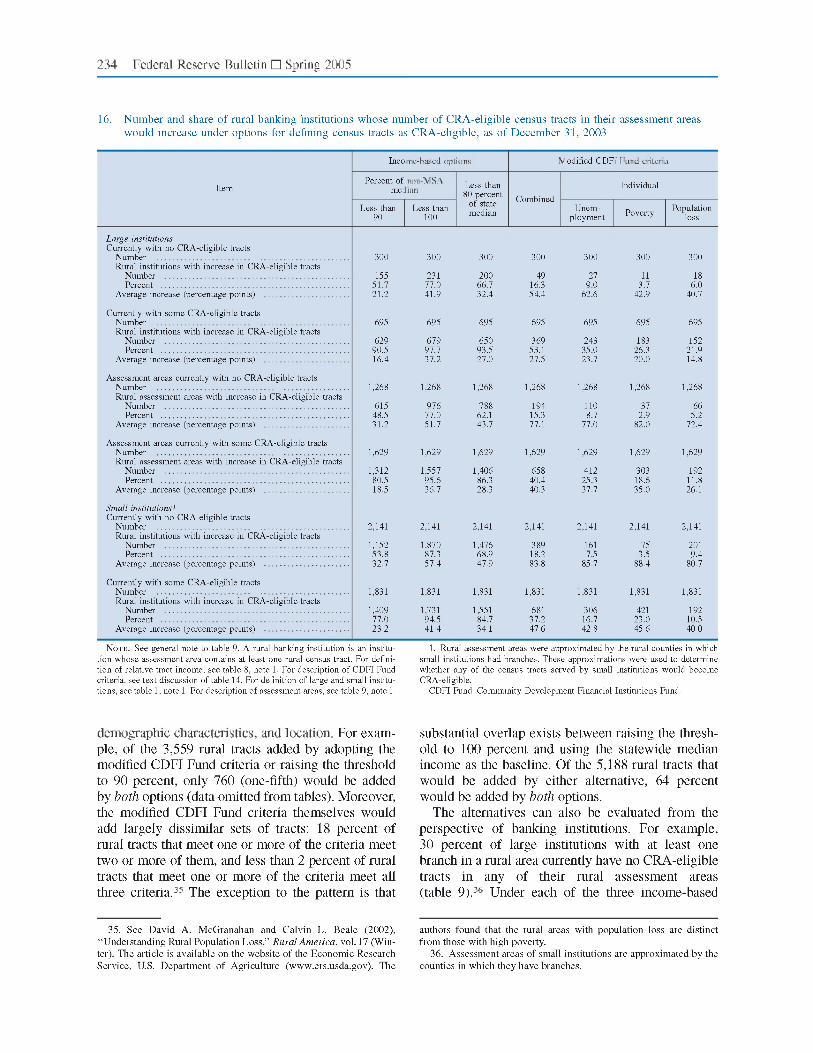
For exam-ple, of the 3,559 rural tracts added by adopting the modified CDFI Fund criteria or raising the threshold to 90 percent, only 760 (one-fifth) would be added by both options (data omitted from tables). Moreover, the modified CDFI Fund criteria themselves would add largely dissimilar sets of tracts: 18 percent of rural tracts that meet one or more of the criteria meet two or more of them, and less than 2 percent of rural tracts that meet one or more of the criteria meet all three criteria.
[footnote] 35. See David A. McGranahan and Calvin L. Beale (2002), ''Understanding Rural Population Loss,'' Rural America, vol. 17 (Win-ter). The article is available on the website of the Economic Research Service, U.S. Department of Agriculture (www.ers.usda.gov). The
authors found that the rural areas with population loss are distinct from those with high poverty. [end of footnote]
The exception to the pattern is that
substantial overlap exists between raising the thresh-old to 100 percent and using the statewide median income as the baseline. Of the 5,188 rural tracts that would be added by either alternative, 64 percent would be added by both options.
The alternatives can also be evaluated from the perspective of banking institutions. For example, 30 percent of large institutions with at least one branch in a rural area currently have no CRA-eligible tracts in any of their rural assessment areas (table 9).
[footnote] 36. Assessment areas of small institutions are approximated by the counties in which they have branches. [end of footnote.]
Under each of the three income-based
alternatives (raising the threshold to 90 percent or 100 percent or changing the baseline to the statewide median income), more than one-half of those institutions would have at least one CRA-eligible tract in at least one of their rural assessment areas (table 16).
Table 16. Number and share of rural banking institutions whose number of CRA-eligible census tracts in their assessment areas would increase under options for defining census tracts as CRA-eligible, as of December 31, 2003
Item
Income-based options
Percent of non-MSA median
Less than 90
Income-based options Percent of non-MSA
median
Less than 100
Income-based options
Less than 80 percent
of state median
Modified CDFI Fund criteria Combined
Modified CDFI Fund criteria Individual Unemployment
Modified CDFI Fund criteria
Individual
Poverty
Modified CDFI Fund criteria Individual
Population loss
Large institutions Currently with no CRA-eligible tracts
Number 300 300 300 300 300 300 300 Large institutions Currently with no CRA-eligible tracts Rural institutions with increase in CRA-eligible tracts Number 155 231 200 49 27 11 18 Large institutions Currently with no CRA-eligible tracts Rural institutions with increase in CRA-eligible tracts Percent
51.7 77.0 66.7 16.3 9.0 3.7 6.0 Large institutions Currently with no CRA-eligible tracts Average increase (percentage points)
21.2 41.9 32.4 54.4 62.6 42.9 40.7
Large institutions Currently with some CRA-eligible tracts Number 695 695 695 695 695 695 695 Large institutions Currently with some CRA-eligible tracts Rural institutions with increase in CRA-eligible tracts
Number 629 679 650 369 243 183 152 Large institutions Currently with some CRA-eligible tracts Rural institutions with increase in CRA-eligible tracts Percent 90.5 97.7 93.5 53.1 35.0 26.3 21.9 Large institutions Currently with some CRA-eligible tracts Average increase (percentage points) 16.4 37.2 27.0 27.5 23.7 20.0 14.8
Large institutions Assessment areas currently with no CRA-eligible tracts Number 1,268 1,268 1,268 1,268 1,268 1,268 1,268 Large institutions Assessment areas currently with no CRA-eligible tracts Rural assessment areas with increase in CRA-eligible tracts
Number 615 976 788 194 110 37 66 Large institutions Assessment areas currently with no CRA-eligible tracts Rural assessment areas with increase in CRA-eligible tracts Percent 48.5 77.0 62.1 15.3 8.7 2.9 5.2 Large institutions Assessment areas currently with no CRA-eligible tracts Average increase (percentage points) 31.2 51.7 43.7 77.1 77.0 82.0 72.4
Large institutions Assessment areas currently with some CRA-eligible tracts Number 1,629 1,629 1,629 1,629 1,629 1,629 1,629 Large institutions Assessment areas currently with some CRA-eligible tracts Rural assessment areas with increase in CRA-eligible tracts
Number 1,312 1,557 1,406 658 412 303 192 Large institutions Assessment areas currently with some CRA-eligible tracts Rural assessment areas with increase in CRA-eligible tracts Percent 80.5 95.6 86.3 40.4 25.3 18.6 11.8 Large institutions Assessment areas currently with some CRA-eligible tracts Average increase (percentage points) 18.5 36.7 28.3 40.3 37.7 35.0 26.1
Small institutions[see footnote]1 Currently with no CRA-eligible tracts Number 2,141 2,141 2,141 2,141 2,141 2,141 2,141 Small institutions[see footnote]1 Currently with no CRA-eligible tracts Rural institutions with increase in CRA-eligible tracts
Number 1,152 1,870 1,476 389 161 75 201 Small institutions[see footnote]1 Currently with no CRA-eligible tracts Rural institutions with increase in CRA-eligible tracts Percent 53.8 87.3 68.9 18.2 7.5 3.5 9.4 Small institutions[see footnote]1 Currently with no CRA-eligible tracts Average increase (percentage points) 32.7 57.4 47.9 83.8 85.7 88.4 80.7
Small institutions[see footnote]1 Currently with some CRA-eligible tracts Number 1,831 1,831 1,831 1,831 1,831 1,831 1,831 Small institutions[see footnote]1 Currently with some CRA-eligible tracts Rural institutions with increase in CRA-eligible tracts
Number 1,409 1,731 1,551 681 306 421 192 Small institutions[see footnote]1 Currently with some CRA-eligible tracts Rural institutions with increase in CRA-eligible tracts Percent 77.0 94.5 84.7 37.2 16.7 23.0 10.5 Small institutions[see footnote]1 Currently with some CRA-eligible tracts Average increase (percentage points) 23.2 41.4 34.1 47.6 42.8 45.6 40.0
NOTE. See general note to table 9. A rural banking institution is an institu-tion whose assessment area contains at least one rural census tract. For defini-tion of relative tract income, see table 8, note 1. For description of CDFI Fund criteria, see text discussion of table 14. For definition of large and small institu-tions, see table 1, note 1. For description of assessment areas, see table 9, note 1.
1. Rural assessment areas were approximated by the rural counties in which small institutions had branches. These approximations were used to determine whether any of the census tracts served by small institutions would become CRA-eligible.
CDFI Fund Community Development Financial Institutions Fund.

In contrast, under the alternative of the modified CDFI Fund criteria, only 16 percent of those institutions now without any rural CRA-eligible tracts would have at least one; however, the 16 percent would on average have 54 percent of the rural tracts they serve classified as CRA-eligible. Although the income-based measures affect many more institutions, the average effect on each institution is much smaller. For example, the typical institution that experienced a change under the statewide-median-income alterna-tive would end up with 30 percent of its tracts classi-fied as CRA-eligible. The difference arises from the operation of the modified CDFI Fund criteria at the county level: In our analysis, if a county meets a criterion, then all of its middle-income tracts become CRA-eligible. Each of the other, income-based alter-natives is likely to affect only a portion of the middle-income tracts in a given county.
SUMMARY OF FINDINGS
The data and the analyses reported in this article may be useful in evaluating recent proposals to revise the CRA regulations. Because of data limitations, much of the analysis uses indirect rather than direct tests. From these tests, several findings emerge.
First, we found little evidence of differences in retail lending or branching between institu-tions just below and just above the $250 million threshold that currently distinguishes institutions with small-institution evaluations from those with large-institution evaluations. Nor did we find evidence that institutions graduating from the small-institution evaluation to the large-institution evaluation signifi-cantly change their retail lending or branching behav-ior, at least in the first two years in which they are covered by the large-institution evaluation. However, the analysis was limited to inferences about the
behavior of institutions around the margin of the current threshold, $250 million. Although the evi-dence suggests that raising the threshold some amount above $250 million would not have a signifi-cant effect on retail lending or branching, it fails to reveal what amount of increase in the threshold, if any, would result in a significant effect.
Second, in our investigation of the relationship of community development lending to overall CRA ratings for institutions examined under the large-institution examination, we found fairly consistent evidence that such lending plays a relatively limited role in determining overall CRA ratings. Indeed, a significant minority of institutions received ''out-standing" ratings and reported no community devel-opment loans for three years; this finding holds true in each of several categories of institution asset size.
Third, we found little evidence to support the hypothesis that rural areas receive fewer retail loans or branches from CRA-covered institutions than do urban areas or that rural institutions have more difficulty in achieving ''outstanding" ratings. Indeed, smaller rural institutions are equally or more likely to receive ''outstanding" ratings than are smaller urban institutions. However, we found modest evidence that rural institutions are somewhat less likely to do any community development lending than are com-parable urban institutions and that they make a lower volume of community development loans. These facts support the agencies' restriction of pro-posed revisions in the criteria for area-based CRA consideration to community development activities.
Finally, in our comparison of several proposals to expand area-based CRA consideration in rural areas, we found that all of the proposals would raise the number of CRA-eligible tracts in rural areas to the same percentage (or higher) as in urban areas. And all would add tracts with better economic charac-teristics than the tracts classified as lower-income under the 1995 regulations. However, each proposal adds a different set of tracts, affects a different num-ber of banking institutions, and, in the case of insti-tutions that are affected, affects them to different degrees.