community assessment report for portland public schools head
TRANSCRIPT

Portland Public Schools Head Start
Community Assessment Report For
Portland Public Schools Head Start
Prepared by:
Population Research Center, Portland State University and
Portland Public Schools Head Start
April 2005

Portland Public Schools Head Start
Community Assessment Report For
Portland Public Schools Head Start
Prepared by:
Population Research Center, Portland State University and
Portland Public Schools Head Start
April 2005
Project Staff: Risa Proehl, Demographic Analysis Coordinator; Research Assistants: Renee Ramey, Melissa Peterson, Sonoko Endo, Erin Snider.

Portland Public Schools Head Start
1
TABLE OF CONTENTS
Page Needs of Children and Families – Key Overall Findings and Recommendations………………………..……………..…………………………...…....2 Introduction ……………………………………………………………………….………..... 5 Overview of the Portland Public Schools Head Start Program …..……………………..…… 9 Demographic and Socioeconomic Characteristics of the Portland Public Schools Head Start Service Area and Multnomah County …………..………………………….……14 Community Resources …………………………………………………………….……….. 41 Survey Findings …………………………………………………………………………….. 50 Findings from Program Information Reports ……………………...………………………...58 Appendix 1 – Initial Findings from Demographic and Socioeconomic Data for the Service Area and County ……………………………………………....…………......60 Appendix 2 – Survey Questionnaires and Response Tables ………………………….……...63

Portland Public Schools Head Start
2
NEEDS OF CHILDREN AND FAMILIES – KEY OVERALL FINDINGS AND RECOMMENDATIONS
The research findings found in this report are summarized below. Also presented are Portland Public Schools (PPS) Head Start’s recommendations for improvements to the services they provide. Overall Findings *PPS Head Start is serving the areas of greatest poverty and diversity.
Of the areas in Multnomah County, aside from downtown Portland, North Portland has the highest percentage of people in poverty, followed by Northeast Portland. The highest number of people in poverty live in Outer East Multnomah County followed by Southeast, Northeast and North. The population in the PPS Head Start service area has a larger proportion of minority groups than in Multnomah County as a whole. The five current PPS Head Start Centers are located in North, Northeast and Outer Southeast Portland, areas of greatest poverty and diversity. PPS Head Start 2003-2004 enrollment data show that low income, diverse student growth is greatest in North and Northeast Portland. *Need for services for children and families exceeds current capacity. The need for services for eligible children and families is increasing. The number of children under six years old is increasing in Multnomah County. Over 40% of households with children in the PPS Head Start service area are single-parent households and are increasing at a rapid rate. The number of children under six residing in households with income below the poverty level is increasing in the service area. In the service area, the proportion of these households is increasing and makes up almost 25% of all households with children under six. Children under six residing in single-parent households represent approximately 65% of children’s households with income below poverty level. These populations make up a large proportion of PPS Head Start’s currently enrolled children and families. An increase in single-parent households is expected to increase PPS Head Start’s own eligibility pool. Currently only about 48% of Multnomah County’s eligible children and families are being served in Head Start programs; the percentage served in PPS Head Start’s service area is estimated to be even less. The PPS Head Start program has waiting lists for each of the 8 sites, with the longest lists in North and Northeast Portland.
*Families with young children are in need of affordable childcare. There is an unmet need for childcare in Portland for children ages 0-5 and it is estimated that the need is for least a few thousand slots. Sixty-nine percent of the respondents in current family survey expressed a desire for a 5-day per week Head Start program; 67% indicated a need for at least part-time weekly childcare. Despite high unemployment rates, the number of persons in the service area that are in the labor force has been increasing, which means there has been an increase in the number of persons residing in the service area that are willing to work. About 59% of persons in the PPS service area 25 years old and over have no college degree and many lack the education and training

Portland Public Schools Head Start
3
for high wage jobs. About 26%, or 33,500 households in the service area had an annual income of less than $20,000 in 2003. It is expected that when the economy improves and more jobs are available, the number of employed persons with children will increase, and the need for affordable childcare will continue. *More children and families speak a language other than English in the home. The number and percentage of persons who speak little or no English are increasing. Currently 51% of PPS Head Start children and families speak a language other than English at home. The number who speak Spanish is increasing at the fastest rate with 33% of current program families speaking Spanish at home. The number of persons in the service area who speak Spanish or an Asian or Pacific Islander language has been increasing since at least 1996.
*Mental health needs of children in the PPS Head Start program have increased substantially. Eight years ago only 5% of enrolled children were referred for mental health support. In 2003-2004, 26% were referred and 21% received mental health services. In Multnomah County, the number of children under six years of age receiving mental health services with public health insurance has increased by 9.2% from 1995 to 1998. * The enrollment of three year olds has decreased to 12% from 19% in the last three years. This reflects the larger number of eligible four years olds on the waiting list who are given enrollment priority. * The significant decrease in number of Early Childhood Education Centers in the Portland Public Schools Jefferson cluster will increase the number of eligible Head Start children who are not receiving preschool services.
Recommendations *Expand services to accommodate more children and families. Although Multnomah County’s growth rate is slowing, there are significant numbers of eligible children and families not yet served. *Expand services to children and families whose parents work or are in school. The number of eligible families who work is increasing. This suggests a need for more options for families including full day classrooms and longer hours in PPS Head Start’s single session model. Because a significant portion of PPS Head Start families are unemployed or working part time or seasonally, the need for a part day model continues. There is also a need for stronger childcare information and referral systems and increased community partnerships with childcare providers including wrap around services.

Portland Public Schools Head Start
4
*Expand services to children and families who speak a language other than English in the home. As this population continues to increase, PPS Head Start’s need for more bilingual/bicultural staff to work with children and families will grow. An increased demand for adult ESL classes among Head Start families is anticipated. *Support pre-employment and job training needs. As more parents return to work, and more are employed at low paying jobs, the need for adult literacy classes will grow. The need to strengthen PPS Head Start networking with local job training and job placement resources is anticipated. *Increase Mental Health support for English Language Learning (ELL) children and families. Increases in mental health referral and service levels point to the need for increased support in this area, particularly for additional services of bilingual mental health therapists. City and County partnerships need to be explored. *Gather further information from current waitlists and enrollment data to answer these questions: What is the level of need for extended day classrooms? What is the level of need for part day classrooms?
What models for the above programs would best meet parent needs? Are the current configurations at each site best meeting families’ needs?
*Ongoing evaluation of the implications of closing PPS Early Childhood Education Centers on the waitlists of eligible children in the Jefferson cluster.

Portland Public Schools Head Start
5
INTRODUCTION Background From a summer project that enrolled 561,000 children nationally in 1965, Head Start has grown into a comprehensive child development program providing educational, social, nutritional, and health services for America’s low-income children and their families. Over its 40-year history, Head Start’s success stories with children and families are legion. An untold story, however, is the vital part community partnerships and collaborations have played. Head Start community partners include health and mental health providers, agencies that provide services to children with disabilities, child protective services, childcare organizations, and local schools, colleges and universities. From its beginnings, Head Start has involved parents in every aspect of the program as volunteers. Thousands of parents volunteer for local programs each year. They may help teachers supervise children’s play, tell them stories or go on field trips. Parents receive training on how to encourage and support their children’s development. They also receive services through Head Start such as job, ESL, or literacy training. Many gain the confidence to return to school or seek better jobs. As it has grown in size, Head Start has also broadened its work. It has added programs for children with disabilities. Today Head Start operates almost 15,000 centers in all 50 states, the District of Columbia, Puerto Rico and the U.S., and serves over 800,000 children. Our Portland Public Schools Head Start serves 629 children using Federal Head Start, Oregon Pre-Kindergarten, Title I and City funds. The federal Head Start Bureau has routinely monitored local performance to ensure that Head Start programs consistently provide high quality comprehensive services. Regularly gathering information about Head Start’s community needs and resources is key to assuring that local programs continue to adequately serve children and families. Portland Public Schools (PPS) along with other Multnomah County Head Start Programs, contracted with Portland State University’s Center for Population Research to conduct a community assessment. The purpose of the Community Assessment is to determine the needs of the Portland Public Schools Head Start community, evaluate the quality of services provided by Portland Public Schools Head Start, and to make recommendations for service improvements.
The Portland Public Schools Head Start community is comprised of currently enrolled children and families and Head Start staff. The community also consists of the population-at-large and community professionals offering services in the PPS Head Start service area, and in Multnomah County. This report contains a description of the community’s demographic and socioeconomic composition, an evaluation of PPS Head Start program satisfaction, and key findings and recommendations. Also reported are key variables related to Head Start eligible children and their families. Some of the variables are the number of households with below-poverty income, employment status and educational attainment of parents, and special needs population groups of children.
Portland Public Schools Head Start
6
Methods This report relies on the most current data available. Much data were obtained from the U.S. Census Bureau, local governmental agencies, and from researching documents on the Internet. Other data were obtained from three surveys that were conducted by mail and/or home visits in order to collect current information about demographics and program satisfaction from PPS Head Start families and community partners. In addition, information from recent PPS Head Start in-house data were utilized in this report. If current community data were not available from sources, we prepared estimates. Most data in the ‘Demographic and Socioeconomic Characteristics’ section of this Report shown for the service area in 2003 were estimated by applying standard demographic techniques to data known for earlier points in time, or based on the relationship between the service area and Multnomah County. Inferences, or findings, about the PPS Head Start community were made by analyzing data from all sources. Sources A variety of sources were used to determine the characteristics of the PPS Head Start community. Much data were gathered from the 2000 U. S. Census and the Census Bureau’s 1996 and 2003 American Community Survey. Data were also obtained from various State and local social service agencies, from PPS Head Start, and from the recently conducted surveys. The following is a list of sources used to prepare the sections of this report. Needs of Children and Families – Key Overall Findings and Recommendations: The findings and recommendations were made from the analysis of the demographic and socioeconomic data for Multnomah County and the PPS Head Start service area, and the analysis of surveys responses and PIR data for PPS Head Start enrolled Children and their families. Additional sources are PPS Head Start enrollment and program data; and Portland Public Schools 2005-2006 Budget information and reports. Overview of the PPS Head Start Program: Program Information Reports (PIR), 2000-2003; PPS Head Start In-house Annual Survey of Head Start Families and Children; Current Family Survey, 2004; Past Family Survey, 2004; Survey of Community Partners, 2004. Demographic and Socioeconomic Characteristics of Children and Families in Service Area and Multnomah County: U.S. Census, 1990 and 2000; American Community Survey, U.S. Census Bureau, 1996 and 2003; RLIS Lite, Metro, 2000; “Poverty in Multnomah County: A Descriptive Report”, Office for Community Action and Development, Department of Community and Family Services, Multnomah County, 1996; Oregon Health Division; State Services for Children and Families; Office of Medical Assistance Programs, OR Department of Human Services; Oregon Mental Health Services; Office of Student Services, OR Department of Education; Population Research Center, Portland State University.

Portland Public Schools Head Start
7
Community Resources: The list of community partners and their descriptions were provided by PPS Head Start; Portland Public Schools Head Start Community Resource Manual; telephone contact with community partners. Survey Results: Surveys were given to currently enrolled PPS Head Start families, to formerly enrolled Head Start families, and to PPS Head Start Community Partners. The responses were analyzed and findings were developed. Initial Findings from PIR Data: PPS Head Start in-house PIR data from school years 2000-01 to 2003-04 were analyzed and significant information on student/family characteristics or change during the time period was noted. Project Staff This report involves the work of faculty and staff at Portland State University, including: • Risa Proehl is Demographic Analysis Coordinator at the Population Research Center. She
acted as the project manager. She developed the research and reporting techniques for all sections of the report and was responsible for the final preparation of the report.
• Melissa Peterson, a Research Assistant at the Population Research Center, managed the tracking of the survey mailings and returns, and assisted with reporting the survey results.
• Renee Ramey, graduate student in the School of Urban Studies and Planning, assisted with the compilation of the demographic and socioeconomic database, compilation of the PIR data and survey responses, making findings, and the preparation of the final report. She also obtained and compiled the Community Resource information.
• Sonoko Endo, graduate student in the School of Urban Studies and Planning assisted with the compilation of the survey responses, and the preparation of the final report.
• Erin Snider, work study student in the Population Research Center, provided assistance with conducting the surveys.
Deborah Berry, Director, Eileen Isham, Co-Director of PPS Head Start and the PPS Head Start management team were responsible for developing the key overall findings and recommendations concerning the needs of children and families, and for writing about the Head Start program background and overview. Staff from several State and local social service agencies also cooperated with the work, providing information about their services and special needs data for Multnomah County. Although these people are too numerous to list, they deserve thanks for their cooperation and assistance.
Portland Public Schools Head Start
8
Organization of this Report This report is divided into the following sections: • Needs of Children and Families – Key Overall Findings and Recommendations made from
the research conducted in this report • Introduction – project description and purpose • Overview of the Portland Public Schools Head Start Program - program description and
background • Demographic and Socioeconomic Characteristics of Portland Public Schools Head Start
Service Area and Multnomah County (including special needs children) – data presented in tables and graphs and analysis of the service area and County
• Community Resources – a compilation of the resources that are available to Head Start families and children
• Survey Results – findings from the family and community partner surveys • Findings from the Program Information Report data • Appendices
- Initial findings from the demographic and socioeconomic data - Survey Questionnaire and Response Tables

Portland Public Schools Head Start
9
OVERVIEW OF THE PORTLAND PUBLIC SCHOOLS HEAD START PROGRAM Head Start is a nation-wide, equal opportunity preschool program designed for children from low-income families. The Head Start program has played a major role in focusing attention on the importance of early childhood development by providing a variety of educational and social activities that assist in the healthy development of children and families. Families whose annual income is below the Federal poverty level (currently $19,350 for a family of four) are eligible for Head Start services. Currently, Head Start is sponsored by the Administration for Children and Families under the United States Department of Health and Human Services. Head Start programs are designed to help in four important areas: education, health, parental involvement and social services. These components assist the lives of the adults as well as the children, therefore improving the home environment of the child. Programs provide for adults include training for job skill development, literacy programs and GED preparation, health and nutrition, ESL classes and other educational opportunities. Assistance is also available for family members of a Head Start child, including counseling for drug and alcohol abuse and job loss. Head Start is actively involved with other community support agencies, referring families to other agencies for assistance with TANF assistance programs, medical and employment needs. Description of Portland Public Schools Head Start Program PPS Head Start serves children and families on the East side of the Willamette River within the Portland Public Schools district boundary, primarily in North Portland, Northeast and Southeast Portland. PPS Head Start is a center-based program located at eight sites - Sacajawea School, Lent Elementary School, Kelly Annex, Beach Elementary, Peninsula Elementary School, Creston Elementary Annex, Faubion Elementary School and James John Elementary School. PPS Head Start serves low-income families with pre-school children in the Portland Metropolitan area. The PPS Head Start service area primarily covers the north, northeast and southeast areas of Multnomah County (see Figure 1). Services provided by PPS Head Start to participating children and families are broad based and cover a wide range of core Head Start activities. The services PPS Head Start provide are also operated in conjunction with a variety of outside agencies, enabling parents and children to obtain more comprehensive services with less duplication by other organizations. PPS Head Start currently offers a pre-school program for three and four-year-olds and adult-family-oriented educational and social services. Seventeen classrooms operate on a double session schedule - morning (8:45a.m. -11:45p.m.) and afternoon (12:15a.m. -3:15p.m.) - with 12 classrooms operating on an extended day model. Classes are held four days per week at each of the five centers. Breakfast, lunch and snacks are provided by PPS kitchens. Each classroom team is comprised of a certified teacher, a full time assistant and a part time assistant. Classroom support staff includes bilingual assistants, speech and early intervention specialists (MECP), family service staff, mental health consultants, a registered nurse, and a social worker.

Portland Public Schools Head Start
10
Vision, height, weight, and speech and language screenings are completed after entering the program. Medical and mental health referrals are provided as needed. Further in-depth assessment by a specialist is provided as indicated for children with special needs. Additional services provided to families include parental support education training, social interaction skills for parents and children, peer involvement and community outreach efforts that seek to involve parents in the community. Parental input and involvement is an essential component of PPS Head Start, and the influence of parent volunteers, committee members, and the Policy Council members affects many PPS Head Start decisions. The curriculum is developed and refined with sensitivity to the diverse needs of the children and families served. The creation of an individual education plan begins with the development of a unique relationship with each child’s parents/caregivers. The curriculum is developed and implemented based upon the identified strengths, needs and interests of individual children, with parent/family collaboration. From the first home visit, the parent’s goals for their child are incorporated into the teacher’s planning. The child’s individual education plan incorporates input from the initial parent goal setting visit, from screenings, ongoing classroom assessments and anecdotal records, culminating with the development of the child’s comprehensive individual learning plan (ILP). Teachers also develop and provide home education curriculum materials and activities to help parents support attainment of their child’s goals. The curriculum and lesson plans designed by each teacher reflect this individualization. Four formal parent contacts throughout the school year give parents ongoing feedback and input regarding their child’s progress in achieving their goals. Parent/guardian input is incorporated into every aspect of the program. Head Start Family Service Workers engage parents in a collaborative partnership to establish mutual trust. Together they develop an individualized partnership agreement that describes family strengths, and goals along with responsibilities, timetables, and strategies for achieving these goals. Over the course of the year they work towards these goals and monitor the progress. The Family Literacy Program for adult parents and guardians helps those who want to improve their listening, speaking, reading, writing and math skills (ABE). General Educational Development (GED) classes are also available for those working toward their high school diploma and English as Second Language (ESL) classes for those wanting to improve their English skills. Career development, computer access, and special presentations are also available. PPS Head Start also provides a resource and referral network. If a parent, for example, has a need, which either cannot be met by PPS staff on-site, or the parent would prefer to receive assistance off-site, Family Service staff directs him/her to the appropriate resources using an extensive network of providers and programs.

Portland Public Schools Head Start
11

Portland Public Schools Head Start
12
Program Funding from Portland Public Schools PPS Head Start child enrollment is funded by federal, state, city and Title I funds. Portland Public Schools (PPS) is the PPS Head Start grantee, providing facilities and fiscal management support. PPS has presented their proposed budget for 2005-2006, projecting a total loss of over 54 million dollars. A portion of this budget decrease will be the permanent loss of desegregation funds. Historically, desegregation funds were used to support Early Childhood Education Centers, in addition to other programs in the district. The number of these preschool classrooms will be substantially decreased for the 2005 school year. Characteristics of Program Children and Families Yearly program data have shown six major trends since 2000. First, the number of children in the program is increasing indicating a need for PPS Head Start. Second, PPS Head Start’s racial/ethnic minority population has increased dramatically, especially the Hispanic population, which surpasses whites as the largest racial/ethnic group. Third, the number of PPS Head Start’s children and families who speak a language other than English in the home has also dramatically increased, representing almost 50 percent of enrolled families. Fourth, the number of PPS Head Start families needing full-day, full-year childcare has increased. Fifth, there has been an increase in the number of enrolled children that were referred for mental health support and an increase in the number receiving mental health services. In 2003-2004, 26 percent of enrolled students were referred and 21 percent received mental health services. Lastly, there was an increase in the number of enrolled parents receiving emergency/crisis intervention and ESL services. Correspondingly, the number of unemployed parents of currently enrolled children has increased. These trends are all reflected in the demographic and socioeconomic characteristics of the service area. During the current program year, 688 children and their families have been served to date including those who have withdrawn. Eighty-two percent of enrolled children are four years old, and 18 percent are three years old. Of these students, 20 percent are white, 38 percent Hispanic, 11 percent Asian, 17 percent Black, 1 percent American Indian, 1 percent Pacific Islander, and 11 percent are multi-racial. The native language of most of the PPS Head Start students is English – 52 percent, followed by Spanish at 33 percent, and Asian/Pacific Islander at 12 percent and 3 percent other languages. To date 86 percent have completed documentation of having a medical home and 85 percent have completed dental exams. Fifteen percent of the enrolled children have identified disabilities. Information on Family Satisfaction with Program Services Parent Evaluations are collected in the spring, from parents of currently enrolled children, on a yearly basis. The return rate in spring 2004 was approximately 80 percent. Analysis of the 2000 data have been compared with data from spring 1999 and spring 1989. This analysis indicates very strong evidence of parent satisfaction with the program over an 11-year period (98%). Specific increases in satisfaction are with teacher’s aptitude, attitude and manner, as well as

Portland Public Schools Head Start
13
classroom curriculum and child learning. Data show that parents are consistently satisfied with Head Start’s goal of increasing social competence in children. Approximately 14 percent of the responses in 2000 indicated they would prefer increased hours (compared with 10% in 1989). The primary reasons specified are for convenience and more time for the child in a quality setting. The percentage of parents indicating that they have difficulty participating in parent activities and trainings has remained constant from 1989 to 2000 at 3 percent.

Portland Public Schools Head Start
14
DEMOGRAPHIC AND SOCIOECONOMIC CHARACTERISTICS OF THE PORTLAND PUBLIC SCHOOLS HEAD START SERVICE AREA
AND MULTNOMAH COUNTY Population The total population in PPS Head Start’s service area in 2003 is estimated to be about 322,686, which represents 48 percent of Multnomah County’s population. The population of children under 6 years of age is estimated to be approximately 23,474. The service area’s total population has increased since 1996 at an average annual rate of less than one percent; the number of children under six has decreased at a slightly faster pace. The proportion of children ages 0-5 to the total population in the service area has declined by almost one percentage point from 1996 to 2003. It is estimated that children under six accounted for about 7 percent of the service area’s total population in 2003. In Multnomah County, the number of children under six has increased since at least 1996, but its proportion to the total county population has slightly fluctuated. Table 1. Population
Total Population Population Under 6 Years Old
Year Service Area Multnomah
County Service Area % PopulationMultnomah
County % Population1996 (est.)* 306,598 625,370 25,210 8.2% 50,021 7.9% 2000 317,681 660,486 23,659 7.4% 50,392 7.6% 2003 (est.)* 322,686 678,262 23,474 7.3% 52,914 7.8% Ave. Annual Growth Rate 1996 - 2000 0.9% 1.4% -1.6% 0.2% Ave. Annual Growth Rate 2000 - 2003 0.5% 0.9% -0.3% 1.6% *Data from U.S. Census Bureau's American Community Survey are available for household population only for 1996 and 2003; total population is estimated.

Portland Public Schools Head Start
15
Figure 2. Population of Service Area by Age
Service Area
0
5,000
10,000
15,000
20,000
25,000
30,000
35,000
0-4
5-9
10-1
4
15-1
9
20-2
4
25-2
9
30-3
4
35-3
9
40-4
4
45-4
9
50-5
4
55-5
9
60-6
4
65-6
9
70-7
4
75-7
9
80-8
4
85+
Persons
Age
Gro
up
2000
2003 (est)
Race and Ethnicity In general, the white population has been decreasing and the combined ethnic minority population has been increasing in both the service area and in Multnomah County. In the service area, it is estimated that the ethnic minority population increased by 27 percent from 1996 to 2003 with an average rate of 3.4 percent per year. From 2000 to 2003, the population of the ethnic minority groups in the service area except Native American and “other race” have been increasing in number. The Hispanic group grew at the fastest pace with an average annual rate of 5.3 percent.

Portland Public Schools Head Start
16
Table 2. Population by Race/Ethnicity
White Black Native Asian Other* Hispanic Total
Minority Service Area 1996 231,712 34,714 3,517 20,167 1,219 15,270 74,886 2000 228,908 28,498 3,036 21,209 12,762 23,269 88,773 2003 (est.) 227,434 31,251 2,470 22,447 11,780 27,304 95,252 Ave. Annual Growth Rate 1996 - 2000 -0.3% -4.9% -3.7% 1.3% 58.7% 10.5% 4.3% Ave. Annual Growth Rate 2000 - 2003 -0.2% 3.1% -6.9% 1.9% -2.7% 5.3% 2.3% Multnomah County 1996 510,867 42,000 6,619 35,764 1,840 28,280 114,503 2000 505,492 36,592 5,754 39,550 23,491 49,607 154,994 2003 (est.) 507,459 38,986 4,825 44,231 21,833 60,929 170,804 Ave. Annual Growth Rate 1996 - 2000 -0.3% -3.4% -3.5% 2.5% n/a 14.0% 7.6% Ave. Annual Growth Rate 2000 - 2003 0.1% 2.1% -5.9% 3.7% -2.4% 6.9% 3.2% *The large difference in numbers between 1996 and 2000 is due to a change in the way racial groups were counted by the U.S. Census Bureau; 2000 and 2003 Includes persons identifying themselves as ‘other’ race and those identifying themselves with 2 or more races. The proportion of the total population that ethnic minorities represent has consistently been higher in the service area than in Multnomah County during 1996 to 2003. Figure 3. Percent Minority Population
Percent Minority Population
0.0%
5.0%
10.0%
15.0%
20.0%
25.0%
30.0%
35.0%
Service Area Multnomah Co.
1996 2000 2003

Portland Public Schools Head Start
17
In 2003, Whites represented less than three-quarters of the total population in both the service area and in Multnomah County. The share that whites represent of the total population has decreased from 1996 to 2003 by over 5 percentage points, while Blacks, Asians, and Hispanics have increased since at least 2000. Of the minority groups in the service area, Blacks capture the highest portion, followed by Hispanics and Asians. Table 3. Race/Ethnicity as a Percent of the Total Population
%White %Black %Native %Asian %Other %Hispanic Total
Minority Service Area 1996 75.6% 11.3% 1.1% 6.6% 0.4% 5.0% 24.4% 2000 72.1% 9.0% 1.0% 6.7% 4.0% 7.3% 27.9% 2003 (est.) 70.5% 9.7% 0.8% 7.0% 3.7% 8.5% 29.5% Multnomah Co. 1996 81.7% 6.7% 1.1% 5.7% 0.3% 4.5% 18.3% 2000 76.5% 5.5% 0.9% 6.0% 3.6% 7.5% 23.5% 2003 74.8% 5.7% 0.7% 6.5% 3.2% 9.0% 25.2%
Births In 2002, there were about 4,500 births in the service area. The number of births in the service area has decreased from 1996 to 2002 by 5.8 percent. The average annual rate of decrease has been about 1 percent, or 46 fewer births per year. Births increased in Multnomah County during the same time period by 2.4 percent with an average annual increase of about 36 births per year. Figure 4. Births Per Year
0
1,000
2,000
3,000
4,000
5,000
6,000
7,000
8,000
9,000
10,000
1996 1997 1998 1999 2000 2001 2002
Mult. Co.PPS HS Service Area
The percentage of births in the service area by race/Hispanic origin is shown in the charts below. Overall since 1996, the number of births identified as white has decreased and conversely, the number of combined ethnic minority births has increased. Ethnic minority births accounted for 45 percent of all births in the service area in 2002. Hispanic and Asian births, and births identified as of the “other” race have increased; births to other racial group have decreased. Of

Portland Public Schools Head Start
18
the ethnic minority groups, most births have occurred in the Hispanic and Black population groups. Figure 5a. Percent Births by Race/Ethnicity The fertility rate and its trends for the service area are believed to be similar to fertility in Multnomah County. The total fertility rate for the County has gradually decreased during the 1990s to 2002. The rate at which women bear children declined from 1.89 births per woman of child-bearing age in 1998 to 1.78 births in 2002. Figure 6. Multnomah County Fertility
1.65
1.70
1.75
1.80
1.85
1.90
1.95
2.00
1990 1998 2000 2002
Bir
ths p
er W
oman
Age
s 10-
49
The greatest decrease in fertility from 1998 to 2002 has occurred in the 25-29 age group, while there were increases in the number of births to women in the older age groups. The charts below show the number of births per 1,000 women by age-group.
Figure 5b. Percent Births by Ethnic Minority Origin Percent Births by White/Ethnic Minority Origin,
Service Area
0%10%20%30%40%50%60%70%80%
1996 1997 1998 1999 2000 2001 2002
WhiteMinority Total
Percent Births by Ethnic Minority Origin,Service Area
0%
5%
10%
15%
20%
25%
1996 1997 1998 1999 2000 2001 2002
Black Hispanic Asian Am. Native Other

Portland Public Schools Head Start
19
Households The number of households in service area in 2003 is estimated to be 133,500 with an average annual growth rate since 1996 of under one percent. Growth rates are slightly higher in Multnomah County. Households are growing at similar rates as population in both the service area and the County. The number of persons per household (PPH) is approximately 2.36 in the service area and 2.40 in the County. The PPH increased slightly in Multnomah County from 1996 to 2003. Table 4. Households
Total Households Persons Per Household
Year Service Area
Multnomah County
Service Area
Multnomah County
1996 127,613 260,797 2.36 2.34 2000 132,141 272,098 2.35 2.37 2003* 133,500 275,491 2.36 2.40 Ave. Annual Growth Rate 1996 - 2000 0.9% 1.1% Ave. Annual Growth Rate 2000 - 2003 0.3% 0.4%
*Service Area figures are estimated. Of all households in the service area and in Multnomah County, family households with children represent 24.6 percent and 27.5 percent respectively. The number of single-parent households has been increasing in both areas while married-couple households with children have been decreasing (see Tables 5 and 6).
Figure 7b. Age-specific Fertility Rates, Multnomah County, 2000-2002
Figure 7a. Age-specific Fertility Rates, Multnomah County, 1996-2000
0
20
40
60
80
100
120
10-14 15-19 20-24 25-29 30-34 35-39 40-44 45-49Age of Mother
Age
-spe
cific
Fer
tility
Rat
e(b
irths
per
1,0
00 w
omen
) 19982000
0
20
40
60
80
100
120
10-14 15-19 20-24 25-29 30-34 35-39 40-44 45-49Age of Mother
Age
-spe
cific
Fer
tility
Rat
e(b
irths
per
1,0
00 w
omen
)
20002002

Portland Public Schools Head Start
20
Table 5. Children’s Households by Family Type, Service Area (children under 18)
Service Area
Total Family Households w/ Children
Married-Couple
Family w/ Children
% All Children’s
HH
Single-Father w/ Children
% All Children’s
HH
Single-Mother w/ Children
% All Children’s
HH 1996 35,859 21,437 59.8% 2,862 8.0% 11,560 32.2% 2000 33,043 20,815 63.0% 2,855 8.6% 9,373 28.4% 2003 (est.) 32,828 19,512 59.4% 3,497 10.7% 10,279 31.3% Ave. Annual Growth Rate 1996 - 2000 -2.0% -0.7% -0.1% -5.2% Ave. Annual Growth Rate 2000 - 2003 -0.2% -2.2% 6.8% 3.1% Table 6. Children’s Households by Family Type, Multnomah County (children under 18)
Multnomah County
Total Family Households w/ Children
Married-Couple
Family w/ Children
% All Children’s
HH
Single-Father w/ Children
% All Children’s
HH
Single-Mother w/ Children
% All Children’s
HH 1996 72,969 47,803 65.5% 5,688 7.8% 19,478 26.7% 2000 72,114 48,709 67.5% 5,806 8.1% 17,599 24.4% 2003 75,763 47,416 62.6% 7,237 9.6% 21,110 27.9% Ave. Annual Growth Rate 1996 - 2000 -0.3% 0.5% 0.5% -2.5% Ave. Annual Growth Rate 2000 - 2003 1.6% -0.9% 7.3% 6.1% Language and Ability to Speak English The number of persons who do not speak English or who do not speak English well, is increasing in both the service area and in the County. It is estimated that in 2003 that they represented about 5 percent of the population 5 years of age and older in the service area. Approximately 80 percent of those not speaking English spoke either Spanish or and Asian/Pacific Islander language at home. Spanish speaking persons who speak little to no English are growing at the fastest rate.

Portland Public Schools Head Start
21
Table 7. Ability to Speak English and Language Spoken at Home
Persons 5 Yrs and Over Who Speak
English ‘Not Well’ or ‘Not at All’ % of Persons 5 Yrs and Over Who Speak
English ‘Not Well’ or ‘Not at All’
Total Persons
Speak Spanish
at Home
Speak an Asian/ Pacific
Islander Language at
Home
Speak a Language
Other than Spanish or
Asian/ Pacific Islander at
Home Total
Population
Speak Spanish
at Home
Speak an Asian/ Pacific
Islander Language at
Home
Speak a Language
Other than Spanish or
Asian/ Pacific Islander at
Home Service Area
1996 11,937 3,256 5,866 2,815 4.3% 27.3% 49.1% 23.6% 2000 15,302 6,340 5,716 3,246 5.1% 41.4% 37.4% 21.2% 2003 (est.) 16,760 7,124 6,229 3,407 5.2% 42.5% 37.2% 20.3% Ave. Annual Growth Rate 1996-2000 6.2% 16.7% -0.6% 3.6% Ave. Annual Growth Rate 2000-2003 3.0% 3.9% 2.9% 1.6%
Multnomah County
1996 20,270 6,414 8,530 5,326 3.6% 31.6% 42.1% 26.3% 2000 29,981 13,738 8,763 7,480 4.8% 45.8% 29.2% 29.2% 2003 34,188 15,599 10,303 8,286 5.5% 45.6% 30.1% 24.2% Ave. Annual Growth Rate 1996-2000 9.8% 19.0% 0.7% 8.5% Ave. Annual Growth Rate 2000-2003 4.4% 4.2% 5.4% 3.4%

Portland Public Schools Head Start
22
Mobility Over half of the population 5 years old and over in the service area and in Multnomah County moved within the last five years. Of those persons who moved, the largest percentage (more than half) moved from within Multnomah County followed by those who moved from out-of-state. The number of persons who moved within the County or from another county in Oregon has been decreasing. In the service area, the number of persons who moved from out-of-state has been increasing, but has remained stable in Multnomah County. In 2003, approximately 18 percent persons residing in the service area moved within the previous 12 months. Most movers stayed in Multnomah County. Table 8. Mobility of Persons 5 Years Old and Over
Residence 5 Years Ago
% Who Stayed in
Same House
% Total Persons Who
Moved
% Who Lived in Multnomah
County, but Not Same House
% Who Lived in Another
County
% Who Lived in Another State, Puerto Rico, or U.S. Territory
% Who Lived in a Foreign Country
Service Area 1996 47.8% 52.2% 56.5% 14.1% 22.5% 6.9% 2000 46.2% 53.8% 54.9% 13.4% 24.8% 6.9% 2003 (est.) 45.0% 55.0% 53.7% 12.8% 26.7% 6.8% Multnomah
County 1996 47.3% 52.7% 54.6% 15.5% 23.6% 6.3% 2000 44.9% 55.1% 54.2% 14.8% 23.5% 7.5% 2003 43.2% 56.8% 53.9% 14.3% 23.3% 8.5%
Residence 1 Year Ago
% Who Stayed in
Same House
% Total Persons Who
Moved
% Who Lived in Multnomah
County, but Not Same House
% Who Lived in Another
County
% Who Lived in Another State, Puerto Rico, or U.S. Territory
% Who Lived in a Foreign Country
Service Area 2003 (est.) 85.2% 18.1% 63.9% 13.1% 18.9% 4.1% Multnomah County 2003 81.4% 18.6% 63.8% 14.6% 16.4% 5.1% Educational Attainment It is estimated that in 2003, about 132,500 persons, or 59 percent of persons 25 years of age and over in the service area did not hold a college degree. Of this population group, 79,300 had not attended college at all. Of persons 25 years and over in the service area, about 32,250, or 14 percent of the population, had not received a high school diploma (including a GED), or had only reached a 9th grade level of education. In both the service area and Multnomah County in 2003, the highest proportion of persons 25 years of age and older is estimated to have attended some college, but have no degree. However,

Portland Public Schools Head Start
23
from 2000 to 2003, it is estimated that there was an increase in the number of persons 25 years of age and older living in the service area and in Multnomah County that obtained a college degree. There was a decrease in the number of persons with lower levels of education except those with a high school diploma or GED as their highest educational achievement. In 2003, it is estimated that a slightly higher percentage of persons in the service area did not hold a high school diploma (including GED) than in Multnomah County.
Employment and Income The proportion of persons ages 16 years and older that are in the work force increased in the service area from 68 percent in 1996 to 72 percent in 2003. In Multnomah County the percentage increased from 68 percent to 69 percent. In the service area there was a slight decrease in the number of persons not participating in the labor force, while in Multnomah County there was an increase. The number of employed persons increased from 1996 to 2000, but decreased from 2000 to 2003 in both the service area and in Multnomah County. The number of unemployed persons increased between 11.6 and 13.3 percent annually during both time periods, and the unemployment rate rose from between 4 and 5 percent to an estimated 10 percent in the service area and Multnomah County from 1996 to 2003.
Figure 8. Educational Attainment in the Service Area
Figure 9. Educational Attainment, 2003 (est. for service area)
0%
5%
10%
15%
20%
25%
30%
< 9t
h G
rade
Som
e H
igh
Sch
l.
Hig
h S
choo
lD
ipl.
Or G
ED
Som
e C
oll.,
No
Deg
.
Ass
ocia
te's
Deg
.
Bac
helo
r'sD
eg.
Gra
d. o
r Pro
f.D
eg.
Perc
ent o
f Pop
ulat
ion
25 y
ears
and
ove
r Service AreaMultnomah Co.
0
10,000
20,000
30,000
40,000
50,000
60,000
< 9t
h G
rade
Som
e H
igh
Schl
.
Hig
h Sc
hool
Dip
l. O
r GED
Som
e C
oll.,
No
Deg
.
Ass
ocia
te's
Deg
.
Bac
helo
r'sD
eg.
Gra
d. o
r Pro
f.D
eg.
Pers
ons
25 y
ears
and
ove
r 2000 2003 (est.)

Portland Public Schools Head Start
24
Table 9. Employment Status for Persons 16 Years and Over
Employed
Persons Unemployed
Persons Total Persons in
Labor Force Persons Not in Labor Force
Unemployment Rate
Service Area 1996 153,705 7,674 161,380 76,811 4.8% 2000 168,270 12,226 180,496 76,393 6.8% 2003 (est.) 162388 18208 180763 71888 10.1% Ave. Annual Growth Rate 1996-2000 2.3% 11.6% 2.8% -0.1% Ave. Annual Growth Rate 2000-2003 -1.2% 13.3% 0.0% -2.0%
Multnomah County
1996 314,792 13,859 328,651 155,147 4.2% 2000 341,522 23,432 365,188 163,863 6.4% 2003 327,375 36,575 363,950 161,714 10.0% Ave. Annual Growth Rate 1996-2000 2.0% 13.1% 2.6% 1.4% Ave. Annual Growth Rate 2000-2003 -1.4% 14.8% -0.1% -0.4% Women represent approximately 52 percent of the total labor force in the service area. The percentage of women in the labor force did not change much from 1996 to 2003, and was 6 percentage points higher than the percentage for Multnomah County. During the same time period, the employment patterns for women have been similar to those for the total labor force except that unemployment rates for women have been lower than for the total labor force by an average of almost one percentage point at least from 2000. For women with children under 6, the employment patterns are the same as for all women. It is estimated however, that the unemployment rate is closer to that of the total labor force.

Portland Public Schools Head Start
25
Table 10. Employment Status for Women with Children Under 6 Years of Age
In Labor Force,
Employed or in Armed Forces
% Of All Females w/ Children <6
yrs.
In Labor Force,
Unemployed
% Of All Females w/
Children <6 yrs.
Not in Labor force
% Of All Females w/ Children <6
yrs.
Unemploy-ment Rate
Service Area 1996 6,473 63.3% 274 2.7% 3,480 34.0% 4.1% 2000 6,193 63.1% 449 4.6% 3,168 32.3% 6.8% 2003 (est.) 5,941 61.9% 673 7.0% 2,978 31.0% 10.2% Ave. Annual Growth Rate 1996 - 2000 -1.1% 12.3% -2.3% Ave. Annual Growth Rate 2000 - 2003 -1.4% 13.5% -2.1% Multnomah
Co. 1996 12,414 64.4% 496 2.6% 6,366 33.0% 3.8% 2000 12,352 62.2% 930 4.7% 6,562 33.1% 7.0% 2003 (est.) 11,869 57.5% 2,299 11.1% 6,457 31.3% 11.0% Ave. Annual Growth Rate 1996 - 2000 -0.1% 15.7% 0.8% Ave. Annual Growth Rate 2000 - 2003 -1.3% 30.2% -0.5% In the service area, from 1996 to 2000 there was an increase in the number of persons employed in most occupations except the farming, forestry and fishing occupations and construction, production, repair, and labor occupations. From 2000 to 2003 there was a decrease in the number of employees in most occupations except the professional and managerial occupations and the service occupations. The employment pattern for Multnomah County was similar to the service area except that the sales occupations decreased during both time periods. In the service area and in Multnomah County, the construction, production, repair, and labor occupations experienced the greatest decrease in the number of employees of all occupations during 1996-2003. During the same time period, the managerial and professional occupations added the most number of employees.

Portland Public Schools Head Start
26
Table 11. Persons Employed by Occupation
Managerial &
Professional Sales Admin. Support Service
Farming, Forestry,
and Fishing
Transportation & Materials
Moving
Construction, Production, Repair &
Labor Service Area 1996 49,202 17,483 24,136 23,038 1,566 6,167 32,113 2000 59,869 17,981 26,492 26,662 501 10,595 26,170 2003 (est.) 60,749 17,854 25,832 27,234 495 9,802 20,422 Ave. Annual Growth Rate 1996 - 2000 4.9% 0.7% 2.3% 3.7% -28.5% 13.5% -5.1% Ave. Annual Growth Rate 2000 - 2003 0.5% -0.2% -0.8% 0.7% -0.4% -2.6% -8.3% Multnomah
County 1996 105,887 39,258 48,568 42,452 3,342 12,315 62,970 2000 121,951 38,496 54,111 51,471 1,371 21,355 52,881 2003 123,275 34,380 49,609 54,007 1,454 18,481 46,169 Ave. Annual Growth Rate 1996 - 2000 3.5% -0.5% 2.7% 4.8% -22.3% 13.8% -4.4% Ave. Annual Growth Rate 2000 - 2003 0.4% -3.8% -2.9% 1.6% 1.9% -4.8% -4.5%
Most persons in the service area are employed in the managerial and professional occupations and aside from farming, forestry, and fishing, the fewest are employed in transportation and materials moving occupations. Figure 10. Percentage of Employed Persons by Occupation in Service Area
Employment by Occupation in Service Area
0%
5%
10%
15%
20%
25%
30%
35%
40%
Man
ager
ial &
Pro
fess
iona
l
Sal
es
Adm
in.
Sup
port
Ser
vice
Farm
ing,
Fore
stry
, and
Fish
ing
Tran
spor
tatio
n&
Mat
eria
lsM
ovin
g
Con
stru
ctio
n,P
rodu
ctio
n,R
epai
r &La
bor
199620032000

Portland Public Schools Head Start
27
Median household income in the service area in 2003 is estimated to be $38,790. It is slightly lower than the median household income for Multnomah County, which was $40,790 during the same time period. In 2003, the estimated percentage of households in all annual income categories under $25,000 is slightly higher in the service area than it is for Multnomah County, and the estimated percentage of households in categories $75,000 and over is lower (see Table 12 and Figure 11). Table 12. Households by Income in 2003 Dollars* Number of Households Percent of All Households Service Area 1996 2000 2003 (est.) 1996 2000* 2003 (est.) Less than $10,000 13,808 11,277 14,511 10.6% 8.5% 10.9% $10,000 to $14,999 8,231 7,186 10,236 6.3% 5.4% 7.7% $15,000 to $19,999 9,204 7,794 8,802 7.1% 5.9% 6.6% $20,000 to $24,999 9,389 8,212 9,783 7.2% 6.2% 7.3% $25,000 to $29,999 20,270 8,384 8,307 15.5% 6.3% 6.2% $30,000 to $34,999 8,276 8,504 9,220 6.3% 6.4% 6.9% $35,000 to $39,999 7,503 8,643 7,768 5.8% 6.5% 5.8% $40,000 to $44,999 6,982 7,950 8,469 5.4% 6.0% 6.3% $45,000 to $49,999 6,357 7,368 6,339 4.9% 5.6% 4.7% $50,000 to $59,999 9,973 12,410 13,564 7.6% 9.4% 10.2% $60,000 to $74,999 7,311 14,941 12,896 5.6% 11.3% 9.7% $75,000 to $99,999 11,033 14,343 11,634 8.5% 10.9% 8.7% $100,000 to $124,999 5,965 7,390 5,879 4.6% 5.6% 4.4% $125,000 or more 6,159 7,740 6,093 4.7% 5.9% 4.6% Total 130,461 132,141 133,500 100.0% 100.0% 100.0%
Multnomah County 1996 2000 2003 (est.) 1996 2000 2003 (est.) Less than $10,000 26,658 22,840 29,313 10.2% 8.4% 10.6% $10,000 to $14,999 15,894 14,166 20,015 6.1% 5.2% 7.3% $15,000 to $19,999 17,709 15,132 16,967 6.8% 5.6% 6.2% $20,000 to $24,999 17,886 16,054 19,221 6.9% 5.9% 7.0% $25,000 to $29,999 38,966 16,456 16,193 14.9% 6.0% 5.9% $30,000 to $34,999 16,666 16,638 18,019 6.4% 6.1% 6.5% $35,000 to $39,999 14,840 16,888 14,997 5.7% 6.2% 5.4% $40,000 to $44,999 13,710 15,439 16,715 5.3% 5.7% 6.1% $45,000 to $49,999 12,634 14,572 12,314 4.8% 5.4% 4.5% $50,000 to $59,999 20,449 24,409 26,926 7.8% 9.0% 9.8% $60,000 to $74,999 15,092 30,174 26,356 5.8% 11.1% 9.6% $75,000 to $99,999 23,366 30,628 25,676 9.0% 11.2% 9.3% $100,000 to $124,999 12,628 16,904 14,169 4.8% 6.2% 5.1% $125,000 or more 14,300 22,054 18,610 5.5% 8.1% 6.8% Total 260,797 272,356 275,491 100.0% 100.0% 100.0% * The 2000 Census reports the number of households in 2000 with income earned in 1999. The number and percent of households in 1996, 2000, and 2003 represents earning income in 2003 dollars; the data for 1996 and 2000 were adjusted for comparison purposes.; 2003 data are estimated for the service area.

Portland Public Schools Head Start
28
Figure 11. Household Income as a Percent of All Households, 2003 (est. for service area)
0%
2%
4%
6%
8%
10%
12%Le
ss th
an$1
0,00
0
$10,
000
to$1
4,99
9
$15,
000
to$1
9,99
9
$20,
000
to$2
4,99
9
$25,
000
to$2
9,99
9
$30,
000
to$3
4,99
9
$35,
000
to$3
9,99
9
$40,
000
to$4
4,99
9
$45,
000
to$4
9,99
9
$50,
000
to$5
9,99
9
$60,
000
to$7
4,99
9
$75,
000
to$9
9,99
9
$100
,000
to$1
24,9
99
$125
,000
or
mor
e
Service Area
Multnomah
The proportion of households that were receiving public assistance income in the service area was about the same as in the County in 2000. It is estimated that the same is true for 2003. Table 13. Households That Received Public Assistance Income
HH % Total HH Service Area
2000 6,042 4.6% 2003 (est.) 3,868 2.9% Multnomah County
2000 11,478 4.4% 2003 7,860 2.9% Poverty Poverty rates declined from 1996 to 2000 in Multnomah County, and then increased from 2000 to 2003. Since at least 1990, the combined regions within the County in which the majority of the impoverished population reside overlap the service area. In 2003, about 15 percent of persons in Multnomah County lived in households where the income was below the poverty level. The poverty rate increased more than two percentage points from 2000. About 44 percent of the persons living below the poverty level in Multnomah County are estimated to have been residing in the north, northeast and southeast regions* of the County – all which lie in the PPS Head Start service area. Excluding downtown Portland, which is not in the PPS Start service area, the region in Multnomah County with the highest percentage of persons in poverty in 2003 was north, with a poverty rate of 17.8 percent. The northeast and southeast regions had poverty rates of 15.1 percent and 14.1 percent respectively.

Portland Public Schools Head Start
29
Table 14. Poverty for Persons by Multnomah County Regions*
1990 Poverty
Rate
1990 Share of Multnomah
County Impoverished
Population
1996 Poverty
Rate
1996 Share of Multnomah
County Impoverished
Population
2000 Poverty
Rate
2000 Share of Multnomah
County Impoverised Population
2003 Poverty Rate**
2003 Share of Multnomah
County Impoverished Population**
North 20.4% 12.9% 19.5% 11.2% 16.0% 10.3% 17.8% 10.1% Northeast 17.9% 22.2% 16.1% 18.8% 14.0% 16.7% 15.1% 16.2% Southeast 13.8% 22.3% 14.4% 20.6% 12.0% 18.1% 14.1% 17.6% Outer East 9.6% 26.0% 12.5% 34.0% 12.3% 38.4% 15.8% 39.7% Multnomah County 13.1% 14.1% 12.7% 15.1% *Regions are Community Action (now known as Community Partnership) Program Service Districts, Multnomah County Dept. for Community and Family Service. **Estimated for regions in Multnomah County.

Portland Public Schools Head Start
30
Figure 12. Poverty Rate for Persons by Census Tract, 2000

Portland Public Schools Head Start
31
The number of households with income below the poverty level increased from 2000 to 2003 in both the service area and in Multnomah County. The poverty rate for persons is higher than the rate for households. However, the growth rate of the number of persons with income below the poverty level from 2000 to 2003 is lower than the growth rate of the number of households in poverty. The poverty rate in the service area has been higher than the rate for the County since at least 1996. Table 15. Households and Persons with Income Below Poverty Level*
Households with Income
Below Poverty Level % All
Households Persons With Income
Below the Poverty Level % All PersonsService Area 1996 n/a n/a 48,749 15.9% 2000 15,781 11.9% 42,586 13.4% 2003 (est.) 19,359 14.5% 49,489 15.3% Ave. Annual Growth Rate 2000 - 2003 6.8% 5.0% Multnomah County 1996 n/a n/a 88,177 14.1% 2000 31,035 11.4% 83,597 12.7% 2003 39,601 14.4% 102,525 15.1% Ave. Annual Growth Rate 2000 - 2003 8.1% 6.8% *The data for 2000 are number of households or persons in 2000 with prior year’s income below the Census defined poverty threshold. The 1996 poverty threshold for a family of four was $16,036; for 1999, it was $17,029; and for 2003, $18,810. The Census Bureau poverty thresholds used for this table differ from and are higher than the federal poverty guidelines, but by no more than $450 annual income for a family of 4 in any year. After experiencing a decrease from 1996 to 2000, there was an increase from 2000 to 2003 in the number of children under 6 years old residing in households where income in the previous 12 months was below the poverty level. The poverty rate for children under 6 years old during the same time periods was 5-9 percentage points higher than for persons of all ages. In addition, the rate for the service area is higher than the rate for the County.

Portland Public Schools Head Start
32
Table 16. Children in Households with Income Below the Poverty Level*
Children Under 6 Yrs. Old
Poverty Rate for Children under 6
Yrs. Old Service Area
1996 6,050 24.0% 2000 4,317 18.2% 2003 (est.) 5,677 24.2% Ave. Annual Growth Rate 1996 - 2000 -8.4% Ave. Annual Growth Rate 2000 - 2003 9.1%
Multnomah Co. 1996 10,955 21.9% 2000 8,786 17.4% 2003 (est.) 12,202 23.1% Ave. Annual Growth Rate 1996 - 2000 -5.5% Ave. Annual Growth Rate 2000 - 2003 10.9%
*The Census Bureau poverty thresholds used for this table differ from the federal poverty thresholds, but by no more than $600 annual income for a family of 4 in 1996, 2000, and 2003. Children under 6 years old residing with a single-mother have consistently represented the greatest proportion of impoverished children residing in all family types in both the service area and in the County from 1996 to 2003. In the service area, the proportion of impoverished children under 6 residing with a single-mother has increased since 1996, and the proportion has been greater in the service area than in the County. Children under 6 in married-couple families that are impoverished decreased during the same time period. Single-father families with income below poverty and children under 6 years of age also decreased and by 2003 are estimated to represent only about 3 percent of all impoverished children under 6. The proportion of children under 6 residing with impoverished single-fathers has been slightly higher in Multnomah County since 2000.

Portland Public Schools Head Start
33
Table 17. Children in Households with Income Below the Poverty Level by Family Type*
Service Area
Married-couple Family
% all Children Under 6 Below
Poverty Level
Single-Father
% all Children Under 6 Below
Poverty Level
Single-Mother
% all Children Under 6 Below
Poverty Level
1996 2,075 34.3% 417 6.9% 3,558 58.8% 2000 1,587 37.8% 297 7.1% 2,312 55.1% 2003 (est.) 1,903 33.5% 161 2.8% 3,613 63.6% Ave. Annual Growth Rate 1996 - 2000 -6.7% -8.5% -10.8% Ave. Annual Growth Rate 2000-2003 6.1% -20.4% 14.9% Multnomah County 1996 3,889 35.5% 701 6.4% 6,365 58.1% 2000 3,655 41.6% 729 8.3% 4,402 50.1% 2003 (est.) 4,773 39.1% 484 4.0% 6,945 56.9% Ave. Annual Growth Rate 1996 - 2000 -1.5% 1.0% -9.2% Ave. Annual Growth Rate 2000-2003 8.9% -13.7% 15.2% *Number of children in households with prior year’s income below the Census defined poverty threshold. The poverty rate for children ages 0-4 is slightly higher than the rate for children ages 0-5. About twenty-three percent of children ages 3-4 in Multnomah County in 2003 were living in households where the income was below the poverty level. Forty-eight percent of these eligible children were not served by Head Start or Oregon Prekindergarten programs in 2003. In the service area, over 560 eligible children ages 3-4 are estimated to not have been served by Head Start programs during the 2003-2004 school year. Table 18. Head Start Eligible Children Ages 3-4
Multnomah
County Multnomah
County Service Area Service Area 2000 2003 2000 2003 (est.) Poverty Rate (under 5) 17.6% 23.0% 18.5% 24.6% Population Ages 3-4 16,800 16,322 7,746 7,017 Eligible Children 2,957 3,758 1,433 1,697 Served in 2000-2001 or 2003-2004 Schl. Yr. 1,814* 1,943* 1,005** 1,133** % Served 61.4% 51.7% 70.1% 66.8% Not Served 1,143 1,815 428 564 % Not Served 38.6% 48.3% 29.9% 33.2% *Source: Oregon Department of Education, Early Childhood Section, March 2001, and January 2004; Includes children served by served by Head Start or Oregon Prekindergarten Programs. **Children enrolled in PPS Head Start and Albina Head Start programs, fall 2003.

Portland Public Schools Head Start
34
Indicators of Special Needs and Low-income Children Children that are tracked as having a special need or who are receiving services for their special needs serve as possible indicators of the presence of special children’s population groups. Despite the increase in poverty, there has been a decrease in number and percentage of children ages 0-5 years in Multnomah County receiving WIC and TANF services, and public health insurance from 1996 to 2003 (see Table 19). In 2003, over one-third of the Medicaid eligible children did not receive a well-child medical visit. The percentages of children ages 0-5 years in out-of-home care and that were child abuse victims have remained somewhat stable during 1996-2003 representing just over 1 percent of all children ages 0-5 in 2003.
Table 19. Special Needs and/or Low-Income Children in Multnomah County # Cases or # Served % of Relative Population
Special Population 1996 2000 2002 2003 1996 2000 2002 2003
Children (ages 0-5, includes infants) Receiving WIC Services* 13,981 12,732 13,583 13,005 28.0% 25.3% n/a 24.6%
Infants only (ages 0-12 months) Receiving WIC Services n/a n/a 3,436 3,466 n/a n/a n/a 39.0%
Children (ages 0-5) in Families Receiving TANF** n/a 2,869 2,320 2,259 n/a 5.7% n/a 4.3%
Medicaid Eligible Children (ages 0-5)*** 26,629 25,685 24,515 23,464 53.2% 51.0% n/a 44.3%
Medicaid Eligible Children Not Receiving Well Child Care (ages 0-5)***
7,755 7,244 11,050 9,652
29.1% (% of
eligible children)
28.2% (of
eligible children)
45.1% (% of
eligible children)
41.1% (% of
eligible children)
Children (ages 0-5) in SCF Custody / Children in Out-of-home Care****
680 697 582 679 1.4% 1.4% n/a 1.3%
Child Abuse Victims (ages 0-5) 764 893 709 756 1.5% 1.8% n/a 1.4%
* Monthly average; 1996 value is actually a value for 1998. **Number served in one month each year (May). ***Includes children in households where income is 170% of Federal poverty level and lower; eligible children are those enrolled in Oregon Health Plan or other public insurance program; 2000 value is actually a value for 1999; difference between 2000 and 2002 numbers of children not receiving well child care could be attributed to a difference in the method of collecting data. ****Includes emergency shelter, foster care, residential care; numbers represent the number at a point in time: Dec. 31. The number of children with physical or mental disabilities is estimated to have increased from 2000 to 2003.

Portland Public Schools Head Start
35
Table 20. Children with Disabilities in Multnomah County # of Cases or Population % Relative Population Children with Disabilities (0-5) 1996 2000 2003 1996 2000 2003 Children with Physical and Sensory Disabilities* 1,050 673 707 2.1% 1.3% 1.3%
Children with Physical Disabilities n/a 232 244 n/a 0.5% 0.5%
Children with Sensory Disabilities n/a 480 504 n/a 1.0% 1.0%
Children with Mental Disabilities n/a 1244 1,307 n/a 2.5% 2.5% Children Receiving Mental Health Services in the Public Mental Health System (0-5)** 742*** 939**** 1,221 1.5% 1.9% 2.3% *Estimated by PRC; difference in 1996 and 2000 values may be attributed to the use of different data sets; sources based on disability rates for population ages 5 to 14, 1996 American Community Survey data and 2000 PUMS data, U.S. Census. **Children that received at least one public mental health service during the year (includes children served by public insurance, but not all served by OHP are represented) ***Fiscal year 1995-1996 ****Fiscal year 1998-1999 Table 21 displays, for the service area, population range estimates for children’s special population groups. The ranges are broad but offer the minimum and maximum probable number of children in need for each group. For example, in the service area in 2003, at least 2,885 children 0-5 years old most likely received WIC services, but that number could be as high as 8,654.

Portland Public Schools Head Start
36
Table 21. Special Needs and/or Low-Income Children Ages 0-5 in Service Area, 2003 (est.) 2003 Population Range Estimate (for # Served,
# Cases, or # Special Needs Children Special Population Low High
Children Receiving WIC Services (0-5) 2,885 8,654
Infants Receiving WIC Services (0-12 months) 769 2,306
Children (ages 0-5) in Families Receiving TANF 501 1,503
Medicaid Eligible Children (0-5) 3,918 11,754 Medicaid Eligible Children Not Receiving Well Child Care (0-5) 1,369 4,106 Children in SCF Custody / Children in Out-of-home Care (0-5) 501 1,503
Child Abuse Victims (0-5) 168 503
Children with Disabilities
Children with Physical and Sensory Disabilities 157 470
Children with Physical Disabilities 54 162
Children with Sensory Disabilities 112 335
Children with Mental Disabilities 290 870 Children Receiving Mental Health Services in the Public Mental Health System (0-5) 271 813 The table below displays several risk factors to expectant mothers in Multnomah County. The number and percentage of births to ethnic minority mothers increased from 1996 to 2003. Births to mothers ages 35 years and older has also increased, while births to teenage mothers has decreased. Tobacco usage by pregnant women has also decreased during the same time period. Table 22. Births with Maternal Risk Factors in Multnomah County
Risk Factor 1996 % all births 2000
% all births 2003
% all births
Ethnic Minority heritage 2,353 25.8% 3,075 32.5% 3,232 34.6% Inadequate Prenatal Care* 493 5.4% 596 6.3% 504 5.4% Mother 35 yrs or older 1,250 13.7% 1,466 15.5% 1,560 16.7% 4th or Higher Number of Births to Mother 958 10.5% 965 10.2% 953 10.2% Fewer than 12 yrs of Education 1,916 21.0% 1,940 20.5% 1,859 19.9% Single Mother 3,074 33.7% 3,037 32.1% 3,138 33.6% Tobacco Use 1,688 18.5% 1,287 13.6% 1,102 11.8%
*Care began during the 3rd trimester or included fewer than 5 prenatal visits.

Portland Public Schools Head Start
37
The number of mothers who were covered by public health insurance for the delivery of their baby increased from 1996 to 2003. In 2003, 37.5 percent of births, or over 3,500 births, were paid for by public insurance. Table 23. Payment for Delivery of Baby
Payment for Delivery 1996 % all births 2000
% all births 2003
% all births
Public Health Insurance 3,109 34.1% 2,961 31.3% 3,504 37.5% Self-pay 318 3.5% 569 6.0% 272 2.9% Other (includes private insurance and more than one method of payment) 5,608 61.5% 5,862 62.0% 5,506 59.0%
In 2003 approximately 81 percent of all pregnant women began receiving prenatal care in their first trimester of pregnancy. However, over 270 pregnant women in Multnomah County did not have their first prenatal visit until the third trimester of pregnancy. Table 24. Time of First Prenatal Care
Trimester Prenatal Care Began* 1996 % all births 2000
% all births 2003
% all births
First 7,443 81.6% 7,496 79.2% 7,552 80.9% Second 1,322 14.5% 1,527 16.1% 1,421 15.2% Third 284 3.1% 319 3.4% 272 2.9%
The number of teen pregnancies has decreased continuously since at least 1996. Still, in 2003, almost 1,300 women under the age of 20 in Multnomah County became pregnant. Table 25. Teen Pregnancies (not births) in Multnomah County
Teen Pregnancies (not births) 1996 % all
pregnancies 2000 % all
pregnancies 2003 % all
pregnancies Total Pregnancies (all ages) 13,344 14,067 13,270 under 15 yr. of age 42 0.3% 32 0.2% 26 0.2% 15-17 yrs of age 697 5.2% 573 4.1% 423 3.2% 18-19 yrs of age 1,191 8.9% 1,128 8.0% 833 6.3% All Pregnancies to Females under 20 yrs of Age 1,930 14.5% 1,733 12.3% 1,282 9.7%
The number of births to teenage mothers in Multnomah County has declined since at least 1996. The rates of decline are slightly lower than for teen pregnancies. Table 26. Births to Mothers Under 20 Years of Age in Multnomah County
1996 % all births 2000
% all births 2003
% all births
Mother under 15 yrs of age 16 0.2% 15 0.2% 9 0.1% Mother 15-19 yrs of age 1,094 12.0% 939 9.9% 700 7.5% All Births to Mothers under 20 yrs of age 1,110 12.2% 954 10.1% 709 7.6%

Portland Public Schools Head Start
38
The percentage of teen births that are white is declining and it is declining at a faster rate than the percentage of the white population. Although approximately one-quarter of the population is of ethnic minority heritage, almost one-half of the teen births have been to ethnic minority mothers. The number of ethnic minority births is decreasing as is the total number of births, but the proportion of the total number of births that are to ethnic minority mothers is increasing. The number of births to Hispanic mothers is increasing, while the number births to mothers in the remaining racial/ethnic groups is decreasing. Table 27. Births to Teens in Multnomah County by Race and Hispanic Origin (under 20 yrs. of age)
1996-1998 % All
1998-2000 % All
2001-2003 % All
White (non-Hispanic) 1,823 58.1% 1,699 56.0% 1,194 50.1% Black 506 16.1% 469 15.4% 336 14.1% Native American 80 2.5% 65 2.1% 39 1.6% Other Nonwhite 180 5.7% 180 5.9% 126 5.3% Hispanic (All Races) 551 17.5% 623 20.5% 689 28.9% Ethnic Minority Total 1,317 41.9% 1,337 44.0% 1,190 49.9%
There was a decrease in the number of births to teenage mothers in the service area from 1996 to 2002. Their share of the total number of births to mothers of all ages decreased as well, by over 5 percentage points. The number of births to ethnic minority teen mothers in the service area has decreased from 1996 to 2002. However, the percentage that they represent of the total number of births to teen mothers increased during the same time period, but with some fluctuation. In 2002, more than half of all births to teen mothers were to ethnic minority mothers.
Table 28. Births to Teenage Mothers in the Service Area
Births to Women under 20 yrs. of age 1996 % all births 2000 % all births 2002 % all births Total 629 13.1% 471 10.2% 351 7.8%
Race/Ethnicity of Teens Giving Birth 1996 % all births
to teens 2000 % all births
to teens 2002 % all births
to teens White, non-Hispanic 321 51.0% 205 43.6% 165 47.1% Ethnic Minority 309 49.0% 266 56.4% 186 52.9%

Portland Public Schools Head Start
39
The percentage of teen mothers receiving adequate prenatal care has remained fairly stable since 1996 – around 89 percent. A higher percentage of mothers giving birth were receiving public medical coverage in 2001-2003 than in previous years.
Table 29. Teen Births and Prenatal Care in Multnomah County (under 20 yrs. of age) 1996-1998 1998-2000 2001-2003
Births to Mothers (under 20) 3,145 3,046 2,396 Pregnant Women Receiving Adequate Prenatal Care (under 20) 2,858 2,708 2,137 % Receiving Adequate Prenatal Care (under 20) 90.9% 88.9% 89.2% Pregnant Women Receiving Public Insurance for Prenatal Care (under 20) 1,872 1,724 1,653 % Receiving Public Insurance for Prenatal Care (under 20) 59.5% 56.6% 69.0% *From 1996-1998 to 2001-2003 In Multnomah County, 11th or 12th grade was the highest level of education attained by most teenage mothers giving birth from 1996 to 2003. Table 30. Educational Attainment of Teens Giving Birth in Multnomah County
1996-1998 % All
1998-2000 % All
2001-2003 % All
8th Grade Education or Less 463 14.7% 427 14.0% 328 13.7% 9th to 10th Grade Education 902 28.7% 845 27.7% 700 29.2% 11th to 12th Grade Education 1,625 51.7% 1,570 51.6% 1,218 50.8%
Some College 111 3.5% 137 4.5% 105 4.4%
Unknown 44 1.4% 67 2.2% 45 1.9% Table 31 reports an estimated demand for and availability of child care in Multnomah County and in Portland. The number of children ages 0-5 residing in households with working parents is almost three times higher than the number of child care slots available in both Multnomah County and in Portland1. It is estimated that in Multnomah County, there are 29,142 children ages 0-5 whose parent(s) work. There are approximately 10,224 number of child care slots available. In Portland, as many as 14,449 children ages 0-5 may have unmet need for child care.
1 Child care data are available for Multnomah County and for Portland. The data are not available for the service area.

Portland Public Schools Head Start
40
Table 31. Child Care (CC) Availability, 2003*
Childcare Slots and Settings Multnomah County Portland
Need for Slots* 29,142 23,071
Total CC Slots Available 10,224 8,622
Estimated Unmet Need 18,918 14,449
Types of Slots
CC Center Slots 6,945 6,006
Family CC Slots*** 3,279 2,616
Types of Child Care
CC Centers 139 123
Family CC 622 501 *Source: Oregon/Metro Child Care Resource and Referral Network **The number of children under 6 estimated to be residing in living situation where parents are in the labor force; does not take into account unemployment. ***maximum number of slots in family care providers for children 0-5 that might be available; not necessarily all slots are available due to configuration decisions of individual providers.

Portland Public Schools Head Start
41
COMMUNITY RESOURCES Child Development and Childcare Programs Below is a list of child development and childcare programs that serve Head Start eligible children and their families. Also included are the total number of children served and an estimate of the number of Head Start eligible children served by each program. Child Development Programs
Portland Public Schools Location: Various sites throughout the PPS Head Start service area. Program components: Pre-K program and Medical Service programs Number of children served: 833 children are enrolled as of Oct 1, 2004 Percent of children below poverty: 16% of children in the Pre-K program are eligible for free and reduced lunch.
Early Head Start Family Center Location: Northeast Portland Program components: Head Start for pregnant women and children from birth to 3 years old. Home-based and center-based programs are available. Services include: parenting information, health, nutrition, dental care, job placement, child care referrals, social services, teen parent and Job Corps partnerships. Number of children served: currently serving 298 children age’s birth to 3 and pregnant women. Percent of children below poverty: Not available Number of children with special needs: 10%
Friendly House
Serves entire Portland Metropolitan. Provides two services, playgroups and preschool. Location: Northeast Portland
Play Groups: Program components: Serves infants and toddlers ages birth to 3 years. Provides a drop in service on Tuesday and Thursday mornings for 2 hours.
Number of children served: 28 Percent of children below poverty: 11% Number of children with special needs: Not available.
Preschool: Program components: Serves children ages 3 to 5 years. A part-day program (3.5 hours per week, 3-4 days per week) Number of children served: 41 Percent of children below poverty: 71% Number of children with special needs: 11 children are learning English as a second language)

Portland Public Schools Head Start
42
Parent-Child Development Programs and Services Below is a list of programs that offer interactive services for parents and their children.
PPS HIPPY (Home Instruction Program for Parents of Preschool Youngsters)
Migrant HIPPY (Home Instruction Program for Parents of Preschool Youngsters) Location: Northeast Portland Program components: Assists Spanish speaking parents in educating their children at home. Program components include home visits and monthly parent meetings. Number of families served: currently serving 48 children Percent of families below poverty: 93% Number of children with special needs: None
Native Montessori School HIPPY (Home Instruction Program for Parents of Preschool Youngsters)
Location: Northeast Portland Program components: Assists parents in educating their children at home. Program components include home visits and monthly parent meetings. Number of children and families served: currently 16 families Percent of families below poverty: Not available Number of children with special needs: None
Migrant Even Start
Location: Northeast Portland Program components: Parents attend ESL classes 4 days a week while their children age’s four to five years attend preschool in Spanish. Children from birth to age 3 attend childcare. Number of families served: currently serving 40 families Percent of families below poverty: 93% Number of children with special needs: Not available.
PCC Even Start Program
Location: Southeast Portland Program components: Enrolls families into a comprehensive program including ESL classes, early childhood activities, parenting classes. Number of children and families served: Not available Percent of families below poverty: Not available Number of children with special needs: Not available
Together Program Location: North Portland Program components: Provides parent-child interactive playgroups, parent support groups, home visits and information about parenting issues. Services are available free of cost regardless of family income. Number of families served: Not available Percent of families below poverty: Not available Number of children with special needs: Not available

Portland Public Schools Head Start
43
Portland Impact Location: Southeast Portland Program components: Provides parent-child interactive playgroups, parent support groups, home visits and information about parenting issues. Services are available free of cost regardless of family income. Number of families served: 817 families in the youth and family department Percent of families below poverty: 80% Number of children with special needs: Not available
The Asian Family Center Location: Northeast Portland Program components: Serves the Asian community by providing parent education classes, screenings for developmental disabilities, referrals to other agencies and home visits. Number of families served: 350 families per year Percent of families below poverty: Not available. Number of children with special needs: 0 children
Volunteers of America: Common Bond
This bilingual program serves the Hispanic and white communities. This program will be shutting down in May, 2005. The county has decided to cease funding.
Location: Northeast Portland Program Components: Provides developmental activities, toys and books for children and teaches parents about parenting and child development. This program serves families from pregnancy until their child enters kindergarten. Families may also participate in the home visiting program in which they receive personal visits, child screenings and access to a resource network Number of families served: Currently serving 20 families Percent of families below poverty: 100% Number of children with special needs: Not a population they target.
Volunteers of America: Child Care at The Child Development Center
Location: Southeast Portland Program Components: A state-licensed, tuition-assisted program for children ages six weeks to six years old. Provides childcare, respite care, parenting skills and support. Number of families served: Licensed to serve 78 children Percent of families below poverty: near 100% Number of children with special needs: Not available
Early Childhood Services for Special Needs Children Below is a list of resources available to special needs children.
Multnomah Early Childhood Program (MECP) Early Intervention Services Location: Various sites throughout the PPS service area. Program components: Early intervention services for children birth to age 5, before kindergarten. Services for children with special needs such as speech, language, developmental, physical impairments, and learning difficulties. There is no waiting list.

Portland Public Schools Head Start
44
Number of children served: East side of county, 601 currently children served; West side of county, 835 currently children served. Percent of children below poverty: Not available
ARC This program serves Multnomah and Clackamas County. Location: Southwest Portland Program components: Provides a family advocacy program to assist parents that have a developmental disability. Services also include information and referrals. Family Advocacy Program: Number of children served: In the first quarter of 2004-2005, 125
children and 249 adults were served. Percent of children below poverty*: 82% of the children served receive
some form of assistance such as food stamps, SSI, or Medicaid. Information and Referral: Number of families served: Averaging about 152 per year. Percent of families below poverty: Not available
Morrison Center
Provides two programs: The Hand in Hand Day Treatment Center and the First Steps program. Location: Northeast Portland, serves entire Multnomah County The Hand in Hand Day Treatment Center:
Program components: The Hand In Hand Day Treatment Program serves preschool children, ages 3 to 6 years, who have been severely abused and neglected. Program components include intensive day treatment services and integrated, specialized therapeutic foster care (proctor care) services. Number of children served: 22, average daily population Percent of children below poverty: 100%
The First Steps Program: Program Components: The First Steps program serves infants and toddlers, ages birth to 3 years, who are developmentally "at-risk" due to prenatal drug and/or alcohol exposure. Program components include developmental assessments, home-based programming, parenting support and skill building, and referral services to other community resources. Number of children served: 20 babies average daily population Percent of children below poverty: 100%
Speech and Hearing Clinic
Location: Portland State University campus, Southwest Portland Program components: Serves children and adults with communication disorders. Program components include comprehensive evaluation and treatment of disorders related to speech, language and/or hearing. Number of children served: currently serving 45 children with speech problems Percent of children below poverty: not available Number of children with special needs: 100%

Portland Public Schools Head Start
45
Portland Adventist Medical Center Location: Southeast Portland Program components: Offers speech therapy, audiology evaluations and screenings Number of children served: about 4 children per month or 20 per year (numbers are low because of insurance limits) Percent of children below poverty: about 33%
Oregon Hearing & Speech Institute
Location: Oregon Health Sciences University, Southwest Portland Program components: Offers speech therapy, audiology evaluations and screenings. Number of children served: Currently providing services to 186 children. Annually, provide on-going therapy services, screens and evaluations to 800 children. Percent of children below poverty: About 30% of the children we see are on OHP or Washington Medicaid or qualify for financial assistance of 90% or more of the fee.
Child Development Rehabilitation Center Location: Oregon Health Sciences University campus, Southwest Portland. Serves children throughout Oregon State via 12 outreach facilities. Program components: Offers multi-discipline evaluations and some treatment for children that have physical, emotional, behavioral, and learning disabilities. Number of children served: 2,472 children. Percent of children below poverty: 55% of the children served in Multnomah County are on Medicaid.
Developmental Disabilities Services
Provided by Multnomah County Department of Community and Family Services. Location: Southeast Portland Program components: Determines eligibility for publicly funded services, develops and maintains services for children and adults with developmental disabilities and provides information regarding available resources to persons with developmental disabilities. Number of children served: currently serving 37 children ages birth to 3. Percent of children below poverty: 35% receive SSI (Medicaid eligible)
Key Community Resources for Children and Families PPS Head Start has extensive partnerships with community organizations. The following is a list of the key community partners and their roles. PPS Head Start reviews its partnerships annually and written collaborative agreements and/or personal services contracts are entered into as appropriate. All services are located within Multnomah County and most services are located within Portland Public School Head Start’s service area, which both have an adequate transit system that provides bus and light rail transportation.

Portland Public Schools Head Start
46
Education
Concordia College, Portland State University, Lewis and Clark College, University of Portland, Location: NA
Services: Assigns practicum students to the PPS Head Start program. Availability and Qualifications: NA
University of Oregon (Hill Walker) Location: Eugene Oregon Services: Conducts research examining the impact of cross-cultural analysis, early screening and diminishing violence in young children. Availability and Qualifications: NA
Portland Community College
Location: Various sites throughout PPS Head Start service area and Multnomah County. There are 4 main campuses and off campus locations which vary from year to year. Services: Adult education Program, GED classes. Availability and Qualifications: Must take a placement test to determine eligibility. Once eligibility is assessed there is a waiting list. Length of wait varies depending on which campus and time of the year.
Basic Needs
William Temple House Location: Northwest Portland Services: Emergency food and clothing available. Children’s Shoe Give Away Program. Availability and Qualifications: Must bring I.D. or social security numbers for all children in family and current mail for prove of address. Food is available one time every 30 days with a maximum of 5 times a year. Shoe giveaway at Easter and Christmas.
Oregon Community Warehouse Location: Northwest Portland Services: Provides household goods and furniture for referred Head Start families Availability and Qualifications: Must be referred by a Head Start Family Service Worker who will meet the family at the warehouse. Family supplies transportation for needed items.
Dental Care
Dr. Michael Biermann Location: North Portland Services: Has a contract with Head Start to provide dental services. Availability and Qualifications: All PPS Head Start children and families are eligible. There is a 6-week waiting list
Portland Public Schools Head Start
47
Russell Street Dental Clinic Location: North Portland Services: Has a contract with Head Start to provide dental services. Availability and Qualifications: All PPS Head Start children. There is a 3-4 week waiting list.
Dr. Steve Miller
Location: Northeast Portland Services: Has a contract with Head Start to provide dental services. Serves on the PPS Head Start Health Services Advisory Committee Availability and Qualifications: All PPS Head Start children. Emanuel Hospital
Location: North Portland Services: Provides treatment for children needing extensive dental work. Served 3 PPS Head Start children. Dr. Bob Johnson
Location: Northeast Portland Services: Provided dental screening for Head Start children during the 2004-2005 school year. Serves on the PPS Head Start Health Services Advisory Committee Served 209 PPS Head Start children.
Health Care
VILLA DE CLARA VISTA Health Clinic Location: Northeast Portland Services: Provides medical care and counseling services for families. Availability and Qualifications: Availability varies from week to week and depends on the severity of the aliment. Must be low-income and live within Multnomah County. Assisted 50 Head Start families since Sept. 1, 2000.
Natural Health Clinic Location: Southeast Portland Services: Has a contract with Head Start to provide medical care. Availability and Qualifications: All Head Start children and families are eligible.
Nurse Practitioner Clinic, Mariah Taylor, PNP Location: North Portland Services: Has a contract with Head Start to provide medical care. Screening for Oregon
Health Plan, counseling and referral services. Serves on the PPS Head Start Health Services Advisory Committee

Portland Public Schools Head Start
48
Availability and Qualifications: HMO, Care Oregon, Private Insurance, Open Medicaid Card.
WIC Clinic
Referral source for nutritional and health needs. Served 40 PPS Head Start children and mothers since Sept. 2000.
Mental Health Care
Multnomah County Children & Families Mental Health Services Mental Health Consultants for Portland Public Schools Head Start Location: Northeast Portland Services: Provides mental health services to children and families and consults with staff. Availability and Qualifications: Open to all Head Start children and families. There is no waiting list.
Child, Adolescent and Adult Plan (CAAPCare) Location: Southwest Portland Program components: CAAPCare is a mental health care organization for Oregon Health Plan members in Multnomah County. Number of children served: 1,500 clients under 21 per month. Percent of children below poverty: 100%
Other
Community Energy Project Location: usually workshops are held at a Head Start site. Services: Provides families with Home Weatherization Program- Adult education/ free demonstration workshops and materials, and lead prevention materials and workshops. Availability and Qualifications: Available during the winter months, September to March. Must be low-income and live within the city of Portland.
Department of Human Services, Child Protective Services
Kim Keltch, MSW, casemanager. Serves on PPS Head Start Health Advisory Services Committee
Location: N, NE, SE Portland Services: Provides consultation, referral, training on child safety and abuse concerns. Other Community Resources for Children and Families PPS Head Start also provides a resource and referral network. An extensive network of providers and programs are available to assist and direct parents to the appropriate resources. Below is a list of the community organizations that help to support PPS services as well as the specific services provided to PPS Head Start children and families since September 2000 to date.
Portland Public Schools Head Start
49
Multicultural Hispanic Access Center Information and referral to appropriate services and agencies, short term intervention including translation and interpretive services, specialized long term care management to achieve self-sufficiency for both families and individuals with multiple barriers, such as employment, housing, food, clothing, and legal assistance. • Provided 1 workshop, served 20 PPS Head Start participants. Chicano Concilio Drug & Alcohol Programs Accepts referrals from Head Start. • Provided 3 referrals for PPS Head Start families since Sept. 2000. EL Programa Hispano Provides workshops and program presenters. • Provided 2 workshops, served 40 PPS Head Start participants. Immigration Counseling Provides workshops, presenters and accepts referrals from Head Start. • Provided 1 workshop, served 80 PPS Head Start participants Special Needs Dr. Sarojin Budden Referral for children suspected of problems as a result of parental drug in take during pregnancy. Serves on the PPS Head Start Health Services Advisory Committee. • Has not served any PPS Head Start children or families this year. Domestic Violence DIF Domestic Violence Provides workshops and presentations for parents. • Provided 1 workshop, served 20 PPS Head Start participants.

Portland Public Schools Head Start
50
SURVEY FINDINGS
Three surveys were developed to evaluate program satisfaction, and the family needs and demographics of PPS Head Start families. The three surveys were sent to (1) currently enrolled PPS Head Start families, (2) formerly enrolled PPS Head Start families, and (3) community professionals that either receive referrals from or make referrals to PPS Head Start. The family surveys were available in English and Spanish. The findings below denote the most significant information obtained from the survey responses. A separate set of findings were made from each survey. The findings are grouped into categories according to the topic of the questions answered. Currently Enrolled Families One hundred and twenty surveys were distributed to currently enrolled Portland Public Schools Head Start families. Sixteen surveys were completed and returned which represents a response rate of 13 percent. Not all of the respondents answered all of the questions. The purpose of surveying currently enrolled families is to obtain information about family needs while enrolled in Head Start, and about participation and satisfaction with program services that are available to them. The survey responses pertain to the respondents’ current experience with Head Start. Sixteen respondents participated in this survey. Not all respondents answered all questions. Findings Program Participation and Service Evaluation
• Thirteen respondents (81%) are enrolled in the Center-based program. • Five respondents (31%) reported having transportation problems getting to and from the
Head Start site. • Nine respondents (56%) need assistance with transportation. • All respondents are satisfied with the Head Start classroom program. • Of all the Head Start programs except one, not more than one respondent reported being
dissatisfied; 2 respondents indicated dissatisfaction with ‘Public Assistance and Referrals’.
• At least 10 respondents (over 75%) indicated to be satisfied with ‘Information about Child’s Progress’, and ‘Physical Health’ and ‘Dental’ exams, ‘Vision Services’ and ‘Home Visits’.
• Only 2 respondents reported to be participating in the job training program; 7 of the 14 (50%) respondents indicated they are not participating because of they do not need job training.

Portland Public Schools Head Start
51
HEAD START SERVICES SATISIFIED NO OPINION
SOMEWHAT DISSATISFIED
Children Services Classroom Program 14 0 0 Information About My Child’s Progress
12 1 1
Dental Exams 11 3 0 Physical Health/Exams 10 3 0 Vision Services 10 3 0 Hearing 7 3 0 Immunizations 5 4 0 Speech 5 5 0 Mental Health Services 3 6 0 Disability Services 2 5 1
Family Services Home Visits 11 2 0 Counseling Referrals and Information
7 4 1
Parent Training Opportunities
7 4 1
Public Assistance Referrals/Information
7 3 2
Nutrition Information/Referrals
6 4 0
Housing Referrals 5 5 1 Food Referrals 5 5 1 Legal Referrals 4 5 1 Children’s Clothing Assistance
4 5 1
GED Preparation 4 5 0 ESL Adult Study Groups 4 5 0 Adult Education Study Groups
3 5 1
Computer Training 3 5 1 Public Assistance/Income
• Only three respondents (19%) indicated that they are receiving cash assistance from AFS.
• Eleven out of 15 of the respondents (73%) had a total family income of less than $21,000 last year.
Childcare and other Family Needs
• Ten respondents (63%) reported that they are working at least 11 hours per week; 5 of those are working full-time.
• Eight of 12 respondents (67%) indicated a need for weekly childcare ranging from 10 hours to over 40 hours per week.
• Seven respondents reported that someone outside of the home provided childcare for their child(ren).
• Ten respondents indicated that family or a relative provides childcare for their child(ren).

Portland Public Schools Head Start
52
• Seven of 13 respondents (54%) reported that their childcare needs vary from day to day. • Eleven respondents (69%) expressed a desire for a 5-day per week program. • Basic needs (food and clothing), dental care, employment and transportation were listed
as the respondents’ greatest family needs.
Ranking of Greatest needs
Number of Respondents
Percent of Respondents*
Basic Needs 9 56.3% Dental Care 7 43.8% Employment 6 37.5% Transportation 6 37.5% Medical Care 5 31.3% Education 4 25.0% Childcare 3 18.8% Housing 1 6.3% Parenting Education 1 6.3% Other 0 0.0%
Demographics
• Six respondents (38%) are in a single-parent family and 7 respondents (44%) are in a 2-parent family.
• Most respondents reside in North (6) and Southeast Portland (6). • Eleven respondents(63%) had either 2 or 3 children at home. • Thirteen respondents (81%) speak English at home.

Portland Public Schools Head Start
53
Formerly Enrolled Families The purpose of surveying formerly enrolled families is to obtain information about family needs while enrolled in Head Start, and about participation and satisfaction with program services that were available to them during the time of enrollment. Four hundred surveys were mailed to formerly enrolled families and 15 surveys were completed and returned. The response rate was only 4 percent. Follow-up telephone calls were made to those who did not return the survey in an attempt to boost the response rate. Two hundred five phone numbers were either the wrong number, or were disconnected; about 70 families were not available. Fifteen respondents participated in this survey. The survey responses pertain to the respondents’ past experience with Head Start. Not all respondents answered all questions. Findings Program Participation and Service Evaluation
• Eleven respondents (73%) were enrolled in Head Start less than 12 months. • Eleven respondents (73%) were enrolled in the Center-based program. • Thirteen respondents (87%) had problems with transportation to and from the Head Start
site, but did not indicate a need for transportation provided by Head Start. • At least 14 respondents (93%) were satisfied with the classroom program and receiving
information about their child’s progress. • Not more than 1 respondent reported being dissatisfied with any Head Start program
(see table below). • Two respondents (13%) indicated dissatisfaction with their child’s transition into
kindergarten. • Only 1 respondent indicated participation in the job training program; the majority of
respondents did not participate because of they were not interested in the program.

Portland Public Schools Head Start
54
HEAD START SERVICES SATISIFIED NO OPINION SOMEWHAT DISSATISFIED
Children Services Information About My Child’s Progress
15 0 0
Classroom Program 14 1 0 Hearing 8 4 0 Dental Exams 7 3 1 Vision Services 7 3 1 Speech 7 5 0 Physical Health/Exams 6 3 1 Immunizations 5 6 0 Disability Services 1 9 0 Mental Health Services 1 8 0
Family Services Home Visits 10 2 1 Nutrition Information/Referrals
6 3 1
Food Referrals 6 3 1 Public Assistance Referrals/Information
6 3 1
Counseling Referrals and Information
5 4 1
Children’s Clothing Assistance
4 3 1
Parent Training Opportunities
4 5 1
Legal Referrals 2 7 0 Housing Referrals 2 5 1 Adult Education Study Groups
2 6 1
Job Information/Referrals 2 6 1 Computer Training 2 6 1 GED Preparation 1 6 1 ESL Adult Study Groups 1 6 1 Prenatal Care 1 6 1
Public Assistance/Income
• Thirteen respondents (87%) indicated that they did not receive cash assistance from AFS.
• Thirteen respondents (87%) were affected by the Welfare to Work program. • About half of the respondents had a total family income of $25,000 or less and half had
income of over $25,000 last year. Childcare and other Family Needs
• Five respondents reported working full-time while enrolled in Head Start. • About one-half of the respondents reported working any amount of hours while enrolled
in Head Start. • Twelve (80%) reported a need for childcare while enrolled in Head Start.

Portland Public Schools Head Start
55
• Ten respondents (83% of those who answered the question) indicated a need for childcare 20 or fewer hours per week while enrolled.
• Eleven respondents (79% of those who answered the question) expressed a desire for a 5-day per week program.
• Dental and medical care, basic needs (food and clothing), and education were listed as the respondents’ greatest family needs.
Demographics
• Nine respondents (50%) were in 2-parent families. • Nine respondents (69% of those who answered the question) had either 1 or 2
children at home. • Twelve respondents (86%) are residing in Northeast or Southeast Portland. • Thirteen respondents (93% of those who answered the question) speak English at
home.

Portland Public Schools Head Start
56
Community Professionals The purpose of surveying community professionals who have had a relationship with PPS Head Start is to obtain information about family needs of their clients and about participation and satisfaction with Head Start program services as a resource for their clients. Surveys were mailed to 12 community professionals. Seven questionnaires were completed and returned. The response rate was 58 percent. Follow-up telephone calls were made in an attempt to boost the response rate. Seven respondents participated in this survey. Not all respondents answered every question. Findings Services Provided
• Six out of seven provide services to Head Start. • Six out of seven provide services to children with special needs, low-income children,
and people with drug and alcohol concerns. Service Evaluation
• No respondents indicated that the Head Start programs they are familiar with had no value.
• Respondents were most positive about parent education, education services, referral to other agencies, and health services. They were least enthusiastic about the GED program, the family literacy program, and Adult ESL classes. See table below.
Head Start Programs Has Value
(3 points) No Opinion
(2 points) Has No Value
(1 point) Weighted Score*
(e.g. 3= has value, 2 = no opinion)
Parent education 6 0 0 3.00 Education services 6 0 0 3.00 Referral to other agencies
6 0 0 3.00
Health services 6 0 0 3.00 Information regarding preschoolers
5 0 0 3.00
Children with special needs
5 0 0 3.00
Home visits 5 0 0 3.00 Nutrition services 6 1 0 2.86 Prenatal Care 5 1 0 2.83 Adult ESL classes 4 2 0 2.67 Family literacy program
3 2 0 2.60
GED program 3 2 0 2.60 *The responses for each program were weighted and added together to determine the overall level of value for each program - based on the opinions in this survey only.

Portland Public Schools Head Start
57
Family Needs and Barriers to Meeting the Needs
• The five greatest needs of the respondents’ clients as perceived by respondents are: 1) Education 2) Health 3) Nutrition 4) Employment 5) Parent Training
• The most frequently mentioned barrier to the clients’ ability to meet the family needs mentioned above is: Costs and lack of funding
A list of the barriers that the respondents’ clients face is in the table below.
Barriers to meeting family needs
Barrier Responses
Costs / funding 15
Lack of insurance 3
Lack of availability 1
Lack of job skills 1
Transportation 0
Lack of childcare 0
Lack of interpreters 0
Inflexible hours 0 Needed Community Resources
The most needed community resources or services that would be helpful to families, but are currently unavailable or are available but lacking in some way are:
• Basic needs, such as food and clothing • Affordable housing

Portland Public Schools Head Start
58
FINDINGS FROM PROGRAM INFORMATION REPORTS Portland Public Schools (PPS) Head Start, 2000-2004
Head Start programs are required to compile and submit an annual Program Information Report (PIR) to the federal Head Start Bureau. The data required to complete the PIR pertain to currently enrolled children and families in a specific Head Start program. The following are the most important changes in the PIR data for PPS Head Start between the school years 2000-01 and 2003-04. The figures in parentheses represent the corresponding total number of and/or percentage increase for the period, unless otherwise specified. * Enrollment increased from 560 in 2000-2001 to 687 in 2003-2004, an increase of 23 percent. * In 2003-2004, enrollment was comprised of almost three-quarters ethnic minorities. The percentage has increased steadily since 2000-2001 to 73 percent of the total. Hispanics surpassed whites as the largest racial/ethnic group, and comprised 35 percent of all enrolled children in 2003-2004. Between 2000-2001 and 2003-2004, the percentage of Hispanic children rose by 26 percent, while the percentage of white children decreased by 15 percent. The number of black children rose by almost 22 percent, while their percentage of all children remained essentially the same, near 18 percent. * English is the dominant language for slightly more than one-half of the total enrollment. The percentage of children enrolled coming from non-English-speaking homes increased by 39 percent, from 34 percent to 48 percent of the total enrollment from 2000-01 to 2003-04. * Of the enrollees whose dominant language was not English, about 70 percent spoke Spanish in 2003-04.
* From 2000-2001 to 2003-2004, the number of PPS families needing full-day, full year childcare increased by 46 percent. In 2003-2004, 44 percent of those families received full day/full year services through PPS Head Start. * Between 2000-2001 and 2003-2004, the percentage of children with health insurance has fluctuated between 69 percent and 90 percent. In 2003-2004, only 79 percent of enrolled children had health insurance. Between 48 and 68 percent of enrolled children had public health insurance. In 2003-04, 66 percent were covered by public health insurance. * Between 74 and 86 percent of enrolled children completed medical screening during the past 4 years. In 2003-04, 27 percent of those screened were diagnosed as needing medical treatment. * Most enrolled children that received medical treatment were treated for asthma, hearing, or vision problems. * Just over half of all Head Start families (56 percent) were two-parent families in 2003-2004, and that percentage has been increasing slightly since 2001-02. * In 2003-04, 63 percent of the heads of household in the enrolled families did not graduate from high school and that percentage increased from 40 percent in 2001-02; 26 percent did have

Portland Public Schools Head Start
59
a high school diploma or GED, and 10 percent had attended college. A small percentage had earned a college degree. * Less than 10 percent of enrolled children’s parents were in job training or school during the past 3 years. * The percentage of employed parents decreased from 2001-02 to 2003-04. In 2003-04, neither parent was working in 28 percent of 2 parent families, an increase from 6 percent in 2001-02.In single-parent families, 44 percent of the parents were not working in 2003-04, an increase from 26 percent in 2001-02. * Close to 100 percent of enrolled families received health and parenting education. * There was an increase during the past 3 years in the number of enrolled parents receiving emergency/crisis intervention and ESL services. In 2003-04, 45 percent received emergency/crisis intervention and 30 percent received ESL services. Also during the same year, 30 percent received TANF and 40 percent received WIC services. * Thirteen to 15 percent of enrolled children were diagnosed with a disability during the past 3 years; most had a physical disability.

Portland Public Schools Head Start
60
APPENDIX 1
INITIAL FINDINGS FROM DEMOGRAPHIC AND SOCIOECONOMIC DATA FOR THE SERVICE AREA AND COUNTY
Findings are for the service area unless otherwise noted. Population
• The population in the service area is increasing at a rate of under 1 percent per year. Population in Multnomah County is increasing at a slightly higher rate.
• Although from 1996 to 2003 the population ages 0-5 experienced an overall decrease of
over 1,700 children at an average annual rate of -1 percent (an average of 248 fewer children per year), it is estimated that during 2000-2003 the rate of decrease slowed down and that the average annual decreases dropped to only about 61 fewer children in the service area per year.
• The population ages 0-5 has been increasing in the County with growth rates higher from
2000-2003 than during 1996-2000.
Minorities
• The proportion that ethnic minorities represent of the total population is increasing in both the service area and in Multnomah County.
• The proportion that ethnic minorities represent of the total population is about 30
percent. • Blacks represent the largest minority group (9.7% in 2002), followed by Hispanics
(8.5%). • Hispanics are increasing at the fastest rate amongst all minority groups.
Births
• Although the number of births decreased by an average of 46 births per year from 1996-2002, the number of births in 2002 about 4,500.
• From 1996-2002, the number of births in Multnomah County increased by an average of
36 births per year.
Households
• Family households with children represent about 25 percent of all households.
• About 42 percent of children’s households are also single-parent households.

Portland Public Schools Head Start
61
• Single-parent households have been increasing since at least 2000.
English Ability/Language
• The number and percentage of persons who speak little to no English have increased since 1996.
• Forty-two percent of those who don’t speak English or do not speak English well, speak
Spanish. • The number of persons who speak Spanish but little or no English are increasing at a
faster rate than those who speaking another language Mobility
• Since at least 1996, more than one-half of the population moved in the previous 5 years. • Over half of the movers moved from within in Multnomah County, but that percentage
has been decreasing since 1996. Education
• Approximately 59 percent, or 132,600 persons ages 25 and older do not hold a college degree.
• Over 32,000 persons have not earned a high school diploma (including GED).
Employment
• It is estimated that in 2003 there were over 18,000 unemployed persons in the service area and that the unemployment rate is estimated to have been about 10 percent.
• The proportion of persons that are participating in the labor force is increasing.
• A higher proportion of the population in the service area is participating in the labor
force than in Multnomah County.
• About 69 percent of women with children under 6, or 6,500 women with children under 6, are participating in the labor force.
Income and Poverty
• It is estimated that about 33,500 households, or 26 percent of all households had an annual income of less than $20,000 in 2003.

Portland Public Schools Head Start
62
• Forty-four percent of persons living below the poverty level in Multnomah County reside in areas that overlap the PPS Head Start service area.
• The 2003 poverty rate is estimated to be 15.3 percent.
• The service area poverty rates have been higher than the Multnomah County rates since at least 1996.
• The 2003 poverty rate for children under age 6 years of age was over 23 percent, which is 8 percentage points higher than the poverty rate for the general population.
• In 2003, 66 percent of children under age 6 whose family had income below the poverty level resided in single-parent families.
Special Needs Children
• In 2003, it is estimated that almost 1,500 children ages 3-4 were eligible to receive Head Start services in the service area and almost one-quarter did not receive Head Start services.
• In Multnomah County in 2003, over 9,600 children in families that were covered by Medicaid did not receive well-child health care.
• It is estimated that in 2003 1,300 children ages 0-5 in Multnomah County had a mental disability.
• Although the number of births to teen mothers has been decreasing in the service area,, there were approximately 350 births to teens in 2002.
• The number of births to teens has been declining in all racial groups, however, they have been increasing in the Hispanic ethnic group.
• Over 60 percent of children ages 0-5 may have an unmet need for childcare in Portland and in Multnomah County.

Portland Public Schools Head Start
63
APPENDIX 2
SURVEY QUESTIONNAIRES AND RESPONSE TABLES The responses to the survey questions are displayed below for each of the three surveys: 1)Currently enrolled families, 2) Formerly enrolled families, and 3) Community partners. Also included in the response tables are the percentages of responses. Questionnaire Responses from Currently Enrolled Families One hundred twenty surveys were distributed to currently enrolled families;16 questionnaires were completed and returned. The response rate was 13 percent. On questions where more than one response was requested, the number of responses add up to more than 16 (the number of survey participants), and the total percentage of responses is more than 100%. Additionally, on questions where not all survey participants provided a response, the total number of responses is less than 16. Q-1 What means of transportation do you use to travel to and from Head Start? (please check only your primary mode of transportation)
Means of Transportation
Number of Responses
Percent of Responses
Car 10 62.5% Bus or Max 4 25.0% HS provided 0 0.0% Other 2 12.5% None 0 0.0%
Q-2 Do you have, or have you ever had, problems finding adequate transportation to
and from Head Start?
Problems with Transportation
Number of Responses
Percent of Responses
Yes 5 31.3% No 11 68.8%

Portland Public Schools Head Start
64
2a If yes, have you had problems with transportation to any of the following locations? (please check all that apply)
Problems with Transportation to:
Number of Responses
Percent of Responses
Parent activities/ committees 4 80.0%
Socializations 2 40.0% Child's childcare 4 80.0% Other 0 0.0%
Q-3 At present, do you need any assistance with transportation? If yes, please describe:
Assistance with Transportation
Number of Responses
Percent of Responses
Yes 8 61.5% Sometimes 1 7.7% No 4 30.8%
Next, we would like to ask you about services at Head Start. Q-4 Please rate each of the following Head Start Services. If a service on the list below
does not apply to you, please leave the corresponding boxes blank.
Classroom Program
Number of Responses
Percent of Responses
Information about my Child's Progress
Number of Responses
Percent of Responses
Disability services
Number of Responses
Percent of Responses
Satisfied 14 100.0% Satisfied 12 85.7% Satisfied 2 25.0% No opinion 0 0.0%
No opinion 1 7.1%
No opinion 5 62.5%
Dissatisfied 0 0.0%
Dissatisfied 1 7.1%
Dissatisfied 1 12.5%
Mental Health Services
Number of Responses
Percent of Responses
Physical Health/Exams
Number of Responses
Percent of Responses
Dental Exams
Number of Responses
Percent of Responses
Satisfied 3 33.3% Satisfied 10 76.9% Satisfied 11 78.6% No opinion 6 66.7%
No opinion 3 23.1%
No opinion 3 21.4%
Dissatisfied 0 0.0%
Dissatisfied 0 0.0%
Dissatisfied 0 0.0%

Portland Public Schools Head Start
65
Vision Services
Number of Responses
Percent of Responses
Immunizations
Number of Responses
Percent of Responses
Speech Number of Responses
Percent of Responses
Satisfied 10 76.9% Satisfied 5 55.6% Satisfied 5 50.0% No opinion 3 23.1%
No opinion 4 44.4%
No opinion 5 50.0%
Dissatisfied 0 0.0%
Dissatisfied 0 0.0%
Dissatisfied 0 0.0%
Hearing Number of
Responses Percent of Responses
Home visits Number of Responses
Percent of Responses
Legal referrals
Number of Responses
Percent of Responses
Satisfied 7 70.0% Satisfied 11 84.6% Satisfied 4 40.0% No opinion 3 30.0%
No opinion 2 15.4%
No opinion 5 50.0%
Dissatisfied 0 0.0%
Dissatisfied 0 0.0%
Dissatisfied 1 10.0%
Housing referrals
Number of Responses
Percent of Responses
Nutrition/Information referrals
Number of Responses
Percent of Responses
Children's clothing assistance
Number of Responses
Percent of Responses
Satisfied 5 45.5% Satisfied 6 60.0% Satisfied 4 40.0% No opinion 5 45.5%
No opinion 4 40.0%
No opinion 5 50.0%
Dissatisfied 1 9.1%
Dissatisfied 0 0.0%
Dissatisfied 1 10.0%
Adult education study groups
Number of Responses
Percent of Responses
GED preparation
Number of Responses
Percent of Responses
Food referrals
Number of Responses
Percent of Responses
Satisfied 3 33.3% Satisfied 4 44.4% Satisfied 5 45.5% No opinion 5 55.6%
No opinion 5 55.6%
No opinion 5 45.5%
Dissatisfied 1 11.1%
Dissatisfied 0 0.0%
Dissatisfied 1 9.1%
Public Assistance Referrals/Information
Number of Responses
Percent of Responses
Computer Training
Number of Responses
Percent of Responses
Satisfied 7 58.3% Satisfied 3 33.3% No opinion 3 25.0% No opinion 5 55.6% Dissatisfied 2 16.7% Dissatisfied 1 11.1% Next, we would like to ask you a few questions about your participation in job training and other public assistance programs.

Portland Public Schools Head Start
66
Q-5 Since enrolling in Head Start, have you received, or are you currently receiving, job training?
Received Job Training
Number of Responses
Percent of Responses
Yes 2 12.5% No 14 87.5%
Q-6 Since enrolling in Head Start, please check all of the places you have received or are
receiving job training.
Job Training at EHSFC
Number of Responses
Percent of Responses
Job training at Job Corps/Pivot
Number of Responses
Percent of Responses
Job training at PPS HS GED/ESL
Number of Responses
Percent of Responses
Yes 0 0.0% Yes 0 0.0% Yes 1 6.3% No 16 100.0% No 16 100.0% No 15 93.8%
Job Training at AHS CTA
Number of Responses
Percent of Responses
Job training at Urban League
Number of Responses
Percent of Responses
Job training at PCC Skills Center
Number of Responses
Percent of Responses
Yes 0 0.0% Yes 0 0.0% Yes 0 0.0% No 16 100.0% No 16 100.0% No 16 100.0%
Job Training at other
Number of Responses
Percent of Responses
Yes 0 0.0% No 16 100.0%
GO TO Q-8
Q-7 Which of the following statements best describes your reason for not receiving job
training?
Do not need it
Number of Responses
Percent of Responses
Do not know what is available
Number of Responses
Percent of Responses
Not able due to lack of childcare
Number of Responses
Percent of Responses
No 0 0.0% No 0 0.0% No 0 0.0% Yes 7 50.0% Yes 3 21.4% Yes 2 14.3%
Not able due to lack of transportation
Number of Responses
Percent of Responses
Other Number of Responses
Percent of Responses
No 0 0.0% No 0 0.0% Yes 2 14.3% Yes 2 14.3%

Portland Public Schools Head Start
67
Q-8 Do you receive cash assistance from Adult and Family Services?
Receive cash assistance from Adult & Family Services
Number of Responses
Percent of Responses
No 13 81.3% Yes 3 18.8%
Q-9 Has the Welfare to Work program affected you?
Affected by the Welfare to Work program
Number of Responses
Percent of Responses
Yes 1 7% No 12 86% Do not know 1 7%
Q-9a If Yes, how has the program affected you?
Affected by: Number of Responses
Percent of Responses
Lack of assistance due to school 0 0% Decreased household income 1 100% Economic assistance 0 0% Increased insurance and children services 0 0%
Now, we would like to ask you some questions about your family’s childcare needs.
Q-10 Please indicate how many children in your household are in each of the age
categories, and how many of those children are enrolled in the Head Start Program, by entering the appropriate responses in each category.
Age Number of
Responses w/Children
Percent of Responses
Number of Children Amongst Responses*
Children in Head Start Program Amongst Responses**
Under 6 months 0 0.0% 0 0 6 months to 1 year 1 6.3% 1 0 1-2 years 1 6.3% 1 1 2-3 years 3 18.8% 3 0 3-5 years 16 100% 18 18 Over 5 years 12 75.0% 19 1
*there are 42 children in the 16 families that responded to this question **amongst the 16 families that responded to this question, there are 20 children enrolled in Head Start.

Portland Public Schools Head Start
68
Q-11 Are you pregnant?
Pregnant Number of Responses
Percent of Responses
No 14 87.5% Yes 1 6.3% Not applicable 1 6.2%
Q-12 Does anyone outside of your household ever provide care for your children?
Outside your household that provides care
Number of Responses
Percent of Responses
No 9 56.3% Yes 7 43.8%
Q-13 Who provides care for your children? From the list provided below, please check
all the providers you use, and whether the provider is paid or unpaid.
Childcare Provider Paid Unpaid Total Percent of Responses
Family or Relative 5 5 10 52.6%
Friend or Non-relative 4 2 6 31.6%
Early Head Start Family Center 0 1 1 5.3%
Other Head Start Center 0 0 0 0.0%
Other Childcare Center 2 0 2 10.5%
Other 0 0 0 0.0%

Portland Public Schools Head Start
69
Q-14 Do you receive a childcare subsidy, such as financial assistance for childcare from the government?
Receives childcare subsidy
Number of Responses
Percent of Responses
No 11 73.3% Yes covers full cost 2 13.3% Yes covers part of the cost 2 13.3%
14a From whom do you receive your childcare subsidy?
Received childcare subsidy from:
Number of Responses
Percent of Responses
AFS/ERDC/ Jobs Great Start 3 75.0% Other 1 25.0%
Q-15 How many hours per week do you spend doing each of the following? Please write
the appropriate number on each line provided. Paid employment hours per week
Number of Responses
Percent of Responses
Job Training hours per week
Number of Responses
Percent of Responses
School hours per week
Number of Responses
Percent of Responses
0 2 16.7% 0 7 87.5% 0 8 66.7% 1-4 0 0.0% 35 1 12.5% 1-4 0 0.0% 5-10 0 0.0% 5-10 2 16.7% 11-25 1 8.3% 11-25 1 8.3% 26-30 3 25.0% 26-30 0 0.0% 31-35 1 8.3% 31-35 0 0.0% 36-40 5 41.7% 36-40 1 8.3% Over 40 0 0.0% Over 40 0 0.0%

Portland Public Schools Head Start
70
Q-16 How many hours of childcare do you need per week?
Hours of childcare needed per week
Number of Responses
Percent of Responses
0 5 38.5% 10 2 15.4% 15 1 7.7% 21 1 7.7% 25 1 7.7% 34 1 7.7% 40 1 7.7% 43 1 7.7%
Q-17 What hours of the day do you need childcare?
What hours of the day need childcare
Number of Responses
Percent of Responses
No hours 5 35.7% Between 6am and 6pm 4 28.6% Other hours 5 35.7%
17a Do your childcare needs vary day to day during the week?
Needs of child vary during the week
Number of Responses
Percent of Responses
No 6 46.2% Yes 7 53.8%
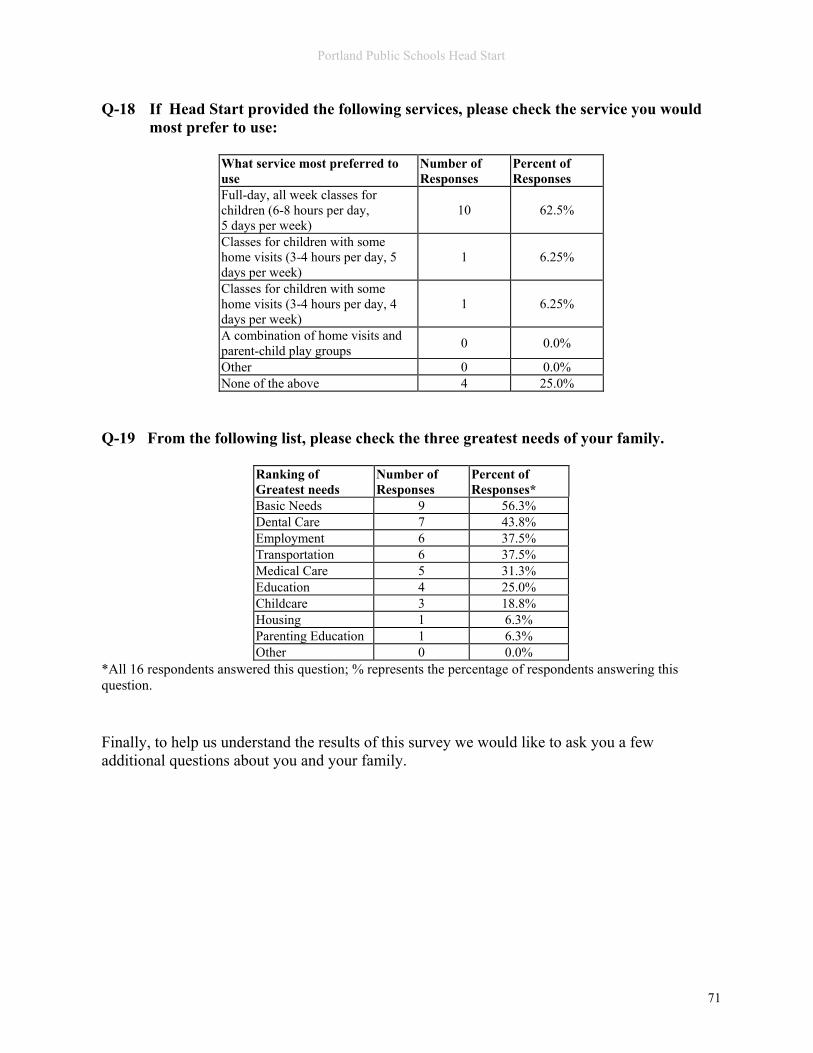
Portland Public Schools Head Start
71
Q-18 If Head Start provided the following services, please check the service you would most prefer to use:
What service most preferred to use
Number of Responses
Percent of Responses
Full-day, all week classes for children (6-8 hours per day, 5 days per week)
10 62.5%
Classes for children with some home visits (3-4 hours per day, 5 days per week)
1 6.25%
Classes for children with some home visits (3-4 hours per day, 4 days per week)
1 6.25%
A combination of home visits and parent-child play groups 0 0.0%
Other 0 0.0% None of the above 4 25.0%
Q-19 From the following list, please check the three greatest needs of your family.
Ranking of Greatest needs
Number of Responses
Percent of Responses*
Basic Needs 9 56.3% Dental Care 7 43.8% Employment 6 37.5% Transportation 6 37.5% Medical Care 5 31.3% Education 4 25.0% Childcare 3 18.8% Housing 1 6.3% Parenting Education 1 6.3% Other 0 0.0%
*All 16 respondents answered this question; % represents the percentage of respondents answering this question. Finally, to help us understand the results of this survey we would like to ask you a few additional questions about you and your family.

Portland Public Schools Head Start
72
Q-20 In which Head Start program model(s) do you participate? (check all that apply) (is this a complete list of the models for all 4 H.S. Programs?)
Program participating
Number of Responses
Percent of Responses*
Center-based 13 81.3% Combination 1 6.3% Oregon Pre-kindergarten program 3 18.8
Q-21 Is your family a:
Type of family Number of Responses
Percent of Responses
Single Parent Family 6 40.0% Two Parent Family 7 46.7% Foster Family 2 13.3% Other Family Type 0 0.0%
Q-22 Which of the following best describes where you live?
Location Number of Responses
Percent of Responses
North Portland 6 37.5% Northeast Portland 3 18.8% Southeast Portland 6 37.5% Southwest Portland 1 6.3%
Q-23 How many times have you moved in the past year?
Times moved in Past year
Number of Responses
Percent of Responses
None 8 50.0% Once 6 37.5% Twice 2 12.5% 3 or more 0 0.0%
Q-24 Where did you live 5 years ago?
City living in 5 years ago
Number of Responses
Percent of Responses
State living in 5 years ago
Number of Responses
Percent of Responses
Country living in 5 years ago
Number of Responses
Percent of Responses
Portland 11 68.8% Oregon 12 75.0% United States 15 93.8% Other 5 31.3% Other 4 25.0% Other 1 6.3%

Portland Public Schools Head Start
73
Q-25 What language do you speak at home?
Language Spoken at Home
Number of Responses
Percent of Responses
English 13 86.7% Spanish 2 13.3% Other 0 0.0%
25a How well do you speak English?
Speaks English Number of Responses
Percent of Responses
Not at all 0 0.0% Not well 0 0.0% Well 2 13.3% Very well 13 86.7%
Q-26 What was your family’s income for the last month (before taxes)?
Family income last month
Number of Responses
Percent of Responses
$0 to $400 4 25.0% $401 to $800 1 6.3% $801 to $1,200 2 12.5% $1,201 to $1,600 4 25.0% $1,601 to $2,000 3 18.8% More than $2,000 2 12.5%
Q-27 Overall, what was your family’s total income last year?
Total Income last year
Number of Responses
Percent of Responses
$0 to $2,999 3 20.0% $3,000 to $8,999 2 13.3% $9,000 to $11,250 0 0.0% $11,251 to $17,050 2 13.3% $17,051 to $20,999 4 26.7% $21,000 to $25,999 0 0.0% $26,000 to $35,999 1 6.7% $36,000 to $40,999 3 20.0%

Portland Public Schools Head Start
74
Q-28 How many people (adults and children) are supported by this income? Please write in the number on the lines provided.
Number supported
Adults supported by this income
Percent of Responses
Children supported by this income
Percent of Responses
One 3 18.8% 1 6.3% Two 11 68.8% 8 50.0% Three 1 6.3% 3 18.8% Four 1 6.3% 2 12.5% Five 3 18.8% 1 6.3% Eight 0 0.0% 1 6.3%
Q-29 What is your address (including zip code)?
Zip Code Number of Responses
Percent of Responses
97202 3 18.8% 97203 2 12.5% 97206 2 12.5% 97211 1 6.3% 97217 4 25.0% 97220 1 6.3% 97232 1 6.3% 97266 2 12.5%
Q-30 Is there anything else you would like to tell us about the Head Start Program you
participated in?
Comments
Number of
Responses Excellent educational program 4 Excellent teachers and/or staff 3 More communication needed between parents & teachers 2 Transportation needed to HS 2 Enjoyed parent involvement opportunities 1 Great support for families 1 Good care for children 1 Good support services 1 Parent support groups needed 1 Insufficient funding 1

Portland Public Schools Head Start
75
Questionnaire Responses from Formerly Enrolled Families A total of 400 surveys were mailed and 15 surveys were completed and returned. The response rate was 4 percent. On questions where more than one response was requested, the number of responses add up to more than 15 (the number of survey participants), and the total percentage of responses is more than 100%. Additionally, on questions where not all survey participants provided a response, the total number of responses is less than 15. Q-1 How long were you involved in Head Start?
Months involved Number of Respondents
Percent of Respondents
Less than 12 11 73.3% 12 to 23 1 6.7% 24 to 35 1 6.7% 36 or more 2 13.3%
Q-2 What means of transportation did you use to travel to and from Head Start? (please
check only your primary mode of transportation)
Means of Transportation
Number of Respondents
Percent of Respondents
Car 8 53.3% Bus or Max 2 13.3% HS provided 3 20.0% Other 2 13.3% None 0 0.0%
Q-3 Did you have problems finding adequate transportation to and from Head Start?
Problems with Transportation
Number of Respondents
Percent of Respondents
Yes 13 86.7% No 2 13.3%

Portland Public Schools Head Start
76
3a If yes, did you have problems with transportation to any of the following locations? (please check all that apply)
Problems with Transportation to:
Number of Respondents
Percent of Respondents
Parent activities/ committees 1 50.0%
Socializations 1 50.0%
Q-4 Did you need any assistance with transportation? If yes, please describe:
Assistance with Transportation
Number of Respondents
Percent of Respondents
Yes 2 20.0% No 8 80.0%
Next, we would like to ask you about services at Head Start. Q-5 Please rate each of the following Head Start Services. If a service on the list below does not apply to you, please leave the corresponding boxes blank.
Classroom Program
Number of Respondents
Percent of Respondents
Information about my Child's Progress
Number of Respondents
Percent of Respondents
Disability services
Number of Respondents
Percent of Respondents
Satisfied 14 93.3% Satisfied 15 100% Satisfied 1 10.0% No opinion 1 6.7%
No opinion 0 0.0%
No opinion 9 90.0%
Dissatisfied 0 0.0%
Dissatisfied 0 0.0%
Dissatisfied 0 0.0%
Mental Health Services
Number of Respondents
Percent of Respondents
Physical Health/Exams
Number of Respondents
Percent of Respondents
Dental Exams
Number of Respondents
Percent of Respondents
Satisfied 1 11.1% Satisfied 6 60.0% Satisfied 7 63.6% No opinion 8 88.9%
No opinion 3 30.0%
No opinion 3 27.3%
Dissatisfied 0 0.0%
Dissatisfied 1 10.0%
Dissatisfied 1 9.1%

Portland Public Schools Head Start
77
Vision Services
Number of Respondents
Percent of Respondents
Immunizations
Number of Respondents
Percent of Responden
ts
Speech Number of Respondents
Percent of Respondents
Satisfied 7 63.6% Satisfied 5 45.5% Satisfied 7 58.3% No opinion 3 27.3%
No opinion 6 54.5%
No opinion 5 41.7%
Dissatisfied 1 9.1%
Dissatisfied 0 0.0%
Dissatisfied 0 0.0%
Hearing Number of
Respondents
Percent of Respondents
Home visits Number of Respondents
Percent of Respondents
Legal referrals
Number of Respondents
Percent of Respondents
Satisfied 8 66.7% Satisfied 10 76.9% Satisfied 2 22.2% No opinion 4 33.3%
No opinion 2 15.4%
No opinion 7 77.8%
Dissatisfied 0 0.0%
Dissatisfied 1 7.7%
Dissatisfied 0 0.0%
Housing referrals
Number of Respondents
Percent of Respondents
Nutrition/Information referrals
Number of Respondents
Percent of Respondents
Children's clothing assistance
Number of Respondents
Percent of Respondents
Satisfied 2 25.0% Satisfied 6 60.0% Satisfied 4 50.0% No opinion 5 62.5%
No opinion 3 30.0%
No opinion 3 37.5%
Dissatisfied 1 12.5%
Dissatisfied 1 10.0%
Dissatisfied 1 12.5%
Adult education study groups
Number of Respondents
Percent of Respondents
GED preparation
Number of Respondents
Percent of Respondents
Food referrals
Number of Respondents
Percent of Respondents
Satisfied 2 22.2% Satisfied 1 12.5% Satisfied 6 60.0% No opinion 6 66.7%
No opinion 6 75.0%
No opinion 3 30.0%
Dissatisfied 1 11.1%
Dissatisfied 1 12.5%
Dissatisfied 1 10.0%
Counseling referrals and information
Number of Respondents
Percent of Respondents
Job information/Referrals
Number of Respondents
Percent of Respondents
Parent training opportunities
Number of Respondents
Percent of Respondents
Satisfied 5 55.6% Satisfied 2 22.2% Satisfied 4 40.0% No opinion 4 44.4% No opinion 6 66.7% No opinion 5 50.0% Dissatisfied 0 0.0% Dissatisfied 1 11.1% Dissatisfied 1 10.0%

Portland Public Schools Head Start
78
ESL adult study groups
Number of Respondents
Percent of Respondents
Public Assistance Referrals/Information
Number of Respondents
Percent of Respondents
Computer Training
Number of Respondents
Percent of Respondents
Satisfied 1 12.5% Satisfied 6 60.0% Satisfied 2 22.2% No opinion 6 75.0% No opinion 3 30.0% No opinion 6 66.7% Dissatisfie
d 1 12.5% Dissatisfied
1 10.0% Dissatisfied
1 11.1%
Prenatal Care Program
Number of Respondents
Percent of Respondents
Satisfied 1 12.5% No opinion 6 75.0% Dissatisfied 1 12.5% Q-6 How do you feel about your child’s transition into kindergarten?
Child's Transition Number of Respondents
Percent of Respondents
Very Satisfied 10 71.4% Somewhat satisfied 1 7.1% No opinion 1 7.1% Somewhat dissatisfied 1 7.1% Very dissatisfied 1 7.1%
Q-7 How could Head Start have assisted or improved this transition?
Assistance or Improvement Number of Respondents
Percent of Respondents
Information availability for parents 0 0% Transportation 0 0% Post-program involvement 1 8% Increase core skill development 2 17% More individual attention 0 0% No change necessary 9 75%
Next, we would like to ask you a few questions about your participation in job training and other public assistance programs. Q-8 While enrolled in Head Start, did you receive job training?
Received Job Training
Number of Respondents
Percent of Respondents
Yes 1 6.7% No 14 93.3%

Portland Public Schools Head Start
79
Q-9 While enrolled in Head Start, please check all of the places you received job training.
Job Training at EHSFC
Number of Respondents
Percent of Respondents
Job Training at Steps to Success
Number of Respondents
Percent of Respondents
Job training at Job Corps/Pivot
Number of Respondents
Percent of Respondents
Yes 0 0.0% Yes 0 0.0% Yes 0 0.0% No 15 100.0% No 15 100.0% No 15 100.0%
Job Training at Urban League
Number of Respondents
Percent of Respondents
Job training at PCC Skills Center
Number of Respondents
Percent of Respondents
Job training at other
Number of Respondents
Percent of Respondents
Yes 0 0.0% Yes 0 0.0% Yes 0 0.0% No 15 100.0% No 15 100.0% No 15 100.0%
GO TO Q-11
Q-10 Which of the following statements best describes your reason for not receiving job
training?
Not Interested
Number of Respondents
Percent of Respondents
Didn’t need it
Number of Respondents
Percent of Respondents
Didn’t know what is available
Number of Respondents
Percent of Respondents
No 12 83.3% No 6 42.9% No 11 78.6% Yes 2 16.6% Yes 8 57.1% Yes 3 21.4%
Q-11 Did you receive cash assistance from Adult and Family Services while enrolled in
Head Start?
Received cash assistance from Adult & Family Services
Number of Respondents
Percent of Respondents
No 13 92.9% Yes 1 7.1%
Q-12 Have you been affected by the Welfare to Work program?
Affected by the Welfare to Work program
Number of Respondents
Percent of Respondents
No 13 92.9% Yes 1 7.1% Do not know 0 0.0%
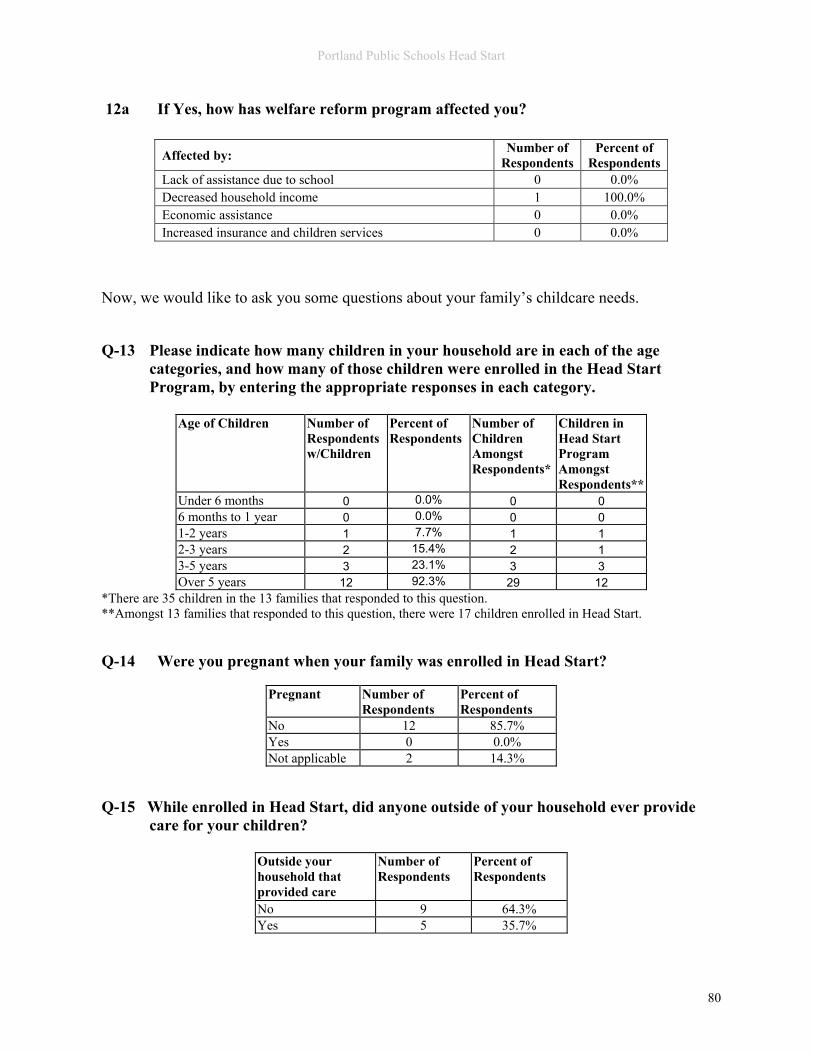
Portland Public Schools Head Start
80
12a If Yes, how has welfare reform program affected you?
Affected by: Number of Respondents
Percent of Respondents
Lack of assistance due to school 0 0.0% Decreased household income 1 100.0% Economic assistance 0 0.0% Increased insurance and children services 0 0.0%
Now, we would like to ask you some questions about your family’s childcare needs.
Q-13 Please indicate how many children in your household are in each of the age
categories, and how many of those children were enrolled in the Head Start Program, by entering the appropriate responses in each category.
Age of Children Number of
Respondents w/Children
Percent of Respondents
Number of Children Amongst Respondents*
Children in Head Start Program Amongst Respondents**
Under 6 months 0 0.0% 0 0 6 months to 1 year 0 0.0% 0 0 1-2 years 1 7.7% 1 1 2-3 years 2 15.4% 2 1 3-5 years 3 23.1% 3 3 Over 5 years 12 92.3% 29 12
*There are 35 children in the 13 families that responded to this question. **Amongst 13 families that responded to this question, there were 17 children enrolled in Head Start. Q-14 Were you pregnant when your family was enrolled in Head Start?
Pregnant Number of Respondents
Percent of Respondents
No 12 85.7% Yes 0 0.0% Not applicable 2 14.3%
Q-15 While enrolled in Head Start, did anyone outside of your household ever provide care for your children?
Outside your household that provided care
Number of Respondents
Percent of Respondents
No 9 64.3% Yes 5 35.7%

Portland Public Schools Head Start
81
Q-16 Who provided care for your children during your enrollment in Head Start? From
the list provided below, please check all the providers you used, and whether the provider was paid or unpaid.
Childcare Provider Paid Unpaid Total Percent of
Respondents Family or Relative 2 3 5 41.7% Friend or Non-relative 1 1 2 16.7%
EHSFC 0 0 0 0.0% Other HS 0 1 1 8.3% Other Childcare 3 0 3 25.0% Other 1 0 1 8.3%
Q-17 Did you receive a childcare subsidy, such as financial assistance for childcare from the government?
Received childcare subsidy
Number of Respondents
Percent of Respondents
No 11 84.6% Yes covered full cost 1 7.7% Yes covered part of the cost 1 7.7%
17a From whom did you receive your childcare subsidy?
Received childcare subsidy from:
Number of Respondents
Percent of Respondents
AFS/ERDC/ Jobs Great Start 2 100.0%
Student Block Grant 1 50.0%
Other 1 50.0%

Portland Public Schools Head Start
82
Q-18 How many hours per week did you spend doing each of the following while enrolled in Head Start? Please write the appropriate number on each line provided.
Paid employment hours per week
Number of Respondents
Percent of Respondents
Job Training hours per week
Number of Respondents
Percent of Respondents
School hours per week
Number of Respondents
Percent of Respondents
0 2 20.0% 0 2 100.0% 0 1 33.3% 1-4 0 0.0% 5 1 33.3% 5-10 1 10.0% 10 1 33.3% 11-25 1 10.0% 26-30 1 10.0% 31-35 0 0.0% 36-40 4 40.0% Over 40 1 10.0%
Q-19 How many hours of childcare did you need per week?
Hours of childcare needed per week
Number of Respondents
Percent of Respondents
1-5 5 41.7% 6-10 2 16.7% 11-15 2 16.7% 16-20 1 8.3% 21-25 0 0.0% 26-30 0 0.0% 31-35 0 0.0% 36 or more 2 16.7%
Q-20 What hours of the day did you need childcare?
What hours of the day needed childcare
Number of Respondents
Percent of Respondents
No hours 7 50.0% Between 6am and 6pm 6 42.9% Other hours 1 7.1%
20a Did your childcare needs vary day to day during the week?
Childcare needs
Number of Respondents
Percent of Respondents
No 8 66.7% Yes 4 33.3%
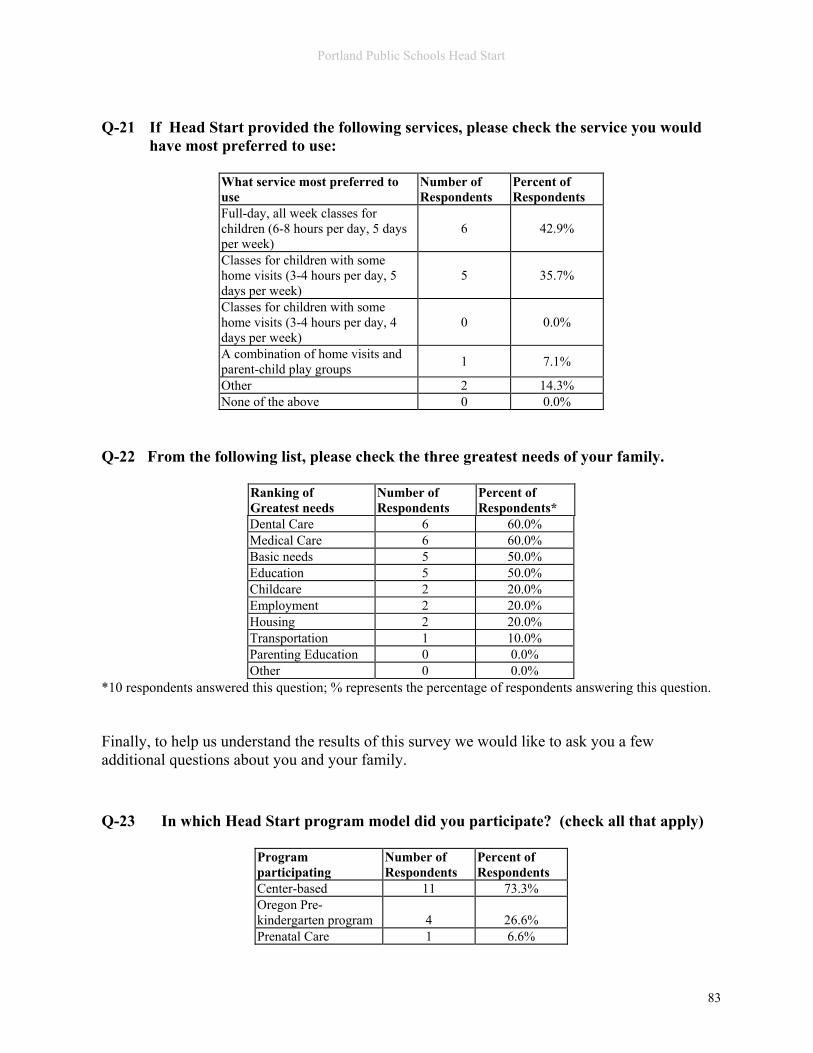
Portland Public Schools Head Start
83
Q-21 If Head Start provided the following services, please check the service you would
have most preferred to use:
What service most preferred to use
Number of Respondents
Percent of Respondents
Full-day, all week classes for children (6-8 hours per day, 5 days per week)
6 42.9%
Classes for children with some home visits (3-4 hours per day, 5 days per week)
5 35.7%
Classes for children with some home visits (3-4 hours per day, 4 days per week)
0 0.0%
A combination of home visits and parent-child play groups 1 7.1%
Other 2 14.3% None of the above 0 0.0%
Q-22 From the following list, please check the three greatest needs of your family.
Ranking of Greatest needs
Number of Respondents
Percent of Respondents*
Dental Care 6 60.0% Medical Care 6 60.0% Basic needs 5 50.0% Education 5 50.0% Childcare 2 20.0% Employment 2 20.0% Housing 2 20.0% Transportation 1 10.0% Parenting Education 0 0.0% Other 0 0.0%
*10 respondents answered this question; % represents the percentage of respondents answering this question. Finally, to help us understand the results of this survey we would like to ask you a few additional questions about you and your family. Q-23 In which Head Start program model did you participate? (check all that apply)
Program participating
Number of Respondents
Percent of Respondents
Center-based 11 73.3% Oregon Pre-kindergarten program 4 26.6% Prenatal Care 1 6.6%

Portland Public Schools Head Start
84
Q-24 While enrolled in Head Start, was your family a:
Type of family Number of Respondents
Percent of Respondents
Single Parent Family 5 35.7% Two Parent Family 7 50.0% Foster Family 1 7.1% Other Family Type 1 7.1%
Q-25 Which of the following best describes where you live?
Location Number of Respondents
Percent of Respondents
North Portland 2 14.3% Northeast Portland 7 50.0% Southeast Portland 5 35.7%
Q-26 How many times have you moved in the past year?
Times moved in Past year
Number of Respondents
Percent of Respondents
None 13 92.9% Once 0 0.0% Twice 1 7.1% 3 or more 0 0.0%
Q-27 Where did you live 5 years ago?
City living in 5 years ago
Number of Respondents
Percent of Respondents
State living in 5 years ago
Number of Respondents
Percent of Respondents
Country living in 5 years ago
Number of Respondents
Percent of Respondents
Portland 13 86.7% Oregon 13 86.7% United States 13 86.7% Other 2 13.3% Other 2 13.3% Other 2 13.3%
Q-28 What language do you speak at home?
Language Spoken at Home
Number of Respondents
Percent of Respondents
English 13 92.9% Spanish 0 0.0% Other 1 7.1%

Portland Public Schools Head Start
85
28a How well do you speak English?
Speaks English Number of Respondents
Percent of Respondents
Not at all 0 0.0% Not well 1 7.1% Well 0 0.0% Very well 13 92.9%
Q-29 What was your family’s income for the last month (before taxes)?
Family income last month
Number of Respondents
Percent of Respondents
$0 to $400 0 0.0% $401 to $800 1 7.1% $801 to $1,200 2 14.3% $1,201 to $1,600 2 14.3% $1,601 to $2,000 3 21.4% More than $2,000 6 42.9%
Q-30 Overall, what was your family’s total income last year?
Total income last year
Number of Respondents
Percent of Respondents
$0 to $2,999 0 0.0% $3,000 to $8,999 2 15.4% $9,000 to $11,250 0 0.0% $11,251 to $17,050 2 15.4% $17,051 to $20,999 1 7.7% $21,000 to $25,999 2 15.4% $26,000 to $35,999 3 23.1% $36,000 to $40,999 1 7.7% $41,000 to $47,999 1 7.7% $48,000 or more 1 7.7%
Q-31 How many people (adults and children) are supported by this income? Please
write in the number on the lines provided.
Number supported
Responses to #Adults supported by this income
Percent of Respondents
Responses to #Children supported by this income
Percent of Respondents
One 3 21.4% 4 28.6% Two 9 64.3% 5 35.7% Three 1 7.1% 2 14.3% Four 1 7.1% 2 14.3% Five 0 0.0% 0 0.0% Six or more 0 0.0% 0 0.0%

Portland Public Schools Head Start
86
Q-32 What is your address (including zip code)?
Zip Code Number of Respondents
Percent of Respondents
97203 2 15.4% 97206 3 23.1% 97211 3 23.1% 97216 1 7.7% 97218 2 15.4% 97220 1 7.7% 97232 1 7.7%
Q-33 Is there anything else you would like to tell us about the Head Start Program you
participated in?
Comments Number of
Respondents Excellent educational program 5 Advanced preparation for school 3 Enjoyed parent involvement opportunities 2 Excellent teachers and/or staff 2 Great support for families 2 Provided socialization opportunity for kids 2 Good support services 1 Increased advertisement of programs needed 1 Insufficient funding 1

Portland Public Schools Head Start
87
Questionnaire Responses from Community Partners A total of 12 surveys were mailed and 7 surveys were completed and returned. The response rate was 58 percent. On questions where more than one response was requested, the number of responses add up to more than 7 (the number of survey participants), and the total percentage of responses is more than 100%. Additionally, on questions where not all survey participants provided a response, the total number of responses is less than 7. Q-1 Have you worked with a Head Start Program in Multnomah County?
Worked with PPS Head Start in Multnomah Co.
Number of Respondents
Percent of Respondents
No 0 0.0%
Yes 7 100.0% 1a If yes, which one? If more than one, please complete a separate questionnaire for
each.
Which program
Number of Respondents
Percent of Respondents
PPS HS 7 100.0% Other 0 0.0%
Q-2 What is your relationship with the Head Start Program you checked above? Please
check all that apply.
Refer clients to HS
Number of Respondents
Percent of Respondents
HS clients are referred to our program
Number of Respondents
Percent of Respondents
No 3 42.9% No 2 28.6% Yes 4 57.1% Yes 5 71.4%
Provide services to HS
Number of Respondents
Percent of Respondents
Member of Board of Directors
Number of Respondents
Percent of Respondents
No 1 14.3% No 7 100.0% Yes 6 85.7% Yes 0 0.0%

Portland Public Schools Head Start
88
Q-3 If you do not refer clients to Head Start, which of the following best describes your reason(s) for not referring clients?
Not satisfied with HS
Number of Respondents
Percent of Respondents
Clients not eligible or interested
Number of Respondents
Percent of Respondents
No 7 100.0% No 7 100.0% Yes 0 0.0% Yes 0 0.0%
Other Number of
Respondents Percent of Respondents
Not Applicable
Number of Respondents
Percent of Respondents
No 7 100.0% No 1 14.3% Yes 0 0.0% Yes 6 85.7%
Q-4 Which of the following groups of people does your organization support/work with?
Please check all that apply.
Children with special needs
Number of Respondents
Percent of Respondents
Low-income children
Number of Respondents
Percent of Respondents
No 1 14.3% No 1 14.3% Yes 6 85.7% Yes 6 85.7%
Low-income families
Number of Respondents
Percent of Respondents
Persons with drug/ alcohol concerns
Number of Respondents
Percent of Respondents
No 2 28.6% No 1 14.3% Yes 5 71.4% Yes 6 85.7%
Persons with Mental Health concerns
Number of Respondents
Percent of Respondents
Persons with Medical concerns
Number of Respondents
Percent of Respondents
No 2 28.6% No 3 42.9% Yes 5 71.4% Yes 4 57.1%
Pregnant Women
Number of Respondents
Percent of Respondents
Families/ persons in Domestic violence situations
Number of Respondents
Percent of Respondents
No 3 42.9% No 2 28.6% Yes 4 57.1% Yes 5 71.4%
Other Number of
Respondents Percent of Respondents
Not Applicable
Number of Respondents
Percent of Respondents
No 2 28.6% No 6 85.7% Yes 5 71.4% Yes 1 14.3%

Portland Public Schools Head Start
89
Q-5 Please rank the following Head Start programs in terms of their value to your clients.
Parent Education
Number of Respondents
Percent of Respondents
Information Regarding Preschoolers
Number of Respondents
Percent of Respondents
Has Value 6 100.0% Has Value 5 100.0% No Opinion 0 0.0% No Opinion 0 0.0% Has No Value 0 0.0% Has No Value 0 0.0%
Referral To Other Agencies
Number of Respondents
Percent of Respondents
Education Services
Number of Respondents
Percent of Respondents
Has Value 6 100.0% Has Value 6 100.0% No Opinion 0 0.0% No Opinion 0 0.0% Has No Value 0 0.0% Has No Value 0 0.0%
Family Literacy Program
Number of Respondents
Percent of Respondents
GED Program
Number of Respondents
Percent of Respondents
Has Value 3 60.0% Has Value 3 60.0% No Opinion 2 40.0% No Opinion 2 40.0% Has No Value 0 0.0% Has No Value 0 0.0%
Adult ESL Classes
Number of Respondents
Percent of Respondents
Health Services Number of Respondents
Percent of Respondents
Has Value 4 66.7% Has Value 6 100.0% No Opinion 2 33.3% No Opinion 0 0.0% Has No Value 0 0.0% Has No Value 0 0.0%
Nutrition Services
Number of Respondents
Percent of Respondents
Children with Special Needs
Number of Respondents
Percent of Respondents
Has Value 6 85.7% Has Value 5 100.0% No Opinion 1 14.3% No Opinion 0 0.0% Has No Value 0 0.0% Has No Value 0 0.0%
Home Visits Number of
Respondents Percent of Respondents
Prenatal Care Number of Respondents
Percent of Respondents
Has Value 5 100.0% Has Value 5 83.3% No Opinion 0 0.0% No Opinion 1 16.7% Has No Value 0 0.0% Has No Value 0 0.0%
Q-6 Head Start is interested in the needs of all Head Start eligible families, not just
current Head Start families, to determine if they are meeting the needs of the community. Please consider all areas of need including: health, nutrition, social services, education, and employment. Please list the 5 greatest needs of the clients you work with, using 1 as being of the greatest need. Also, please describe some obstacles or challenges in helping families to meet these needs.

Portland Public Schools Head Start
90
The table below depicts the most mentioned needs. It does not take into consideration rank.
Greatest Need Number of Respondents
Percent of Respondents
Education 4 80.0% Health 3 60.0% Nutrition 3 60.0% Employment 2 40.0% Parent training 2 40.0% Social services 2 40.0% Childcare 1 20.0% Dental care 1 20.0% Housing 1 20.0% Mental health 1 20.0%
The table below depicts the greatest needs of families. It does take into consideration rank. The needs are weighted as follows: #1 greatest need receives 5 points, #2 greatest need receives 4 points, #3 greatest need receives 3 points, #4 greatest need receives 2 points and the #5 greatest need receives 1 point.
Greatest Need (weighted)
Points
Education 14 Health 12 Nutrition 11 Employment 9 Parent training 6 Dental care 4 Social services 4 Housing 3 Mental health 3 Childcare 2
The tables below depict the 5 greatest needs and barriers to meeting those needs. Please note all of the respondents indicated the barriers to meeting the needs.
Barriers and Number of Respondents Greatest Need #1 Number of
Respondents Lack of Availability Costs/Funding Lack of Insurance Education 2 1 1 0 Health 1 0 0 1 Employment 1 0 1 0 Nutrition 1 0 1 0

Portland Public Schools Head Start
91
Barriers and Number of Respondents Greatest Need #2 Number of Respondents
Costs/Funding Lack of Insurance Lack of Job Skills Health 1 1 0 0 Employment 1 1 0 0 Dental care 1 0 1 0 Nutrition 1 1 0 0 Parent training 1 0 0 1
Barriers and Number of Respondents
Greatest Need #3 Number of Respondents Costs/Funding Lack of Insurance
Education 1 1 0 Health 1 1 0 Social services 1 1 0 Housing 1 1 0 Mental health 1 0 1
Barriers and Number of Respondents
Greatest Need #4 Number of Respondents Costs/Funding
Childcare 1 1 Nutrition 1 1 Parent training 1 1
Barriers and Number of Respondents
Greatest Need #5 Number of Respondents Costs/Funding
Education 1 1 Social services 1 1
Q-7 Please list up to 5 community resources or services that would be helpful to families, but are unavailable, or are available but lacking in some way.
Helpful Services
Number of
Respondents Percent of Respondents
Basic needs 4 80.0% Affordable housing 3 60.0% Parenting classes 2 40.0% Mental health 2 40.0% Childcare 2 40.0% Basic skills classes 2 40.0% Transportation 1 20.0% Interpretive services 1 20.0% Emergency 1 20.0%

Portland Public Schools Head Start
92
Q-8 What is your occupation and job title? Community professionals that were surveyed include those who work in the health, educational, and social service occupations. Q-9 What is the name of the organization for which you work?
The respondents’ places of employment include: OHSU School of Dentistry, Oregon Department of Human Services – Child Welfare Division, Community Energy Project, Children’s Relief Nursery
Q-10 What type of organization do you work for?
Type of Agency Number of Respondents
Percent of Respondents
State 1 14.3% Non Profit org. 4 57.1% Other 2 28.6%
Q-11 Is there anything else you would like to tell us about the Head Start Program? Please write on the back if extra space is needed.
Comments Number of Respondents
PPS HS has a strong Advisory Board 1
Is very supportive of program 5
HS needs more openings 1
Clients need transportation to and from HS sites 1