community and economic development indicators...
TRANSCRIPT
Community and Economic Development
Indicators Program
The Extension and Outreach Indicators Portal: What It Is How It Will Help You How To Use It
October 20, 2015 Sandra Burke, Bailey Hanson, Christopher Seeger, and Biswa Das
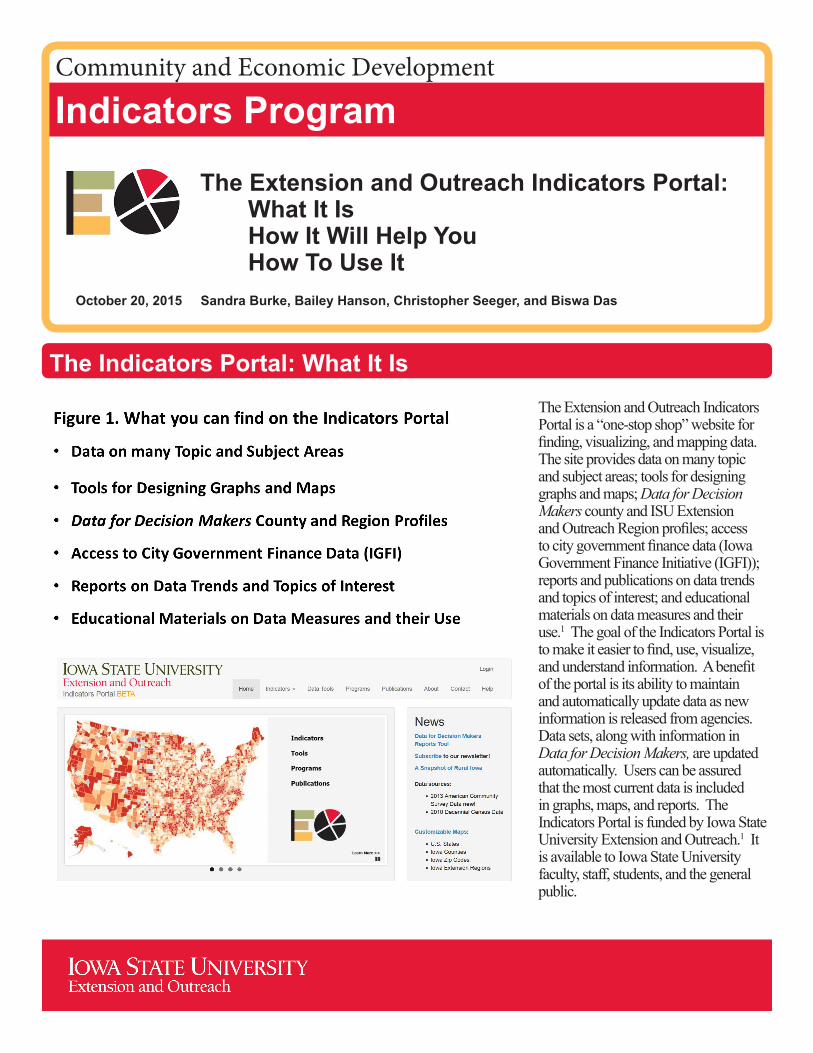
The Indicators Portal: What It IsThe Extension and Outreach Indicators Portal is a “one-stop shop” website for finding, visualizing, and mapping data. The site provides data on many topic and subject areas; tools for designing graphs and maps; Data for Decision Makers county and ISU Extension and Outreach Region profiles; access to city government finance data (Iowa Government Finance Initiative (IGFI)); reports and publications on data trends and topics of interest; and educational materials on data measures and their use.1 The goal of the Indicators Portal is to make it easier to find, use, visualize, and understand information. A benefit of the portal is its ability to maintain and automatically update data as new information is released from agencies. Data sets, along with information in Data for Decision Makers, are updated automatically. Users can be assured that the most current data is included in graphs, maps, and reports. The Indicators Portal is funded by Iowa State University Extension and Outreach.1 It is available to Iowa State University faculty, staff, students, and the general public.

The Extension and Outreach Indicators Portal: What It Is, How It Will Help You, How To Use It
Iowa State University Extension and Outreach page 2
The Indicators Portal: How To Use ItStep 1: In an internet browser,* go to the indicators website:
http://indicators.extension.iastate.edu
Step 2: LoginIn the upper right corner of the web page, click on the word “Login” (Figure 2). If you have an Iowa State University Net-ID, you may login using your usual Net-ID and password. If you do not have an Iowa State University Net-ID you may still use the Indicators Portal but you must first register and create a public or guest account. When you create the public account, you will provide a user name and password that you will use for access to the Indicators Portal.
Step 3: Choose Geography SettingsAfter you have logged in, the home page will now have a drop-down menu button, “Account Settings,” in the upper right corner (Figure 3). Before you can see any data or graphics, you must choose at least one geography selection. Click on “Account Settings” and the drop-down menu will show three “Geography Filters.” Each filter will be a geography set. Click on a pencil icon to begin your geography choices from the next drop-down menu (Figures 4, 5, 6).
There are several settings to make for your geography set. For now, Geography Type will be set to “County” and “State” to “Iowa” (the only type and state available as of this writing; more added later). Under the “County” drop-down, select one county that will be the primary or main county of interest for this geographic set (Examples Marshall, Polk). The primary county will always appear among the choices on graphs. Next, choose whether you want to have comparisons of the primary
Figure 2.
*The Indicators Portal works best with Google Chrome or Mozilla Firefox. If you are using Internet Explorer but are having difficulties or aren’t seeing any graphics, you may need to switch to one of the other web browsers.
Figure 3.
Figure 4.

The Extension and Outreach Indicators Portal: What It Is, How It Will Help You, How To Use It
page 3Iowa State University Extension and Outreach
county with all the counties that are neighbors to it or if you would like to make a custom choice of one to six other counties for comparison (Figures 5, 6). You can also type in an identifying name for the geography set as well (Figure 5). Once you have chosen a geography set for a filter, click on “Save Filter” to keep your choices (Figures 5, 6). These filter choices will be saved in your account even if you logout and come back at a later time. Once you have saved a geography set, the items will show in a pop-up if you hover your pointer over the words “Geography Filter” or the identifying name you have given to the geography set in the Account Settings menu (Figures 7, 8).
Figure 7.
Figure 8.
Figure 10.
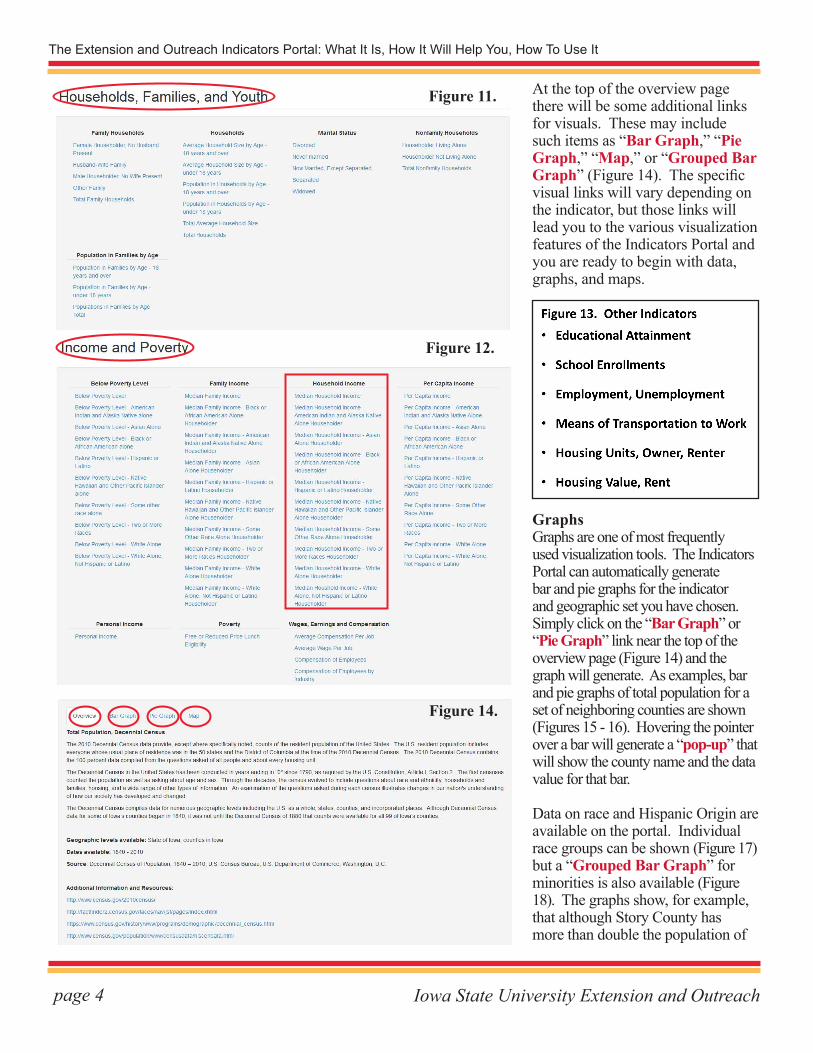
Step 4: Choose IndicatorsAn Indicators drop-down menu at the top of the page shows the broad, general categories of indicators, data, and topics that are available in the portal (Figure 9). Clicking on any one of the topics gives a detailed list of indicator items for that category, such as Population and Demographics (Figure 10); Households, Families, and Youth (Figure 11); and Income and Poverty (Figure 12). Other data, such as education and housing are included as well on the portal and more will be added in the future (Figure 13).
To begin accessing the information for any indicator, simply click on the item. When you click on an item, you will then see a page with an “Overview” that describes the indicator, the dates for which it is available, its source, and links to other information and resources regarding that indicator (Figure 14).
Figure 9.
Figure 6.Figure 5.
The Extension and Outreach Indicators Portal: What It Is, How It Will Help You, How To Use It
Iowa State University Extension and Outreach page 4
At the top of the overview page there will be some additional links for visuals. These may include such items as “Bar Graph,” “Pie Graph,” “Map,” or “Grouped Bar Graph” (Figure 14). The specific visual links will vary depending on the indicator, but those links will lead you to the various visualization features of the Indicators Portal and you are ready to begin with data, graphs, and maps.
Figure 11.
Figure 12.
Figure 14.
GraphsGraphs are one of most frequently used visualization tools. The Indicators Portal can automatically generate bar and pie graphs for the indicator and geographic set you have chosen. Simply click on the “Bar Graph” or “Pie Graph” link near the top of the overview page (Figure 14) and the graph will generate. As examples, bar and pie graphs of total population for a set of neighboring counties are shown (Figures 15 - 16). Hovering the pointer over a bar will generate a “pop-up” that will show the county name and the data value for that bar.
Data on race and Hispanic Origin are available on the portal. Individual race groups can be shown (Figure 17) but a “Grouped Bar Graph” for minorities is also available (Figure 18). The graphs show, for example, that although Story County has more than double the population of

The Extension and Outreach Indicators Portal: What It Is, How It Will Help You, How To Use It
page 5Iowa State University Extension and Outreach
The Indicators Portal: How It Will Help You - Graphs
Population by various age groups is available (Figure 19). This example shows Story County’s large component in the 18-24 year age range. Even though both Black Hawk and Johnson Counties also
Marshall County (Figure 15), there are many more persons of Hispanic Origin in Marshall County than in Story County (Figure 18). Asians are the largest minority group in Story County and Tama County has relatively similar numbers of Native Americans or Alaska Natives and persons of Hispanic Origin (Figure 18). Details regarding racial and ethnic descriptions are available on the portal in the overview sections. Also note, Hispanic or Latino Origin is an ethnicity category and those persons can be of any race.
Figure 16.
Figure 18.
have state universities and Johnson County has somewhat more people in that age range, that age group is not as dominant in those counties as in Story County.
Figure 19.
Figure 15.
Figure 17.

The Extension and Outreach Indicators Portal: What It Is, How It Will Help You, How To Use It
Iowa State University Extension and Outreach page 6
There are detailed age groups for youth (Figure 20) that also can be shown by race and Hispanic Origin (Figure 21). In Black Hawk County, for example, of minority youth age 5 - 9, more are Black or African American than any other minority group. In contrast, Marshall County has more Hispanic youth age 5 - 9 than any other minority group of that age (Figure 21).
Population pyramids are visual graphs that show the age-sex composition of a population. The Indicators Portal can generate population pyramids that are accessed with links under the population and demographics menu (Figure 10).
Figure 20. Figure 21.
In the population pyramid, data for females are on the right and that for males are on the left. The bars (except at the top) represent 5-year age groups. Each bar shows the percent that each age-sex group is of the total population. The portal has population pyramids for total populations as well as by race and Hispanic Origin These examples illustrate visually the distinct differences between the White, Not Hispanic group and the Hispanic Origin group in Marshall County. The pop-ups show that 2.4% of the White, Not Hispanic population are females age 0 - 4. For Hispanics, those age females make up nearly 7.1% of the Hispanic population (Figures 22, 23).
American Community SurveyBeyond basic demographics, the Indicators Portal also contains a wide range of socioeconomic data (Figures 12, 13). Much of these socioeconomic data now come from the American Community Survey (ACS) program developed by the U.S. Census Bureau during the last decade. In contrast to the Decennial Census which is done once every 10 years, the ACS program is a continuous, on-going, monthly, sample survey of house-holds carried out across the U.S. For any given geographic region, the ACS data from an entire period of months or years are pooled and
Figure 22. Figure 23.

The Extension and Outreach Indicators Portal: What It Is, How It Will Help You, How To Use It
page 7Iowa State University Extension and Outreach
weighted to produce the estimates of the population characteristics that are reported (Figure 24).
Among the new features of the ACS data that are especially important to users are the period estimates and the margins of error (Figure 25). There are two time intervals used for pooling the data: one year and five years. Thus, one-year estimates include 12 months of data and five-year estimates have 60 months pooled together. Because one-year estimates are available only for geographic regions with at least 65,000 people, the Indicators Portal at the present time only reports the five-year estimates set so that all geographic regions in Iowa can be included.
Because the ACS data are based on samples of the population, there is some level of uncertainty or sampling error associated with an estimate. The Census Bureau provides, for each estimate, a margin of error (MOE) that helps to assess the amount of sampling error and the reliability associated with the estimate. The MOE is reported as +/- a numerical value that should be added to or subtracted from the point estimate value and which give the upper and lower bounds of a 90% confidence interval around the estimate. The interval represents the range within which the true value of the estimate is expected to be with a level of confidence of 90%. Margins of error for ACS estimates should always be included when reporting ACS estimate values (Figure 25).
For bar charts in the portal that use ACS data, the MOE is shown as a vertical line at the point estimate. The length of the line above and
Figure 26.

The Extension and Outreach Indicators Portal: What It Is, How It Will Help You, How To Use It
Iowa State University Extension and Outreach page 8
below the estimate line shows the amount to be added or subtracted from the estimate for the margin of error (Figure 26). Hovering the pointer over the bar will show the estimate value and the MOE. The example shows that the median household income in Dallas County is more than double the median household income in Decatur County. For the counties shown, the margins of error are all relatively small (Figure 26).
Margins of error can be large or small. A smaller MOE relative to the size of the estimate usually represents a more precise estimate. As MOEs become relatively larger, the less confidence there is that the point estimate is close to the true population value. In some cases, especially for small geographic areas or subgroup populations, margins of error can be relatively large suggesting that the estimate is unreliable and should be used only with caution or not at all.
The Census Bureau suggests using the Coefficient of Variation (CV), a measure of the relative amount of sampling error associated with a sampling estimate, as a way to assess the usability of an estimate (Figures 27, 28). The CV is a ratio of the Standard Error (SE) of the estimate to the estimate itself and is usually expressed as a percent. The SE is simply the MOE divided by 1.645 (this is a constant since it is a 90% confidence interval). The resulting SE is then divided by the estimate value and mulitplied by 100 to get a percent (formula, Figure 28). In many cases, the Indicators Portal can automatically generate the CV for an estimate from ACS data. Hovering the pointer over the indicator will
Figure 29.
show not only the estimate and the MOE but the CV as well in the pop-up (Figures 26, 29).
The smaller the CV, the higher the relative reliability of the estimate. Although there are varying rec-ommendations for evaluating the
CV for an estimate, a CV that is below 12% - 15% would indicate an estimate that would be highly reliable. If the CV of an estimate ranges upwards to around 30%, that estimate would be considered moderately reliable. Estimates with CVs above 30% to 40% have
Figure 30.

The Extension and Outreach Indicators Portal: What It Is, How It Will Help You, How To Use It
page 9Iowa State University Extension and Outreach
of persons below poverty (Figure 30). One note, however, the CV that shows for the percent of poverty data is actually the CV for the estimate of the number of people below poverty.
Overall, decisions about what level of MOEs and CVs are acceptable depend on the use of the data and the context of the situation. These are general guidelines, but this is one area where the user will need to make judgment calls about how they use the ACS data.
MapsA key feature of the Indicators Portal is mapping. The portal can automatically generate statewide maps with county data for most indicators (Figure 31). The maps are accessed by the link “Map” near the top of the overview page. The map will divide the county-level data into five categories with a legend and shading shown on the bottom right of the map. As with other visuals, hovering the pointer over a county will give a pop-up with the county name and the value of the data for that county. The pop-up feature makes it very easy to do county-to-county comparisons with simply moving the pointer among counties and viewing the county level data value. The examples of pop-ups for Hispanic Population (Figure 32), show wide ranges among the counties in the number of Hispanics. Buena Vista County, a relatively small, rural county has nearly as many Hispanics as does metropolitan Black Hawk County.
The Indicators Portal: How It Will Help You - Mapslow reliability and should be used with caution or perhaps not at all. The example of median family income for Blacks or African Americans (Figure 29) illustrates these issues with large margins of error for small subgroup populations. The margin of error for the Dallas County estimate is more than double the size of the estimate with a CV of 196%, clearly not usable. The CV for the estimate in Wapello County is 82%, also not usable. The number of African American households in Appanoose and Decatur Counties are so small that estimates are not given (missing or blank bars means that the
data for that item is not available). Finally, the CVs for the remaining three counties (Black Hawk, 18%; Johnson, 26%; Polk, 7%) are small enough that the estimates for those counties would be usable. One strategy for when an estimate is not usable is to use an estimate for a larger geographic region (eg. the state estimate rather than a county estimate) as a substitute for the estimate in question.
The Indicators Portal includes poverty data from the ACS. These data can be graphed as a percent below poverty as well as the number
Figure 31.
Figure 32.

The Extension and Outreach Indicators Portal: What It Is, How It Will Help You, How To Use It
Iowa State University Extension and Outreach page 10
Map examples included here show the marital status of Never Married (Figure 33), the household type of Female Householder, no Husband Present (Figure 34), the educational attainment of Bachelor’s Degree (Figure 35), and Per Capita Income (Figure 36). All of these items are accessible starting with the “Indicators” drop-down menu (Figure 9).
Making Your Own Custom Maps with Your Own Data: Data ToolsThe Indicators Portal gives you the tools to make custom maps with your own data. You access this feature from the home page by clicking on “Data Tools” at the top of the page or on “Customizable Maps” in the right column (Figure 37). The next screen shows four mapping choices:
Figure 33. Figure 34.
Figure 35. Figure 36.
Figure 37. Figure 38.
county, state, zip code, and Extension Region. For each map type, the portal provides an Excel template file that has the geographic names and numeric codes. Add your own data values to the template and then start the upload process by clicking on the applicable “Map Tool” link (Figure 38).

The Extension and Outreach Indicators Portal: What It Is, How It Will Help You, How To Use It
page 11Iowa State University Extension and Outreach
Data for Decision MakersCounty and Extension Region profiles are available from the Indicators Portal. The county profiles are four pages of frequently used, key indicators. The Extension Region profiles have two pages of basic demographics. These “Data for Decision Makers” are accessed from the home page as well as from the “Programs” and “Publications” drop-down menus (Figure 39). From the next screen, choose either the county or the Extension Region geographic level from the text or the map (Figure 40). You will then be taken to a map from which you can click on the specific county or region of interest (Figures 41 - 42). If you are NOT logged in with an ISU Net-ID, a pdf file with the report will automatically generate. It is recommended to print from the pdf file rather than from a web browser.
If you are ISU staff and you have logged in with your ISU Net-ID, you will next see the contact editor screen (Figure 43) and information for the county or region you have chosen. The default contacts are the Regional Director and the County Office contact, but you will be able to edit and customize the contact information. Then click on “Make PDF” and a pdf file with the profile will generate. Printing is best from the pdf file rather than from a web browser.
The first page of the county profile (example Adams Co., page 12) shows population counts for the county along with those for the communities within the county. Population change is shown as well. Basic demographic data for age, sex, race, and Hispanic Origin are on page two.
The Indicators Portal: How It Will Help You - Data for Decison Makers
Figure 39.
Figure 40.
Figure 41. Figure 42.
Figure 43. ONLY ISU staff logged in with an ISU Net-ID will see this contact editor screen!

The Extension and Outreach Indicators Portal: What It Is, How It Will Help You, How To Use It
Iowa State University Extension and Outreach page 12
Data for Decision Makers
Population profile
Community and Economic Development
For More Information Contact:
County ProfileAdams County
report created: 10/12/2015
Adams County is a nonmetropolitan1 county in southwest Iowa. Adams County is composed of fiveincorporated communities and their surrounding rural areas. From 2000 to 2010, Adams County's populationdecreased by 10.11 percent while the state's population increased by 4.10 percent.
Total Population
City 20003 20104 20145
Carbon 28 34 33
Corning 1,787 1,638 1,564
Lenox* 1,401 1,407 1,370
Nodaway 132 114 110
Prescott 266 257 252
County Total 4,482 4,029 3,875
State Total 2,926,324 3,046,355 3,107,126
* City is located in multiple counties, total population is provided.
-20%-15%-10%
-5%0%5%
10%15%20%
'40-'50 '50-'60 '60-'70 '70-'80 '80-'90 '90-'00 '00-'10 '10-'14
County State
Adams County Percent Population Change
Neighboring Counties - Percent Population Change
County '902-'003 '003-'104 '104 -'145
Adair, IA -1.97% -6.81% -2.97% Adams, IA -7.89% -10.11% -3.82% Cass, IA -2.93% -4.96% -3.64% Montgomery, IA -2.53% -8.76% -2.97% Page, IA 0.63% -6.15% -2.74% Ringgold, IA 0.90% -6.18% -1.56% Taylor, IA -2.19% -9.21% -2.75% Union, IA -3.46% 1.83% -0.14% State of Iowa 5.39% 4.10% 1.99%
Regional DirectorCarol LaFaver811 N SumnerCreston, IA [email protected]
County OfficeChris Nelson603 7th StCorning, IA [email protected]

The Extension and Outreach Indicators Portal: What It Is, How It Will Help You, How To Use It
page 13Iowa State University Extension and Outreach
Data for Decision Makers
Demographic Profile
Community and Economic Development
As with the other 98 counties in the state, Adams County’spopulation is predominantly white. Between 2000 and 2010there was a slight decrease in the percent of the population thatis white. The percent of the population of Hispanic origin had aslight increase over the same time period.
Percentage of Population by Race/Hispanic Origin County State Race Groups 2000 2010 2000 2010
One Race Only 99.6% 99.5% 98.9% 98.2%
White 98.9% 98.1% 93.9% 91.3%
Black or African American 0.1% 0.2% 2.1% 2.9%
Asian/Pacific Islander 0.2% 0.6% 1.3% 1.7%
American Indian 0.4% 0.5% 0.3% 0.4%
Hawaiian 0% 0% 0% 0.1%
Other 0% 0.1% 1.3% 1.8%
Two or more races 0.4% 0.5% 1.1% 1.8%
Hispanic origin* 0.6% 0.9% 2.8% 5%
* Hispanics can be of any race.
Compared to the state, Adams County had a lowerpercentage of young people (17 or younger) and ahigher percentage of older people (65 or older) in2010.
Percentage of Population by Age County State Age Groups 2000 2010 2000 2010
17 or younger 23.9% 21.1% 25.1% 23.9%
0 - 4 5.5% 5.8% 6.4% 6.6%
5 - 9 6.6% 5.2% 6.9% 6.6%
10 - 14 7.3% 6.0% 7.2% 6.6%
15 -17 4.5% 4.1% 4.6% 4.1%
18 - 24 6.3% 6.8% 10.2% 10.0%
25 - 44 24.1% 19.7% 27.6% 24.5%
45 - 64 24.2% 31.1% 22.2% 26.7%
65 or older 21.4% 21.3% 14.9% 14.9%
65 - 84 18.4% 17.7% 12.7% 12.4%
85 or older 3.0% 3.6% 2.2% 2.5%
The population in Adams County in 2010 was 4,029 with 98.0males per 100 females.
Total Population by Sex County StatePopulation 2000 2010 2000 2010
Total 4,482 4,029 2,926,324 3,046,355
Male 2,203 1,994 1,435,515 1,508,319
Female 2,279 2,035 1,490,809 1,538,036
Males per 100 Females 96.7 98.0 96.3 98.1
The median age in Adams County in 2010 was higher than themedian age of the state.
Median Age by Sex (Years) County State Median Age 2000 2010 2000 2010
Male 39.8 45.9 35.2 36.6
Female 44.3 47.3 38.0 39.5
Both Sexes 41.9 46.7 36.6 38.1
Adams County Population Pyramid
0-45-9
10-1415-1920-2425-2930-3435-3940-4445-4950-5455-5960-6465-6970-7475-7980-84
85+
6% 4% 2% 0% 2% 4% 6%
Male
Female
Adams County

The Extension and Outreach Indicators Portal: What It Is, How It Will Help You, How To Use It
Iowa State University Extension and Outreach page 14
Data for Decision Makers
Socioeconomic Profile
Community and Economic Development Data for Decision Makers
Adams County
In Adams County there is a higher percentage of workers in management, business, science, and arts occupations than anyother occupation category while the production, transportation, and material moving occupation category makes up 22.5%of occupations of the civilian employed population in the county.
Occupation of the Civilian Employed Population, 2009-20136
County State Estimate MOE* Estimate MOE*
Civilian employed population 16 years and over 1,989 +/- 94 1,553,030 +/- 4,074
Management, business, science, and arts 32.2% +/- 4.6% 34.0% +/- 0.3%
Service 17.3% +/- 2.7% 16.7% +/- 0.2%
Sales and office 17.3% +/- 3.1% 23.9% +/- 0.2%
Natural resources, construction, and maintenance 10.7% +/- 2.5% 9.4% +/- 0.1%
Production, transportation, and material moving 22.5% +/- 3.6% 16.0% +/- 0.2%
The median household income in Adams County is less than themedian household income of the state. More households in AdamsCounty are in the $50,000 to $74,999 household income group thanany other category. In the state, more households are in the $50,000to $74,999 household income group.
Median Household and Per Capita Income, 2009-20136
County State Estimate MOE* Estimate MOE*
Total Households 1,745 +/- 89 1,226,547 +/- 3,433
Less than $10,000 5.4% +/- 1.9% 6.2% +/- 0.1%
$10,000 To $14,999 4.9% +/- 1.8% 5.3% +/- 0.1%
$15,000 To $24,999 16.5% +/- 3.4% 10.8% +/- 0.2%
$25,000 To $34,999 8.0% +/- 2.3% 11.0% +/- 0.2%
$35,000 To $49,999 20.1% +/- 3.5% 14.9% +/- 0.2%
$50,000 To $74,999 24.0% +/- 4.1% 20.0% +/- 0.2%
$75,000 To $99,999 12.1% +/- 3.4% 13.5% +/- 0.2%
$100,000 To $149,999 6.0% +/- 2.1% 12.0% +/- 0.1%
$150,000 To $199,999 2.2% +/- 1.1% 3.4% +/- 0.1%
$200,000 Or More 0.9% +/- 0.5% 2.8% +/- 0.1%
Median Household Income $56,552 +/- $4,253 $65,802 +/- $367
Per Capita Income $23,707 +/- $1,275 $27,027 +/- $163
There is a higher percentage of vacant housing unitsin Adams County than there are for the state. Manyhousing units in Adams County were built prior to1940.
Housing Characteristics, 2009-20136
County State Estimate MOE* Estimate MOE*
Total Units 2,002 +/- 37 1,341,001 +/- 346
Occupied 87.2% +/- 4.2% 91.5% +/- 0.3%
Vacant 12.8% +/- 4.2% 8.5% +/- 0.3%
Percent Housing by Year Built, 2009-20136
2010 Or Later
2000 To 2009
1990 To 1999
1980 To 1989
1970 To 1979
1960 To 1969
1950 To 1959
1940 To 1949
1939 Or Earlier
0% 10% 20% 30% 40% 50%
State
County
* MOE = the margin of error for American Community Survey estimates6 which is a numerical value that when added to or subtractedfrom the point estimate value gives the range of a 90% confidence interval around the estimate.

The Extension and Outreach Indicators Portal: What It Is, How It Will Help You, How To Use It
page 15Iowa State University Extension and Outreach
Christopher J. Seeger, Associate Professor & Extension SpecialistBailey Hanson, Extension SpecialistSandra Burke, Extension SpecialistLiesl Eathington, Extension Specialist
. . . and justice for allIowa State University Extension and Outreach programs are available to all without regard to race, color, age, religion, national origin, sexual orientation, gender identity, genetic information, sex, marital status, disability, or status as a US veteran. Inquiries can be directed to the Director of Equal Opportunity and Compliance, 3280 Beardshear Hall, (515) 294-7612.
Issued in furtherance of Cooperative Extension work, Acts of May 8 and June 30, 1914, in cooperation with the US Department of Agriculture. Cathann A. Kress, director, Cooperative Extension Service, Iowa State University of Science and Technology, Ames, Iowa.
Information in this document was derived from:
This series was prepared by:
1 Office of Management and Budget, February 2013 delineations2 U.S. Census Bureau; Decennial Census 1990, Summary File 13 U.S. Census Bureau; Decennial Census 2000, Summary File 14 U.S. Census Bureau; Decennial Census 2010, Summary File 15 U.S. Census Bureau; Population Estimates Program 20146U.S. Census Bureau; American Community Survey 2009-2013
For more information on these and other topics, please call the Extension and Outreach specialists listed on the cover page
or visit the ISU Extension and Outreach at http://www.extension.iastate.edu/communities/
Data for Decision Makers Community and Economic Development
Socioeconomic Profile
Data for Decision Makers
Adams CountyThe percentage of people who have recieved a Bachelor's degree in Adams County islower than the percentage for the state.
Educational Attainment, 2009-20136
County State Estimate MOE* Estimate MOE*
Population 25 and over 2,876 +/- 12 2,026,719 +/- 824
Less than 9th grade 4.5% +/- 1.7% 3.6% +/- 0.1%
9th to 12th grade, no diploma 5.2% +/- 1.6% 5.5% +/- 0.1%
High school graduate (equivalency) 39.3% +/- 3.8% 32.9% +/- 0.2%
Some college, no degree 23.1% +/- 3.1% 21.7% +/- 0.2%
Associates degree 14.3% +/- 2.1% 10.6% +/- 0.1%
Bachelors degree 10.1% +/- 2.3% 17.7% +/- 0.2%
Graduate or professional degree 3.7% +/- 1.1% 8.0% +/- 0.1%
High school graduate or higher 90.4% +/- 2.6% 91.0% +/- 0.1%
Bachelors degree or higher 13.7% +/- 2.7% 25.7% +/- 0.3%
Individuals Below Poverty Level by Race, 2009-20136
County State Estimate MOE* Estimate MOE*
Total 3,901 +/-35 2,963,129 +/-855
Percent Below 11.3% +/-0.2% 12.4% +/-0.2%
One Race 10.7% +/-2.7% 12.1% +/-0.2%
White 10.7% +/-2.7% 11% +/-0.2%
Black or African American 50% +/-50% 36.8% +/-2%
Asian/Pacific Islander 0% +/-93.3% 15.2% +/-1.8%
American Indian 25% +/-75% 29.7% +/-4.9%
Hawaiian -% +/--% 21% +/-12.5%
Other 0% +/-82.3% 25.2% +/-3.2%
Two or more races 52.7% +/-33.8% 27.8% +/-2%
Hispanic origin* 32.7% +/-28.5% 26% +/-1.5%
* Hispanics can be of any race.

The Extension and Outreach Indicators Portal: What It Is, How It Will Help You, How To Use It
Iowa State University Extension and Outreach page 16
Population profile
Community and Economic Development
Data for Decision Makers
For More Information Contact:
Regional DemographicsExtension and Outreach
report created: 10/13/2015
Regional DirectorCheryl Heronemus340 2nd AvePrimghar, IA [email protected]
Region 1 is an Iowa State University Extension & Outreach region made up of six counties in northwest Iowa.This region contains 3.22% of Iowa's total population, and from 2010 to 2014 Region 1's population increasedby 0.61% while the state's population increased by 1.99%.
Total Population County
20003
Decennial20104
Decennial20145
Estimate
Clay County 17,372 16,667 16,515
Dickinson County 16,424 16,667 16,935
Lyon County 11,763 11,581 11,683
O'brien County 15,102 14,398 14,056
Osceola County 7,003 6,462 6,218
Sioux County 31,589 33,704 34,681
Region Total 99,253 99,479 100,088
State Total 2,926,324 3,046,355 3,107,126
-8%
-6%
-4%
-2%
0%
2%
4%
6%
8%
1940-1950 1950-1960 1960-1970 1970-1980 1980-1990 1990-2000 2000-2010
Region 1
Iowa
Percentage Population Change
Percentage Population Change Years Region 1 State
1970-1980 5.9% 3.2%
1980-1990 -6.9% -4.7%
1990-2000 2.3% 5.4%
2000-2010 0.2% 4.1%

The Extension and Outreach Indicators Portal: What It Is, How It Will Help You, How To Use It
page 17Iowa State University Extension and Outreach
. . . and justice for allIowa State University Extension and Outreach programs are available to all without regard to race, color, age, religion, national origin, sexual orientation, gender identity, genetic information, sex, marital status, disability, or status as a US veteran. Inquiries can be directed to the Director of Equal Opportunity and Compliance, 3280 Beardshear Hall, (515) 294-7612.
Issued in furtherance of Cooperative Extension work, Acts of May 8 and June 30, 1914, in cooperation with the US Department of Agriculture. Cathann A. Kress, director, Cooperative Extension Service, Iowa State University of Science and Technology, Ames, Iowa.
Information in this document was derived from:
This series was prepared by:
1 Office of Management and Budget, February 2013 delineations2 U.S. Census Bureau; Decennial Census 1990, Summary File 13 U.S. Census Bureau; Decennial Census 2000, Summary File 14 U.S. Census Bureau; Decennial Census 2010, Summary File 15 U.S. Census Bureau; 2014 Population Estimates Program
Christopher J. Seeger, Associate Professor & Extension SpecialistBailey Hanson, Extension SpecialistSandra Burke, Extension SpecialistLiesl Eathington, Extension Specialist
For more information on these and other topics, please call the Extension and Outreach specialists listed on the cover page
or visit the ISU Extension and Outreach at http://www.extension.iastate.edu/communities/
Data for Decision Makers
Community Profile
Community and Economic Development
As with the other 19 Extension regions in the state, Region 1 ’spopulation is predominantly white. Between 2000 and 2010there was a decrease in the percent of the population that iswhite. The percent of the population that identified havingHispanic origin increased over the same time period.
Percentage of population by race/Hispanic origin Region 1 State Race Groups 2000 2010 2000 2010
One Race Only* 99.5% 99.1% 98.9% 98.2%
White 98.1% 95.7% 93.9% 91.3%
Black or African American 0.2% 0.3% 2.1% 2.9%
Asian/Pacific Islander 0.5% 0.6% 1.3% 1.7%
American Indian 0.2% 0.2% 0.3% 0.4%
Hawaiian 0.0% 0.0% 0% 0.1%
Other 0.6% 2.3% 1.3% 1.8%
Two or more races 0.5% 0.9% 1.1% 1.8%
Hispanic origin*
*Hispanics can be of any race.1.6% 4.9% 2.8% 5%
Region 1 has a higher percentage of young people(17 or younger) and a higher percentage of olderpeople (65 or older) compared to the state. The45-64 age group has the largest percent of the totalpopulation for the region with 26.9%.
Percentage of Population by Age Region 1 State Age Groups 2000 2010 2000 2010
17 or younger 25.5% 24.3% 25.1% 23.9%
0 - 4 6.2% 6.8% 6.4% 6.6%
5 - 9 6.8% 6.8% 6.9% 6.6%
10 - 14 7.6% 6.6% 7.2% 6.6%
15 -17 4.9% 4.1% 4.6% 4.1%
18 - 24 10.0% 8.9% 10.2% 10.0%
25 - 44 24.6% 22.0% 27.6% 24.5%
45 - 64 21.8% 26.9% 22.2% 26.7%
65 or older 18.1% 17.8% 14.9% 14.9%
65 - 84 15.3% 14.6% 12.7% 12.4%
85 or older 2.8% 3.2% 2.2% 2.5%
The total population of Region 1 is 99,479 and ismade up of 49.7% males and 50.3% females.
Total Population by Sex Region 1 State
2000 2010 2000 2010
Male 48,514 49,454 1,435,515 1,508,319
Female 50,739 50,025 1,490,809 1,538,036
Total 99,253 99,479 2,926,324 3,046,355 Sioux
Osceola
O'Brien
Lyon
Dickinson
Clay
0 10 20 30 40 50
The median age for each county in the region is shown in the bargraph below. The median age for the state is 38.1 years.
Median Age by County

The Extension and Outreach Indicators Portal: What It Is, How It Will Help You, How To Use It
Iowa State University Extension and Outreach page 18
A population pyramid for the county is included (Adams Co. example, page 13). The third and fourth pages have socioeconomic data that include household and per capita income, housing characteristics, occupation, educational attainment, and poverty level (Adams Co. example, pages 14-15).
The Extension Region profile (example Region 1, pages 16 - 17) has basic population counts and change on the first page. The second page includes basic demographics of age, sex, and race and Hispanic Origin. Overall, these indicators are some of the most frequently used and requested and the Data for Decision Makers provides them in a concise format. As new data for these indicators are released from the various agencies, the portal will update the information automatically.
Iowa Government Finance Initiative (IGFI)The Indicators Portal provides access to local government finance annual reports and data developed by the Iowa Government Finance initiative (IGFI). The IGFI is a program of Iowa State University Extension and Outreach that, in conjunction with the Iowa Department of Management, is collecting, analyzing, and presenting local government financial data in a format that will be helpful to local governments to better understand their fiscal situation and performance. In addition, the IGFI will be developing research and educational components that can provide support to local government officials and employees. The IGFI reports are developed based on annual data reporting requirements of city and county governments. Although
some cities have been submitting reports for up to five years, many have submitted during just the last two fiscal years. They are now required to submit annual data and information. The IGFI reports are accessed on the Indicators Portal through the “Programs” link at the top of the portal pages (Figure 44).
The “Iowa Government Finance Initiative” link goes to another web site specifically for IGFI: http://igfi.extension.iastate.edu/(Figure 45).
At this site the reports are accessed through the “Reports” link. Choose a city from the drop-down menu,
The Indicators Portal: How It Will Help You - Government Finance (IGFI)
Figure 44.
Figure 45.
Figure 46.
Figure 47.
Biswa DasCindy Kendall
The Extension and Outreach Indicators Portal: What It Is, How It Will Help You, How To Use It
page 19Iowa State University Extension and Outreach
Figure 48.
Figure 49.
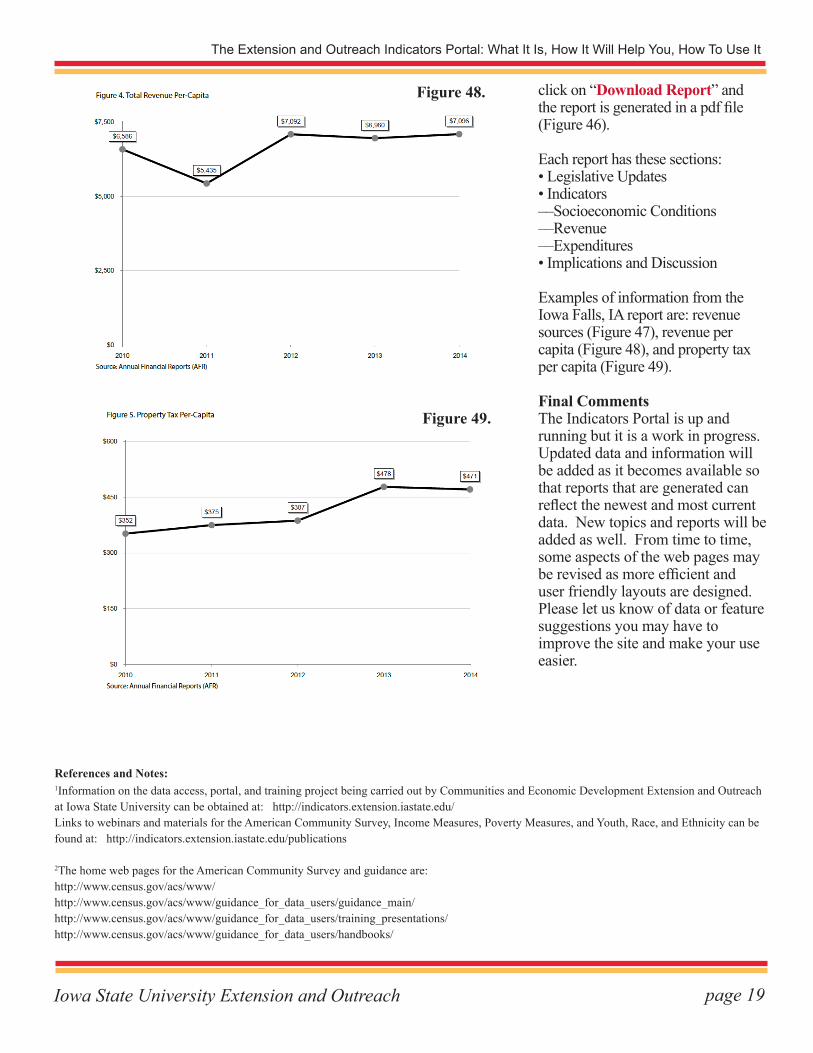
click on “Download Report” and the report is generated in a pdf file (Figure 46).
Each report has these sections:• Legislative Updates• Indicators––Socioeconomic Conditions––Revenue––Expenditures• Implications and Discussion
Examples of information from the Iowa Falls, IA report are: revenue sources (Figure 47), revenue per capita (Figure 48), and property tax per capita (Figure 49).
Final CommentsThe Indicators Portal is up and running but it is a work in progress. Updated data and information will be added as it becomes available so that reports that are generated can reflect the newest and most current data. New topics and reports will be added as well. From time to time, some aspects of the web pages may be revised as more efficient and user friendly layouts are designed. Please let us know of data or feature suggestions you may have to improve the site and make your use easier.
References and Notes:1Information on the data access, portal, and training project being carried out by Communities and Economic Development Extension and Outreach at Iowa State University can be obtained at: http://indicators.extension.iastate.edu/Links to webinars and materials for the American Community Survey, Income Measures, Poverty Measures, and Youth, Race, and Ethnicity can be found at: http://indicators.extension.iastate.edu/publications
2The home web pages for the American Community Survey and guidance are:http://www.census.gov/acs/www/http://www.census.gov/acs/www/guidance_for_data_users/guidance_main/http://www.census.gov/acs/www/guidance_for_data_users/training_presentations/http://www.census.gov/acs/www/guidance_for_data_users/handbooks/

.… and justice for all
The U.S. Department of Agriculture (USDA) prohibits discrimination in all its programs and activities on the basis of race, color, national origin, age, disability, and where applicable, sex, marital status, familial status, parental status, religion, sexual orientation, genetic information, political beliefs, reprisal, or because all or part of an individual’s income is derived from any public assistance program. (Not all prohibited bases apply to all programs.) Persons with disabilities who require alternative means for communication of program information (Braille, large print, audiotape, etc.) should contact USDA’s TARGET Center at 202-720-2600 (voice and TDD). To file a complaint of discrimination, write to USDA, Director, Office of Civil Rights, 1400 Independence Avenue SW, Washington, DC 20250-9410, or call 800-795-3272 (voice) or 202-720-6382 (TDD). USDA is an equal opportunity provider and employer.
Issued in furtherance of Cooperative Extension work, Acts of May 8 and June 30, 1914, in cooperation with the U.S. Department of Agriculture. Cathann A. Kress, director, Cooperative Extension Service, Iowa State University of Science and Technology, Ames, Iowa
The Extension and Outreach Indicators Portal: What It Is, How It Will Help You, How To Use It
Sandra Charvat Burke 181 Heady HallIowa State UniversityAmes, IA [email protected], 2015