communication systems laboratory projects featuring
TRANSCRIPT
AC 2009-1230: COMMUNICATION SYSTEMS LABORATORY PROJECTSFEATURING INTERACTIVE SIMULATION AND VISUALIZATION
Ed Doering, Rose-Hulman Institute of TechnologyEdward Doering received his Ph.D. in electrical engineering from Iowa State University in 1992,and has been a member the ECE faculty at Rose-Hulman Institute of Technology since 1994. Heteaches courses in digital systems, circuits, image processing, and electronic music synthesis, andhis research interests include technology-enabled education, image processing, and FPGA-basedsignal processing.
Sam Shearman, National InstrumentsSam Shearman is a Senior Product Manager for Signal Processing and Communications atNational Instruments (Austin, TX). Working for the firm since 2000, he has served in rolesinvolving product management and R&D related to signal processing, communications, andmeasurement. Prior to working with NI, he worked as a technical trade press editor and as aresearch engineer. As a trade press editor for Personal Engineering & Instrumentation News, hecovered PC-based test and analysis markets. His research engineering work involved embeddingmicrostructures in high-volume plastic coatings for non-imaging optics applications. He receiveda BS (1993) in electrical engineering from the Georgia Institute of Technology (Atlanta, GA).
© American Society for Engineering Education, 2009
Page 14.341.1

Communication Systems Laboratory Projects Featuring
Interactive Simulation and Visualization
Abstract
Engineering communication systems courses rely heavily on mathematical descriptions that can
be difficult for students to quickly grasp. Hands-on laboratory projects and interactive simulation
are two well-established methods to help students develop an intuitive understanding of a
knowledge domain. Constructing a tangible physical system helps students connect the
mathematically-expressed concepts to something real. Moreover, building an interactive
simulation fosters intuition, provided the simulation itself can be constructed quickly and
efficiently.
We have developed a set of laboratory projects that leverage the unique interactive visualization
and simulation capabilities of the LabVIEW graphical dataflow programming environment. With
LabVIEW, students quickly transform mathematical models, algorithms, and block diagrams
into real-time systems whose dynamics can be experienced visually and aurally with an
interactive graphical user interface. The laboratory projects guide students as they assemble
working simulations and interact with the finished result. Each project presents required
background theory as a mini-lecture embodied by a combination of text, diagrams, and streaming
video screencasts, detailed specifications for subsystems to be built supported by video
screencasts of relevant LabVIEW coding techniques, and suggested experiments to study and
interact with the finished system. Hosted on the Connexions web-based open publishing
resource, the projects are openly available and suitable as a turn-key solution for faculty who
wish to enhance an existing communication systems course with little effort. What’s more, the
modularity of the project materials and availability of Connexions editing tools enable faculty to
modify and extend the projects.
Project topics cover fundamental concepts such as bit error rate (BER) vs. Eb/No performance
measure, coherent detection, baseband modulation, inter-symbol interference (ISI) and eye
diagrams, and block coding. More advanced projects explore bandpass modulation schemes
using the computer soundcard and speaker-air-microphone (SAM) channel; students visualize
the signals as they pass through each subsystem and listen to the modulated waveforms, and
quickly develop an appreciation for interrelationships between carrier frequency, channel
bandwidth, bit rate, and noise level. Practical projects such as text messaging over the SAM
channel and Caller ID signal decoding motivate student interest to further study of
communication systems.
Introduction
Communication systems constitute an important part of all electrical engineering curricula.
Introductory communication systems courses rely heavily on mathematical exposition to convey
concepts, and traditional textbooks likewise feature mathematical derivations and proofs to
explain fundamental concepts. The importance of a mathematical framework cannot be denied,
Page 14.341.2

and yet mathematics alone often does not foster an intuitive understanding of these fundamental
concepts.
Hands-on laboratory projects help students to make connections between theory and practice.
Hardware-based projects often require a substantial amount of setup time and debugging effort,
and therefore can only explore a relatively small subset of the course topics. Computer-based
simulation and visualization of communication systems, on the other hand, allow students to
experience a wider variety of fundamental concepts in the same amount of time, provided that
the computer tools offer a sufficiently high level of abstraction. Since modern communication
systems are largely implemented by programmable DSP microprocessors or FPGAs, students
just getting started with communication systems can learn valuable practical implementation
skills by writing computer programs to create small-scale communication systems.
The LabVIEW graphical dataflow programming environment created by National Instruments1
offers a unique way to translate block diagrams, algorithms, and mathematical equations from
the textbook directly into a LabVIEW “virtual instrument,” or VI. Functionality of a VI is
expressed as a “block diagram” constructed of built-in subVIs such as signal sources and filters
connected by wires, and a “front panel” graphical user interface (GUI) containing controls and
indicators. The GUI emerges automatically as a part of the programming process, and requires
no additional effort once the block diagram is complete. The interactive front panel facilitates
real-time interaction with the simulated communication system, thereby allowing the student to
pose “what-if” questions and get immediate feedback.
A set of ten new LabVIEW-based laboratory projects has been developed to support the
communication systems curriculum. These projects leverage the unique capability of LabVIEW
to quickly transform a concept into an interactive simulation. Hosted on the Connexions2 open
web-based content repository, the projects follow the format of a traditional paper-based lab
handout, but also include embedded video clips, or “screencasts,” to demonstrate the LabVIEW
tool in action and to explain relevant background theory. The projects refer to specific chapters
within standard communication systems textbooks3-11
, helping faculty to choose projects relevant
to their course syllabi.
Each project strives to make communication systems concepts as tactile and hands-on as
possible, and to engage multiple senses. Whenever possible, signals are visualized as waveforms
and “auralized” as sound simultaneously. The real-time nature of the LabVIEW implementations
ensures that students can adjust a parameter and see and hear the resulting changes in behavior
immediately, helping students to quickly gain an intuitive feel for the systems under study. The
topics also motivate students with familiar “attention grabber” projects such as Caller ID, text
messaging, and audio signal processing.
This paper describes the overall structure and design of the laboratory projects, and the
implementation of the project materials on the Connexions resource. Each of the ten laboratory
projects is also summarized.
Page 14.341.3
Laboratory Project Structure
Each laboratory project opens with a summary of activities and expected results, learning
objectives, list of deliverables, and linkages to relevant chapters in popular textbooks3-11
. An
introductory section presents enough background theory to bridge between the student’s
classroom experiences and the project activities. The introduction relays factual information as
text and static diagrams, and presents more complex material and concepts as video screencasts
created from a writing tablet. These screencasts feature handwriting, diagrams, and narration,
and serve as a virtual lecture with supporting whiteboard diagrams.
The laboratory procedure guides the student to create a set of software building blocks
(LabVIEW subroutines – “subVIs”) according to precise specifications, and then assemble these
building blocks to form a complete system (LabVIEW application VI). Each project requires
about five or more subVIs, although many subVIs are reused by several projects. For example,
the specifications of the utility subVI “util_BinarySymmetricChannel.vi”
(http://cnx.org/content/m18537) describe the subVI, provide a list of required input controls and
output indicators (and associated data types), state the required behavior of the subVI, and
illustrate relevant LabVIEW coding techniques with a screencast video. In this way students
practice good bottom-up implementation by building and debugging the low-level building
blocks before constructing the top-level system.
Connexions Content Hosting
The laboratory project materials are hosted on the Connexions open resource at Rice University
(http://cnx.org). Connexions organizes content as discrete learning modules (individual web
pages) that can be combined into collections. Authors can create modules using CNXML, a
variant of XML that supports a rich variety of text markup, including MathML for mathematical
symbols and equations. Module authors maintain copyright, and agree to license their work
under the Creative Commons Attribution License12
.
Laboratory Project Descriptions
The laboratory projects explore several basic themes, including simulation and visualization of
fundamental concepts in communication systems, channel coding and error control, FSK
demodulation, and bandpass communications over a speaker-to-air-to-microphone (SAM)
channel. The ten laboratory projects and 40 subVI specifications are combined into a collection
called “Communication Systems Projects with LabVIEW,” http://cnx.org/content/col10610, and
are summarized below.
Simulation and Visualization of Fundamental Concepts:
Digital Communication System Simulation and Visualization – http://cnx.org/content/m18660 –
Simulation and visualization enhance understanding of communication system behavior and
performance. In this project, develop a simple model for a transmitter, channel, and receiver, and
study the performance of the system in terms of bit error rate (BER). Channel errors are Page 14.341.4
visualized as images and “auralized” as sound to further develop insight into the relationships
between bit error rate and message length.
Intersymbol Interference (ISI) and the Eye Diagram – http://cnx.org/content/m18662 – This
project studies intersymbol interference (ISI) in an intuitive way by using a LabVIEW VI to
simulate a pulse transmitter, finite bandwidth channel, and received signaling waveform.
Rectangular pulses are considered first to demonstrate the ISI problem, and then two alternative
pulse shapes are explored as a way to minimize ISI. The project also introduces the eye diagram
as a visual aid to present the time-domain signaling waveform and promote understanding of ISI.
PAM Transmitter and Receiver Implementing Coherent Detection –
http://cnx.org/content/m18652 – The integrate-and-dump detector is fundamental to coherent
detection, the optimal receiver technique that minimizes bit error rate (BER) for a given signal-
to-noise ratio Eb/No. In this project develop a pulse amplitude (PAM) transmitter based on a
transmit filter to map a bitstream onto a signaling waveform (rectangular and Manchester pulse
shapes), an additive white Gaussian noise (AWGN) channel, and a receiver that implements
integrate-and-dump detection. All waveforms throughout the signal processing chain are
presented as a stacked chart indicator with a speed control to permit generated waveforms to be
studied slowly (i.e., the integrator output ramping up or down) or quickly to process long
message bitstreams. Visualizing the critical system signals as waveforms facilitates exploration
of the effects of specific values of BER and Eb/No, and promotes deeper understanding of
coherent detection.
Channel Coding and Error Control:
Hamming Block Code Channel Encoder – http://cnx.org/content/m18663 – Channel encoding
inserts additional information into a transmitted bitstream to facilitate error detection and error
correction at the receiver. Block coding breaks up a bitstream into words of length k bits and
appends check bits to form a codeword of length n bits. A corresponding channel decoder
examines the complete codeword, and detects and even corrects certain types of erroneous bits
caused by the channel. In this project, develop a channel encoder using a special class of block
code called a Hamming code. In a follow-on project, develop a companion channel decoder, and
then evaluate the performance of the complete encoder/decoder system.
Hamming Block Code Channel Decoder – http://cnx.org/content/m18665 – In the prerequisite
project you developed a channel encoder using a special class of block code called a Hamming
code. In this project, develop the companion channel decoder, and then evaluate the performance
of the complete encoder/decoder system.
FSK Demodulation:
Caller ID Decoder – http://cnx.org/content/m18708 – Telephone “Caller ID” service provides
the calling party's directory information as well as the time and date of the call as an FSK
(frequency shift keying) signal between the first and second rings of a telephone call. In this
project, develop a complete Caller ID decoder that analyzes an audio recording of the FSK signal
to extract the directory and date information for display.
Page 14.341.5
Bandpass Communications Over the Speaker-Air-Microphone Channel:
Speaker-Air-Microphone (SAM) Channel Characterization – http://cnx.org/content/m18666 –
A speaker and microphone connected to a computer serve as an excellent communications
channel because the transmitted information is audible. Listening to the channel while making
parameter adjustments and viewing plots builds additional insight into the specific modulation
scheme under study. This project describes how to characterize a “speaker-air-microphone”
(SAM) channel for use in subsequent projects that use bandpass modulation techniques.
Binary ASK Transmitter – http://cnx.org/content/m18668 – A binary ASK transmitter and
receiver is designed to transmit digital information over a “speaker-air-microphone” (SAM)
channel. Listening to the channel while making parameter adjustments and viewing plots builds
additional insights into the ASK modulation scheme. This project describes the various tradeoffs
affecting bandwidth and information rate and provides an application for the pulse-shaping
transmit filter.
Texting Over the Speaker-Air-Microphone (SAM) Channel – http://cnx.org/content/m18670 –
Texting and instant messaging are familiar and popular communication techniques. Text
messages composed of ASCII characters, with each character composed of eight bits, ultimately
form a stream of bits transmitted from the source to the receiver. Normally the text message
moves through a complex data network, and the user only sees the endpoints of the system. In
this project, however, you will be able to follow the text message on its complete journey
through a binary ASK transmitter, a speaker-air-microphone (SAM) channel, and a binary ASK
receiver.
Introduction to the LabVIEW Modulation Toolkit – http://cnx.org/content/m18715 – The
LabVIEW Modulation Toolkit is an optional add-on to LabVIEW that offers a wide variety of
subVIs to quickly and efficiently implement digital and analog communication systems. Many
different modulation schemes are supported (PAM, ASK, PSK, FSK, QAM, CPM, and MSK), as
are channel impairment models, channel coding, and visualizations such as constellation plots,
eye diagrams, and trellis diagrams. This module introduces the toolkit with several
demonstrations, and shows how to re-implement existing LabVIEW communication systems
projects with the toolkit.
Examples
Example 1: Intersymbol Interference (ISI) and the Eye Diagram
Rectangular pulses familiar to students from earlier digital logic courses seem intuitively obvious
for the signaling waveform of a digital communications system. However, finite channel
bandwidth smears the pulses into adjacent time slots, a phenomenon known as intersymbol
interference (ISI). This interference reduces noise margin and increases the bit error rate (BER)
in the received message. An eye diagram plot visualizes the time-domain signaling waveform at
the receiver; it illustrates the ISI effect and also facilitates direct measurement of optimum
sampling time, noise margin, timing error sensitivity, jitter, and peak ISI. Mitigating intersymbol
Page 14.341.6
interference requires a signaling waveform with zero value at the sample instants in all adjacent
time slots. The sinc pulse and the more practical raised cosine pulse both satisfy this
requirement.
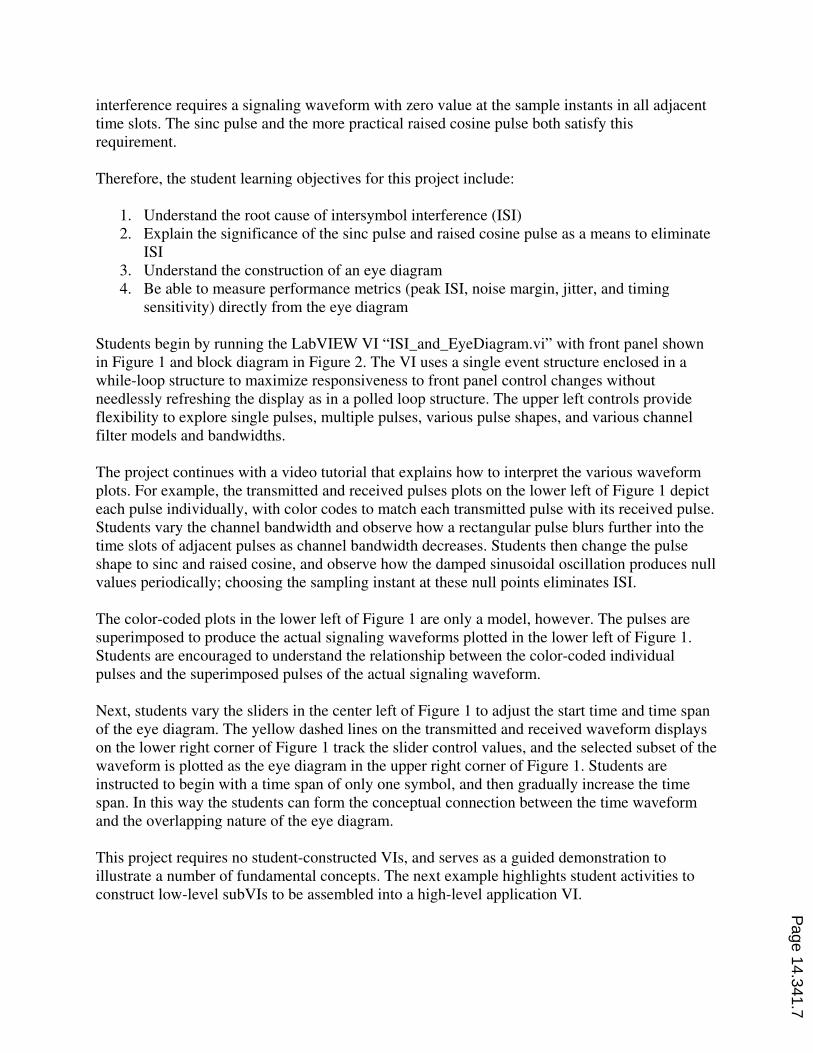
Therefore, the student learning objectives for this project include:
1. Understand the root cause of intersymbol interference (ISI)
2. Explain the significance of the sinc pulse and raised cosine pulse as a means to eliminate
ISI
3. Understand the construction of an eye diagram
4. Be able to measure performance metrics (peak ISI, noise margin, jitter, and timing
sensitivity) directly from the eye diagram
Students begin by running the LabVIEW VI “ISI_and_EyeDiagram.vi” with front panel shown
in Figure 1 and block diagram in Figure 2. The VI uses a single event structure enclosed in a
while-loop structure to maximize responsiveness to front panel control changes without
needlessly refreshing the display as in a polled loop structure. The upper left controls provide
flexibility to explore single pulses, multiple pulses, various pulse shapes, and various channel
filter models and bandwidths.
The project continues with a video tutorial that explains how to interpret the various waveform
plots. For example, the transmitted and received pulses plots on the lower left of Figure 1 depict
each pulse individually, with color codes to match each transmitted pulse with its received pulse.
Students vary the channel bandwidth and observe how a rectangular pulse blurs further into the
time slots of adjacent pulses as channel bandwidth decreases. Students then change the pulse
shape to sinc and raised cosine, and observe how the damped sinusoidal oscillation produces null
values periodically; choosing the sampling instant at these null points eliminates ISI.
The color-coded plots in the lower left of Figure 1 are only a model, however. The pulses are
superimposed to produce the actual signaling waveforms plotted in the lower left of Figure 1.
Students are encouraged to understand the relationship between the color-coded individual
pulses and the superimposed pulses of the actual signaling waveform.
Next, students vary the sliders in the center left of Figure 1 to adjust the start time and time span
of the eye diagram. The yellow dashed lines on the transmitted and received waveform displays
on the lower right corner of Figure 1 track the slider control values, and the selected subset of the
waveform is plotted as the eye diagram in the upper right corner of Figure 1. Students are
instructed to begin with a time span of only one symbol, and then gradually increase the time
span. In this way the students can form the conceptual connection between the time waveform
and the overlapping nature of the eye diagram.
This project requires no student-constructed VIs, and serves as a guided demonstration to
illustrate a number of fundamental concepts. The next example highlights student activities to
construct low-level subVIs to be assembled into a high-level application VI.
Page 14.341.7

Example 2: PAM Transmitter and Receiver Implementing Coherent Detection
Transmitters use pulse amplitude modulation (PAM) to produce a baseband signaling waveform
prior to up-conversion for a bandpass channel. The receiver down-converts the signal back to
baseband and then apply one of two detection schemes. The simpler (and less expensive)
incoherent detection does not require carrier and bit synchronization as does coherent detection,
but at the expense of higher bit error rate. The learning objectives for this project include:
1. Implement a binary pulse amplitude modulation (PAM) transmitter
2. Model an additive white Gaussian noise (AWGN) channel impairment with a random
number generator
3. Implement a PAM receiver based on the integrate-and-dump form of coherent detection
4. Study the signal processing chain from the source message bitstream to the regenerated
bitstream
5. Evaluate system performance using a plot of bit error rate (BER) vs. signal-to-noise ratio
(Eb/No)
6. Learn how to use the LabVIEW point-by-point signal processing design pattern
After reviewing the background theory presented as a mixture of text, mathematical equations,
diagrams, and videos, the students are directed to build and debug the following low-level
subVIs:
1. Transmitter pulse amplitude modulation (PAM) signal:
a. pam_SignalPointMapper.vi -- http://cnx.org/content/m18570
b. pam_RectanglePulse.vi -- http://cnx.org/content/m18454
c. pam_ManchesterPulse.vi -- http://cnx.org/content/m18466
d. pam_TransmitFilter.vi -- http://cnx.org/content/m18472
e. pam_TransmitSync.vi -- http://cnx.org/content/m18478
2. Receiver bitstream regeneration:
a. regen_Correlator.vi -- http://cnx.org/content/m18579
b. regen_SampleHold.vi -- http://cnx.org/content/m18621
c. regen_BitstreamBuffer.vi -- http://cnx.org/content/m18494
3. Utility functions:
a. util_BitstreamFromRandom.vi -- http://cnx.org/content/m18528
b. util_AWGNchannel_PtByPt.vi -- http://cnx.org/content/m18515
c. util_MeasureBER.vi -- http://cnx.org/content/m18547
d. util_Qfunction.vi -- http://cnx.org/content/m18545
Figures 3 through 7 show the block diagrams the transmitter-related subVIs as illustrative
examples. Each of these subVI projects includes a screencast video to present relevant LabVIEW
coding techniques. Once completed, the students are guided through the process necessary to
integrate these subVIs into the top-level application VI shown in Figure 8 (front panel) and
Figure 9 (block diagram). During the system integration process students are provided with
checkpoint test values to confirm that they have properly implemented the system. Students
experiment with their finished product and experience the remarkable ability of coherent
Page 14.341.8

detection to recover a useful signal with relatively low bit error rate, even with significant
channel noise level.
Results
The beginning of December 2008 marked the public release of the laboratory project materials.
As of this writing, two months of usage data collected by the Connexions system indicates over
7,000 page views. Google Analytics tracks the screencast videos, and reports over 800 videos
viewed with an average viewing time of four minutes, about half of the typical duration of a
video. Home countries of the majority of viewers include the USA, Poland, India, Pakistan, UK,
France, Germany, China, Canada, and Romania, as well as over 50 additional countries and
territories.
Summary
“Communications Systems Projects with LabVIEW” features ten project activities in digital
communication systems based on the LabVIEW graphical dataflow programming platform. Each
project includes introductory material in the form of text and narrated screencast videos,
specifications for low-level subVI building blocks, and step-by-step instructions to assemble
application VIs to implement a variety of simulations, visualizations, and working transmitters
and receivers. Usage statistics during the first two months of public availability of the project
materials show a strong interest so far, and we plan to work with a variety of universities to
encourage adoption of the materials.
Bibliography
1. http://ni.com/labview
2. Baraniuk, R.G., C.S. Burrus, D.H. Johnson, and D.L. Jones, “Sharing Knowledge and Building Communities in
Signal Processing,” IEEE Signal Processing Magazine, pp. 10-16, Sep 2004.
3. Carlson, A.B., P.B. Crilly, and J.C. Rutledge, Communication Systems, 4th ed., McGraw-Hill, 2002.
4. Couch, L.W. II, Digital and Analog Communication Systems, 7th ed., Pearson Prentice Hall, 2007.
5. Haykin, S., Communication Systems, 4th ed., Wiley, 2001.
6. Haykin, S., and M. Moher, Introduction to Analog and Digital Communication Systems, 2nd ed., Wiley, 2007.
7. Lathi, B.P., Modern Digital and Analog Communication Systems, 3rd ed., Oxford University Press, 1998.
8. Proakis, J.G., and M. Salehi, Fundamentals of Communication Systems, Pearson Prentice Hall, 2005.
9. Proakis, J.G., and M. Salehi, Communication Systems Engineering, 2nd ed., Pearson Prentice Hall, 2002.
10. Stern, H.P.E., and S.A. Mahmoud, Communication Systems, Pearson Prentice Hall, 2004.
11. Wheeler, T., Electronic Communications for Technicians, 2nd ed., Pearson Prentice Hall, 2006.
12. Creative Commons Attribution License, http://creativecommons.org/licenses/by/2.0/.
Page 14.341.9

Figure 1: Front panel of LabVIEW VI “ISI_and_EyeDiagram.vi” used to visualize intersymbol
interference as an eye diagram.
Page 14.341.10

Figure 2: Block diagram of LabVIEW VI “ISI_and_EyeDiagram.vi” (shown in two parts)
Page 14.341.11

Figure 3: The “pam_SignalPointMapper.vi” subVI loops over the Boolean-type input bitstream
and converts it to a pair of “analog” values.
Figure 4: The “pam_RectanglePulse.vi” subVI produces a constant-valued array.
Figure 5: The “pam_ManchesterPulse.vi” subVI produces a two-valued array suitable for the
Manchester pulse shape.
Page 14.341.12
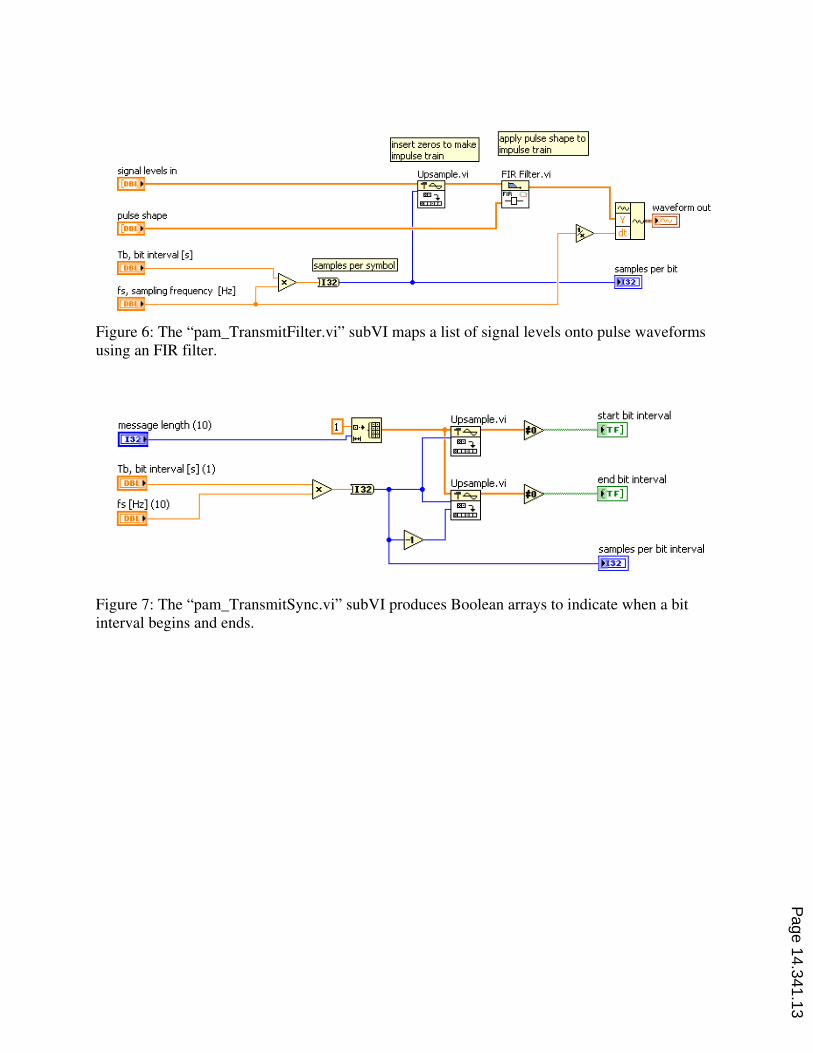
Figure 6: The “pam_TransmitFilter.vi” subVI maps a list of signal levels onto pulse waveforms
using an FIR filter.
Figure 7: The “pam_TransmitSync.vi” subVI produces Boolean arrays to indicate when a bit
interval begins and ends.
Page 14.341.13

Figure 8: Front panel of top-level application VI for coherent detection.
Page 14.341.14
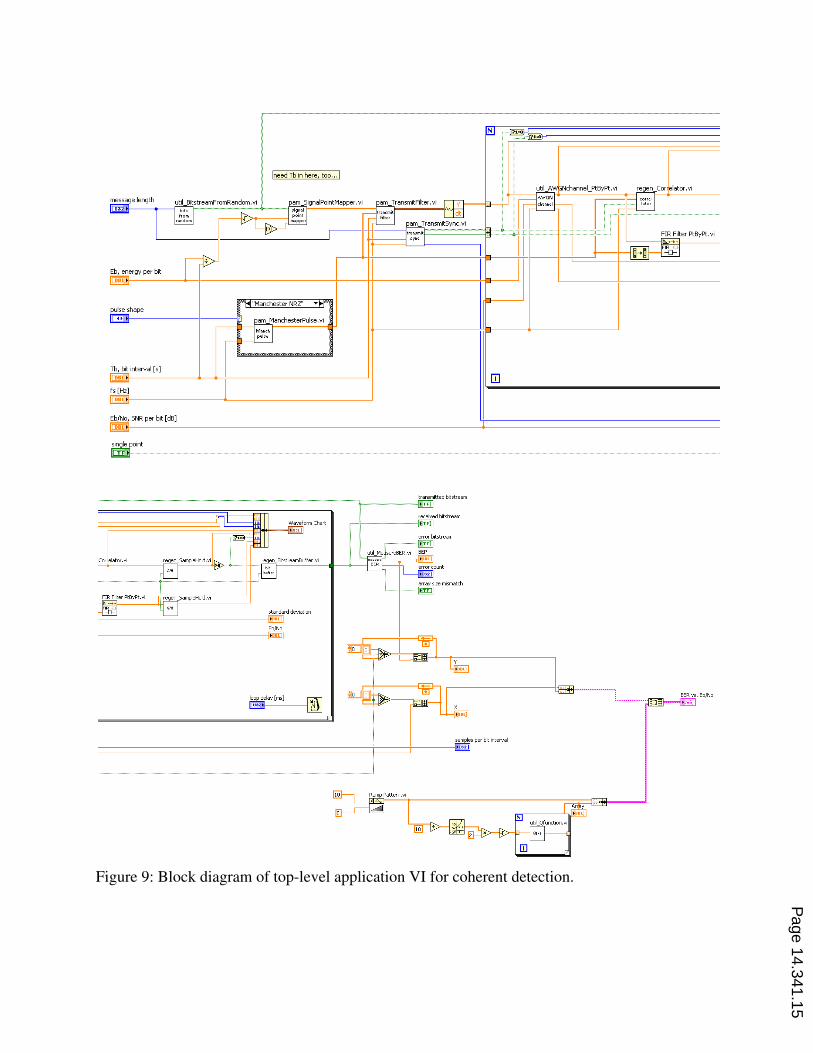
Figure 9: Block diagram of top-level application VI for coherent detection.
Page 14.341.15