communication accelerated nmr spectroscopy with...
TRANSCRIPT

COMMUNICATION
Accelerated NMR Spectroscopy with Low Rank Reconstruction Xiaobo Qu*[a], Maxim Mayzel[b], Jian-Feng Cai[c], Zhong Chen[a], and Vladislav Orekhov*[b]
Abstract: Accelerated multi-dimensional NMR spectroscopy is a prerequisite for studying short-lived molecular systems, monitoring chemical reactions in real-time, high-throughput applications, etc. Non-uniform sampling is a common approach to reduce the measurement time. Here, we introduce a new method for high quality spectra reconstruction from non-uniformly sampled data, which is based on recent developments in the field of signal processing theory and utilizes the so far unexploited general property of the NMR signal, its low rank. Using experimental and simulated data, we demonstrate that the low rank reconstruction is a viable alternative to the current state-of-the-art technique compressed sensing. In particular, the low rank approach is good in preserving of low intensity broad peaks, and thus increases the effective sensitivity in the reconstructed spectra.
Achieving high spectral resolution and sensitivity while keeping a minimal measurement time, is of primary importance in many NMR applications such as studies of short-lived molecular systems, in-cell NMR experiments[1], characterizing intermediates of chemical reactions in real time[2], high throughput and metabolomic[3] applications, etc. The duration of a multi-dimensional NMR experiment is proportional to the number of measured data points and increases rapidly with spectral resolution and dimensionality. The Non-Uniform Sampling (NUS)[4] approach offers a general solution for a dramatic reduction in measurement time.
The reconstruction of a spectrum from a non-uniformly sampled signal is impossible without introducing additional constraints or assumptions on the signal in the time or frequency domains. Apart from computational issues such as convergence and stability in respect to noise and spectral artefacts, success of an algorithm in reconstructing a high quality spectrum depends largely on the correctness of the used constraints that are derived from known NMR signal properties. For example, the Compressed Sensing (CS) approach[5] exploit a reasonable notion that an NMR spectrum is sparse, i.e. that only a few time-domain frequencies give rise to true peaks while the rest of the spectral space contains only baseline noise. Despite the evident success of CS[3, 6], it was recently noted that sparseness of the NMR spectrum is a crude approximation and the quality of the
CS processed spectrum obtained from NUS data can be significantly improved by additional signal pre-processing steps such as zero filling or virtual echo[7]. In particular, spectra with broad lines deviate from the sparseness assumption made in CS and line shape distortions and even suppression of signals might be observed. Hence, the question remains, can an algorithm, based on alternative general signal property assumptions, provide NUS spectra reconstructions of even higher quality and from fewer acquired data points?
In this work, we introduce Low Rank (LR) spectrum reconstruction that is inspired by recent developments in the field of low rank matrix completion with many remarkable demonstrations in medical imaging[8], computer vision[9], and other applications. It has been proven that a low rank matrix can be recovered faithfully from limited number of its elements[10]. Unlike CS, which seeks for a spectrum with the fewest non-zero spectral intensities, the LR approach reconstructs a spectrum with the least number of spectral peaks. The latter assumes that the time-domain NMR signal can be approximated by a sum of a few decaying sine waves (or exponentials). This assumption has been applied to signal processing in NMR for decades, e.g. in linear prediction[11], filter-diagonalization[12], recursive multi-dimensional decomposition[13] and other algorithms. Yet, to the best of our knowledge, this signal property was never used as a constraint in non-parametric algorithms for the reconstruction of NUS spectra.
Let vector x be the complete NMR signal that is called the free induction decay (FID) and the operator R converts it into a Hankel matrix[11] =X Rx . The low rank of the FID means that the rank of its Hankel matrix X is low, i.e. the number of non-zero singular values of X is small. As it is illustrated in Supplementary Figure S1, the FID rank is equal to the number of exponentials in x [11]. Notably, the rank is independent of the line width of the peaks in the spectrum. When the FID is non-uniformly sampled, the matrix X contains missing entries. Thus, the task of the spectrum reconstruction from the NUS data is equivalent to recovering the matrix X and can be formulated as a low rank matrix completion problem[10]:
(1)
where y is the acquired NUS FID data, U is an operator of the
NUS schedule, Rx∗
is the nuclear norm [14] defined as a sum
of matrix singular values, and λ trades the low rank constraint with the consistency between the reconstructed signal x and the experimental data y. It is worth noting that the LR constraint in Eq. (1) is imposed on the time-domain signal. Eq. (1) can be efficiently solved by the alternating direction minimization method[15] (see Supporting Information).
[a] Prof. X. Qu, Prof. Z. Chen Department of Electronic Science, Fujian Provincial Key Laboratory of Plasma and Magnetic Resonance, State Key Laboratory of Physical Chemistry of Solid Surfaces, Xiamen University P.O.Box 979, Xiamen 361005 (China) E-mail: [email protected]
[b] Dr. M. Mayzel, Prof. V. Orekhov Swedish NMR Centre, University of Gothenburg P.O. Box 465, Gothenburg 40530 (Sweden) E-mail: [email protected]
[c] Prof. J.F.Cai Department of Mathematics, University of Iowa, Iowa City, IA 52242 (USA)
Supporting information for this article is given via a link at the end of the document.
minx
Rx∗+λ2y−Ux
2
2
COMMUNICATION
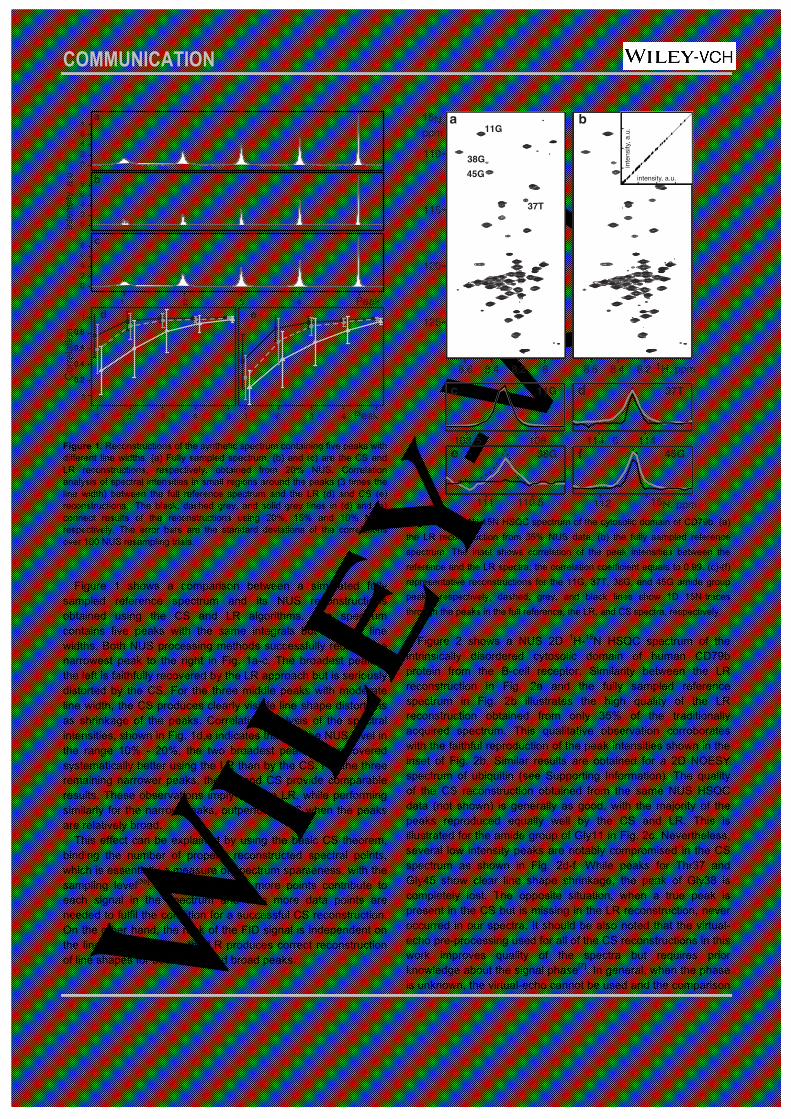
Figure 1. Reconstructions of the synthetic spectrum containing five peaks with different line widths. (a) Fully sampled spectrum, (b) and (c) are the CS and LR reconstructions, respectively, obtained from 20% NUS. Correlation analysis of spectral intensities in small regions around the peaks (3 times the line width) between the full reference spectrum and the LR (d) and CS (e) reconstructions,. The black, dashed grey, and solid grey lines in (d) and (e) connect results of the reconstructions using 20%, 15% and 10% NUS, respectively. The error bars are the standard deviations of the correlations over 100 NUS resampling trials.
Figure 1 shows a comparison between a simulated fully sampled reference spectrum and its NUS reconstructions obtained using the CS and LR algorithms. The spectrum contains five peaks with the same integrals but different line widths. Both NUS processing methods successfully recover the narrowest peak to the right in Fig. 1a-c. The broadest peak to the left is faithfully recovered by the LR approach but is seriously distorted by the CS. For the three middle peaks with moderate line width, the CS produces clearly visible line shape distortions as shrinkage of the peaks. Correlation analysis of the spectral intensities, shown in Fig. 1d,e indicates that, for the NUS level in the range 10% - 20%, the two broadest peaks are recovered systematically better using the LR than by the CS. For the three remaining narrower peaks, the LR and CS provide comparable results. These observations imply that the LR, while performing similarly for the narrow peaks, outperforms CS when the peaks are relatively broad.
This effect can be explained by using the basic CS theorem, binding the number of properly reconstructed spectral points, which is essentially a measure of spectrum sparseness, with the sampling level[5b]. For broad peaks, more points contribute to each signal in the spectrum and thus more data points are needed to fulfil the condition for a successful CS reconstruction. On the other hand, the rank of the FID signal is independent on the line width, and thus the LR produces correct reconstruction of line shapes for both sharp and broad peaks.
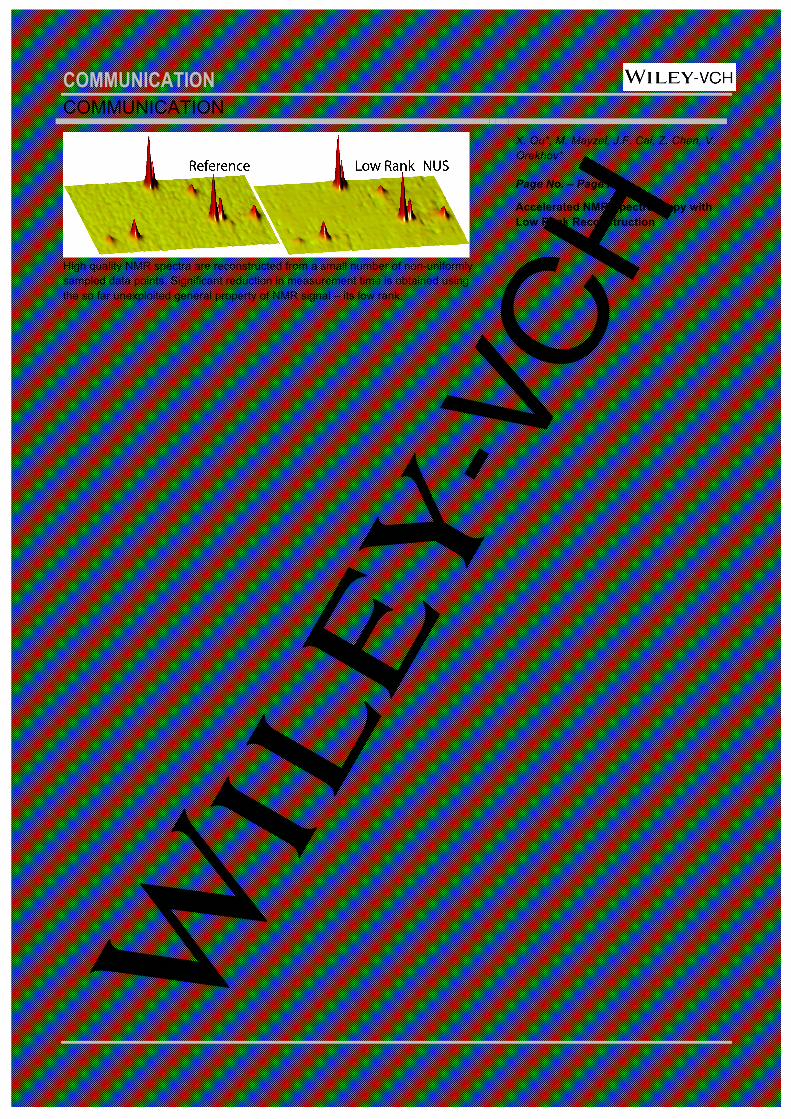
Figure 2. 2D 1H-15N HSQC spectrum of the cytosolic domain of CD79b. (a) the LR reconstruction from 35% NUS data, (b) the fully sampled reference spectrum. The inset shows correlation of the peak intensities between the reference and the LR spectra; the correlation coefficient equals to 0.99. (c)-(f) representative reconstructions for the 11G, 37T, 38G, and 45G amide group peaks, respectively; dashed, grey, and black lines show 1D 15N-traces through the peaks in the full reference, the LR, and CS spectra, respectively.
Figure 2 shows a NUS 2D 1H-15N HSQC spectrum of the
intrinsically disordered cytosolic domain of human CD79b protein from the B-cell receptor. Similarity between the LR reconstruction in Fig. 2a and the fully sampled reference spectrum in Fig. 2b illustrates the high quality of the LR reconstruction obtained from only 35% of the traditionally acquired spectrum. This qualitative observation corroborates with the faithful reproduction of the peak intensities shown in the inset of Fig. 2b. Similar results are obtained for a 2D NOESY spectrum of ubiquitin (see Supporting Information). The quality of the CS reconstruction obtained from the same NUS HSQC data (not shown) is generally as good, with the majority of the peaks reproduced equally well by the CS and LR. This is illustrated for the amide group of Gly11 in Fig. 2c. Nevertheless, several low intensity peaks are notably compromised in the CS spectrum as shown in Fig. 2d-f. While peaks for Thr37 and Gly45 show clear line shape shrinkage, the peak of Gly38 is completely lost. The opposite situation, when a true peak is present in the CS but is missing in the LR reconstruction, never occurred in our spectra. It should be also noted that the virtual-echo pre-processing used for all of the CS reconstructions in this work improves quality of the spectra but requires prior knowledge about the signal phase[7]. In general, when the phase is unknown, the virtual-echo cannot be used and the comparison
02468
02468
02468
Inte
nsity
, a.u
.
1 2 3 4 Peak
a
b
c
1 2 3 4 5
1
0
0.20.40.60.8
Corre
lation
d
Peak1 2 3 4
e
8.6 8.4 8.2 8
125
120
115
110
8.6 8.4 8.2
15N,ppm
1H, ppm
11G
38G45G
37T
a b
intensity, a.u.
inten
sity,
a.u.
114. 5 114
37Td
108.5 108
11Gc
112
45G
15N, ppm
f
111 110.5
38Ge

COMMUNICATION
between the CS and LR would be even more in favour of the LR method. The experimental results are fully consistent with the simulations shown in Fig. 1 and lead us to the conclusion that the LR produces at least as good spectral reconstructions as the CS and often outperforms it for broadest and weakest peaks. Effective sensitivity of a spectrum reconstruction method from NUS data is defined as a possibility to detect weak peaks and discriminate them from eventual false signals[16]. Thus, the observed good reconstructions of the low intensity peaks by the LR indicate high sensitivity of the new method.
We introduce the LR reconstruction as a new general technique for obtaining high quality spectra from a small number of NUS data points. The method allows a significant reduction in measurement time, which is particularly useful for high throughput applications, studies of short lived systems, time resolved experiments, and many other practical cases. We demonstrate the first NUS reconstruction algorithm using the low rank property of the NMR time-domain signal. The LR and CS approaches are based on distinctly different assumptions and in future work we envisage design of an even more powerful NUS processing algorithm that combines the low rank and sparseness signal properties.
Acknowledgements
The work was supported by the National Natural Science Foundation of China (61201045, 11375147); Fundamental Research Funds for the Central Universities (PRC) (2013SH002); The Swedish Research Council (grant 2011-5994); US National Science Foundation (DMS-1418737). X. Qu is grateful to the Wenner-Gren Foundation. We thank Dr. L. Isaksson for preparing the CD79b sample.
Keywords: fast NMR spectroscopy • IRLS • IST • matrix completion • real-time
[1] aD. Sakakibara, A. Sasaki, T. Ikeya, J. Hamatsu, T. Hanashima, M. Mishima, M. Yoshimasu, N. Hayashi, T. Mikawa, M. Wälchli, B. O. Smith, M. Shirakawa, P. Güntert, Y. Ito, Nature 2009, 457, 102-105; bF.-X. Theillet, H. M. Rose, S. Liokatis, A. Binolfi, R. Thongwichian, M. Stuiver, P. Selenko, Nat Protoc 2013, 8, 1416-1432.
[2] aJ. Balbach, V. Forge, W. S. Lau, N. A. van Nuland, K. Brew, C. M. Dobson, 1996, 274, 1161-1163; bI. Landrieu, L. Lacosse, A. Leroy, J.-M. Wieruszeski, X. Trivelli, A. Sillen, N. Sibille, H. Schwalbe, K. Saxena, T. Langer, G. Lippens, J. Am. Chem. Soc. 2006, 128, 3575-3583; cE.
Rennella, T. Cutuil, P. Schanda, I. Ayala, V. Forge, B. Brutscher, J. Am. Chem. Soc. 2012, 134, 8066-8069; dM. Mayzel, J. Rosenlow, L. Isaksson, V. Y. Orekhov, J Biomol NMR 2014, 58, 129-139.
[3] A. L. Guennec, P. Giraudeau, S. Caldarelli, Anal. Chem. 2014, 86, 5946-5954.
[4] aJ. C. J. Barna, E. D. Laue, M. R. Mayger, J. Skilling, S. J. P. Worrall, J. Magn. Reson. 1987, 73, 69-77; bK. Kazimierczuk, J. Stanek, A. Zawadzka-Kazimierczuk, W. Kozminski, Prog Nucl Mag Res Sp 2010, 57, 420-434; cS. G. Hyberts, K. Takeuchi, G. Wagner, J. Am. Chem. Soc. 2010, 132, 2145-2147; dV. Y. Orekhov, V. A. Jaravine, Prog. Nucl. Magn. Reson. Spectrosc. 2011, 59, 271-292; eJ. C. Hoch, M. W. Maciejewski, M. Mobli, A. D. Schuyler, A. S. Stern, Acc. Chem. Res. 2014, 47, 708-717.
[5] aD. L. Donoho, 2006, 52, 1289-1306; bE. J. Candes, J. K. Romberg, T. Tao, Commun. Pur. Appl. Math. 2006, 59, 1207-1223.
[6] aK. Kazimierczuk, V. Y. Orekhov, Angew. Chem. Int. Ed. 2011, 50, 5556-5559; bD. J. Holland, M. J. Bostock, L. F. Gladden, D. Nietlispach, Angew. Chem. Int. Ed. 2011, 50, 6548-6551; cY. Shrot, L. Frydman, J. Magn. Reson. 2011, 209, 352-358; dX. B. Qu, D. Guo, X. Cao, S. H. Cai, Z. Chen, Sensors 2011, 11, 8888-8909; eS. G. Hyberts, A. G. Milbradt, A. B. Wagner, H. Arthanari, G. Wagner, J Biomol NMR 2012, 52, 315-327; fE. C. Lin, S. J. Opella, J. Magn. Reson. 2013, 237, 40-48.
[7] M. Mayzel, K. Kazimierczuk, V. Y. Orekhov, Chem Comm 2014, 50, 8947-8950.
[8] aB. Zhao, J. P. Haldar, A. G. Christodoulou, Z. P. Liang, IEEE T. Med. Imag. 2012, 31, 1809-1820; bH. M. Nguyen, X. Peng, M. N. Do, Z. P. Liang, IEEE T. Biomed. Engin. 2013, 60, 78-89; cP. J. Shin, P. E. Z. Larson, M. A. Ohliger, M. Elad, J. M. Pauly, D. B. Vigneron, M. Lustig, Magn. Reson. Medicine 2013, DOI 10.1002/mrm.24997; dJ. F. Cai, X. Jia, H. Gao, S. B. Jiang, Z. Shen, H. Zhao, IEEE T. Med. Imag. 2014, 33, 1581-1591.
[9] aE. J. Candès, X. Li, Y. Ma, J. Wright, J. ACM 2011, 58, Article Numb. 11; bH. Ji, S. Huang, Z. Shen, Y. Xu, SIAM J. Imag. Sci. 2011, 4, 1122; cW. Dong, G. Shi, X. Li, Y. Ma, F. Huang, IEEE T. Image Processing 2014, 32, 3618-3632.
[10] aE. J. Candès, B. Recht, Found Comput Math 2009, 9, 717-772; bE. J. Candes, Y. Plan, IEEE Proceedings 2010, 98, 925-936.
[11] aP. Koehl, Prog. Nucl. Magn. Reson. Spectrosc . 1999, 34, 257-299; bJ. C. Hoch, A. S. Stern, NMR data processing, Wiley-Liss, 1996.
[12] V. A. Mandelshtam, Progr Nucl Magn Reson Spectrosc 2000, 38, 159-196.
[13] V. Jaravine, I. Ibraghimov, V. Y. Orekhov, Nat. Methods 2006, 3, 605-607.
[14] J. F. Cai, E. J. Candès, Z. W. Shen, SIAM J. Optimization 2010, 20, 1956-1982.
[15] A. Ganesh, L. Zhouchen, J. Wright, W. Leqin, C. Minming, M. Yi, in Computational Advances in Multi-Sensor Adaptive Processing (CAMSAP), 2009 3rd IEEE International Workshop on, 10.1109/CAMSAP.2009.5413299, 2009, pp. 213-216.
[16] S. G. Hyberts, S. A. Robson, G. Wagner, J Biomol NMR 2012, 55, 167-178.
COMMUNICATION
COMMUNICATION
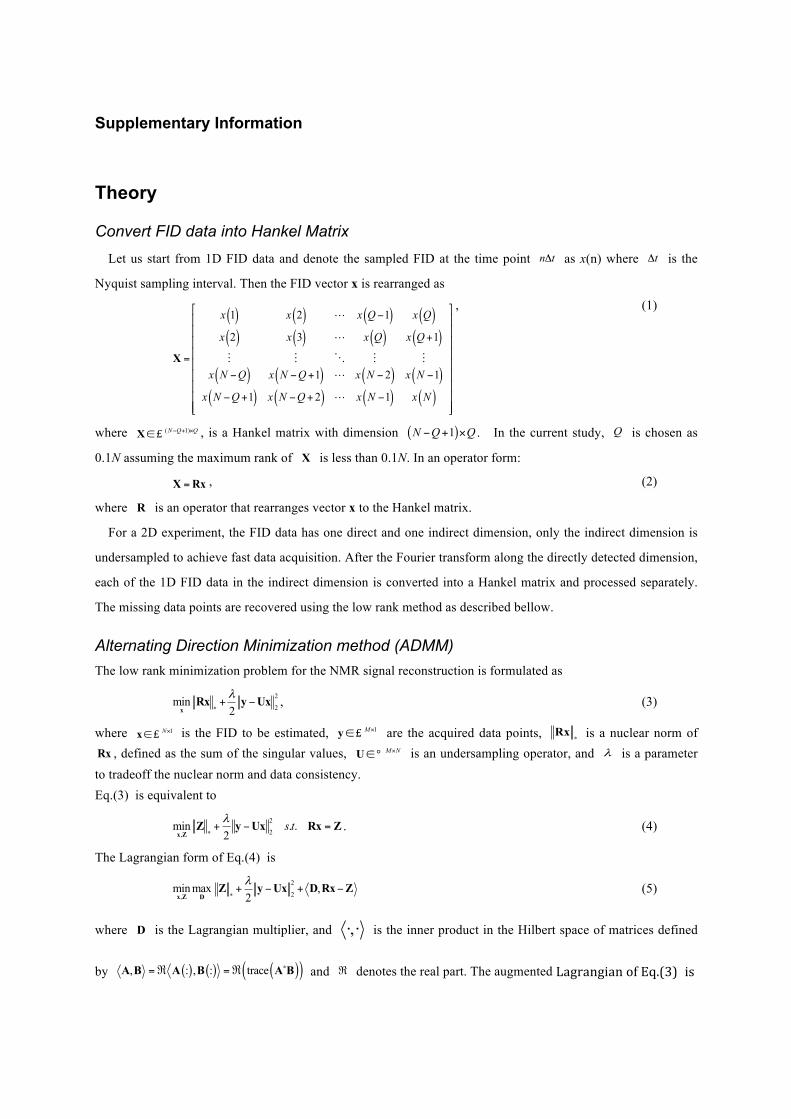
High quality NMR spectra are reconstructed from a small number of non-uniformly sampled data points. Significant reduction in measurement time is obtained using the so far unexploited general property of NMR signal – its low rank.
dsd
X. Qu*, M. Mayzel, J.F. Cai, Z. Chen, V. Orekhov*
Page No. – Page No.
Accelerated NMR Spectroscopy with Low Rank Reconstruction
!
Supplementary Information
Theory
Convert FID data into Hankel Matrix Let us start from 1D FID data and denote the sampled FID at the time point n tΔ as x(n) where tΔ is the
Nyquist sampling interval. Then the FID vector x is rearranged as
X =
x 1( ) x 2( ) ! x Q −1( ) x Q( )x 2( ) x 3( ) ! x Q( ) x Q+1( )! ! " ! !
x N −Q( ) x N −Q+1( ) ! x N − 2( ) x N −1( )x N −Q+1( ) x N −Q+ 2( ) ! x N −1( ) x N( )
"
#
$$$$$$$$$
%
&
'''''''''
, (1)
where ( 1)N Q Q− + ×∈X £ , is a Hankel matrix with dimension ( )1N Q Q− + × . In the current study, Q is chosen as
0.1N assuming the maximum rank of X is less than 0.1N. In an operator form:
X =Rx , (2)
where R is an operator that rearranges vector x to the Hankel matrix.
For a 2D experiment, the FID data has one direct and one indirect dimension, only the indirect dimension is
undersampled to achieve fast data acquisition. After the Fourier transform along the directly detected dimension,
each of the 1D FID data in the indirect dimension is converted into a Hankel matrix and processed separately.
The missing data points are recovered using the low rank method as described bellow.
Alternating Direction Minimization method (ADMM) The low rank minimization problem for the NMR signal reconstruction is formulated as
2
2min
2λ
∗+ −
xRx y Ux , (3)
where 1N×∈x £ is the FID to be estimated, 1M×∈y £ are the acquired data points, ∗Rx is a nuclear norm of
Rx , defined as the sum of the singular values, M N×∈U ° is an undersampling operator, and λ is a parameter to tradeoff the nuclear norm and data consistency. Eq.(3) is equivalent to
2
2,min . .
2s tλ
∗+ − =
x ZZ y Ux Rx Z . (4)
The Lagrangian form of Eq.(4) is
2
2,minmax ,
2λ
∗+ − + −
x Z DZ y Ux D Rx Z (5)
where D is the Lagrangian multiplier, and ,⋅ ⋅ is the inner product in the Hilbert space of matrices defined
by ( ) ( ) ( )( ), : , : trace ∗=ℜ =ℜA B A B A B and ℜ denotes the real part. The augmented Lagrangian'of'Eq.(3)' is'
!
2 2
2,minmax ,
2 2 F
λ β∗+ − + − + −
x Z DZ y Ux D Rx Z Rx Z , (6)
where F⋅ means the Forbenius norm and 0β > is a parameter. By interchanging min-max, the dual problem
is obtained as follows
2 2
2,maxmin ,
2 2 F
λ β∗+ − + − + −
x ZDZ y Ux D Rx Z Rx Z . (7)
Then, Eq. (7) is solved by a gradient ascent algorithm with aspect to D . In ADMM[1], the gradient is approximated by one step alternating direction minimization, and this leads to
x← argmin
x
λ2y−Ux
2
2+ D,Rx −Z +
β2Rx −Z
F
2#$%
&'(
Z← argminZ
Z∗+ D,Rx −Z +
β2Rx −Z
F
2#$%
&'(
D←D+τ Rx −Z( )
#
$
****
%
****
, (8)
where τ is the step size. The first line in Eq. (8) is equivalent to
2
2
2min
2 2 F
λ ββ
− + − +x
Dy Ux Rx Z , (9)
whose solution is
( ) 1T T T Tλ β λ ββ
− $ %& '= + + −( )* +
, -. /
Dx U U R R U y R Z (10)
and T stands for transpose. The second line in Eq. (8) is equivalent to
2
*min
2
F
ββ
+ − +Z
DZ Rx Z . (11)
All matrices involved in Eq. (11) are complex-valued. One can extend Theorem 2.1 in [2] to complex-valued matrices without too much difficulty and obtain the solution of Eq. (11) as follows
1Sβ β" #
← +% &' (
DZ Rx , (12)
where S is a soft singular value thresholding operator on a matrix [2], leading to low rank enforcement on a matrix. For example, for a matrix X with singular value decomposition =X PΣQ , where 1, ,diag({ } )j j Jσ ==Σ L
is a diagonal matrix, the soft singular value thresholding operator ( )Sη X means 1, ,diag({( - ) } )j j Jσ η + =# $= % &Z P QL
where ( )t + denotes the positive part of t , namely, ( ) max (0, )t t+ = [2]. The third line ( )τ← + −D D Rx Z (13) in Eq. (8) is a simple update on the dual variable D . Altogether, we get the ADMM solver as shown in Table 1. If the step size 0 1.618τ β< < , this algorithm in Eq. (8), solving Eq.(3), converges.

!
Table S1. Algorithm for ADMM
Initialization: Input y , R , U , λ , 1β = , step size τ β= and tolerance of solution in iterations 810η −= . Initialize the dual variable =D 1 and initial solutions T=x U y , last =x x , 310Δ =x .
Main: While ηΔ ≥x
1) Given Z , D , update x by solving Eq.(10); 2) Fix x and D , update Z by using Eq.(12); 3) Update D according to Eq. (13);
4) Compute last
last
−Δ =
x xx
x.
Output: x and the reconstructed spectrum is obtained by performing Fourier transform on x .
!
Illustration of the Low Rank FID property
on the simulated data
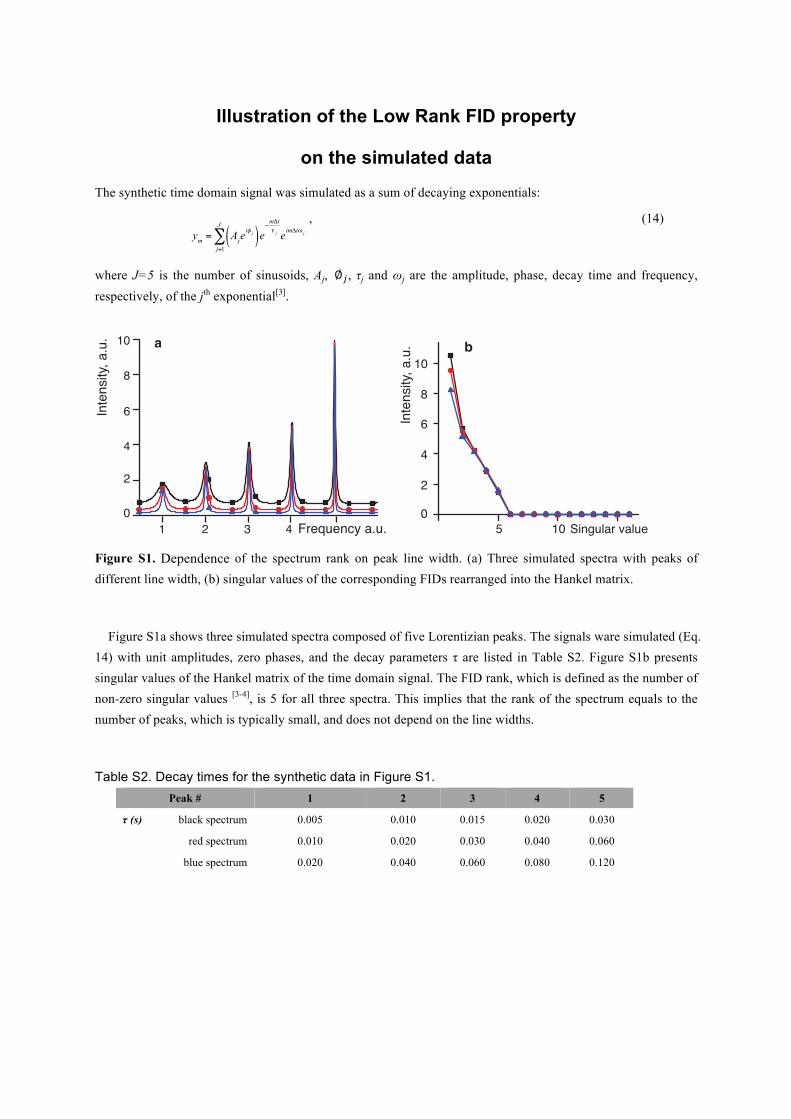
The synthetic time domain signal was simulated as a sum of decaying exponentials:
ym = Ajeiφ j( )e
−mΔtτ j eimΔtω j
j=1
J
∑, (14)
where J=5 is the number of sinusoids, Aj, ∅!, τj and ωj are the amplitude, phase, decay time and frequency, respectively, of the jth exponential[3].
Figure S1. Dependence of the spectrum rank on peak line width. (a) Three simulated spectra with peaks of different line width, (b) singular values of the corresponding FIDs rearranged into the Hankel matrix.
Figure S1a shows three simulated spectra composed of five Lorentizian peaks. The signals ware simulated (Eq.
14) with unit amplitudes, zero phases, and the decay parameters τ are listed in Table S2. Figure S1b presents singular values of the Hankel matrix of the time domain signal. The FID rank, which is defined as the number of non-zero singular values [3-4], is 5 for all three spectra. This implies that the rank of the spectrum equals to the number of peaks, which is typically small, and does not depend on the line widths.
Table S2. Decay times for the synthetic data in Figure S1.
Peak # 1 2 3 4 5
τ (s) black spectrum 0.005 0.010 0.015 0.020 0.030
red spectrum 0.010 0.020 0.030 0.040 0.060
blue spectrum 0.020 0.040 0.060 0.080 0.120
0
2
4
6
8
Inte
nsity
, a.u
. 10
1 2 3 4 Frequency a.u.0
2
4
6
8In
tens
ity, a
.u.
10
5 10 Singular value
a b

!
Low Rank reconstruction of 2D NOESY spectrum of ubiquitin
Figure S2. 2D NOESY spectrum of 1 mM ubiquitin, measured at 25o C, 500MHz Varian UNITY Inova equipped with a room temperature probe. A. Region of the fully samples reference spectrum acquired with 300 complex points in the indirect spectral dimension. B. The LR reconstruction of the same region from 150 non-uniformly sampled complex points. The first contour level is set 1.4 times higher than in the reference spectrum in order to compensate for the expected increase of the noise level due to the reduced measurement time of the NUS experiment. C. 1D slices from the reference (green) and Low Rank (blue) spectra are taken at the position indicated by the red dashed line in panel B. E-F. Correlations of the cross-peak intensities in the Low Rank (abscissa) and reference (ordinate) spectra, correlation coefficient equals to 1.0, 0.999 and 0.983 respectively. Values of the peak intensities are given in units of noise in the reference spectrum scaled up by 1.4 to compensate for the reduced time of the NUS experiment.
Experimental Section
300 µM 15N-13C labeled sample of cytosolic CD79b in 20 mM sodium phosphate buffer, pH 6.7 was prepared as described previously [5]. Fully sampled 2D 1H-15N HSQC with 256 complex points in the 15N dimension
A
7.07.5
1 2
1
2
x103
x103
1 2 3 x101
1
2
3
x1011 2
1
2
x102
x102
D
E
F
C
7.07.5
B0
1
2
3
4
5
6
7
8
9
!
(143.5 ms acquisition time) was acquired at 55 °C on 800 MHz Bruker AVANCE III HD spectrometer equipped with 3 mm CPTCI cryoprobe. The directly detected dimension of the amide region of the full reference 2D spectrum (8.75-7.85 1H ppm) was processed using NMRPipe software[6] and imported in MATLAB for consecutive reconstruction by the LR and CS VE-IRLS[7] methods. The 35% sparse non-uniform Poisson-gap sampling table was produced according to reference[8].
Calculations
The LR reconstruction on the synthetic data and experimental spectra were performed using the algorithm described above with the Lagrangian multiplier λ=103. The results of the calculations are not sensitive to the setting of λ. The LR calculations we performed in Matlab (MathWorks Inc) on a laptop computer with 2 Cores 2.6 GHz CPU and 12 GB RAM. The computational time for reconstruction of the 2D HSQC and NOESY spectra were about one minute. All the CS reconstructions were performed using the iterative re-weighted least squares (IRLS) algorithm and the virtual-echo signal pre-processing[7]. In all cases, the NUS was performed according to a Poisson distribution[8].
References: [1] S. Boyd, N. Parikh, E. Chu, B. Peleato, J. Eckstein, 2011, 3, 1-122. [2] J. Cai, E. Candès, Z. Shen, 2010, 20, 1956-1982. [3] J. C. Hoch, A. S. Stern, NMR data processing, Wiley-Liss, 1996. [4] P. Koehl, Prog. Nucl. Magn. Reson. Spectrosc . 1999, 34, 257-299. [5] L. Isaksson, M. Mayzel, M. Saline, A. Pedersen, J. Rosenlöw, B. Brutscher, B. G. Karlsson, V. Y. Orekhov,
PLoS ONE 2013, 8, e62947. [6] F. Delaglio, S. Grzesiek, G. W. Vuister, G. Zhu, J. Pfeifer, A. Bax, J. Biomol. NMR 1995, 6, 277-293. [7] aM. Mayzel, K. Kazimierczuk, V. Y. Orekhov, Chem Comm 2014, 50, 8947-8950; bK. Kazimierczuk, V. Y.
Orekhov, J. Magn. Reson. 2012, 223, 1-10. [8] S. G. Hyberts, K. Takeuchi, G. Wagner, J. Am. Chem. Soc. 2010, 132, 2145-2147.