communicable diseases intelligence - department of health · of acute hepatitis b, australia, 1997...
TRANSCRIPT

Communicable Diseases Intelligence
Volume 40 Supplement April 2016
Department of HealthAustralian Government
Summary of NatioNal SurveillaNce Data oN vacciNe PreveNtable DiSeaSeS iN auStralia, 2008–2011
National Centre for Immunisation Research and Surveillance of Vaccine Preventable Diseases


Summary of NatioNal SurveillaNce Data
oN vacciNe PreveNtable DiSeaSeS iN
auStralia, 2008–2011
This report was prepared at the National Centre for Immunisation
Research and Surveillance of Vaccine Preventable Diseases (NCIRS) by:
Aditi Dey
Stephanie Knox
Han Wang
Frank Beard
Peter McIntyre
University of Sydney Royal Alexandra Hospital for Children
Communicable Diseases Intelligence Australian Government Department of Health
NCIRS is a collaborating unit of the Australian Institute of Health and Welfare

© Commonwealth of Australia 2016
ISSN 1445-4866 Online
This work is copyright. You may download, display, print and reproduce the whole or part of this work in unaltered form for your own personal use or, if you are part of an organisation, for internal use within your organisation, but only if you or your organisation do not use the reproduction for any commercial purpose and retain this copyright notice and all disclaimer notices as part of that reproduction. Apart from rights to use as permitted by the Copyright Act 1968 or allowed by this copyright notice, all other rights are reserved and you are not allowed to reproduce the whole or any part of this work in any way (electronic or otherwise) without first being given the specific written permission from the Commonwealth to do so. Requests and inquiries concerning reproduction and rights are to be sent to the Online, Services and External Relations Branch, Department of Health, GPO Box 9848, Canberra ACT 2601, or by email to [email protected]
Communicable Diseases Intelligence aims to diseminate information on the epidemiology and control of communicable diseases in Australia. Communicable Diseases Intelligence invites contributions dealing with any aspect of communicable disease epidemiology, surveillance or prevention and control in Australia. Submissions can be in the form of original articles, short reports, surveillance summaries, reviews or correspondence. Instructions for authors can be found in Commun Dis Intell 2015;39(1):E185–E189.
Communicable Diseases Intelligence contributes to the work of the Communicable Diseases Network Australia (http://www.health.gov.au/cdna)
EditorMargaret Curran
Deputy EditorKatrina Knope
Associate EditorTimothy Sloan-Gardner
Editorial and Production StaffAlison Milton
Editorial Advisory BoardPeter McIntyre (Chair), David Durrheim, Mark Ferson, John Kaldor, Martyn Kirk
Websitehttp://www.health.gov.au/cdi
ContactsCommunicable Diseases Intelligence is produced every quarter by:Health Protection Policy BranchOffice of Health ProtectionAustralian Government Department of HealthGPO Box 9848, (MDP 6)CANBERRA ACT 2601;Telephone: +61 2 6289 2717Facsimile: +61 2 6289 2700Email: [email protected]
This journal is indexed by Index Medicus and Medline
Front cover photographs: Debra Gradie; Alison Milton
DisclaimerOpinions expressed in Communicable Diseases Intelligence are those of the authors and not necessarily those of the Australian Government Department of Health or the Communicable Diseases Network Australia. Data may be subject to revision.

CDI Vol 40 Supplement 2016 i
Contents
Acknowledgements S1
Overview S2
Comment S3
Introduction S4
Methods S5
Notifications S6
Hospitalisations S6
Deaths S7
Calculations S7
Notes on interpreting data S7
Vaccine preventable diseases S9
3.1 Diphtheria S9
3.2 Haemophilus influenzae type b disease S10
3.3 Hepatitis A S13
3.4 Hepatitis B S16
3.5 Influenza S19
3.6 Measles S24
3.7 Meningococcal disease S27
3.8 Mumps S30
3.9 Pertussis S33
3.10 Pneumococcal disease S36
3.11 Poliomyelitis S40
3.12 Q fever S41
3.13 Rotavirus S44
3.14 Rubella S47
3.15 Tetanus S50
3.16 Varicella-zoster virus infection S53
Appendix 1. Charts of historical notification data S57
Appendix 2. Notifications by state or territory S62
Appendix 3. Hospitalisations by state or territory S65
References S67

ii CDI Vol 40 Supplement 2016
List of tables
Table 1: Notifications, hospitalisations and deaths for selected vaccine preventable diseases over 2 periods, Australia, 2005 to 2011 S2
Table 3.2.1: Haemophilus influenzae type b notifications, Haemophilus meningitis hospitalisations and Haemophilus influenzae type b deaths, Australia, 2008 to 2011, by age group S11
Table 3.3.1: Hepatitis A notifications, hospitalisations and deaths, Australia, 2008 to 2011, by age group S14
Table 3.4.1: Hepatitis B notifications, hospitalisations and deaths, Australia, 2008 to 2011, by age group S17
Table 3.5.1: All influenza notifications and notified deaths, Australia, 2008, 2010, 2011 and 2008 to 2011, by age group S20
Table 3.5.2: Influenza (ICD-10-AM codes J10 and J11) hospitalisations Australia, 2008 to 2011, by age group S22
Table 3.5.3: Pandemic influenza (ICD-10-AM code J09) hospitalisations, Australia, 2008 to 2011, by age group S22
Table 3.6.1: Measles notifications, hospitalisations and deaths, Australia, 2008 to 2011, by age group S26
Table 3.7.1: Meningococcal disease notifications, hospitalisations and deaths, Australia, 2008 to 2011, by age group S29
Table 3.8.1: Mumps notifications, hospitalisations and deaths, Australia, 2008 to 2011, by age group S32
Table 3.9.1: Pertussis notifications, hospitalisations and deaths, Australia, 2008 to 2011, by age group S34
Table 3.10.1: Pneumococcal disease notifications, hospitalisations and deaths, Australia, 2008 to 2011, by age group S37
Table 3.12.1: Q fever notifications, hospitalisations and deaths, Australia, 2008 to 2011, by age group S42
Table 3.13.1. Rotavirus hospitalisations and deaths, Australia, 2008 to 2011, by age group S45
Table 3.14.1: Rubella notifications, hospitalisations and deaths, Australia, 2008 to 2011, by age group S48
Table 3.15.1: Tetanus notifications, hospitalisations and deaths, Australia, 2008 to 2011, by age group S51
Table 3.16.1: Varicella hospitalisations and deaths, Australia, 2008 to 2011, by age group S54
Table 3.16.2: Zoster hospitalisations and deaths, Australia, 2008 to 2011, by age group S56
Table A.2. Notifications and notification rates for vaccine preventable diseases, Australia, 1 January 2008 to 31 December 2011, by state or territory and year S62
Table A.3. Hospitalisation rates for vaccine preventable diseases, Australia, 1 January 2008 to 31 December 2011, by state or territory and year S65
CDI Vol 40 Supplement 2016 iii
List of figures
Figure 3.2.1: Haemophilus influenzae type b notifications and Haemophilus meningitis hospitalisations for all ages, Australia, 1993 to 2011, by month of diagnosis or admission S11
Figure 3.3.1: Hepatitis A notifications and hospitalisations, Australia, 1993 to 2011, by month of diagnosis or admission S14
Figure 3.4.1: Hepatitis B notifications and hospitalisations with a principal diagnosis of acute hepatitis B, Australia, 1997 to 2011, by month of diagnosis or admission S17
Figure 3.5.1: Influenza notifications from 2001 to 2011 and influenza hospitalisations from 1993 to 2011, Australia, by month of diagnosis or admission S20
Figure 3.6.1: Measles notifications and hospitalisations, Australia, 1993 to 2011, by month of diagnosis or admission S25
Figure 3.7.1: Meningococcal disease notifications and hospitalisations, Australia, 1993 to 2011, by month of diagnosis or admission S28
Figure 3.8.1: Mumps notifications and hospitalisations, Australia, 1993 to 2011, by month of diagnosis or admissions S31
Figure 3.9.1: Pertussis notifications and hospitalisations, Australia, 1995 to 2011, by month of diagnosis or admission S34
Figure 3.10.1: Pneumococcal disease notifications and hospitalisations, Australia, 1998 to 2011, by month of diagnosis or admission S37
Figure 3.12.1: Q fever notifications and hospitalisations, Australia, 1993 to 2011, by month of diagnosis or admission S42
Figure 3.13.1: Rotavirus hospitalisations for all ages, Australia, 1994 to 2011, by month of admission S45
Figure 3.14.1. Rubella notifications and hospitalisations, Australia, 1993 to 2011, by month of diagnosis or admission S48
Figure 3.15.1: Tetanus notifications and hospitalisations, Australia, 1998 to 2011, by year of diagnosis or admission S51
Figure 3.16.1: Varicella and herpes zoster hospitalisations, Australia, 1993 to 2011, by month of admission S54
Figure A.1: Diphtheria, 1917 to 2011 S57
Figure A.2: Hepatitis A, 1952 to 2011 S57
Figure A.3: Measles, 1917 to 2011 S58
Figure A.4: Meningococcal disease (invasive), 1949 to 2011 S58
Figure A.5: Mumps, 1932 to 2011 S59
Figure A.6: Pertussis, 1917 to 2011 S59
Figure A.7: Poliomyelitis, 1917 to 2011 S60
Figure A.8: Rubella, 1942 to 2011 S60
Figure A.9: Tetanus, 1921 to 2011 S61

CDI Vol 40 Supplement 2016 S1
Summary of national surveillance data on vaccine preventable diseases in Australia, 2008–2011
Acknowledgements
This study was funded by the Australian Government Department of Health.
Hospitalisation data were provided and cleared for publication by the Australian Institute of Health and Welfare.
Notification data from the National Notifiable Diseases Surveillance System were provided by the Office of Health Protection, Australian Government Department of Health.
Thanks to staff at the Office of Health Protection, Australian Government Department of Health for their comments and suggestions for this report.
Mortality data were obtained from the Australian Bureau of Statistics.
Thanks to Donna Armstrong for editing the report and to Catherine King and Edward Jacyna for literature searches and library support.

S2 CDI Vol 40 Supplement 2016
Summary of national surveillance data on vaccine preventable diseases in Australia, 2008–2011
Overview
This summary report on vaccine preventable diseases in Australia brings together the 3 most important national sources of routinely collected data on vaccine preventable diseases (notifications, hospitalisations and deaths) for all age groups for the period January 2008 to December 2011. The general trend towards improved control of disease is evident, particularly in the childhood years. Detailed results are available in 16 individual chapters.
Notifications, hospitalisations and deaths for selected diseases are summarised in Table 1. Although these data have limitations, which are discussed in detail in the body of the report, some clear trends are evident. Compared with the previous review period (2005–2007), there are continuing declines in the overall disease burden, driven by improving control of mumps, rubella, hepatitis B and meningococcal disease. There is an ongoing absence of disease due to polio and a continuing low incidence of tetanus. There have been con-tinuing declines in the incidence of hepatitis A and B. However, there were 4 notified cases of diphtheria in 2011; prior to these reports there had been no notified diphtheria cases since 2001. Influenza and pertussis notifications have increased, whereas notifications and hospitalisations for mumps have remained stable and for meningococcal disease have declined. Influenza, pertussis and pneumococcal disease continue to contribute the greatest burden of serious disease.
Table 1: Notifications, hospitalisations and deaths for selected vaccine preventable diseases over 2 periods, Australia, 2005 to 2011*
Disease
Notifications Hospitalisations Notified deaths
Average annual rate
(per 100,000) 2006–2007
Average annual rate
(per 100,000) 2008–2011
Average annual rate
(per 100,000) July 2005–June 2007
Average annual rate
(per 100,000) Jan 2008–Dec 2011
Average annual rate
(per 100,000) 2006–2007
Average annual rate
(per 100,000) 2008–2011
Hepatitis B 1.4 1.1 0.8 0.6 0.01 0.002Influenza† 32.7 124.7 (76.0)‡ 10.8 20.2 0.06 0.23 (0.12)‡
Measles 0.3 0.5 0.1 0.2 – –Meningococcal disease 1.5 1.2 2.5 1.7 0.05 0.05Mumps 2.1 0.8 0.3 0.4 – –Pertussis 39.1 140.3 2.1 6.2 – 0.01Pneumococcal disease§ 7.0 7.7 3.5 3.7 0.59 0.55Rubella 0.2 0.2 <0.05 <0.05 0.002 –Tetanus <0.05 <0.05 0.1 0.1 0.002 0.002
* Data from the former period (2005–2007) have been reported in the fifth vaccine preventable diseases report.1 Data from the later period (2008–2011) are reported in this current report. Notified deaths have been sourced from the National Notifiable Diseases Surveillance System.
† The limitations of notification systems and coding for influenza hospitalisations and deaths limit the representativeness of these data, which grossly underestimate the disease burden due to influenza.
‡ Influenza rate for non-pandemic years 2008, 2010, 2011.
§ Pneumococcal hospitalisations and deaths include septicaemia and meningitis only.

CDI Vol 40 Supplement 2016 S3
Summary of national surveillance data on vaccine preventable diseases in Australia, 2008–2011
Comment
The years 2008 to 2011 have been a period of continuing gains in the control of vaccine preventable dis-eases, particularly due to changes to the implementation of vaccination programs. The introduction and implementation in 2004 of new national case definitions for diseases notified to the National Notifiable Diseases Surveillance System (NNDSS) was an important step in improving the consistency of notifica-tions reported by different jurisdictions. There are continuing efforts towards improving consistency and completeness of reporting of variables. These improvements in the NNDSS mean that it now provides the most accurate measure of total diagnosed cases and deaths caused by many VPDs in Australia. However, data on hospitalisations for many VPDs are still better captured in coded hospitalisation data.
Pertussis is currently the most commonly reported VPD in Australia. Increased laboratory testing of suspected cases of pertussis, particularly among children, partly explains the increase in notifications in children <10 years of age seen in the period 2008 to 2011. There was also a significant pertussis epidemic, commencing in 2008–09 and continuing to 2011, with timing varying by region. The epidemic was also associated with a substantial increase in the hospitalisations of young infants due to pertussis, and renewed focus on measures to prevent pertussis in this most vulnerable age group.
The 2nd most common VPD reported in Australia was influenza, with the current reporting period includ-ing the pandemic year of 2009. It is likely that there was increased testing and reporting of influenza in the pandemic year and beyond. There are limitations to the notification data , including differences across jurisdictions that are likely related in part to varying testing and coding practices but which may also reflect true regional differences. During the influenza pandemic of 2009, young adults experienced substantially more morbidity and mortality compared with non-pandemic influenza seasons.
Diphtheria is a rare disease, but the risk of importation remains. This was highlighted by the first death in more than 20 years in 2011. The death occurred in an unvaccinated person who had close contact with the partially vaccinated index case who contracted diphtheria in Papua New Guinea.
Measles, mumps and rubella incidence has remained very low, with no deaths notified for these diseases in the current reporting period. The evidence indicates that endemic measles was eliminated in Australia in at least 2005, with no circulating endemic strains of the measles virus during this reporting period. The epidemiology of rubella also indicates that Australia may be in a position to achieve rubella elimination status in the near future. Mumps has also declined considerably since the introduction of the vaccine in 1981. However, there is greater susceptibility to mumps in young adults who were born when exposure to wild type virus was decreasing but before good levels of vaccine coverage were achieved.

S4 CDI Vol 40 Supplement 2016
Summary of national surveillance data on vaccine preventable diseases in Australia, 2008–2011
1. Introduction
The National Centre for Immunisation Research and Surveillance of Vaccine Preventable Diseases has published a series of 5 comprehensive reports on vaccine preventable diseases (VPDs) and vaccination coverage in Australia every 2–3 years since 2000. These reports (the ‘VPD reports’) have been published as supplement issues of Communicable Diseases Intelligence. They serve as a national resource for supporting and informing the surveillance and control of VPDs in Australia, particularly those for which there is a national vaccination program. The series of VPD reports has several unique features that value-add to other reports of national communicable disease surveillance data in Australia.
A revised summary format of national surveillance data on VPDs in Australia is presented in this report. In addition to this summary VPD report, a rolling series of independent peer-reviewed articles, each covering trends over time in the epidemiology of a specific VPD, or a group of related VPDs, will be published. The first of these epidemiological reviews covered pertussis,2 measles,3 mumps4 and rubella.5 The reasons for the change to this revised format of routine reporting of VPD surveillance data in Australia are 1) difficulties in identifying disease-specific chapters as key source articles for the epidemiology of a VPD in Australia, partly due to limitations in assigning index terms in bibliographic databases (e.g. MEDLINE) to individual chapters, and 2) limited citations of the previous reports.

CDI Vol 40 Supplement 2016 S5
Summary of national surveillance data on vaccine preventable diseases in Australia, 2008–2011
2. Methods
Three main sources of routinely collected data on VPDs in Australia were used for this report. Disease notification data were obtained from the Office of Health Protection’s National Notifiable Diseases Surveillance System (NNDSS); hospitalisation data were sourced from the Australian Institute of Health and Welfare (AIHW) National Hospital Morbidity Database; and death data were obtained from the Australian Bureau of Statistics (ABS) Causes of Death database, the NNDSS and the AIHW National Hospital Morbidity Database.
The most recent analysis of VPDs surveillance data and vaccination coverage focusing on Indigenous Australians is reported in the report Vaccine preventable diseases and vaccination coverage in Aboriginal and Torres Strait Islander people, Australia, 2006–2010.6 Indigenous data from this report have been extracted and referenced in the current report.
A summary of the significant events in vaccination practice in Australia is available from the National Centre for Immunisation Research and Surveillance of Vaccine Preventable Diseases vaccination history tables (http://www.ncirs.edu.au/immunisation/history/index.php).

S6 CDI Vol 40 Supplement 2016
Summary of national surveillance data on vaccine preventable diseases in Australia, 2008–2011
Notifications
The NNDSS was established in its current form in 1991 and includes de-identified information on cases of VPDs reported by state and territory authorities in Australia. Each of the 8 state and territory health departments collects notifications of communicable diseases under their respective public health legisla-tion. Data quality of the NNDSS is continually monitored by the Office of Health Protection within the Australian Government Department of Health, and by the National Surveillance Committee, a jurisdic-tional committee consisting of surveillance and data managers. There is a continual process of reviewing the national consistency of communicable disease surveillance on a daily, fortnightly and quarterly basis. Historically, state and territory notification criteria were based on the 1994 National Health and Medical Research Council surveillance case definitions.7 In September 2003, a new set of national case definitions for notifiable diseases reported to the NNDSS was endorsed by the Communicable Diseases Network Australia,8 with nearly all jurisdictions implementing the new definitions in January 2004 (New South Wales commenced in August 2004).
Information on case definitions for vaccine preventable diseases (www.health.gov.au/casedefinitions) is available on the Australian Government Department of Health web site.
The data collected by the NNDSS are frequently updated by jurisdictions. For this report, data extracted from the NNDSS (November 2013) were examined. Data were checked and cleaned. Where apparent errors were detected through consultation with appropriate surveillance staff in states and territories. Disease notification data for cases with a date of diagnosis between 1 January 2008 and 31 December 2011 are included in this report. It should be noted that historical notification data included in this report have been updated from previous reports and used for trend analysis and comparison purposes.
In this report, notification data are presented by the ‘date of diagnosis’. Previous reports on data prior to 2005 analysed notification data by date of onset (if the date of onset from the clinical history was collected and available), or the specimen collection date for laboratory-confirmed cases. For each notification record, a date of diagnosis is derived from the date of onset, or, where that is not supplied, the earliest date recorded among these fields: date of specimen, date of notification, or date when the notification was received (the only mandatory date field). This algorithm applies to all diseases collected by the NNDSS except for hepa-titis B, unspecified and hepatitis C, unspecified, leprosy and syphilis >2 years (not included in this report), where the onset date would not contribute to assigning the date of diagnosis. The variables extracted for analysis for every VPD in this report were: the date of diagnosis, age at onset, sex, and state or territory of residence.
Hospitalisations
Hospitalisation data from the AIHW National Hospital Morbidity Database have been analysed by calen-dar years in this report for the period 1 January 2008 to 31 December 2011. For trend analysis, this report presents some previously analysed historical data for years prior to this reporting period.1, 9–12
Hospitalisation data for this reporting period are defined by the date of admission of a hospitalisation episode and analyses by variables such as age and sex are grouped by the calendar year within which the hospital admission occurred.
Data for each reported disease were extracted based on the International Statistical Classification of Diseases and Related Health Problems, 10th Revision, Australian Modification (ICD-10-AM). Eligible records of hospital separations include those with the code(s) of interest listed as the principal diagnosis (the diagnosis recorded as chiefly responsible for the hospitalisation) or as any other diagnosis for that episode of hospitalisation. The proportion of hospital separations where the disease of interest has been coded as the principal diagnosis is reported for each disease. For hepatitis B disease, only hospitalisations with acute hepatitis B coded as the principal diagnosis are included, consistent with the approach taken in previous reports.
The variables extracted for analysis included: month of admission, age on admission, sex, state or territory of residence, length of stay, and diagnosis (principal and other diagnoses) coded using the relevant edition of ICD-10-AM for the collection period.

CDI Vol 40 Supplement 2016 S7
Summary of national surveillance data on vaccine preventable diseases in Australia, 2008–2011
Deaths
Death data were obtained from the ABS Causes of Death database. These data are supplied annually to the ABS from the Registrars of Births, Deaths and Marriages in each state and territory. Deaths include those in Australian waters as well as on Australian soil, whereas death data published by the ABS exclude deaths in Australian waters. Since 1997, ICD-10 has been used to identify the cause of death. Although multiple causes of death have been recorded since 1997, this report only analyses records in which the disease of interest is recorded as the underlying cause of death, consistent with previous reports. Deaths analysed in this report are the deaths registered in the calendar years of 2008 to 2011 (not necessarily the year in which the death occurred). The variables included were underlying cause of death, age, year death was reported, sex, and state or territory in which the death was recorded.
The ‘died’ field in the NNDSS, recording where a case died of the notifiable condition, was also analysed for this report.
Similarly, in the hospitalisation data obtained from the AIHW National Hospital Morbidity Database, the mode of separation (whether death was the outcome of that hospitalisation episode) was also analysed. Hospitalisation episodes with fatal outcome are reported as supplementary information for specified dis-eases in this report.
Calculations
All rates were calculated using the mid-year estimated resident populations released by the ABS as the population denominator. Rates are presented as annual rates or average annual rates per 100,000 total population, or population in age, sex or geographical subgroups, as appropriate. The reported rate esti-mates for the populations not stratified by age groups (i.e. all ages together) are crude rates that have not been age-standardised.
For notification, hospitalisation and death data, the mid-year population estimates for the corresponding calendar year were used as the denominator population. Averages were calculated for rates of notifications and hospitalisations and for bed-days of hospitalisation episodes per year. The median (rather than aver-age) and range were used to describe the distribution of notifications and hospitalisations per month, and the length of stay per hospitalisation episode, as these data are not normally distributed.
Changes in case definitions13 and significant events in vaccination practice14 in Australia were taken into consideration for this report.
Notes on interpreting data
Comparison between the notification, hospitalisation and death data should be made with caution since these datasets differ in their purpose for data collection, reporting mechanisms, accuracy, timeliness and period of reporting.
The rates presented in this report are crude rates and may be confounded by differences in the population (e.g. ethnicity and population density) between jurisdictions.
Notification data
A major limitation of the notification data is that they represent only a proportion of all the cases occurring in the community, due to under-reporting. This proportion may vary between diseases, over time, and across jurisdictions. An infectious disease that is diagnosed by a laboratory test is more likely to be notified than if diagnosed only on clinical grounds. Changes in screening programs including the preferential testing of high risk populations; the use of less invasive and more sensitive diagnostic tests; and periodic awareness campaigns, may influence the number of notifications over time. Data accuracy may also vary among jurisdictions due to the use of different case definitions for surveillance (prior to adoption of the national case definitions) and varying reporting requirements and mechanisms by medical practitioners, hospitals and laboratories.

S8 CDI Vol 40 Supplement 2016
Summary of national surveillance data on vaccine preventable diseases in Australia, 2008–2011
Hospitalisation data
The AIHW publishes regular overviews of Australian hospitalisation statistics, including details of the number of hospitals reporting and any documented data problems. The AIHW performs logical valida-tions on the ICD-10-AM coded data; for example, for sex- and age-specific diagnoses. Coding audits and coding quality improvement activities are variously performed at hospital level and/or state or territory level. Some variation in hospital access, admission practices and record coding may occur between regions and over time and this may impact upon the use of hospitalisation data for monitoring disease trends over time and between jurisdictions.
There are also limitations associated with the use of ICD codes to identify cases. Errors that cause the ICD code to differ from the true disease include both random and systematic measurement errors. For a few rare diseases, such as acute poliomyelitis, tetanus and diphtheria, some of the hospitalisation episodes or deaths that have been coded as being due to these diseases are likely to be coding errors. This could be related to inaccurate documentation, as suggested by the short lengths of stay of the hospitalisation episodes and the lack of notification of that disease to public health authorities.
The ICD codes for diagnosis chosen for analysis of a disease should accurately reflect the condition of interest. For some diseases, such as Haemophilus influenzae type b (Hib) infection, both the previously used ICD-9-CM and current ICD-10-AM codes lack specificity. This is in contrast to the more stringent case definitions used for notification data. For each disease in this report, the ICD code(s) that have been selected to constitute the indicator for hospitalisation due to the disease are listed on the first page of each disease chapter.
It must be noted that in the AIHW hospitalisation database, there is 1 record for each hospital admission episode. This means that there will be separate records for each re-admission or inter-hospital transfer. This is unlikely to have a major impact on the numbers reported for most of the diseases reviewed in this report, as they are mostly acute diseases. It should also be noted that it is difficult to gauge the relative importance of hospitalisations where the coded disease of interest was not the principal diagnosis but was recorded as an additional or secondary diagnosis for that hospitalisation episode.
Hospitalisations represent the more severe end of the morbidity spectrum of a disease, and the extent to which ICD-coded hospitalisation data can reflect the burden of the disease of interest varies by disease.
Death data
Mortality data are reported and analysed by the year of registration rather than by year of death. This avoids problems associated with incomplete data for the latest available year. In this report, only the death records in which the disease of interest was recorded as the underlying cause of death (i.e. the single disease that initiated the train of morbid events leading directly to death) are reported. Hence, deaths where the disease of interest was a contributing cause of death are not included. The extent of underestimation due to this limitation varies by disease. ABS has restrictions on release of data that may potentially identify cases and applies to release of death data in this report. Deaths of less than 5 are reported as a range from 1–4 rather than the actual number.
The problems associated with the accuracy of ICD coding used for hospital separations, discussed above, may also be relevant for mortality data. Limitations for deaths obtained from the NNDSS include dif-ferences in follow-up between conditions, and often between jurisdictions, which could impact on the capacity to identify deaths.

CDI Vol 40 Supplement 2016 S9
Summary of national surveillance data on vaccine preventable diseases in Australia, 2008–2011
3. Vaccine preventable diseases
3.1 Diphtheria
HighlightsIn 2011, there were 4 notifications of diphtheria, including 1 death. There were no notified cases in the previous decade.
Diphtheria is a disease usually caused by the bacterium Corynebacterium diphtheriae. Infection remains localised to the throat or skin but disease is mainly due to local inflammation and/or systemic toxaemia. Pharyngeal diphtheria presents with a membranous inflammation of the upper respiratory tract, which can be extensive and cause laryngeal obstruction. Damage to other organs including the myocardium, nervous system and kidneys, caused by the organism’s exotoxin, may complicate pharyngeal or cutaneous diphtheria.15,16 Non-toxigenic C. diphtheriae usually causes mild throat or skin infection, which is occa-sionally complicated by invasive disease including endocarditis or arthritis. Corynebacterium ulcerans, a bacterium found in cattle and more recently in cats, can also express diphtheria toxin and cause a zoonotic infection in humans that is similar to diphtheria.17–20
Case definition
Notifications21
From January 2004 to December 2011, a confirmed case required isolation of toxigenic C. diphtheriae or toxigenic C. ulcerans. For a probable case, clinical evidence (pharyngitis and/or laryngitis [with or without membrane] or toxic [cardiac or neurological] symptoms) and either laboratory suggestive evi-dence (isolation of C. diphtheriae or C. ulcerans, toxin production unknown) or an epidemiological link to a confirmed case are required.
Notifications prior to 2004 required isolation of toxigenic C. diphtheriae and one of either pharyngitis and/or laryngitis (with or without membrane), or toxic symptoms.
Hospitalisations and deathsThe ICD-10-AM/ICD-10 code A36 (Diphtheria) was used to identify hospitalisations and deaths.
Severe morbidity and mortality
There were 4 notified cases of diphtheria during this reporting period, all notified in 2011. A cluster of 3 pharyngeal cases were diagnosed in Queensland, where the index case had recently returned from Papua New Guinea. One of these cases died, while the others (including the index case) were asymptomatic carriers.22,23 The 4th case notified during this period acquired cutaneous diphtheria in Indonesia and was diagnosed in the Northern Territory.23 Prior to these reports, there had been no notified cases since 2001 and very low notification rates prior to that (Appendix 1, Figure A.1).
In the 4 years from January 2008 to December 2011, there were 76 hospital admissions recorded as being due to diphtheria, an average annual rate of 0.09 per 100,000 population. Diphtheria was the principal diagnosis for 5 (7%) of these. The Northern Territory accounted for 42% of hospitalisations at an annual rate of 3.5 per 100,000 population.
In 2011, there was 1 recorded death in hospital with diphtheria as the principal diagnosis, of a young adult female (aged 15–24 years). The ABS Causes of Death database and the NNDSS also recorded this case as the only death.
Comment
Diphtheria is a very rare disease in Australia, although the risk of importation remains. The only notified death reported in 2011 was of an unvaccinated person who had close contact with a presumed index case recently returned from an endemic country. The hospitalised case reported from the Northern Territory reflect the non-toxigenic types endemic to this region.1

S10 CDI Vol 40 Supplement 2016
Summary of national surveillance data on vaccine preventable diseases in Australia, 2008–2011
3.2 Haemophilus influenzae type b disease
HighlightsNotifications for invasive Haemophilus influenzae type b (Hib) disease and hospitalisations for Haemophilus meningitis remained low for the period January 2008 to December 2011.
Infants aged <1 year had the highest notification rate and accounted for 26% of invasive Hib notifications for the reporting period, although this rate remains low relative to that of the pre-vaccine era.
Haemophilus influenzae is a Gram-negative bacterium,, which occurs in both encapsulated and unen-capsulated forms. It is a commensal of the nasopharynx, especially in young children. Based on their capsular polysaccharide, H. influenzae bacteria can be further characterised into 6 serotypes designated by the letters a to f. H. influenzae type b, or Hib, has most often been associated with invasive disease. Before Hib vaccines became available, Hib was recognised as the most serious bacterial infection in young children in Australia.24 During this pre-vaccine period, Hib caused at least 95% of invasive disease due to H. influenzae in children, and up to 70% of bacterial meningitis in children in Australia was estimated to be attributable to Hib.25,26 Worldwide, 90% of cases of Hib occur in children <5 years of age.27 Before Hib vaccine was introduced in Australia, infants <18 months of age were most at risk.25,28 Aboriginal and Torres Strait Islander children had a particularly elevated risk of Hib meningitis, with rates among the highest recorded anywhere in the world and a significantly younger age of onset than for non-Indigenous children.26 Before the introduction of Hib vaccination, the most common manifestations of invasive Hib disease were meningitis and epiglottitis.28,29 Epiglottitis was most often seen in children >18 months of age and was not common among Indigenous children.25,30 Survivors of Hib meningitis commonly have neurological sequelae such as deafness and intellectual impairment. Other manifestations of Hib disease include cellulitis, septic arthritis, pneumonia, pericarditis, osteomyelitis and septicaemia.28
Case definition
Notifications31
Prior to 2004, the national case definition for invasive Hib disease included clinical evidence. The cur-rent definition requires laboratory definitive evidence and only confirmed cases are notified. Laboratory definitive evidence includes isolation or detection of Hib type b from a normally sterile site, where typing has been confirmed at a jurisdictional or regional reference laboratory.
Hospitalisations and deathsThere are no ICD-10-AM/ICD-10 codes that specify Hib as a causative organism. The ICD-10-AM/ICD-10 code used to identify presumed Hib cases was G00.0 (Haemophilus meningitis). The ICD-10-AM/ICD-10 codes for H. influenzae pneumonia, H. influenzae septicaemia, H. influenzae infection and acute epiglottitis were not included as these have been shown to be lacking in specificity for invasive H. influenzae type b disease.
Secular trends
Notifications for invasive Hib disease and hospitalisations for Haemophilus meningitis remained low for the period January 2008 to December 2011 (Figure 3.2.1). During the 4 years from January 2008 to December 2011, a total of 81 invasive Hib infections were notified. The average annual notification rate was 0.09 per 100,000 population (Table 3.2.1). A median of 1 case (range 0–6) was notified per month (Figure 3.2.1). This was the same reporting rate observed for the previous review period (January 2006 to December 2007).1
There were 109 hospitalisations (average annual rate 0.12 per 100,000) recorded as Haemophilus meningitis (Table 3.2.1), with a median of 2 cases (range 0–7) hospitalised per month (Figure 3.2.1). The hospi-talisation rate was twice that observed for the previous review period (July 2005 to June 2007), which was 0.06 per 100,000 population.1

CDI Vol 40 Supplement 2016 S11
Summary of national surveillance data on vaccine preventable diseases in Australia, 2008–2011
Figure 3.2.1: Haemophilus influenzae type b notifications and Haemophilus meningitis hospitalisations for all ages, Australia, 1993 to 2011,* by month of diagnosis or admission
0
10
20
30
40
50
60
Jan1993
Jan1994
Jan1995
Jan1996
Jan1997
Jan1998
Jan1999
Jan2000
Jan2001
Jan2002
Jan2003
Jan2004
Jan2005
Jan2006
Jan2007
Jan2008
Jan2009
Jan2010
Jan2011
Num
ber
Month of diagnosis or admission
Invasive Haemophilus influenzae disease notifications
Haemophilus meningitis hospitalisations
* Notifications where the month of diagnosis was between January 1993 and December 2011; hospitalisations where the month of admission was between July 1993 and December 2011.
Table 3.2.1: Haemophilus influenzae type b notifications, Haemophilus meningitis hospitalisations and Haemophilus influenzae type b deaths, Australia, 2008 to 2011,* by age group
Age group (years)
Haemophilus influenzae type b
notifications
Haemophilus meningitis hospitalisations LOS† per admission Haemophilus
influenzae type b deaths‡Any diagnosis
Principal diagnosis
Any diagnosis
Principal diagnosis
n Rate§ n Rate§ n Rate§ Median days n Rate§
<1 21 1.79 32 2.73 27 2.30 9.5 9.0 0 –1–4 9 0.20 13 0.29 12 0.26 5.0 5.0 1 0.025–14 7 0.06 12 0.11 10 0.09 3.5 1.0 0 –15–24 4 0.03 4 0.03 3 0.02 15.5 15.0 0 –25–49 17 0.05 12 0.04 8 0.03 9.5 9.5 0 –50–64 11 0.07 20 0.13 15 0.10 12.0 10.0 1 0.01≥65 12 0.10 16 0.14 13 0.11 12.0 12.0 0 –All ages 81 0.09 109 0.12 88 0.10 10.0 9.0 2 0.02
* Notifications where the month of diagnosis was between January 2008 and December 2011; hospitalisations where the month of admission was between January 2008 and December 2011.
† LOS = length of stay in hospital.
‡ Deaths sourced from the National Notifiable Diseases Surveillance System.
§ Average annual age-specific rate per 100,000 population.

S12 CDI Vol 40 Supplement 2016
Summary of national surveillance data on vaccine preventable diseases in Australia, 2008–2011
Severe morbidity and mortality
Notifications of invasive Hib disease and hospitalisations for Haemophilus meningitis were highest for infants < 1 year of age (Table 3.2.1) who accounted for 21/81 (26%) invasive Hib notifications at a rate of 1.8 per 100,000 population, and 32/109 (29%) hospitalisations at a rate of 2.7 per 100,000 population.
Over the 4-year reporting period the total number of hospital bed days recorded for all patients with Haemophilus meningitis was 1,352 (average 338 bed days per year) with a median length of stay of 10 days per hospitalisation.
There were 2 reported deaths among the 81 Hib cases reported to the NNDSS in the 4 years from January 2008 to December 2011 (Table 3.2.1). There were no deaths with Haemophilus meningitis stated as the underlying cause recorded on the ABS Causes of Death database for the 4-year reporting period.
Age and sex distribution
There were more notifications for invasive Hib disease for males than females with an average male:female ratio of 1.8:1 over the 4 years from January 2008 to December 2011. Although overall a larger proportion of hospital admissions for Haemophilus meningitis was for males (57%), the male:female ratio was not consistent across the 4 years; males accounted for 42% of hospitalisations for Haemophilus meningitis in 2009 and 64% of hospitalisations in 2011.
Since the introduction of the Hib vaccine in Australia in 1993, invasive Hib disease in children aged 0–4 years has fallen dramatically with the steepest decline in rates between 1993 and 1995 (Figure 3.2.1). In the 4 years from January 2008 to December 2011, the rate of notifications in children 0–4 years of age remained low relative to earlier time periods. The annual average notification rate for children 0–4 years of age in the 4-year reporting period was 0.5 per 100,000 population compared with 0.7 for the previous 4 years (January 2004 to December 2007).
Geographical distribution
Of the notifications for invasive Hib disease over the 4-year reporting period, 60% occurred in New South Wales (30.9%) and Queensland (29.6%). Similarly, nearly two-thirds of hospital admissions for Haemophilus meningitis occurred in New South Wales (30.3%) and Queensland (32.1%) over the 4-year period. Relative to its small population, the Northern Territory accounted for an appreciable proportion of notifications for invasive Hib disease (7.4%) and hospitalisations for Haemophilus meningitis (6.4%). The Northern Territory had the highest rate of notifications (0.7 per 100,000 population) and hospitalisations (0.8 per 100,000 population) compared with the national averages of 0.12 per 100,000 and 0.09 per 100,000, respectively (Appendix 2, Appendix 3). Hib notification rates were higher for Aboriginal and Torres Strait Islander people than for other people across all age groups.6
Vaccination status
Vaccination status in the NNDSS was evaluated for all notified cases born after 31 December 1987: the cohort eligible to receive the Hib vaccine. Of all vaccine-eligible cases, 25% were fully vaccinated, 17.5% partially vaccinated and 12.5% not vaccinated; vaccination status was missing or unknown for 45%. A male child in the 1–4 years age group who died in 2008 was recorded in the NNDSS as being partially vaccinated for age.
Comment
Notification rates for invasive Hib disease and hospitalisation rates for Haemophilus meningitis remained low during this reporting period. The 2 deaths notified to the NNDSS (1 each in 2008 and 2010) were in non-Indigenous males; however, there were no deaths with Haemophilus meningitis as the underlying cause recorded on the ABS Causes of Death database for the 4 years 2008 to 2011. Deaths notified in the NNDSS should be more reliably attributable to invasive Hib disease due to greater specificity in notifica-tions, which are directly linked to laboratory reports.
CDI Vol 40 Supplement 2016 S13
Summary of national surveillance data on vaccine preventable diseases in Australia, 2008–2011
3.3 Hepatitis A
HighlightsThe average annual notification rate for hepatitis A remained low over the 4 years from January 2008 to December 2011.
There were peaks in notifications for hepatitis A in April and October 2009 related to outbreaks in several states and territories, particularly Victoria.
Hepatitis A is caused by the hepatitis A virus (HAV), an RNA virus classified within the genus hepatovirus of the picornavirus family. There is only 1 human HAV serotype.1–4 Hepatitis A is an acute inflammatory disease of the liver and can produce either asymptomatic or symptomatic infection. Clinical manifestations of symptomatic infection vary from mild anicteric illness to fulminant hepatic failure. HAV infection typically has a sudden onset of symptoms that can include fever, anorexia, malaise, nausea, abdominal discomfort, jaundice and dark urine.5,6 The likelihood of having symptoms with HAV infection is related to age. In young children, hepatitis A is usually asymptomatic or associated with mild illness without jaundice. In adults, symptomatic infection is characteristic and 70% to 95% of infected adults show clinical symptoms.6
Case definition
Notifications32
Since January 2004, the national case definition has included detection of anti-hepatitis A virus IgM antibody, in the absence of recent vaccination; or detection of hepatitis A virus by nucleic acid testing; or clinical hepatitis (jaundice and/or bilirubin in urine) without a non-infectious cause and an epidemiologi-cal link to a laboratory-confirmed case.
Prior to 2004, the case definition was the detection of anti-hepatitis A virus IgM antibody, in the absence of recent vaccination, OR clinical evidence was sufficient to identify a case.
Hospitalisations and deathsThe ICD-10-AM/ICD-10 codes B15.0 (hepatitis A with hepatic coma) and B15.9 (hepatitis A without hepatic coma) were used to identify hospitalisations and deaths.
Secular trends
The number of monthly notifications for hepatitis A generally remained relatively low between January 2008 and December 2011 with 1,251 notifications over the 4 years. There were peaks in notifications in April 2009 (n=102) and October 2009 (n=115) after which notifications returned to a median of 15 per month in 2010 and 2011 (Figure 3.3.1). The average annual notification rate was 1.4 per 100,000 population (Table 3.3.1), with the highest rate in 2009 (2.6 per 100,000) and the lowest rate in 2011 (0.6 per 100,000) (Appendix 2).
Numbers of hospitalisations followed a similar pattern to notifications with peaks in April and October 2009. There were 858 hospitalisations over the 4-year reporting period at an average annual rate of 1 admission per 100,000 population (Table 3.3.1). Annual hospitalisation rates were highest in 2009 and lowest in 2011 (Appendix 3).
Severe morbidity and mortality
In the 4 years from January 2008 to December 2011, hepatitis A accounted for 4,395 hospital bed days with a median length of stay per hospital admission of 3 days (Table 3.3.1). The median length of stay increased with increasing age.
Over the 4-year reporting period, there were 2 deaths for hepatitis A recorded in the NNDSS, both aged ≥65 years (Table 3.3.1). Over the same period, the ABS Causes of Death database recorded 8 deaths with hepatitis A as the underlying cause; 6 were cases aged ≥65 years.

S14 CDI Vol 40 Supplement 2016
Summary of national surveillance data on vaccine preventable diseases in Australia, 2008–2011
Figure 3.3.1: Hepatitis A notifications and hospitalisations, Australia, 1993 to 2011,* by month of diagnosis or admission
0
100
200
300
400
500
600
700
Jan1993
Jan1994
Jan1995
Jan1996
Jan1997
Jan1998
Jan1999
Jan2000
Jan2001
Jan2002
Jan2003
Jan2004
Jan2005
Jan2006
Jan2007
Jan2008
Jan2009
Jan2010
Jan2011
Num
ber
Month of diagnosis or admission
Notifications
Hospitalisations
* Notifications where the month of diagnosis was between January 1993 and December 2011; hospitalisations where the month of admission was between July 1993 and December 2011.
Table 3.3.1: Hepatitis A notifications, hospitalisations and deaths, Australia, 2008 to 2011,* by age group
Age group (years)
Notifications
Hospitalisations LOS† per admission
Deaths‡Any diagnosisPrincipal diagnosis
Any diagnosis
Principal diagnosis
n Rate§ n Rate§ n Rate§ Median days n Rate§
<1 0 – 2 0.17 2 0.17 1 1.0 0 –1–4 68 1.50 15 0.33 13 0.29 2 2.0 0 –5–14 193 1.76 49 0.45 43 0.39 2 2.0 0 –15–24 256 2.11 133 1.09 111 0.91 3 3.0 0 –25–49 492 1.59 369 1.19 272 0.88 3 3.0 0 –50–64 161 1.03 169 1.08 94 0.60 3 4.0 0 –≥65 81 0.69 121 1.03 38 0.32 4 3.5 2 0.02All ages 1,251 1.43 858 0.98 573 0.66 3 3.0 2 0.00
* Notifications where the month of diagnosis was between January 2008 and December 2011; hospitalisations where the month of admission was between January 2008 and December 2011.
† LOS = length of stay in hospital.
‡ Deaths sourced from the National Notifiable Diseases Surveillance System.
§ Average annual age-specific rate per 100,000 population.
CDI Vol 40 Supplement 2016 S15
Summary of national surveillance data on vaccine preventable diseases in Australia, 2008–2011
Age and sex distribution
The highest notification rate was for young adults aged 15–24 years (Table 3.3.1). The highest hospitalisa-tion rate was among adults aged 25–49 years. There were no notifications for infants aged <1 year in the 4 years from January 2008 to December 2011 (Table 3.3.1) and notification rates for children aged <5 years remained very low across the 4-year period.
Notifications and hospitalisations had overall male:female ratios of 1:1.1 and 1:0.9, respectively, but there was no distinct pattern in the male:female ratio over the 4-year reporting period.
Geographical distribution
In 2009, Victoria had the highest notification rate among the states and territories in any year at 5.7 per 100,000 population. Tasmania had the lowest average annual rate of notifications. Hospitalisations fol-lowed a similar pattern to notifications, with the highest rate in Victoria in 2009 (Appendix 3).
Indigenous status
Notification rates of hepatitis A for Aboriginal and Torres Strait Islander people were lower than for non-Indigenous people.6
Comment
Hepatitis A vaccine has been available on the National Immunisation Program (NIP) for Aboriginal and Torres Strait Islander children in the Northern Territory, Queensland, South Australia and Western Australia since 2005. A peak in notifications was observed in 2009 due to a large outbreak.33 Prophylactic immunoglobulin or vaccine was offered free of charge to close contacts of cases in the outbreak.33 All noti-fied Indigenous cases were unvaccinated. Also of note, there were fewer deaths recorded in the NNDSS than reported by the ABS with hepatitis A as an underlying cause, and most deaths were reported in the elderly.

S16 CDI Vol 40 Supplement 2016
Summary of national surveillance data on vaccine preventable diseases in Australia, 2008–2011
3.4 Hepatitis B
HighlightsThere was a declining trend in the number of notifications of newly acquired hepatitis B that started in 2007 and continued over the 4-year period from January 2008 to December 2011.
There were very few notifications of newly acquired hepatitis B for children aged <5 years and no deaths were recorded for acute hepatitis B infection for children aged <15 years.
The focus of this chapter is acute infection with hepatitis B virus (HBV), a hepadnavirus. It produces a range of conditions from subclinical infection to acute and, rarely, fulminant hepatitis. The majority of HBV infections are not clinically recognised, with less than 10% of children and 30% to 50% of adults experiencing jaundice.34,35 When illness occurs, it is usually insidious, with anorexia, vague abdominal discomfort, nausea and vomiting, sometimes arthralgia and rash, often progressing to jaundice. The main burden of disease is related to chronic HBV infection. The risk of an acute infection becoming chronic varies inversely with age. Chronic HBV infection occurs in about 90% of infants infected at birth, 20% to 50% of children infected at 1–5 years of age, and about 1% to 10% of people infected as older children and adults.34 Of those chronically infected with HBV, 15% to 40% develop cirrhosis of the liver and/or hepatocellular carcinoma.36,37
HBV transmission occurs by percutaneous or permucosal exposure to infective body fluids such as blood, semen, vaginal secretions and any other body fluid containing blood.34 Major modes of transmission include sexual or close household contact with an infected person, perinatal transmission from mother to infant, injecting drug use and nosocomial exposure.34 The summary below is restricted to acute hepatitis B.
Case definition
Notifications38
Only confirmed cases are notified. These require laboratory definitive evidence only. Since January 2004, the national case definition for newly acquired hepatitis B includes detection of hepatitis B surface anti-gen (HBsAg) in a patient shown to be negative within the last 24 months; or detection of HBsAg and IgM to hepatitis B core antigen, in the absence of prior evidence of hepatitis B virus infection; or detection of hepatitis B virus by nucleic acid testing, and IgM to hepatitis B core antigen, in the absence of prior evidence of hepatitis B virus infection.
Prior to 2004, the definition for hepatitis B cases included suspected and presumptive cases and there were variations in case definition criteria across jurisdictions.
Hospitalisations and deathsThe ICD-10-AM/ICD-10 code B16 (acute hepatitis B) was used to identify hospital admissions and deaths. As in previous reports only those hospitalisations with B16 as the principal diagnosis were included.
Secular trends
In the 4 years from January 2008 to December 2011, there were 936 notifications of newly acquired hepa-titis B (average annual rate of 1.1 per 100,000) (Table 3.4.1). There was a small decline in the number of notifications for newly acquired hepatitis B over the 4-year reporting period, from a median of 23.5 notifi-cations per month in 2008 to 16.5 notifications per month in 2011 (Figure 3.4.1). There were 549 hospital admissions with a principal diagnosis of acute hepatitis B over the 4 years (Table 3.4.1). Numbers of hos-pitalisations did not change over time and were comparable to those seen in the previous review period of January 2006 to December 20071 (Figure 3.4.1).
Severe morbidity and mortality
In the 4-year reporting period, hospitalisations for acute hepatitis B infection accounted for 2,891 bed days. The median length of stay in hospital was 4 days, increasing to 7 days for admissions for persons aged ≥65 years (Table 3.4.1).

CDI Vol 40 Supplement 2016 S17
Summary of national surveillance data on vaccine preventable diseases in Australia, 2008–2011
Figure 3.4.1: Hepatitis B notifications and hospitalisations with a principal diagnosis of acute hepatitis B, Australia, 1997 to 2011,* by month of diagnosis or admission
0
10
20
30
40
50
Jan1997
Jan1998
Jan1999
Jan2000
Jan2001
Jan2002
Jan2003
Jan2004
Jan2005
Jan2006
Jan2007
Jan2008
Jan2009
Jan2010
Jan2011
Num
ber
Month of diagnosis or admission
Notifications
Hospitalisations
* Notifications where the month of diagnosis was between January 1997 and December 2011; hospitalisations where the month of admission was between January 1997 and December 2011. This figure includes data from 1997 onwards since it was not until 1996 that acute hepatitis B became notifiable in all states and territories and prior to 1994 hospitalisations for acute hepatitis B were not distinguished from chronic hepatitis B.
Table 3.4.1: Hepatitis B notifications, hospitalisations and deaths, Australia, 2008 to 2011,* by age group
Age group (years)
NotificationsHospitalisations
principal diagnosis
LOS† per admission principal diagnosis Deaths‡
n Rate§ n Rate§ Median days n Rate§
<1 6 0.51 0 0.00 – 0 –1–4 4 0.09 0 0.00 – 0 –5–14 7 0.06 1 0.01 1.0 0 –15–24 135 1.11 65 0.54 4.0 0 –25–49 620 2.00 367 1.18 3.0 0 –50–64 125 0.80 78 0.50 3.0 0 –≥65 39 0.33 38 0.32 7.0 1 0.01All ages 936 1.07 549 0.63 4.0 1 0.00
* Notifications where the month of diagnosis was between January 2008 and December 2011; hospitalisations where the month of admission was between January 2008 and December 2011.
† LOS = length of stay in hospital.
‡ Deaths sourced from the National Notifiable Diseases Surveillance System.
§ Average annual age-specific rate per 100,000 population.

S18 CDI Vol 40 Supplement 2016
Summary of national surveillance data on vaccine preventable diseases in Australia, 2008–2011
One death was recorded in the NNDSS among cases of newly acquired hepatitis B infection in the 4-year period (Table 3.4.1). The ABS Causes of Death database recorded 22 deaths with acute hepatitis B infec-tion (ICD-10 code B16) as the underlying cause over the 4-year period. There were no deaths from acute hepatitis B infection recorded for children aged <15 years.
Age and sex distribution
From January 2008 to December 2011, the highest rates for notification of newly acquired hepatitis B infection and hospital admissions for acute hepatitis B were among adults aged 25–49 years (Table 3.4.1). There were very few notifications of newly acquired hepatitis B in children aged <5 years (Table 3.4.1), the majority of which (6/10) were notified in 2010.
Numbers of notifications and hospital admissions were higher for males than for females (male:female ratio for notifications 2.0:1 and hospitalisations 1.7:1).
Geographical distribution
Victoria accounted for 34% of notifications and 40% of hospital admissions over the 4 years from January 2008 to December 2011. Notification rates were highest in Tasmania (average annual rate 2.4 per 100,000 population) and lowest in New South Wales (average annual rate 0.5 per 100,000) (Appendix 2).
Indigenous status
Hepatitis B notification and hospitalisation rates were higher for Aboriginal and Torres Strait Islander people than for other people across most age groups.6 The exception was children aged <5 years; there were no notifications or hospitalisations for hepatitis B among Aboriginal or Torres Strait Islander children aged <5 years.6
Vaccination status
There were a total of 12 notified cases during January 2008 to December 2011 who were eligible to receive hepatitis B vaccine as part of the universal infant vaccination program. Vaccination status was missing or unknown for 10 of these cases and the other 2 cases were partially vaccinated.
Comment
Universal infant hepatitis B immunisation was introduced in May 2000. This program has likely contrib-uted to the continuing low rates of hepatitis B in children <15 years of age. Also of note, during the report-ing period, there were no deaths recorded for children aged <15 years and fewer deaths were recorded in the NNDSS than reported by the ABS.

CDI Vol 40 Supplement 2016 S19
Summary of national surveillance data on vaccine preventable diseases in Australia, 2008–2011
3.5 Influenza
HighlightsThere was a large peak in influenza notifications in 2009 related to the H1N1 influenza pandemic.
Hospitalisations with an ICD-10-AM code for pandemic influenza were associated with greater morbidity in terms of longer hospital stays, compared with other influenza hospitalisations, especially for young adults.
Influenza virus causes annual epidemics of respiratory disease and is mainly spread by droplet transmis-sion. The disease is often indistinguishable clinically from that caused by other respiratory viruses. While asymptomatic influenza infection may occur, symptoms usually include abrupt onset of fever, cough, malaise, myalgia, sore throat and headache. Complications of influenza infection include pneumonia, otitis media and exacerbation of chronic medical conditions.39
Case definition
Notifications40
Notifications of influenza to the NNDSS use a single disease code (Influenza 062) which does not distinguish between pandemic influenza and seasonal influenza.
Only confirmed cases are notified. Since January 2004, the national case definition for influenza has required laboratory definitive evidence only. This includes either isolation of influenza virus by culture from an appropriate respiratory tract specimen, or detection of influenza virus by nucleic acid testing from an appropriate respiratory tract specimen, or laboratory detection of influenza virus antigen from an appropriate respiratory tract specimen, or IgG seroconversion or a significant increase in antibody level or a 4-fold or greater rise in titre to influenza virus or a single high titre to influenza virus by comple-ment fixation test or haemagglutination inhibition.
Hospitalisations and deathsThe ICD-10-AM/ICD-10 codes J09 (influenza due to certain identified influenza virus, including avian influenza and the influenza A/H1N1 pandemic strain), J10 (influenza due to identified virus) and J11 (influenza, virus not identified) were used to identify influenza hospitalisations and deaths. As no avian influenza cases have been reported in Australia to our knowledge, J09 has been used in this report to refer exclusively to the influenza A/H1N1 pandemic strain.
Secular trends
In the 4 years from January 2008 to December 2011, there were 108,880 notifications of influenza for an average annual rate of 124.7 per 100,000 population (Table 3.5.1). Notifications were highest in 2009 accounting for 54% of cases notified over the 4 years at a rate of 272 per 100,000 (Appendix 2). Since notifications for influenza do not distinguish by type, average annual influenza rates were calculated to estimate rates of seasonal influenza for the 3 non-pandemic years 2008, 2010 and 2011. When 2009, the year of the pandemic, is excluded the average annual notification rate for the 3 non-pandemic years, 2008, 2010 and 2011, was 76.0 (Table 3.5.1). From 2007 to 2011, there were marked increases in the winter seasonal peaks in influenza notifications relative to previous years with a very large peak in influenza notifications between May and September 2009 (57,439 cases) related to the H1N1 influenza pandemic (Figure 3.5.1). Monthly notifications for influenza remained elevated during 2011 (monthly median 911 cases) compared with 2008 (monthly median 265).
From January 2008 to December 2011, there were 25,947 hospitalisations with ICD-10-AM influenza codes J09, J10 or J11 – 8,992 of J09 (identified influenza A/H1N1), 17,638 with other influenza (J10, J11) and 683 with both identified H1N1 influenza (J09) and other influenza codes recorded. There was a large peak in hospitalisations for influenza code J09 (identified H1N1) in the winter months of 2009 with smaller peaks in 2010 and 2011 (Figure 3.5.1). Hospitalisations for other influenza (J10, J11) also had a larger than average peak in winter 2009. However, in 2010 and 2011, hospitalisations for other influenza (J10, J11) returned to levels seen in the years prior to 2007 (Figure 3.5.1).

S20 CDI Vol 40 Supplement 2016
Summary of national surveillance data on vaccine preventable diseases in Australia, 2008–2011
Figure 3.5.1: Influenza notifications from 2001 to 2011 and influenza hospitalisations from 1993 to 2011,* Australia, by month of diagnosis or admission
0
5,000
10,000
15,000
20,000
25,000
30,000
35,000
Jan2001
Jan2002
Jan2003
Jan2004
Jan2005
Jan2006
Jan2007
Jan2008
Jan2009
Jan2010
Jan2011
Num
ber
Month of diagnosis or admission
Notifications
Hospitalisations ( J10,J11)
Hospitalisations (J09)
* Notifications where the month of diagnosis was between January 2001 and December 2011; hospitalisations with ICD-10-AM code for general influenza (J10, J11) where the month of admission was between July 1993 and December 2011; hospitalisations for pandemic influenza (ICD-10-AM code J09) where the month of admission was between January 2008 and December 2011.
Table 3.5.1: All influenza notifications and notified deaths, Australia, 2008, 2010, 2011 and 2008 to 2011, by age group
Age group (years)
Notifications 2008, 2010 and 2011
(excluding pandemic year 2009) Notifications 2008 to 2011 Deaths*n Rate† n Rate‡ n Rate‡
<1 1,893 215.3 3,078 262.1 1 0.091–4 4,864 142.4 9,453 207.9 2 0.045–14 8,999 109.2 23,082 210.4 6 0.0515–24 6,922 76.0 20,169 166.0 16 0.1325–49 16,126 69.2 34,431 111.0 53 0.1750–64 6,332 53.6 11,879 75.8 61 0.39≥65 4,666 52.5 6,643 56.4 58 0.49All ages 49,861 76.0 108,880 124.7 197 0.23
* Deaths sourced from the National Notifiable Diseases Surveillance System.
† Average annual age-specific rate per 100,000 population for 2008, 2010 and 2011 (excluding pandemic year 2009).
‡ Average annual age-specific rate per 100,000 population for 2008 to 2011.

CDI Vol 40 Supplement 2016 S21
Summary of national surveillance data on vaccine preventable diseases in Australia, 2008–2011
Severe morbidity and mortality
In the 4-year reporting period, there were 166,570 bed days for hospitalisations due to any influenza (J09, J10, J11). The median length of hospital stay for influenza with ICD-10-AM codes J10 or J11 was 2 days, increasing to 6 days for patients aged ≥65 years (Table 3.5.2). Length of stay for hospitalisations with influenza code J09 (identified influenza A/H1N1) was longer than for other influenza with a median stay of 3 days (Table 3.5.3). For younger adults (aged 15–24 and 25–49 years) the median length of stay for hospitalisations with identified influenza A/H1N1 (J09) was 2–3 times as long as for other influenza (J10 and J11; Tables 3.5.2 and 3.5.3).
There were 197 deaths recorded in the NNDSS among cases of any influenza in the 4-year reporting period, with the majority of deaths (116) recorded in 2009. The rate of deaths recorded in the NNDSS for any influenza increased with increasing age (Table 3.5.1).
From January 2008 to December 2011, the ABS Causes of Death database recorded influenza (ICD-10 codes J09, J10, J11) as the underlying cause of death in 286 cases at an average annual rate of 0.3 deaths per 100,00 population, with a peak of 0.5 deaths per 100,000 in 2009.
Age and sex distribution
From January 2008 to December 2011, the highest rate of notifications for influenza was among infants aged <1 year, followed by children in the age groups from 1 to 14 years (Table 3.5.1). In 2009 notification rates for children aged <5 years reached a peak of >400 per 100,000 population. Hospitalisation rates for influenza coded as either J10/J11or J09 (identified influenza A/H1N1) were highest for infants aged <1 year, followed by children aged 1–4 years (Tables 3.5.2 and 3.5.3).
Three deaths were recorded in the NNDSS for cases of influenza in children <5 years of age.
In the non-pandemic years, influenza notification rates for adults decreased steadily with increasing age (Table 3.5.1). When notifications in the pandemic year were included, notification rates increased markedly for children aged 5–14 years and young adults aged 15–24 years. However, among adults, hospitalisation rates for pandemic influenza were highest for those aged 50–64 years (Table 3.5.3).
There were 53 notified deaths in young adults aged 25–49 years (Table 3.5.1), 38 of which were recorded in 2009.
There were slightly fewer influenza notifications and hospitalisations for males than females (male:female ratio 0.9:1 for notifications and 0.9 for hospitalisations).
Geographical distribution
Notifications and hospitalisations for influenza were highest in the Northern Territory (Appendix 2 and 3). The pattern of hospitalisation rates was similar for influenza across the states and territories.
Indigenous status
Hospitalisation rates for all influenza (ICD-10-AM codes J09, J10 and J11) among Aboriginal and Torres Strait Islander people were 4.6 times the rate for non-Indigenous people in Australia.6
Vaccination status
Vaccination status was recorded as missing or unknown in 92% of influenza notifications and in 95% of notified cases aged ≥65 years.

S22 CDI Vol 40 Supplement 2016
Summary of national surveillance data on vaccine preventable diseases in Australia, 2008–2011
Comment
Influenza remains a common VPD in Australia. The current reporting period involved the pandemic influenza year of 2009. There may also have been an increased propensity for influenza testing and report-ing in the years following the pandemic year. Hospitalisations with identified pH1N1 influenza (J09) were analysed separate to those with other codes (J10/11). However, the likely presence of unidentified pH1N1 cases in hospitalisations coded as J11, and the reversion of pH1N1 effect to become more similar to seasonal influenza in seasons post-2009, limits interpretability of these data to some extent. Differences in notifications and hospitalisations across jurisdictions could be contributed to by different testing practices.
Table 3.5.3: Pandemic influenza (ICD-10-AM code J09) hospitalisations, Australia, 2008 to 2011,* by age group
Age group (years)
Hospitalisations LOS† per admission
Any diagnosis Principal diagnosis Any diagnosisPrincipal diagnosis
n Rate‡ n Rate‡ Median days<1 611 52.0 421 35.9 3 21–4 955 21.0 687 15.1 2 25–14 921 8.4 644 5.9 2 215–24 989 8.1 541 4.5 3 225–49 2,964 9.6 1,722 5.6 4 350–64 1,747 11.1 993 6.3 5 4≥65 805 6.8 385 3.3 7 5All ages 8,992 10.3 5,393 6.2 3 3
* Hospitalisations for ICD-10-AM code J09 where the month of admission was between January 2008 and December 2011.
† LOS = length of stay in hospital.
‡ Average annual age-specific rate per 100,000 population.
Table 3.5.2: Influenza (ICD-10-AM codes J10 and J11) hospitalisations Australia, 2008 to 2011,* by age group
Age group (years)
Hospitalisations LOS† per admission
Any diagnosis Principal diagnosis Any diagnosisPrincipal diagnosis
n Rate‡ n Rate‡ Median days<1 1,684 143.4 1,204 102.5 2 21–4 1,921 42.3 1,302 28.6 2 25–14 1,405 12.8 957 8.7 2 115–24 1,820 15.0 1,223 10.1 1 125–49 4,819 15.5 2,950 9.5 2 150–64 2,610 16.6 1,407 9.0 3 3≥65 3,379 28.7 1,672 14.2 6 4All ages 17,638 20.2 10,715 12.3 2 2
* Hospitalisations for influenza for ICD-10-AM codes J10 and J11 (excluding pandemic influenza, J09) where the month of admission was between January 2008 and December 2011.
† LOS = length of stay in hospital.
‡ Average annual age-specific rate per 100,000 population.

CDI Vol 40 Supplement 2016 S23
Summary of national surveillance data on vaccine preventable diseases in Australia, 2008–2011
Again there were discrepancies in reported the number of deaths from influenza across the NNDSS and ABS Causes of Death databases, with more deaths recorded by the ABS with influenza as the underlying cause.
However, much of this discrepancy may be explained by the inclusion of the ICD-10 code J11 (influenza, virus not identified) in the ABS Causes of Death database. There were 169 deaths recorded for an identified influenza virus (J09, J10) on the ABS Causes of Death database, slightly fewer than the 197 deaths on the NNDSS database. When notifications and notified deaths for each year are compared, it is apparent that during the influenza pandemic of 2009, young adults were more adversely affected in terms of morbidity and mortality compared with the usual effects of seasonal influenza.

S24 CDI Vol 40 Supplement 2016
Summary of national surveillance data on vaccine preventable diseases in Australia, 2008–2011
3.6 Measles
HighlightsMeasles notifications remained low in Australia over the review period.
Notification rates were highest in infants <1 year of age.
Hospitalisation rates were very low over the review period.
Measles is an acute and highly communicable disease caused by a member of the genus Morbillivirus. Before the introduction of a vaccine measles caused millions of deaths worldwide.41 The virus is transmit-ted directly from person to person by respiratory droplets and is contagious before symptoms develop.41 The clinical picture includes a prodromal fever, cough, coryza, conjunctivitis, and Koplik spots on the buccal mucosa, before the onset of rash.41,42 Complications include otitis media, pneumonia and encephalitis. Subacute sclerosing panencephalitis (SSPE) occurs very rarely as a late sequel of wild infection but not vaccination.43 Complications and deaths occur more commonly in developing countries in children aged <5 years and adults, and in persons with malnutrition or immune deficiencies.42
Case definition
Notifications44
Confirmed and probable cases are notified.
A confirmed case of measles requires laboratory definitive evidence or clinical evidence with an estab-lished epidemiological link. Alternatively, a probable case of measles requires clinical and laboratory evidence suggesting measles infection.
Since January 2004, the national case definition of measles has included:
a) Isolation of measles virus (confirmed case); or
b) Detection of measles virus by nucleic acid testing (confirmed case); or
c) Detection of measles virus antigen (confirmed case); or
d) Measles virus-specific IgG seroconversion or significant increase in IgG antibody level or a 4-fold or greater rise in antibody titre to measles virus, with paired sera tested in parallel and in the absence of receipt of measles-containing vaccine 8 days to 8 weeks prior to testing (confirmed case); or
e) Detection of measles virus-specific IgM antibody confirmed in an approved reference laboratory, in the absence of recent measles-containing vaccination (confirmed case); or
f) A clinical illness characterised by a generalised maculopapular rash lasting at least 3 days, fever of at least 38°C at the time of rash onset and either cough, coryza, conjunctivitis or Koplik spots, together with an epidemiological link to a confirmed case (confirmed case); or
g) A clinical illness as in point (f) above, together with detection of measles-specific IgM antibody other than by an approved reference laboratory (in the absence of recent measles-containing vaccination) (probable case).
Hospitalisations and deathsThe ICD-10-AM/ICD-10 code B05 (measles) was used to identify hospitalisations and deaths. SSPE, a very rare late sequel of measles infection, was not included in this analysis.
Secular trends
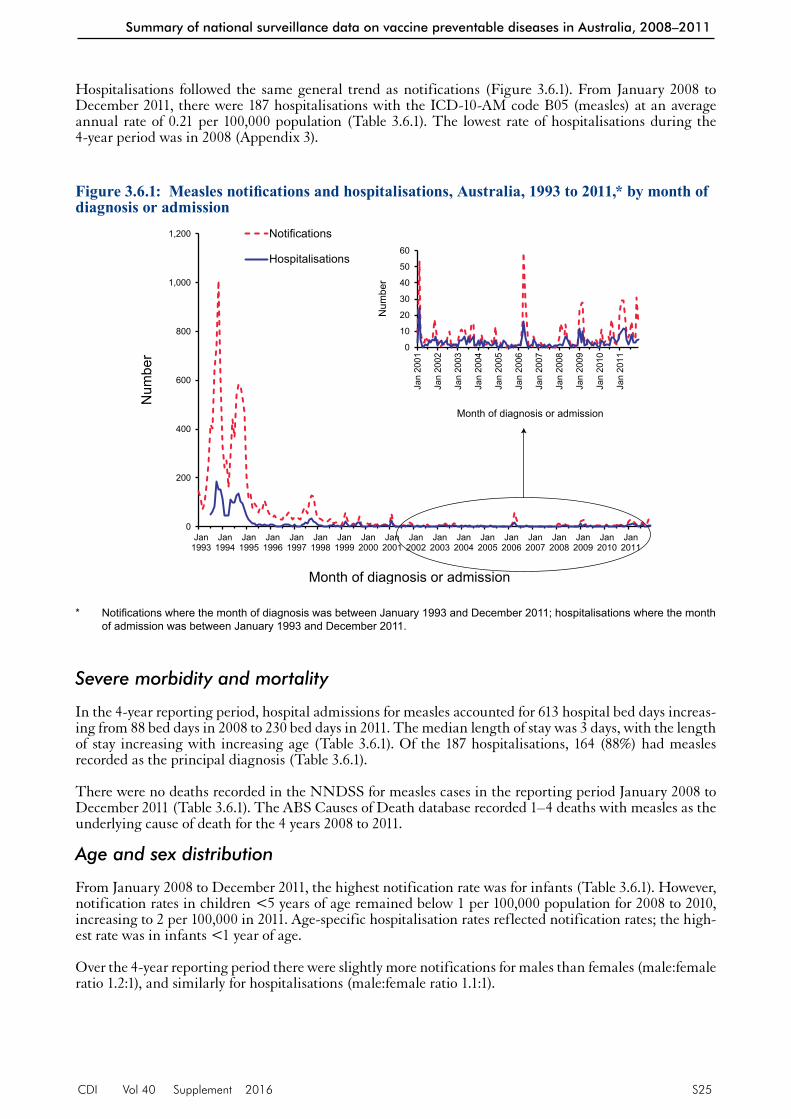
In the 4 years from January 2008 to December 2011, there was a continuation of the relatively low number of measles notifications that had been observed in Australia since 1999 (Figure 3.6.1).
In the 4-year reporting period there were 433 notified cases of measles, an average annual notification rate of 0.5 per 100,000 population (Table 3.6.1). There were, however, peaks of notifications in early 2009 and in 2011. The notification rate in 2011 (0.9 per 100,000) was the highest notification rate of measles in the previous decade (Figure 3.6.1 inset and Appendix 2).
CDI Vol 40 Supplement 2016 S25
Summary of national surveillance data on vaccine preventable diseases in Australia, 2008–2011
Hospitalisations followed the same general trend as notifications (Figure 3.6.1). From January 2008 to December 2011, there were 187 hospitalisations with the ICD-10-AM code B05 (measles) at an average annual rate of 0.21 per 100,000 population (Table 3.6.1). The lowest rate of hospitalisations during the 4-year period was in 2008 (Appendix 3).
Figure 3.6.1: Measles notifications and hospitalisations, Australia, 1993 to 2011,* by month of diagnosis or admission
0
200
400
600
800
1,000
1,200
Jan1993
Jan1994
Jan1995
Jan1996
Jan1997
Jan1998
Jan1999
Jan2000
Jan2001
Jan2002
Jan2003
Jan2004
Jan2005
Jan2006
Jan2007
Jan2008
Jan2009
Jan2010
Jan2011
Num
ber
Month of diagnosis or admission
Notifications
Hospitalisations
0
10
20
30
40
50
60
Jan
200
1
Jan
200
2
Jan
200
3
Jan
200
4
Jan
200
5
Jan
200
6
Jan
200
7
Jan
200
8
Jan
200
9
Jan
201
0
Jan
201
1
Num
ber
Month of diagnosis or admission
* Notifications where the month of diagnosis was between January 1993 and December 2011; hospitalisations where the month of admission was between January 1993 and December 2011.
Severe morbidity and mortality
In the 4-year reporting period, hospital admissions for measles accounted for 613 hospital bed days increas-ing from 88 bed days in 2008 to 230 bed days in 2011. The median length of stay was 3 days, with the length of stay increasing with increasing age (Table 3.6.1). Of the 187 hospitalisations, 164 (88%) had measles recorded as the principal diagnosis (Table 3.6.1).
There were no deaths recorded in the NNDSS for measles cases in the reporting period January 2008 to December 2011 (Table 3.6.1). The ABS Causes of Death database recorded 1–4 deaths with measles as the underlying cause of death for the 4 years 2008 to 2011.
Age and sex distribution
From January 2008 to December 2011, the highest notification rate was for infants (Table 3.6.1). However, notification rates in children <5 years of age remained below 1 per 100,000 population for 2008 to 2010, increasing to 2 per 100,000 in 2011. Age-specific hospitalisation rates reflected notification rates; the high-est rate was in infants <1 year of age.
Over the 4-year reporting period there were slightly more notifications for males than females (male:female ratio 1.2:1), and similarly for hospitalisations (male:female ratio 1.1:1).

S26 CDI Vol 40 Supplement 2016
Summary of national surveillance data on vaccine preventable diseases in Australia, 2008–2011
Geographical distribution
The rate of measles notifications over the 4-year reporting period was highest in the Australian Capital Territory followed by the Northern Territory, both of which were more than twice the national rate (Appendix 2). New South Wales, however, accounted for 40% of measles notifications during the 4-year period.
Rates of hospitalisations for measles were low across all jurisdictions in each year of the reporting period (Appendix 3).
Indigenous status
Measles notifications were very low among Aboriginal and Torres Strait Islander people; only 3 measles cases were reported for Indigenous persons.6
Vaccination status
For the 4 years from January 2008 to December 2011, approximately 65% of notified cases of measles did not have their vaccination status recorded, while 4% were recorded as being fully vaccinated for age, 5% as partially vaccinated for age and 26% as unvaccinated.
Comment
There has been a global resurgence of measles in recent years due in part to controversy around vaccine safety in developed countries,45,46 lack of funding and the declining quality of vaccination campaigns in developing countries.47
During this reporting period, measles notifications and hospitalisations remained at very low rates in Australia. Evidence indicates that endemic measles has been eliminated in Australia since at least 2005, with no circulating endemic strains of the virus and consistent 90% population coverage with 2 doses of vaccine.48 However, contained outbreaks of measles still occur in Australia, mostly linked to imported cases particularly in travellers from high endemicity regions.48,49 There were no deaths recorded in the NNDSS during this period.
Table 3.6.1: Measles notifications, hospitalisations and deaths, Australia, 2008 to 2011,* by age group
Age group (years)
Notifications
Hospitalisations LOS† per admission
Deaths‡Any diagnosisPrincipal diagnosis
Any diagnosis
Principal diagnosis
n Rate§ n Rate§ n Rate§ Median days n Rate§
<1 22 1.87 15 1.28 13 1.11 1.0 1 0 –
1–4 36 0.79 30 0.66 27 0.59 1.0 1 0 –
5–14 97 0.88 14 0.13 12 0.11 2.0 2 0 –
15–24 117 0.96 34 0.28 31 0.26 2.0 2 0 –
25–49 154 0.50 82 0.26 74 0.24 3.0 3 0 –
50–64 5 0.03 8 0.05 6 0.04 4.0 4 0 –
≥65 2 0.02 4 0.03 1 0.01 10.5 4 0 –
All ages 433 0.50 187 0.21 164 0.19 3.0 3 0 –
* Notifications where the month of onset was between January 2008 and December 2011; hospitalisations where the month of admission was between 1 January 2008 and 31 December 2011.
† LOS = length of stay in hospital.
‡ Deaths sourced from the National Notifiable Diseases Surveillance System.
§ Average annual age-specific rate per 100,000 population.

CDI Vol 40 Supplement 2016 S27
Summary of national surveillance data on vaccine preventable diseases in Australia, 2008–2011
3.7 Meningococcal disease
HighlightsThe number of notifications and hospitalisations for meningococcal disease have been declining since the introduction of the national meningococcal C vaccination program in 2003. This decline continued over the reporting period 2008 to 2011.
Notification and hospitalisation rates remained highest in children <1 year of age. Notification rates among young children aged <5 years, however, continued to decline across the 4-year period.
Invasive meningococcal disease is defined as the isolation of Neisseria meningitidis from cerebrospinal fluid (CSF), blood or other normally sterile sites including skin lesions. Clinical manifestations include men-ingitis, septicaemia without meningitis, and septic arthritis. In culture-negative cases with a compatible clinical picture (such as fever, haemorrhagic rash and shock), a diagnosis of meningococcal disease can be supported by a range of laboratory evidence. This includes the identification of Gram-negative intracellular diplococci or meningococcal antigen in blood or CSF, the identification of nucleic acid from N. meningitidis in body fluids or demonstration of a serological response to N. meningitidis.50,51
Case definition
Notifications52
There have been several revisions of the case definition for invasive meningococcal disease since 2007. The major change was the inclusion of polymerase chain reaction testing as laboratory confirmed evidence (formerly laboratory suggestive evidence). Both confirmed cases and probable cases should be notified. A confirmed case requires either laboratory definitive evidence or laboratory suggestive evidence AND clinical evidence. A probable case requires clinical evidence only.
Laboratory definitive evidence includes isolation of Neisseria meningitidis from a normally sterile site or detection of specific meningococcal DNA sequences in a specimen from a normally sterile site, by nucleic acid amplification testing. Laboratory suggestive evidence includes detection of Gram-negative diplococci in a specimen from a normally sterile site or from a suspicious skin lesion or high titre IgM or significant rise in IgM or IgG titres to outer membrane protein antigens of N. meningitidis.
Clinical evidence for a confirmed case requires that the opinion of the treating clinician is that the dis-ease is compatible with invasive meningococcal disease. Clinical evidence for a probable case requires the absence of evidence for other causes of clinical symptoms and either clinically compatible disease including haemorrhagic rash or clinically compatible disease and close contact with a confirmed case within the previous 60 days.
Hospitalisations and deathsThe ICD-10-AM/ICD-10 code A39 (meningococcal infection) was used to identify hospitalisations and deaths.
Secular trends
There were 1,015 notifications of invasive meningococcal disease during the 4 years from January 2008 to December 2011 at an average annual notification rate of 1.2 per 100,000 population (Table 3.7.1). In this same 4-year period there were 1,527 hospitalisations for meningococcal infection at an average rate of 1.7 per 100,000. There was a monthly median of 20 notifications (range 7–41) and 31 hospitalisations (range 12–59) (Figure 3.7.1). Both notifications and hospitalisations fell over the 4-year reporting period (Figure 3.7.1). Notification rates fell from 1.4 per 100,000 in 2008 to 1.1 per 100,000 in 2011, and hospitalisa-tion rates fell from 2.1 per 100,000 in 2008 to 1.7 per 100,000 in 2011 (Appendix 2 and 3). The seasonality in notifications and hospitalisations continued over 2008 to 2011; however, the winter peaks were lower in 2010 and 2011 than those observed in previous years.

S28 CDI Vol 40 Supplement 2016
Summary of national surveillance data on vaccine preventable diseases in Australia, 2008–2011
Figure 3.7.1: Meningococcal disease notifications and hospitalisations, Australia, 1993 to 2011,* by month of diagnosis or admission
0
30
60
90
120
150
Jan1993
Jan1994
Jan1995
Jan1996
Jan1997
Jan1998
Jan1999
Jan2000
Jan2001
Jan2002
Jan2003
Jan2004
Jan2005
Jan2006
Jan2007
Jan2008
Jan2009
Jan2010
Jan2011
Num
ber
Month of diagnosis or admission
Notifications
Hospitalisations
* Notifications where the month of diagnosis was between January 1993 and December 2011; hospitalisations where the month of admission was between July 1993 and December 2011.
Table 3.7.1: Meningococcal disease notifications, hospitalisations and deaths, Australia, 2008 to 2011,* by age group
Age group (years)
Notifications
Hospitalisations LOS† per admission
Deaths‡Any diagnosisPrincipal diagnosis
Any diagnosis
Principal diagnosis
n Rate§ n Rate§ n Rate§ Median days n Rate§
<1 163 13.9 253 21.5 231 19.7 5 5 10 0.851–4 184 4.0 304 6.7 284 6.2 4 4 5 0.115–14 118 1.1 218 2.0 206 1.9 4 4 1 0.0115–24 266 2.2 340 2.8 318 2.6 5 5 9 0.0725–49 154 0.5 228 0.7 195 0.6 5 6 10 0.0350–64 77 0.5 113 0.7 85 0.5 7 7 5 0.03≥65 53 0.5 71 0.6 47 0.4 10 8 8 0.07All ages 1,015 1.2 1,527 1.7 1,366 1.6 5 5 48 0.05
* Notifications where the month of diagnosis was between January 2008 and December 2011; hospitalisations where the month of admission was between January 2008 and December 2011.
† LOS = length of stay in hospital.
‡ Deaths sourced from the National Notifiable Diseases Surveillance System.
§ Average annual age-specific rate per 100,000 population.

CDI Vol 40 Supplement 2016 S29
Summary of national surveillance data on vaccine preventable diseases in Australia, 2008–2011
Severe morbidity and mortality
In the 4-year reporting period there were a total of 11,294 hospital bed days with an ICD-10-AM code of meningococcal infection, an average of 2,823 per year. The median length of stay was 5 days; longer in admissions for adults aged ≥50 years (Table 3.7.1). There were 48 deaths recorded among cases of invasive meningococcal disease notified to the NNDSS over the 4 years January 2008 to December 2011 at a rate of 0.05 deaths per 100,000 population. For the same period, the ABS Causes of Death database recorded 45 deaths with meningococcal infection as the underlying cause.
Age and sex distribution
In the 4 years from January 2008 to December 2011, the highest notification and hospitalisation rates for meningococcal disease occurred among infants aged <1 year and young children aged 1–4 years (Table 3.7.1). There was a small peak in notification rates in the adolescent and young adult (15–24 years) age group.
During the 4-year reporting period, there were 15 deaths recorded in the NNDSS among cases in children aged <5 years; 10 of these cases were aged <1 year (Table 3.7.1). Notification rates of meningococcal disease in young children aged <5 years continued to decline, from 7.2 per 100,000 population in 2008 to 5 per 100,000 in 2011. However, the number of deaths per year among notified cases in young children remained comparable with previous years.
There were slightly more hospitalisations in males than females (male:female ratio 1.2:1), and similarly for notifications (male:female ratio 1.1:1).
Geographical distribution
The average notification and hospitalisation rates were highest in the Northern Territory (Appendix 2 and 3). However, the number of notifications and hospitalisations per year in many jurisdictions were very small, resulting in marked fluctuations in annual rates.
Indigenous status
Since the introduction of the meningococcal C vaccine onto the NIP in 2003, rates of meningococcal disease in Aboriginal and Torres Strait Islander people have decreased.6 However, notification and hos-pitalisation rates for Indigenous Australians remain higher than for other Australians (notifications ratio 2.7:1, hospitalisations 2.2:1).
Vaccination status and serogroups
Of the 1,015 notified cases of invasive meningococcal disease, 74% did not have vaccination status recorded and 9% were recorded as being fully or partially vaccinated for age. Of the 184 notified cases aged 1–4 years, 27% were recorded as being fully vaccinated for age.
Rates of meningococcal serogroup C disease remained low over the 4-year reporting period (0.1 per 100,000 population). Rates of meningococcal serogroup B remained steady over the 4 years (1.0 per 100,000 in 2008, 0.8 per 100,000 in 2011). Rates for both serogroup B and C disease were highest in the Northern Territory.
Comments
There was a decline in notifications and hospitalisations for meningococcal disease over the 4-year report-ing period. The number of deaths for meningococcal infection (A39) recorded in the ABS Causes of Death database and for invasive meningococcal disease recorded in the NNDSS database were similar. The distribution of deaths by age group was also comparable in both databases. This agreement between databases may reflect a high degree of attention given to accurate reporting of meningococcal disease in both notification and death certificate data.

S30 CDI Vol 40 Supplement 2016
Summary of national surveillance data on vaccine preventable diseases in Australia, 2008–2011
3.8 Mumps
HighlightsThe review period of January 2008 to December 2011 saw the end of a major outbreak of mumps in Australia that had peaked in late 2007; notification rates then fell to the levels seen before 2006.
Mumps is an acute viral disease caused by a paramyxovirus. In the pre-vaccine era it was a well-known common childhood viral disease.53 Between 2004 and 2007, there was a resurgence of mumps among young adults in the developed world, including Australia, with the largest outbreaks observed in the United Kingdom and United States of America.1,54,55 Mumps infection is systemic with variable pathology and symptomatology. The classical disease is characterised by fever and painful swelling and inflammation of one or more salivary glands, most commonly the parotid glands. Up to 30% of cases, however, are subclinical. Aseptic meningitis develops in up to 10% of cases and 30% of post-pubertal males experience epididymoorchitis.53,56
Case definition
Notifications57
Since January 2004, only confirmed cases should be notified. Confirmed cases require either laboratory definitive evidence, or laboratory suggestive evidence and clinical evidence, or clinical evidence and epidemiological evidence. Prior to 2004, clinical diagnosis was sufficient. Also, the case definition and the number of jurisdictions in which mumps was notifiable varied until 1996, when it became notifiable in all states and territories.
Hospitalisations and deathsThe ICD-10-AM/ICD-10 code B26 (mumps) was used to identify hospitalisations and deaths.
Secular trends
This reporting period saw the end of a major outbreak of mumps in Australia that peaked in late 2007 (Figure 3.8.1). The large and increasing number of cases notified in 2007 fell during 2008 then remained relatively low from 2009 to 2011 at levels equivalent to those seen before 2006. In the 4 years from January 2008 to December 2011, there were 704 notifications of mumps and an average annual notification rate of 0.8 per 100,000 population (Table 3.8.1). Notification rates were highest in 2008 (1.3 per 100,000 population) and lowest in 2010 (0.4 per 100,000) (Appendix 2).
From January 2008 to December 2011, there were 356 hospital admissions for ICD-10-AM code B26 (mumps) (Table 3.8.1). Rates of hospitalisations remained steady over the 4 years 2008 to 2011 (0.4 per 100,000 population) (Appendix 3).
Severe morbidity and mortality
Between January 2008 and December 2011, there were 1,493 hospital bed days recorded for patients with mumps. The median length of stay in hospital for admissions with mumps was 2 days, and median hos-pital stay was substantially longer for those with mumps aged ≥65 years compared with younger cases (Table 3.8.1). Of the 356 hospitalisations with an ICD-10-AM code for mumps, 81% (n=290) had a princi-pal diagnosis of mumps (Table 3.8.1).
There were no deaths recorded among notifications of mumps to the NNDSS over the 4-year reporting period (Table 3.8.1). The ABS Causes of Death database also recorded no deaths with mumps as the underlying cause for the 4 years.
Age and sex distribution
Over the 4-year reporting period, two-thirds of mumps notifications and over half of hospitalisations occurred in the 15–24 years and 25–49 years age groups (Table 3.8.1).

CDI Vol 40 Supplement 2016 S31
Summary of national surveillance data on vaccine preventable diseases in Australia, 2008–2011
From 2005 to 2007, the increase in mumps notifications was largely explained by a steep increase in noti-fication rates among young adults, with a peak in 2007 among adults aged 25–34 years. Notification rates in young adults fell substantially over the period January 2008 to December 2011. Following a peak in hospitalisation rates in 2007 for young adults aged 25–34 years, hospitalisation rates fell in this age group from 2008 to 2011. Since 2002, the notification rate of mumps for children aged <5 years has remained low, mostly below 1 per 100,000 population.
There was little difference between the sexes in the number of mumps notifications or hospitalisations. Over the 4-year reporting period males accounted for 53% of notifications (male:female ratio 1.1:1) and 49% of hospitalisations (male:female ratio 1:1).
Geographical distribution
There were higher than average notification rates (Appendix 2) in the Northern Territory and Western Australia in 2008 related to mumps outbreaks in 2007–2008 among highly vaccinated young Aboriginal adults.1,58 By 2010 and 2011, notifications in all states and territories had returned to low rates of <1 noti-fication per 100,000 population. Higher notification rates were not associated with higher hospitalisation rates except in the Northern Territory (Appendix 3).
Indigenous status
There was poor recording of Indigenous status in some jurisdictions, which prevented calculation of reli-able rates of mumps notifications for Aboriginal and Torres Strait Islander people.6 However, for the period July 2005 to June 2010, higher rates of hospitalisation for mumps were reported among Indigenous people compared with other people across all age groups.6
Figure 3.8.1: Mumps notifications and hospitalisations, Australia,* 1993 to 2011,† by month of diagnosis or admissions
0
20
40
60
80
100
120
Jan1993
Jan1994
Jan1995
Jan1996
Jan1997
Jan1998
Jan1999
Jan2000
Jan2001
Jan2002
Jan2003
Jan2004
Jan2005
Jan2006
Jan2007
Jan2008
Jan2009
Jan2010
Jan2011
Num
ber
Month of diagnosis or admission
Notifications
Hospitalisations
* Note that the number of jurisdictions notifying mumps increased over the review period until July 1996 when mumps became notifiable in all states and territories. From July 1999 until June 2001, mumps was not notifiable in Queensland. Only the Australian Capital Territory, New South Wales and Victoria notified for the entire review period.
† Notifications where the month of diagnosis was between January 1993 and December 2011; hospitalisations where the month of admission was between July 1993 and December 2011.
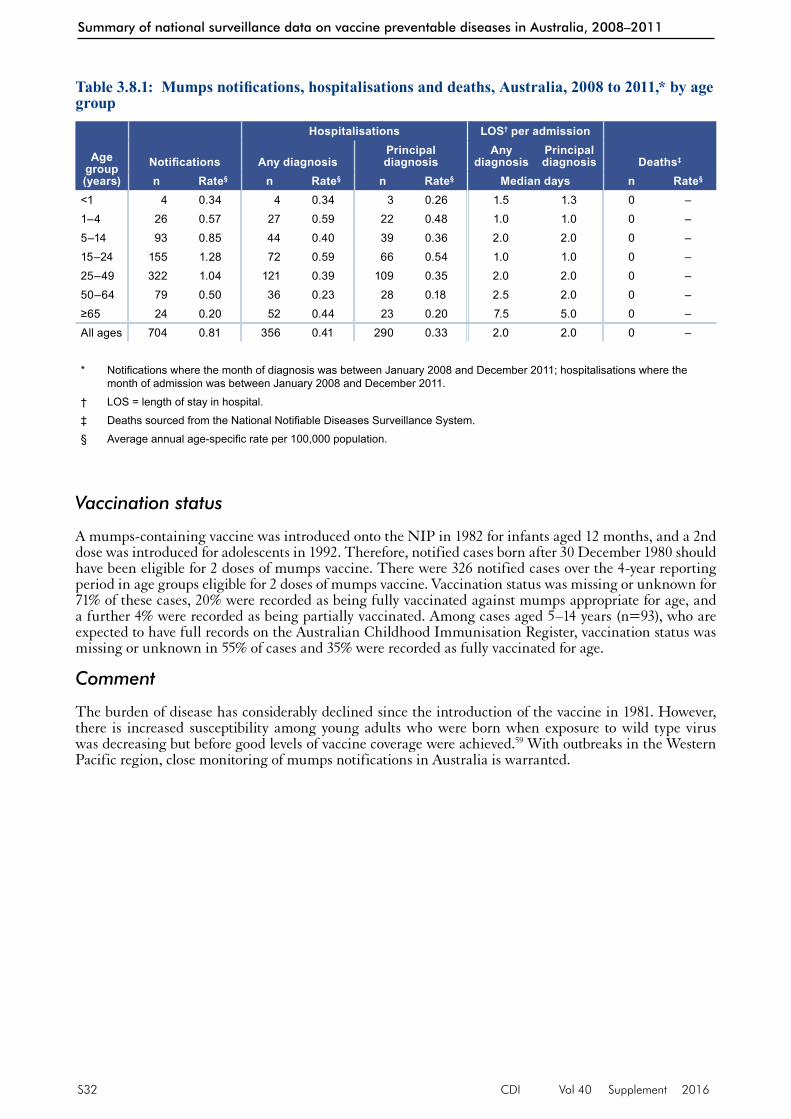
S32 CDI Vol 40 Supplement 2016
Summary of national surveillance data on vaccine preventable diseases in Australia, 2008–2011
Vaccination status
A mumps-containing vaccine was introduced onto the NIP in 1982 for infants aged 12 months, and a 2nd dose was introduced for adolescents in 1992. Therefore, notified cases born after 30 December 1980 should have been eligible for 2 doses of mumps vaccine. There were 326 notified cases over the 4-year reporting period in age groups eligible for 2 doses of mumps vaccine. Vaccination status was missing or unknown for 71% of these cases, 20% were recorded as being fully vaccinated against mumps appropriate for age, and a further 4% were recorded as being partially vaccinated. Among cases aged 5–14 years (n=93), who are expected to have full records on the Australian Childhood Immunisation Register, vaccination status was missing or unknown in 55% of cases and 35% were recorded as fully vaccinated for age.
Comment
The burden of disease has considerably declined since the introduction of the vaccine in 1981. However, there is increased susceptibility among young adults who were born when exposure to wild type virus was decreasing but before good levels of vaccine coverage were achieved.59 With outbreaks in the Western Pacific region, close monitoring of mumps notifications in Australia is warranted.
Table 3.8.1: Mumps notifications, hospitalisations and deaths, Australia, 2008 to 2011,* by age group
Age group (years)
Notifications
Hospitalisations LOS† per admission
Deaths‡Any diagnosisPrincipal diagnosis
Any diagnosis
Principal diagnosis
n Rate§ n Rate§ n Rate§ Median days n Rate§
<1 4 0.34 4 0.34 3 0.26 1.5 1.3 0 –1–4 26 0.57 27 0.59 22 0.48 1.0 1.0 0 –5–14 93 0.85 44 0.40 39 0.36 2.0 2.0 0 –15–24 155 1.28 72 0.59 66 0.54 1.0 1.0 0 –25–49 322 1.04 121 0.39 109 0.35 2.0 2.0 0 –50–64 79 0.50 36 0.23 28 0.18 2.5 2.0 0 –≥65 24 0.20 52 0.44 23 0.20 7.5 5.0 0 –All ages 704 0.81 356 0.41 290 0.33 2.0 2.0 0 –
* Notifications where the month of diagnosis was between January 2008 and December 2011; hospitalisations where the month of admission was between January 2008 and December 2011.
† LOS = length of stay in hospital.
‡ Deaths sourced from the National Notifiable Diseases Surveillance System.
§ Average annual age-specific rate per 100,000 population.

CDI Vol 40 Supplement 2016 S33
Summary of national surveillance data on vaccine preventable diseases in Australia, 2008–2011
3.9 Pertussis
HighlightsThere was a marked increase in pertussis notifications over the 4 years January 2008 to December 2011, with much higher rates than those observed since 1995.
Increased notifications were related to an Australia-wide epidemic that commenced in 2008. They are also partly explained by increased levels of testing for pertussis.
Notification rates in children aged <5 years and notified deaths in infants aged <1 year increased over the 4-year period.
Pertussis (whooping cough) is an acute illness, caused by the Bordetella pertussis bacterium, involving the respiratory tract. The illness begins with an irritating cough that gradually becomes paroxysmal and lasts for 1–2 months or longer. Paroxysms are characterised by repeated violent coughs and are followed by a characteristic crowing or high-pitched inspiratory whoop. Infants <6 months of age, adolescents and adults often have fewer classical symptoms than younger children.60
Case definition
Notifications61
Since January 2004, both confirmed cases and probable cases have been notifiable. Confirmed cases require laboratory definitive evidence, or laboratory suggestive evidence and clinical evidence, or clini-cal evidence and an epidemiological link to a laboratory confirmed case. Laboratory definitive evidence includes isolation or detection of B. pertussis by nucleic acid testing, or seroconversion in paired sera for B. pertussis using whole cell or specific B. pertussis antigen(s) in the absence of recent pertussis vac-cination. Laboratory suggestive evidence includes significant change (increase or decrease) in antibody level (IgG, IgA) to B. pertussis whole cell or B. pertussis specific antigen, or single high IgG and/or IgA titre to pertussis toxin, or single high IgA titre to whole cell B. pertussis antigen. Clinical evidence includes a coughing illness lasting 2 or more weeks or paroxysms of coughing OR inspiratory whoop OR post-tussive vomiting.
Hospitalisations and deathsThe ICD-10-AM/ICD-10 code A37 (whooping cough) was used to identify hospitalisations and deaths.
Secular trends
There were 117,973 cases of pertussis notified to the NNDSS with dates of onset in the 4 years from January 2008 to December 2011. Pertussis notifications increased markedly over this period compared with the previous review period (January 2006 to December 2007).1 Annual notification rates rose from 67.2 per 100,000 population in 2008 to 139.0 per 100,000 in 2009, 158.0 per 100,000 in 2010 and 173.3 per 100,000 in 2011 (Appendix 2). There were marked seasonal peaks in notifications over the summer and autumn of 2008–2009 and 2010–2011 (Figure 3.9.1).
Hospitalisations followed a similar pattern to notifications, with peaks in the summer and autumn months of 2008–2009 and 2010–2011 (Figure 3.9.1). Hospitalisation rates rose from 3.6 per 100,000 in 2008 to 7.0 per 100,000 in 2009 (Appendix 3).
Severe morbidity and mortality
Between January 2008 and December 2011, a total of 28,422 hospital bed days were recorded for hospital admissions for pertussis. The median length of stay per hospital admission was 3 days (Table 3.9.1).
Over the 4-year reporting period there were 9 deaths recorded in the NNDSS in pertussis cases, 8 of which were infants aged <1 year (Table 3.9.1).
From January 2008 to December 2011, the ABS Causes of Death database recorded 12 deaths with pertus-sis as the underlying cause, 5 of which were children aged <5 years.

S34 CDI Vol 40 Supplement 2016
Summary of national surveillance data on vaccine preventable diseases in Australia, 2008–2011
Figure 3.9.1: Pertussis notifications and hospitalisations, Australia, 1995 to 2011,* by month of diagnosis or admission
0
100
200
300
400
500
600
700
800
900
0
1,000
2,000
3,000
4,000
5,000
6,000
Jan1995
Jan1996
Jan1997
Jan1998
Jan1999
Jan2000
Jan2001
Jan2002
Jan2003
Jan2004
Jan2005
Jan2006
Jan2007
Jan2008
Jan2009
Jan2010
Jan2011
Num
ber o
f hos
pita
lisat
ions
Num
ber o
f not
ifica
tions
Month of diagnosis or admission
Notifications
Hospitalisations
* Notifications where the month of diagnosis was between January 1995 and December 2011; hospitalisations where the month of admission was between January 1995 and December 2011.
Table 3.9.1: Pertussis notifications, hospitalisations and deaths, Australia, 2008 to 2011,* by age group
Age group (years)
Notifications
Hospitalisations LOS† per admission
Deaths‡Any diagnosisPrincipal diagnosis
Any diagnosis
Principal diagnosis
n Rate§ n Rate§ n Rate§ Median days n Rate§
<1 3,782 322.1 2,485 211.6 2,223 189.3 3 3 8 0.681–4 10,399 228.7 453 10.0 369 8.1 1 1 0 –5–14 33,694 307.1 272 2.5 199 1.8 1 1 0 –15–24 8,609 70.9 111 0.9 61 0.5 2 2 0 –25–49 32,245 103.9 596 1.9 348 1.1 3 2 0 –50–64 17,101 109.1 457 2.9 266 1.7 4 3 0 –≥65 12,099 102.8 849 7.2 416 3.5 6 5 1 0.01All ages 117,973 135.1 5,223 6.0 3,882 4.5 3 3 9 0.01
* Notifications where the month of diagnosis was between January 2008 and December 2011; hospitalisations where the month of admission was between January 2008 and December 2011.
† LOS = length of stay in hospital.
‡ Deaths sourced from the National Notifiable Diseases Surveillance System.
§ Average annual age-specific rate per 100,000 population.

CDI Vol 40 Supplement 2016 S35
Summary of national surveillance data on vaccine preventable diseases in Australia, 2008–2011
Age and sex distribution
Notification rates in children aged 0–4 years increased sharply over the 4-year reporting period. The great-est burden of hospitalisation and mortality was borne by infants aged <1 year who accounted for 47% of hospitalisations (average annual rate of 212 per 100,000 population) and the majority of deaths (Table 3.9.1). The lowest notification and hospitalisation rates were among the 15–24 years age group.
Geographical distribution
Increasing pertussis notifications was seen across most states and territories over the 4-year reporting period (Appendix 2). South Australia had very high rates of pertussis notifications in 2009 (334 per 100,000) and 2010 (455 per 100,000), returning to the national average in 2011.
Indigenous status
Hospitalisation rates for pertussis were higher for Aboriginal and Torres Strait Islander people than for other people and varied across all age groups.6
Vaccination status
Recording of vaccination status improved over the 4-year reporting period, although in 2011, vaccination status was still unknown or missing in 70% of notified cases. In 2008, 2% of notifications were recorded as fully vaccinated for age, increasing to 22% in 2011. Three per cent of notifications were recorded as unvaccinated over the 4-year period.
Comments
Increased laboratory testing of suspected cases of pertussis in Australia may partly explain the increase in notifications of pertussis seen in the period 2008 to 2011.62,63 However, it is apparent that Australia was experiencing an epidemic of pertussis commencing in 2009 and continuing into 2011 with an appreci-able increase in hospitalisations during that period.64,65 Increased laboratory notifications of cases may also partly explain the very high percentage of cases with unrecorded vaccination status. A comparison of deaths from notification data and the ABS Causes of Death database, which is based on death certificates, revealed minor discrepancies.

S36 CDI Vol 40 Supplement 2016
Summary of national surveillance data on vaccine preventable diseases in Australia, 2008–2011
3.10 Pneumococcal disease
HighlightsNotification rates for invasive pneumococcal disease remained unchanged in the 4 years 2008 to 2011 relative to the previous 3 years (2005–2007). However, there was a small increasing trend in the number of hospitalisations.
The burden of disease in terms of hospital bed days remained high with half the hospital admissions for invasive pneumococcal disease staying for 7 days or more.
Older adults aged ≥65 years accounted for a large proportion of notifications and hospitalisations and the majority of deaths.
Notification rates were highest among children aged <5 years and remained unchanged over the period January 2008 to December 2011. A small number of deaths continued to occur each year in this age group.
Pneumococcal disease is caused by the bacterium Streptococcus pneumoniae (pneumococcus). Pneumococci can be isolated from the upper respiratory tract in adults and, more often, in children, and can spread directly from the nasopharynx to the respiratory tract, which may cause otitis media, sinusitis or pneu-monia. Pneumococci are also able to enter the bloodstream to cause invasive disease, which may manifest as meningitis, pneumonia, septicaemia without focal infection or, less commonly, infection of other sites such as pleural, peritoneal or joint fluid. Invasive pneumococcal disease (IPD) is diagnosed by detecting S. pneumoniae from blood, CSF or other sterile site. In the absence of a sterile site isolate, a presumptive diagnosis of pneumococcal pneumonia may be based on a sputum isolate of S. pneumoniae and/or clinical features such as chest X-ray appearance or prompt response to antibiotic therapy.66
Case definition
Notifications67
Only confirmed cases should be notified. Since January 2004, the national case definition of invasive pneumococcal disease has required laboratory definitive evidence for a confirmed case. Laboratory definitive evidence includes isolation of S. pneumoniae from a normally sterile site by culture, or detec-tion of S. pneumoniae from a normally sterile site by nucleic acid testing.
Invasive pneumococcal disease became a notifiable disease in 2001 in all jurisdictions, and the case definition criteria remained unchanged from 2001 to 2004.
Hospitalisations and deathsThe ICD-10-AM/ICD-10 codes G00.1 (pneumococcal meningitis), A40.3 (pneumococcal septicaemia), which together are considered to be a proxy for IPD, and J13 (pneumococcal pneumonia) were used to identify pneumococcal disease hospitalisations and deaths.
Secular trends
In the 4 years from January 2008 to December 2011, notification patterns of IPD remained steady with a small rise in 2011; however, there was a small increasing trend in hospital admissions for pneumococ-cal disease from 2006 (Figure 3.10.1). There was a marked seasonality in notified and hospitalised cases (Figure 3.10.1).
There were 6,711 notifications of IPD over the 4-year reporting period at an average annual rate of 7.7 per 100,000 population (Table 3.10.1), comparable with the rate in the previous review period of January 2006 to December 2007 (7.0 per 100,000).1
Between January 2008 and December 2011, there were 11,320 hospitalisations coded as pneumococcal men-ingitis, septicaemia or pneumonia at an average annual rate of 13.0 per 100,000 population (Table 3.10.1). During that period, seasonal peaks in admissions for pneumococcal disease were highest in 2009 and 2011 (Figure 3.10.1).
The highest notification and hospitalisation rates for IPD over the 4-year reporting period were in 2011 (Appendix 2 and 3).

CDI Vol 40 Supplement 2016 S37
Summary of national surveillance data on vaccine preventable diseases in Australia, 2008–2011
Figure 3.10.1: Pneumococcal disease notifications and hospitalisations, Australia, 1998 to 2011,* by month of diagnosis or admission
0
100
200
300
400
500
600
700
Jan1998
Jan1999
Jan2000
Jan2001
Jan2002
Jan2003
Jan2004
Jan2005
Jan2006
Jan2007
Jan2008
Jan2009
Jan2010
Jan2011
Num
ber
Month of diagnosis or admission
Notifications
Hospitalisations
* Notifications where the month of diagnosis was between January 2001 and December 2011; hospitalisations where the month of admission was between January 1998 and December 2011. Hospitalisations include pneumonia, meningitis and septicaemia.
Table 3.10.1: Pneumococcal disease notifications, hospitalisations and deaths, Australia, 2008 to 2011,* by age group
Age group (years)
Notifications
Hospitalisations LOS† per admission
Deaths‡
Pneumococcal meningitis,
septicaemia or pneumonia
Pneumococcal meningitis or septicaemia
Pneumococcal meningitis,
septicaemia or pneumonia
Pneumococcal meningitis or septicaemia
n Rate§ n Rate§ n Rate§ Median days n Rate§
<1 297 25.3 281 23.9 190 16.2 7 7 15 1.31–4 805 17.7 664 14.6 295 6.5 4 4 8 0.25–14 386 3.5 333 3.0 147 1.3 5 5 6 0.115–24 283 2.3 398 3.3 95 0.8 4 5 4 0.025–49 1,509 4.9 2,723 8.8 716 2.3 5 7 58 0.250–64 1,367 8.7 2,598 16.6 738 4.7 7 9 88 0.6≥65 2,061 17.5 4,323 36.7 1,082 9.2 8 9 304 2.6All ages 6,711 7.7 11,320 13.0 3,263 3.7 6 7 483 0.6
* Notifications where the month of diagnosis was between January 2008 and December 2011; hospitalisations where the month of admission was between January 2008 and December 2011.
† LOS = length of stay in hospital.
‡ Deaths sourced from the National Notifiable Diseases Surveillance System.
§ Average annual age-specific rate per 100,000 population.

S38 CDI Vol 40 Supplement 2016
Summary of national surveillance data on vaccine preventable diseases in Australia, 2008–2011
Severe morbidity and mortality
Between January 2008 and December 2011, there were 117,808 hospital bed days for admissions with pneumococcal disease with an average of 29,452 bed days per year. The overall median length of stay for hospitalisations coded with pneumococcal disease was 6 days (Table 3.10.1). Median length of stay for admissions with pneumococcal meningitis or septicaemia was 7 days. Median length of stay was longest for infants <1 year of age and adults aged ≥50 years.
During the 4-year reporting period there were 483 deaths recorded among notified cases (from the NNDSS) of IPD (average annual rate 0.6 per 100,000 population), with rates highest among those aged ≥65 years, followed by infants aged <1 year (Table 3.10.1).
The ABS Causes of Death data recorded a much lower number of deaths with pneumococcal disease as the underlying cause than the NNDSS records for notified IPD. For the 4 years from January 2008 to December 2011, the ABS Causes of Death database recorded 117 deaths with pneumococcal disease (ICD-10 codes A40.3, G00.1 and J13) as the underlying cause of death (average annual rate 0.13 per 100,000 population), of which 53 deaths were due to invasive pneumococcal disease (ICD-10 codes A40.3 and G00.1) (average annual rate 0.05 per 100,000).
Age and sex distribution
For the 4 years from January 2008 to December 2011, the rate of notified IPD was highest in infants aged <1 year, followed by young children aged 1–4 years and adults aged ≥65 years (Table 3.10.1). This pattern of higher rates in very young children and older adults is consistent with rates reported in previous years.
Rates of IPD notifications among children aged <5 years remained steady over the 4-year period at around 19 cases per 100,000 population. Among notified cases of IPD in children aged <5 years, there were 5 deaths recorded in the NNDSS in 2008, 2 in 2009, 10 in 2010 and 6 in 2011. The number of deaths in 2008 to 2011 in young children aged <5 years were comparable with the number seen in the previous review period (January 2006 to December 2007).1
Geographical distribution
The Northern Territory had the highest rates of notifications of IPD and hospitalisations for pneumococ-cal disease across the 4 years 2008 to 2011, although only accounting for 5% of notifications and 4.6% of hospital admissions nationally. Notification and hospitalisation rates in the other states and territories did not differ appreciably from the national average (Appendix 2 and 3).
Indigenous status
From January 2002 to December 2010, IPD notification rates for Aboriginal and Torres Strait Islander people remained much higher than for other Australians.6 From 2007 to 2010, Indigenous notification rates remained stable and the rate ratio for Indigenous versus non-Indigenous notifications was 3.6:1.
Vaccination status
From 1 January 2005, children born from January 2003 were eligible for a full course of pneumococcal vaccine funded on the NIP. Of 1,094 children notified with IPD over the 4-year reporting period who were eligible for pneumococcal vaccine and aged >6 months at disease onset, vaccination status was known for 796 (73%). Of those, 689 (87%) were reported as being fully vaccinated and 71 (9%) as partially vaccinated for age. Among fully vaccinated cases, 85% were known to be infected with a serotype not covered by the 7-valent pneumococcal conjugate vaccine and for a further 15% the serotype was unknown. Vaccination status was unknown or missing for 45% of cases aged ≥65 years. Of the 1,130 cases aged ≥65 years with known vaccination status, 654 (58%) were reported to be fully vaccinated.
Comment
Rates of invasive pneumococcal disease have remained relatively steady during the reporting period though a small increase was observed in 2011. Marked seasonality was also observed in notified and hospitalised cases. There was a large discrepancy in recorded deaths from pneumococcal disease between the ABS

CDI Vol 40 Supplement 2016 S39
Summary of national surveillance data on vaccine preventable diseases in Australia, 2008–2011
Causes of Death database and the NNDSS database, with the notifications data recording more than 4 times as many deaths as the ABS database. The majority of the additional deaths in the NNDSS data were for adults aged ≥65 years, with 60% aged ≥80 years. NNDSS data are likely to be more reliable as only laboratory confirmed cases of IPD are notified, and there is a high level of follow-up in cases in the ≥65 years age group.

S40 CDI Vol 40 Supplement 2016
Summary of national surveillance data on vaccine preventable diseases in Australia, 2008–2011
3.11 Poliomyelitis
HighlightThere were no notified or hospitalised cases or deaths due to poliomyelitis between January 2008 and December 2011.
Poliomyelitis (polio) is caused by an enterovirus, poliovirus. Infection involves the gastrointestinal tract, and may progress to the nervous system, resulting in paralysis. Acute flaccid paralysis (AFP) occurs in fewer than 1% of infections. More than 90% of infections are asymptomatic, with a minor illness charac-terised by fever, headache, malaise and nausea/vomiting occurring in about 10%. The maximum extent of paralysis is usually reached within 3–4 days of disease onset. Any paralysis still present after 60 days is likely to be permanent.68
Vaccine-associated paralytic poliomyelitis (VAPP) is acute flaccid paralysis due to a Sabin-like poliovirus (i.e. a virus similar to that used in the Sabin live attenuated oral poliovirus vaccine [OPV]). A vaccine-derived poliovirus (VDPV) is defined as having 1% to 15% nucleic acid sequence variation from the prototype Sabin strain. The variation is due to long-term (more than 1 year) virus replication after the administration of OPV. Virus replication may occur in an individual with an immunodeficiency (iVDPV) or through sustained person-to-person transmission in areas with low OPV coverage (circulating or cVDPV). VDPVs not clearly assigned to either of these categories are known as ambiguous VDPVs (aVDPV).69
Case definition
Notifications70
Since January 2004, a confirmed case has required laboratory definitive evidence and clinical evidence. Probable cases are also notifiable and require clinical evidence and that the case not be discarded as non-polio acute flaccid paralysis by the Polio Expert Committee.
Laboratory definitive evidence includes isolation of wild poliovirus (or Sabin-like poliovirus for VAPP/VDPV cases), confirmed in the National Enterovirus Reference Laboratory; or detection of wild polio-virus (or Sabin-like poliovirus for VAPP/VDPV cases) by nucleic acid testing, confirmed in the National Enterovirus Reference Laboratory.
Clinical evidence of AFP is defined as an acute onset of progressive weakness and flaccidity of one or more limbs with decreased or absent tendon reflexes in the affected limbs or bulbar palsy without other apparent cause, and without sensory or cognitive loss.
Hospitalisations and deathsThe ICD-10-AM/ICD-10 code A80 (acute poliomyelitis) was used to identify hospitalisations and deaths.
Note: This code includes VAPP and specific codes for indigenous and imported wild-type poliovirus infection. Sequelae of poliomyelitis (ICD-10 code B91) were not included in these analyses.
There were no notifications, hospitalisations or deaths reported during the 4-year period January 2008 to December 2011.

CDI Vol 40 Supplement 2016 S41
Summary of national surveillance data on vaccine preventable diseases in Australia, 2008–2011
3.12 Q fever
HighlightsThe reduction in Q fever notifications observed following the introduction of the National Q Fever Management Program in 2001 continued to be sustained over the 4 years January 2008 to December 2011.
Q fever is a zoonotic disease caused by Coxiella burnetii. It has been identified in a wide range of wild and domestic animal hosts including arthropods, birds, rodents, marsupials and livestock, but the most important reservoirs as a source for human infections are cattle, sheep and goats. Humans become infected primarily by inhaling aerosols contaminated by C. burnetii. Occupations with higher exposure risks include abattoir and farm workers and veterinarians. Windborne spread and indirect exposures in a contaminated environment account for non-occupational infections.71–73
Q fever may present with acute or chronic clinical manifestations, and there is increasing acceptance of an association with long-term sequelae, in particular the post Q fever fatigue syndrome.74 High proportions of infected persons are asymptomatic or only experience a self-limiting febrile illness.71,72
Australia has a highly effective licensed Q fever vaccine (Q-VAX; CSL Limited) that requires pre-vacci-nation screening tests.74 This vaccine is currently not recommended for children aged less than 15 years.74
Case definition
Notifications75
Only confirmed cases should be notified. Since January 2004, the national case definition of Q fever has included laboratory definitive evidence or laboratory suggestive evidence AND clinical evidence. Laboratory definitive evidence includes detection of C. burnetii by nucleic acid testing, or seroconversion or significant increase in antibody level to Phase II antigen in paired sera tested in parallel in the absence of recent Q fever vaccination, or detection of C. burnetii by culture. Laboratory suggestive evidence includes detection of specific IgM in the absence of recent Q fever vaccination. Clinical evidence includes a clinically compatible disease.
The case definition prior to 2004 included a 4-fold or greater change in serum (CF) antibody titre to Phase II antigen of C. burnetii, or a 4-fold or greater change in enzyme-linked immunosorbent assay (ELISA) antibody titre to Phase I or Phase II antigens of C. burnetii, or an IgM fluorescent antibody titre of at least 1:160 during the convalescent phase of the illness (i.e. 10 days or more after onset), or in chronic infections (e.g. endocarditis), elevated (CF) IgG or IgA titres to C. burnetii Phase I antigen, or isolation of C. burnetii from a clinical specimen.
Hospitalisations and deathsThe ICD-10-AM/ICD-10 code A78 (Q fever) was used to identify hospitalisations and deaths.
Secular trends
From January 2008 to December 2011, there were 1,376 cases of Q fever reported to the NNDSS (aver-age annual rate 1.6 per 100,000) (Table 3.12.1). There were 652 hospital admissions with an ICD-10-AM diagnosis code for Q fever (average annual rate 0.8 per 100,000) (Table 3.12.1). The number of cases noti-fied per month was lower in the period 2008 to 2011 (median 28.5 per month, range 16–43) than in the previous review period of January 2006 to December 2007 (median 35 per month) (Figure 3.12.1). The median number of hospitalisations per month from January 2008 to December 2011 was 13 (range 7–23). The overall number of hospital admissions per month has remained unchanged since 2005 (Figure 3.12.1).
Severe morbidity and mortality
There were 4,698 bed days for hospital admissions with an ICD-10 AM code for Q fever over the period January 2008 to December 2011 (1,117 in 2008, 1,004 in 2009, 1,249 in 2010 and 1,328 in 2011). The median length of stay was 4 days. Q fever was the principal diagnosis in 80% of these admissions (Table 3.12.1).

S42 CDI Vol 40 Supplement 2016
Summary of national surveillance data on vaccine preventable diseases in Australia, 2008–2011
Figure 3.12.1: Q fever notifications and hospitalisations, Australia, 1993 to 2011,* by month of diagnosis or admission
0
10
20
30
40
50
60
70
80
90
100
Jan1993
Jan1994
Jan1995
Jan1996
Jan1997
Jan1998
Jan1999
Jan2000
Jan2001
Jan2002
Jan2003
Jan2004
Jan2005
Jan2006
Jan2007
Jan2008
Jan2009
Jan2010
Jan2011
Num
ber
Month of diagnosis or admission
Notifications
Hospitalisations
* Notifications where the month of diagnosis was between January 1993 and December 2011; hospitalisations where the month of admission was between July 1993 and December 2011.
Table 3.12.1: Q fever notifications, hospitalisations and deaths, Australia, 2008 to 2011,* by age group
Age group (years)
Notifications
Hospitalisations LOS† per admission
Deaths‡Any diagnosisPrincipal diagnosis
Any diagnosis
Principal diagnosis
n Rate§ n Rate§ n Rate§ Median days n Rate§
<1 0 – 0 – 0 – – – 0 –1–4 6 0.13 3 0.07 3 0.07 4 4 0 –5–14 20 0.18 8 0.07 7 0.06 2 2 0 –15–24 142 1.17 68 0.56 55 0.45 3 3 0 –25–49 625 2.01 266 0.86 230 0.74 4 4 0 –50–64 472 3.01 205 1.31 169 1.08 6 5 0 –≥65 111 0.94 102 0.87 61 0.52 7 7 0 –All ages 1,376 1.58 652 0.75 525 0.60 4 4 0 –
* Notifications where the month of diagnosis was between January 2008 and December 2011; hospitalisations where the month of admission was between January 2008 and December 2011.
† LOS = length of stay in hospital.
‡ Deaths sourced from the National Notifiable Diseases Surveillance System.
§ Average annual age-specific rate per 100,000 population.
Over the 4-year reporting period there were no deaths recorded among cases of Q fever notified to the NNDSS and the ABS Causes of Death database recorded 1 death from Q fever.

CDI Vol 40 Supplement 2016 S43
Summary of national surveillance data on vaccine preventable diseases in Australia, 2008–2011
Age and sex distribution
Over the period January 2008 to December 2011, the highest notification and hospitalisation rates for Q fever were among adults aged 50–64 years (Table 3.12.1).
The number of notifications and hospital admissions were considerably lower for females. The average male:female ratio over the 4-year period was 2.7:1 for notifications and 3.0:1 for hospitalisations.
There were no notifications or hospitalisations for infants aged <1 year over the 4-year reporting period and notification rates for children aged <5 years remained very low.
Geographical distribution
The majority of notifications for Q fever occurred in Queensland (44.2%) and New South Wales (43.6%) (Appendix 2). Half of hospitalisations occurred in Queensland (49.6%) and one-third in New South Wales (32.2%). Queensland had the highest rate of notifications and hospital admissions in each of the 4 years from January 2008 to December 2011 (average annual rate of 3.5 per 100,000 and 1.9 per 100,000, respectively).
Indigenous status
Indigenous status was recorded as unknown for 29% of notifications; 3% as Indigenous and 68% as non-Indigenous during this reporting period.
Vaccination status
Of notified cases of Q fever, 94% had unknown or missing vaccination status. Only 3 cases over the 4-year reporting period were recorded as fully vaccinated for Q fever.
Comment
The Australian Government funded the National Q Fever Management Program (NQFMP) between 2001 and 2006 for states and territories to provide free vaccine to at-risk occupational groups, such as abattoir workers.76 The reduction in Q fever notifications observed following introduction of the NQFMP continued to be sustained over the 2008 to 2011 period.

S44 CDI Vol 40 Supplement 2016
Summary of national surveillance data on vaccine preventable diseases in Australia, 2008–2011
3.13 Rotavirus
HighlightsSince the funding of rotavirus vaccine on the National Immunisation Program in 2007 there has been a substantial drop in the number of hospitalisations due to rotavirus.
Rotavirus is a non-enveloped virus that is the major cause of acute gastroenteritis in young children and infants. Infection can be asymptomatic, cause mild to moderate gastroenteritis, or severe gastroenteritis with dehydration requiring hospitalisation.77 Virtually all children worldwide are infected with rotavirus by 5 years of age, but severe disease occurs most commonly in those aged 6 months to 2 years.78 However, disease does occur in all age groups. Rotaviruses are primarily spread by faecal–oral transmission. Infection with rotavirus confers some protection against subsequent serious disease.79 Rotaviruses are typed based on 2 surface proteins, VP7 (G protein) and VP4 (P protein). Viruses that contain either G1, 2, 3, 4 or 9 (and either P1a or P1b) are the 5 most common virus types currently circulating in Australia.80–83
Case definitionNational rotavirus enteritis notification data are not available as rotavirus is not a nationally notifiable disease. It is notifiable in all jurisdictions except Victoria and the Australian Capital Territory but notifica-tion criteria vary.
Hospitalisations and deathsThe ICD-10-AM/ICD-10 code A08.0 (rotavirus enteritis) was used to identify hospitalisations and deaths.
Secular trends
In the 4 years from January 2008 to December 2011, there was a substantial decrease in the number of monthly hospitalisations with an ICD-10-AM code for rotavirus enteritis (Figure 3.13.1). The fall in hospi-talisations began in 2007 and by 2008 the large seasonal peaks seen during the winter months in previous years were substantially reduced.
There were 5,751 hospital admissions over the 4 years with an ICD-10-AM code of rotavirus enteritis. The average annual hospitalisation rate was 6.6 per 100,000 population, one-third the rate reported for the previous review period of July 2005 to June 20071 (20.9 per 100,000) (Table 3.13.1). The biggest peak in the number of hospitalisations per month for the 4-year period was 299 in September 2010, much lower than the previous peak of 1,141 hospitalisations in August 2006.
Severe morbidity and mortality
During the 4-year reporting period, rotavirus was recorded as the principal diagnosis in 4,220/5,751 (73%) hospitalisations with rotavirus enteritis. The number of bed days and median length of stay were calcu-lated for those hospitalisations with a principal diagnosis of rotavirus. Among those hospitalisations, there were 11,586 bed days recorded (average 2,896 bed days per year) with a median length of stay of 2 days (Table 3.13.1).
There were 1–4 deaths recorded on the ABS Causes of Death database with an underlying cause of rota-virus enteritis (ICD-10 code, A08) for the 4 years from January 2008 to December 2011, all in adults aged ≥65 years. In this same 4-year period, 4 deaths in hospital were recorded in the national hospitalisa-tion database with a principal diagnosis of rotavirus enteritis, 3 of which were in adults aged ≥65 years (Table 3.13.1).
Age and sex distribution
During the 4-year reporting period, rates of hospitalisations with an ICD-10-AM code for rotavirus as a prin-cipal diagnosis was highest among infants aged <1 year, followed by children aged 1–4 years (Table 3.13.1). Hospitalisation rates in these age groups were over 10 times the national average and accounted for 75% of hospitalisations with a principal diagnosis of rotavirus infection. There were slightly more males than females hospitalised with a principal diagnosis of rotavirus (male to female ratio 1.2:1).

CDI Vol 40 Supplement 2016 S45
Summary of national surveillance data on vaccine preventable diseases in Australia, 2008–2011
Figure 3.13.1: Rotavirus hospitalisations for all ages, Australia, 1994 to 2011,* by month of admission
0
200
400
600
800
1,000
1,200
Jan1994
Jan1995
Jan1996
Jan1997
Jan1998
Jan1999
Jan2000
Jan2001
Jan2002
Jan2003
Jan2004
Jan2005
Jan2006
Jan2007
Jan2008
Jan2009
Jan2010
Jan2011
Num
ber
Month of admission
* Hospitalisations where the month of admission was between January 1994 and December 2011.
Table 3.13.1: Rotavirus hospitalisations and deaths, Australia, 2008 to 2011,* by age group
Age group (years)
Hospitalisations
LOS† per admission
(days)
Deaths‡,§Any diagnosis Principal diagnosisPrincipal diagnosis
n Rate|| n Rate|| Median n Rate||
<1 1,306 111.2 759 64.6 2.0 0 –1–4 2,829 62.2 2,390 52.6 2.0 1 0.025–14 739 6.7 624 5.7 2.0 0 –15–24 68 0.6 38 0.3 2.0 0 –25–49 144 0.5 98 0.3 2.0 0 –50–64 141 0.9 80 0.5 3.0 0 –≥65 524 4.5 231 2.0 5.0 3 0.03All ages 5,751 6.6 4,220 4.8 2.0 4 0.00
* Hospitalisations where the month of admission was between January 2008 and December 2011.
† LOS = length of stay in hospital.
‡ Principal diagnosis (hospitalisations).
§ Deaths sourced from Australian Institute of Health and Welfare National Hospital Morbidity Database.
|| Average annual age-specific rate per 100,000 population.

S46 CDI Vol 40 Supplement 2016
Summary of national surveillance data on vaccine preventable diseases in Australia, 2008–2011
Geographical distribution
Over the 4 years January 2008 to December 2011, the Northern Territory recorded the highest rate of hospitalisations with rotavirus gastroenteritis, at nearly 8 times the Australian average (annual average rate 52.5 per 100,000 population) (Appendix 3). Victoria recorded the lowest rate of hospitalisations at half the Australian average.
Indigenous status
Following the introduction of the rotavirus vaccine in 2007, there was a downward trend in hospitalisation rates for Aboriginal and Torres Strait Islander children aged <5 years.6 The rate of reduction in hospitalisa-tions for rotavirus among Aboriginal and Torres Strait Islander infants has been less than for other children and hospitalisation rates for Indigenous children remain much higher than for other children.6
Comment
Since the national rotavirus vaccination program began in July 2007, there has been a decline in hospitali-sations particularly in children aged <5 years.84 Prior to the program, there were thousands of hospitalisa-tions and several deaths reported.85 One death in an Indigenous child from the Northern Territory in 2009 was recorded in the national hospitalisation database. This case was not recorded in the ABS Causes of Death database, potentially due to the underlying cause of death not being deemed to be rotavirus enteritis.
CDI Vol 40 Supplement 2016 S47
Summary of national surveillance data on vaccine preventable diseases in Australia, 2008–2011
3.14 Rubella
HighlightsNotification and hospitalisation rates for rubella remained low over the reporting period January 2008 to December 2011.
Highest notification rates were among adults aged 25–49 years.
Rubella is caused by the rubella virus (family Togaviridae). Rubella is only found in humans and is trans-mitted by aerosol droplets. It is usually a mild febrile viral disease characterised by a discrete maculo-papular rash, conjunctivitis, sore throat, headache, nausea, and postauricular, suboccipital and cervical lymphadenopathy.86 However, subclinical infection occurs in up to 50% of cases. Arthralgia and arthritis may occur in up to 70% of infected adult females, but is uncommon in younger females and males. More severe complications, such as encephalitis, are rare. Rubella is important because if a primary infection is acquired by a woman in the first trimester of pregnancy, as fetal infection occurs in 80% of cases, which is associated with spontaneous abortion or congenital rubella syndrome (CRS) which develops in 85% of surviving infants. CRS involves multiple serious defects, including cataract, retinopathy, deafness, heart defects and neurological deficits.86
Case definition
Notifications87
Since January 2004, the case definition has separated confirmed cases from probable cases. Confirmed cases are only identified by laboratory definitive evidence. Prior to 2004, clinical evidence was sufficient to notify a case. Since 2004, clinical evidence must be supported by epidemiological OR laboratory suggestive evidence to notify a probable case.
Hospitalisations and deathsThe ICD-10-AM/ICD-10 code B06 (rubella [German measles]) was used to identify hospitalisations and deaths for rubella and P35.0 (congenital rubella syndrome) for hospitalisations and deaths from CRS.
Secular trends
In the 4 years from January 2008 to December 2011, there were 165 notified cases of rubella, an average annual notification rate of 0.2 per 100,000 population (Table 3.14.1). Rubella notifications have remained consistently low since 2004 following a marked decline in the late 1990s and early 2000s (Figure 3.14.1).
The number of hospitalisations for rubella each year remained very low (range 6–9 admissions per year), at an average annual hospitalisation rate of 0.03 per 100,000 population (Table 3.14.1 and Appendix 3).
Severe morbidity and mortality
From January 2008 to December 2011, there were 156 hospital bed days recorded for hospitalisations with an ICD-10-AM code for rubella with a median length of stay of 2 days (Table 3.14.1).
There were no deaths from either rubella or CRS recorded in the NNDSS over the 4 years from January 2008 to December 2011. There were no deaths recorded on the ABS Causes of Death database with rubella (ICD-10 code B06) as the underlying cause.
Age and sex distribution
Adults aged 25–49 years accounted for almost two-thirds (63%) of the rubella notifications for the 4-year reporting period and had the highest rates of notifications (0.34 per 100,000 population) (Table 3.14.1).
Rates of rubella notifications for children <5 years of age have remained very low since 2003 and continued to fall over the 4 years from January 2008 to December 2011.

S48 CDI Vol 40 Supplement 2016
Summary of national surveillance data on vaccine preventable diseases in Australia, 2008–2011
Hospitalisation rates for rubella for the 4-year period were highest for infants <1 year of age (Table 3.14.1).
The overall male:female ratio for notifications for the 4-year reporting period was 1.4:1. The overall male:female ratio for hospitalisations for the 4-year period was 1.3:1.
Figure 3.14.1: Rubella notifications and hospitalisations, Australia, 1993 to 2011,* by month of diagnosis or admission
0
10
20
30
40
50
60
70
80
90
0
200
400
600
800
1,000
1,200
1,400
Jan1993
Jan1994
Jan1995
Jan1996
Jan1997
Jan1998
Jan1999
Jan2000
Jan2001
Jan2002
Jan2003
Jan2004
Jan2005
Jan2006
Jan2007
Jan2008
Jan2009
Jan2010
Jan2011
Num
ber o
f hos
pita
lisat
ions
Num
ber o
f not
ifica
tions
Month of diagnosis or admission
Notifications
Hospitalisations
0
5
10
15
20
25
30
0
10
20
30
40
50
60
70
Jan-
02
Jan-
03
Jan-
04
Jan-
05
Jan-
06
Jan-
07
Jan-
08
Jan-
09
Jan-
10
Jan-
11
Note: varying scales between notifications and hospitalisations.
* Notifications where the month of diagnosis was between January 1993 and December 2011; hospitalisations where the month of admission was between July 1993 and December 2011.
Table 3.14.1: Rubella notifications, hospitalisations and deaths, Australia, 2008 to 2011, by age group
Age group (years)
Notifications
Hospitalisations LOS† per admission
Deaths‡Any diagnosisPrincipal diagnosis
Any diagnosis
Principal diagnosis
n Rate§ n Rate§ n Rate§ Median days n Rate§
<1 1 0.09 5 0.43 5 0.43 1.0 1.0 0 –1–4 5 0.11 3 0.07 2 0.04 2.0 1.5 0 –5–14 5 0.05 0 – 0 – – – 0 –15–24 35 0.29 8 0.07 5 0.04 3.0 4.0 0 –25–49 104 0.34 9 0.03 3 0.01 3.0 4.0 0 –50–64 14 0.09 3 0.02 0 – 5.0 – 0 –≥65 1 0.01 2 0.02 0 – 20.0 – 0 –All ages 165 0.19 30 0.03 15 0.02 2.0 1.0 0 –
* Notifications where the month of diagnosis was between January 2008 and December 2011; hospitalisations where the month of admission was between January 2008 and December 2011.
† LOS = length of stay in hospital.
‡ Deaths sourced from the National Notifiable Diseases Surveillance System.
§ Average annual age-specific rate per 100,000 population.

CDI Vol 40 Supplement 2016 S49
Summary of national surveillance data on vaccine preventable diseases in Australia, 2008–2011
Geographical distribution
Notification rates for rubella remained low for all states and territories for each year from 2008 to 2011 (range 0–0.6 per 100,000) (Appendix 2). Hospitalisation rates for rubella in each state and territory was very small and between 2009 and 2011 the majority of jurisdictions did not record any hospitalisations for rubella (Appendix 3).
Indigenous status
Over the 4 years from January 2008 to December 2011, there was 1 notified case of rubella identified in Aboriginal or Torres Strait Islander person. However, Indigenous status was recorded as unknown for 36/165 (22%) notified cases of rubella.
Vaccination status
Vaccination status should be completed in the NNDSS for all notifications of rubella in women of child-bearing age (15–45 years). There were 55 cases of rubella among women aged 15–44 years between January 2008 and December 2011, in 43 (78%) of which vaccination status was missing or recorded as unknown. Seven cases were recorded as being fully vaccinated (12.7%) and 1 case was partially vaccinated for age. There were 21 notified cases of rubella in young women aged 15–24 years, 18 (86%) of which had missing or unknown vaccination status.
Comment
The epidemiology of rubella indicates that Australia may be in a position to achieve the status of elimina-tion of rubella in the near future.88
S50 CDI Vol 40 Supplement 2016
Summary of national surveillance data on vaccine preventable diseases in Australia, 2008–2011
3.15 Tetanus
HighlightsThe number of notifications and hospitalisations for tetanus remained low over the period January 2008 to December 2011.
Tetanus is a disease caused by an exotoxin of the Clostridium tetani bacterium, which grows anaerobically at the site of an injury. The disease is characterised by painful muscle contractions, primarily of the mas-seter and neck muscles, secondarily of the trunk muscles. The case-fatality rate ranges from 10% to 90%, with the highest case-fatality rates in infants and the elderly.89
Case definition
Notifications90
Only confirmed cases should be notified. Since January 2004, a confirmed case has required either laboratory definitive evidence or clinical evidence. Laboratory definitive evidence includes isolation of C. tetani from a wound in a compatible clinical setting and prevention of positive tetanospasm in a mouse test of such an isolate using specific tetanus antitoxin.
A clinically compatible illness without other apparent cause is considered as clinical evidence.
Prior to 2004, the case definition for notifications was a clinically compatible illness without other apparent cause, with or without a history of injury, and with or without laboratory evidence of the organism or its toxin.
Hospitalisations and deathsThe ICD-10-AM/ICD-10 codes A33 (tetanus neonatorum), A34 (obstetrical tetanus) and A35 (other tetanus) were used to identify hospitalisations and deaths.
Secular trends
In the 4 years from January 2008 to December 2011, there were 12 notifications of tetanus (an average annual notification rate of 0.01 per 100,000) (Table 3.15.1). The annual number of notifications for teta-nus has remained stable since 2005 (Figure 3.15.1). There were 80 hospital admissions for tetanus from January 2008 to December 2011 (Table 3.15.1). The annual number of hospital admissions fluctuated over the 4-year reporting period, with peaks in 2008 and 2011 (Figure 3.15.1).
Severe morbidity and mortality
There were 1,264 hospital bed days recorded for hospitalisations with an ICD-10-AM code for tetanus. None of these were recorded as obstetric tetanus (A34). The median length of stay in hospital was 6 days; adults aged ≥65 years had a longer median stay of 15 days.
There was 1 death from tetanus recorded in the NNDSS in the 4-year reporting period (Table 3.15.1). The ABS Causes of Death database recorded 1–4 deaths with tetanus as the underlying cause for the 4 years from January 2008 to December 2011, all deaths were in people aged ≥65 years.
Age and sex distribution
During the 4-year reporting period, the majority of both notified cases (8/12, 67%) and hospital admissions (43/80, 54%) were aged ≥65 years. There was 1 hospitalisation of an infant aged <1 year; all other notifica-tions and hospitalisations were aged ≥15 years (Table 3.15.1). There were no differences in the number of notifications by sex (male:female ratio 1:1) and there were fewer hospitalisations for males than females (male:female ratio 0.8:1).

CDI Vol 40 Supplement 2016 S51
Summary of national surveillance data on vaccine preventable diseases in Australia, 2008–2011
Figure 3.15.1: Tetanus notifications and hospitalisations, Australia, 1998 to 2011,* by year of diagnosis or admission
0
10
20
30
40
50
1998
1999
2000
2001
2002
2003
2004
2005
2006
2007
2008
2009
2010
2011
Num
ber
Year of diagnosis or admission
Notifications
Hospitalisations
* Notifications where the year of diagnosis was between 1998 and 2011; hospitalisations where the year of admission was between 1998 and 2011.
Table 3.15.1: Tetanus notifications, hospitalisations and deaths, Australia, 2008 to 2011,* by age group
Age group (years)
Notifications
Hospitalisations LOS† per admission
Deaths‡Any diagnosisPrincipal diagnosis
Any diagnosis
Principal diagnosis
n Rate§ n Rate§ n Rate§ Median days n Rate§
<1 0 – 1 0.09 0 – 30.0 – 0 –1–4 0 – 0 – 0 – – – 0 –5–14 0 – 0 – 0 – – – 0 –15–24 1 0.01 6 0.05 3 0.02 3.0 3.0 0 –25–49 1 0.00 16 0.05 12 0.04 1.0 1.0 0 –50–64 2 0.01 14 0.09 9 0.06 1.5 1.0 0 –≥65 8 0.07 43 0.37 30 0.25 15.0 13.5 1 0.01All ages 12 0.01 80 0.09 54 0.06 6.0 3.0 1 0.00
* Notifications where the month of diagnosis was between January 2008 and December 2011; hospitalisations where the month of admission was between January 2008 and December 2011.
† LOS = length of stay in hospital.
‡ Deaths sourced from the National Notifiable Diseases Surveillance System.
§ Average annual age-specific rate per 100,000 population.

S52 CDI Vol 40 Supplement 2016
Summary of national surveillance data on vaccine preventable diseases in Australia, 2008–2011
Geographical distribution
Notification and hospital admission rates for tetanus were too low to identify any trends across the states and territories (Appendix 2 and 3).
Indigenous status
All notified cases were recorded as non-Indigenous persons.
Vaccination status
Vaccination status was missing or unknown for 58% (7/12) of notified cases while 17% (2/12) were partially vaccinated and 25% (3/12) were unvaccinated.
Comment
In Australia, tetanus remains largely a disease of adults. Hospitalisation rates are considerably higher than notification rates, as in previous reports, which could be due to multiple hospital admissions or inter-hospital transfers for individual cases and coding errors.91

CDI Vol 40 Supplement 2016 S53
Summary of national surveillance data on vaccine preventable diseases in Australia, 2008–2011
3.16 Varicella-zoster virus infection
HighlightsThe number of varicella (chickenpox) hospitalisations fell in 2008 relative to the previous 2 years, and remained low over the remainder of the 4-year period January 2008 to December 2011. This was most likely due to the introduction of the varicella vaccine onto the NIP in late 2005.
Since 1993 there has been a trend of increasing numbers of hospitalisations with a diagnosis of herpes zoster and this increasing trend continued over the period 2008 to 2011.
The varicella-zoster virus (VZV) causes 2 distinct illnesses: varicella (chickenpox) following primary infec-tion and herpes zoster (shingles) following reactivation of latent virus. Varicella is a highly contagious infection with an incubation period of 10–21 days, after which a characteristic rash appears. Acute varicella may be complicated by secondary bacterial skin infections, haemorrhagic complications, encephalitis and pneumonia.92,93
Herpes zoster or shingles is a sporadic disease, caused by reactivation of latent VZV in sensory nerve gan-glia. It is characterised by severe pain with dermatomal distribution, sometimes followed by post-herpetic neuralgia, which can be chronic and debilitating, particularly in the elderly.94,95
Case definition
NotificationsVaricella, herpes zoster and unspecified VZV-related disease have been notifiable since 2006 in all states and territories except New South Wales.
Chickenpox96
Since August 2008, the national case definition for confirmed chickenpox has included laboratory definitive evidence AND clinical evidence, or clinical evidence AND epidemiological evidence.
A probable case of chickenpox includes clinical evidence only.
Shingles97
For confirmed cases of herpes zoster (shingles), laboratory definitive evidence AND clinical evidence, or clinical evidence AND epidemiological evidence are required.
A probable case of shingles requires clinical evidence only.
Unspecified varicella98 is defined by laboratory definitive evidence of VZV in the absence of clinical evidence.
Notifications from states and territories except for New South Wales started in the second half of 2008. The first full calendar year with complete data for the 7 notifying states and territories was 2009. Therefore, notification data are available from 2009 to 2011 for all states and territories except New South Wales. The methods of reporting vary among jurisdictions, with >50% of notifications not speci-fied as either varicella or zoster. Notification data therefore are not reported here.
Hospitalisations and deathsThe ICD-10-AM/ICD-10 code B01 (varicella [chickenpox]) was used to identify varicella hospitalisations and deaths and B02 (zoster [shingles]) was used to identify herpes zoster hospitalisations and deaths.
Secular trends, varicella and herpes zoster hospitalisations
In the 4 years from January 2008 to December 2011, there were 3,325 hospital admissions with an ICD-10-AM code for varicella (chickenpox) (average annual rate of 3.8 per 100,000 population) (Table 3.16.1). The number of hospitalisations per month for varicella (chickenpox) fell in 2008 relative to the previous 2 years and remained low over the remainder of the 4-year reporting period with less seasonal fluctuation in hospitalisations per month (Figure 3.16.1).

S54 CDI Vol 40 Supplement 2016
Summary of national surveillance data on vaccine preventable diseases in Australia, 2008–2011
Monthly hospital admissions with an ICD-10-AM code for herpes zoster (shingles) rose steadily over the 4-year reporting period, continuing an increasing trend in the number of zoster hospitalisations observed since 1993 (Figure 3.16.1).
Figure 3.16.1: Varicella and herpes zoster hospitalisations, Australia, 1993 to 2011,* by month of admission
0
100
200
300
400
500
600
Jan1993
Jan1994
Jan1995
Jan1996
Jan1997
Jan1998
Jan1999
Jan2000
Jan2001
Jan2002
Jan2003
Jan2004
Jan2005
Jan2006
Jan2007
Jan2008
Jan2009
Jan2010
Jan2011
Num
ber
Month of admission
Varicella
Zoster
* Hospitalisations where the month of admission was between July 1993 and December 2011.
Table 3.16.1: Varicella hospitalisations and deaths, Australia, 2008 to 2011,* by age group
Age group (years)
Hospitalisations LOS† per admission
Deaths‡Any diagnosis Principal diagnosisAny
diagnosisPrincipal diagnosis
n Rate§ n Rate§ Median days n Rate||
<1 224 19.1 180 15.3 2 2 0 –1–4 302 6.6 197 4.3 2 1 1 0.025–14 494 4.5 331 3.0 2 2 1 0.0115–24 318 2.6 218 1.8 2 2 0 –25–49 927 3.0 633 2.0 3 3 2 0.0150–64 337 2.1 165 1.1 6 4 1 0.01≥65 723 6.1 286 2.4 10 7 15 0.13All ages 3,325 3.8 2,010 2.3 3 3 20 0.02
* Hospitalisations where the month of admission was between January 2008 and December 2011.
† LOS = length of stay in hospital.
‡ Deaths sourced from the Australian Institute of Health and Welfare National Hospital Morbidity Database.
§ Average annual age-specific rate per 100,000 population.
|| Principal diagnosis.

CDI Vol 40 Supplement 2016 S55
Summary of national surveillance data on vaccine preventable diseases in Australia, 2008–2011
Severe morbidity and mortality, varicella
From January 2008 to December 2011, there were 26,291 hospital bed days recorded for admissions with an ICD-10-AM code for chickenpox, with a median length of stay per hospital admission of 3 days (Table 3.16.1). The median length of stay was at least twice as long for adults aged ≥50 years than for younger patients.
From January 2008 to December 2011, there were 20 deaths recorded in hospitalised patients with a prin-cipal diagnosis of chickenpox (Table 3.16.1). Three-quarters of these deaths were in adults aged ≥65 years. For the same 4-year period, the ABS Causes of Death database recorded 25 deaths with varicella (chicken-pox) as the underlying cause.
Age and sex distribution, varicella
During the 4-year reporting period, the highest hospitalisation rate for varicella was among infants aged <1 year, followed by children aged 1–4 years (Table 3.16.1).
There were slightly more admissions for males than females over the 4 years (male:female ratio 1:0.9).
Geographical distribution, varicella
The Northern Territory had higher rates of hospital admissions for chickenpox than other jurisdictions; however, the Northern Territory only accounted for 2% of hospitalisations for chickenpox (Appendix 3). New South Wales accounted for 32% of admissions with an ICD-10-AM code for chickenpox.
Severe morbidity and mortality, herpes zoster
For hospitalisations with an ICD-10-AM code for herpes zoster, 247,761 hospital bed days (average 61,940 per year) were recorded in the 4 years from January 2008 to December 2011. The median length of stay was 6 days for any herpes zoster diagnosis and 4 days for a principal diagnosis of herpes zoster (Table 3.16.2). Over the 4-year reporting period there were 98 deaths recorded in hospitalised patients with a principal diagnosis of herpes zoster; nearly all of these deaths (n=93) were in the ≥65 years age group (Table 3.16.2).
For the same 4-year period, the ABS Causes of Death database recorded 107 deaths with zoster (herpes zoster, shingles) as the underlying cause; nearly all were aged ≥65 years.
Age and sex distribution, herpes zoster
During the 4-year reporting period the highest hospitalisation rate for herpes zoster was among older adults ≥65 years (Table 3.16.2). There were more herpes zoster admissions for females than males (male:female ratio 1:1.4) and the higher ratio of females to males was constant across the 4 years.
Geographical distribution, herpes zoster
The Northern Territory had lower rates of hospital admissions for herpes zoster than other jurisdictions (average rate 16.6 per 100,000), while South Australia had slighter higher hospitalisation rates than other jurisdictions (average rate 33.0 per 100,000). However, New South Wales and Victoria accounted for nearly 60% of hospital admissions for herpes zoster (Appendix 3).
Indigenous status, varicella and herpes zoster
From July 2005 to June 2010, rates of hospital separations for varicella and herpes zoster were higher for Aboriginal and Torres Strait Islander people than for other people.6
Comment
The reduction in hospitalisations documented over this 4-year period was most likely due to the intro-duction of the varicella vaccine onto the NIP in late 2005 during this reporting period.99 Herpes zoster hospitalisations continue on a long-term increasing trend.

S56 CDI Vol 40 Supplement 2016
Summary of national surveillance data on vaccine preventable diseases in Australia, 2008–2011
Table 3.16.2: Zoster hospitalisations and deaths, Australia, 2008 to 2011,* by age group
Age group (years)
Hospitalisations LOS† per admission
Deaths‡Any diagnosis Principal diagnosisAny
diagnosisPrincipal diagnosis
n Rate§ n Rate§ Median days n Rate§
0 11 0.9 6 0.5 3 3.5 0 –1–4 56 1.2 31 0.7 3 2.0 0 –5–14 282 2.6 196 1.8 3 3.0 0 –15–24 356 2.9 190 1.6 3 3.0 0 –
25–49 1,941 6.3 985 3.2 4 3.0 2 0.0150–64 3,529 22.5 1,626 10.4 4 3.0 3 0.02≥65 16,773 142.5 6,614 56.2 7 5.0 93 0.79All ages 22,948 26.3 9,648 11.0 6 4.0 98 0.11
* Hospitalisations where the month of admission was between January 2008 and December 2011.
† LOS = length of stay in hospital.
‡ Deaths sourced from the Australian Institute of Health and Welfare National Hospital Morbidity Database.
§ Average annual age-specific rate per 100,000 population.

CDI Vol 40 Supplement 2016 S57
Summary of national surveillance data on vaccine preventable diseases in Australia, 2008–2011
Appendix 1. Charts of historical notification data
Selected vaccine preventable diseases
Figure A.2: Hepatitis A, 1952 to 2011*
0
20
40
60
80
100
120
140
1952
1957
1962
1966
-67
1971
1976
1981
1986
1991
1996
2001
2006
2011
Not
ifica
tions
per
100
,000
pop
ulat
ion
Year
2005 - HAV vaccination program commenced for Aboriginal and
Torres Strait Islander children in the NT, Qld, WA and SA
1994 - HAV vaccine approved
* Data are reported by calendar year from 1917–1963 and 1970–2011 and by financial year 1963/1964–1969/1970.
Source: National Notifiable Diseases Surveillance System; and Hall R. Notifiable disease surveillance, 1917 to 1991. Commun Dis Intell 1993;17(11):226–236.
Figure A.1: Diphtheria, 1917 to 2011*
0
50
100
150
200
250
300
350
400
45019
17
1922
1927
1932
1937
1942
1947
1952
1957
1962
1966
-67
1971
1976
1981
1986
1991
1996
2001
2006
2011
Not
ifica
tions
per
100
,000
pop
ulat
ion
Year
1953 - DTP vaccination introduced
1932 - Diphtheria vaccination commenced
* Data are reported by calendar year from 1917–1963 and 1970–2011 and by financial year 1963/1964–1969/1970.
Source: National Notifiable Diseases Surveillance System; and Hall R. Notifiable disease surveillance, 1917 to 1991. Commun Dis Intell 1993;17(11):226–236.

S58 CDI Vol 40 Supplement 2016
Summary of national surveillance data on vaccine preventable diseases in Australia, 2008–2011
Figure A.3: Measles, 1917 to 2011*
0
500
1,000
1,500
2,000
2,500
3,000
1917
1922
1927
1932
1937
1942
1947
1952
1957
1962
1966
-67
1971
1976
1981
1986
1991
1996
2001
2006
2011
Not
ifica
tions
per
100
,000
pop
ulat
ion
Year
1970 - Measles vaccine became widely available
1993 - Second dose of MMR vaccine introduced for 10-16 year olds
2000 - Second dose of MMR vaccine lowered to 4 years
1998 - Second dose of MMR vaccine lowered to 4-5 years; Measles Control Campaign
* Data are reported by calendar year from 1917–1963 and 1970–2011 and by financial year 1963/1964–1969/1970.
Source: National Notifiable Diseases Surveillance System; and Hall R. Notifiable disease surveillance, 1917 to 1991. Commun Dis Intell 1993;17(11):226–236.
Figure A.4: Meningococcal disease (invasive), 1949 to 2011*
0
1
2
3
4
5
6
7
1949
1953
1957
1961
1964
-65
1968
-69
1972
1976
1980
1984
1988
1992
1996
2000
2004
2008
Not
ifica
tions
per
100
,000
pop
ulat
ion
Year
2003 - National Meningococcal C vaccination program commenced.
Meningococcal C conjugate vaccine added to vaccination schedule
* Data are reported by calendar year from 1917–1963 and 1970–2011 and by financial year 1963/1964–1969/1970.
Source: National Notifiable Diseases Surveillance System; and Hall R. Notifiable disease surveillance, 1917 to 1991. Commun Dis Intell 1993;17(11):226–236.
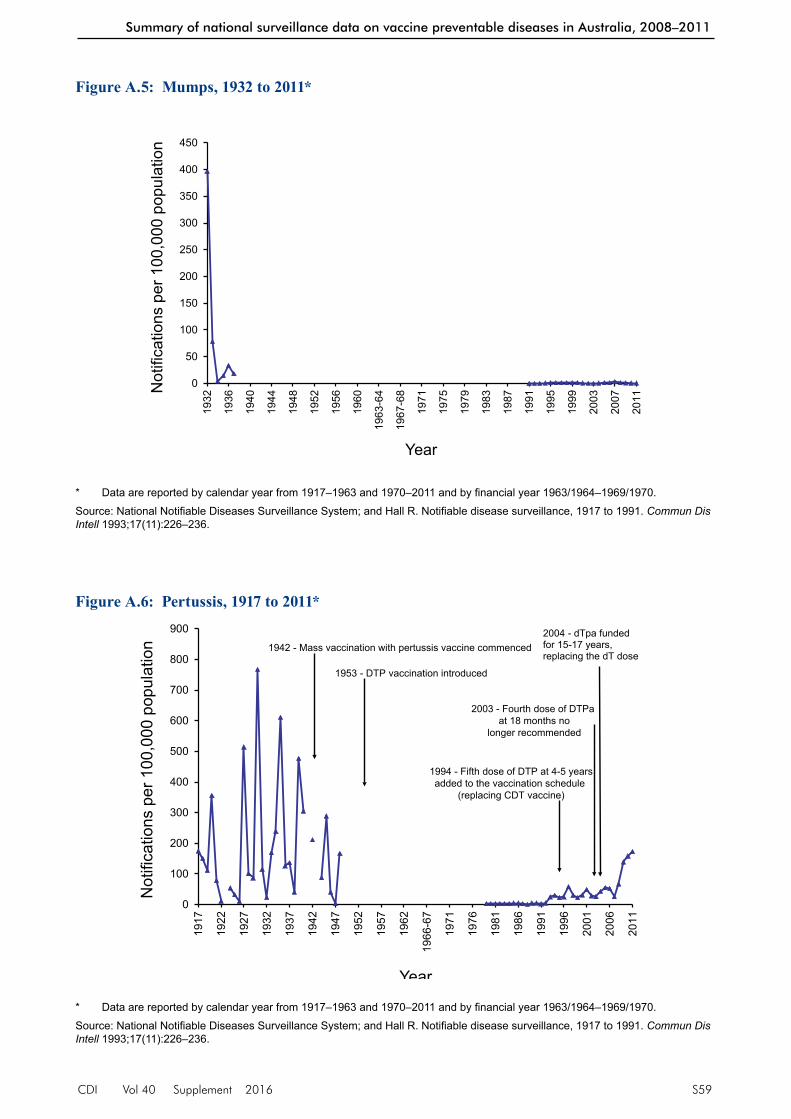
CDI Vol 40 Supplement 2016 S59
Summary of national surveillance data on vaccine preventable diseases in Australia, 2008–2011
Figure A.5: Mumps, 1932 to 2011*
0
50
100
150
200
250
300
350
400
450
1932
1936
1940
1944
1948
1952
1956
1960
1963
-64
1967
-68
1971
1975
1979
1983
1987
1991
1995
1999
2003
2007
2011
Not
ifica
tions
per
100
,000
pop
ulat
ion
Year
* Data are reported by calendar year from 1917–1963 and 1970–2011 and by financial year 1963/1964–1969/1970.
Source: National Notifiable Diseases Surveillance System; and Hall R. Notifiable disease surveillance, 1917 to 1991. Commun Dis Intell 1993;17(11):226–236.
Figure A.6: Pertussis, 1917 to 2011*
0
100
200
300
400
500
600
700
800
900
1917
1922
1927
1932
1937
1942
1947
1952
1957
1962
1966
-67
1971
1976
1981
1986
1991
1996
2001
2006
2011
Not
ifica
tions
per
100
,000
pop
ulat
ion
Year
1953 - DTP vaccination introduced
1942 - Mass vaccination with pertussis vaccine commenced
1994 - Fifth dose of DTP at 4-5 yearsadded to the vaccination schedule
(replacing CDT vaccine)
2003 - Fourth dose of DTPa at 18 months no
longer recommended
2004 - dTpa funded for 15-17 years, replacing the dT dose
* Data are reported by calendar year from 1917–1963 and 1970–2011 and by financial year 1963/1964–1969/1970.
Source: National Notifiable Diseases Surveillance System; and Hall R. Notifiable disease surveillance, 1917 to 1991. Commun Dis Intell 1993;17(11):226–236.

S60 CDI Vol 40 Supplement 2016
Summary of national surveillance data on vaccine preventable diseases in Australia, 2008–2011
Figure A.7: Poliomyelitis, 1917 to 2011*
0
5
10
15
20
25
30
35
40
45
1917
1922
1927
1932
1937
1942
1947
1952
1957
1962
1966
-67
1971
1976
1981
1986
1991
1996
2001
2006
2011
Not
ifica
tions
per
100
,000
pop
ulat
ion
Year
1956 - Mass vaccination withIPV commenced
1966 - OPVintroduced
1994 - Reinforcing OPV to
15-year-olds
2005 - IPV funded toreplace OPV in
combination vaccines
1998 - OPV boosterdose to 4-year-olds
before starting school
* Data are reported by calendar year from 1917–1963 and 1970–2011 and by financial year 1963/1964–1969/1970.
Source: National Notifiable Diseases Surveillance System; and Hall R. Notifiable disease surveillance, 1917 to 1991. Commun Dis Intell 1993;17(11):226–236.
Figure A.8: Rubella, 1942 to 2011*
0
10
20
30
40
50
60
70
80
90
100
1942
1945
1948
1951
1954
1957
1960
1963
1965
-66
1968
-69
1971
1974
1977
1980
1983
1986
1989
1992
1995
1998
2001
2004
2007
2010
Not
ifica
tions
per
100
,000
pop
ulat
ion
Year
1971 - School-girl rubella program commenced
1989 - MMR replaced MM vaccine for infants
1993 - Two-dose schedule introduced
2000 - MMR rather than rubella vaccine recommended for
non-immune women of child-bearing age
* Data are reported by calendar year from 1917–1963 and 1970–2011 and by financial year 1963/1964–1969/1970.
Source: National Notifiable Diseases Surveillance System; and Hall R. Notifiable disease surveillance, 1917 to 1991. Commun Dis Intell 1993;17(11):226–236.

CDI Vol 40 Supplement 2016 S61
Summary of national surveillance data on vaccine preventable diseases in Australia, 2008–2011
Figure A.9: Tetanus, 1921 to 2011*
0.0
0.2
0.4
0.6
0.8
1.0
1.2
1.4
1.6
1.8
2.0
1921
1924
1927
1930
1933
1936
1939
1942
1945
1948
1951
1954
1957
1960
1963
1965
-66
1968
-69
1971
1974
1977
1980
1983
1986
1989
1992
1995
1998
2001
2004
2007
2010
Not
ifica
tions
per
100
,000
pop
ulat
ion
Year
1953 - DTP vaccination introduced
* Data are reported by calendar year from 1917–1963 and 1970–2011 and by financial year 1963/1964–1969/1970.
Source: National Notifiable Diseases Surveillance System; and Hall R. Notifiable disease surveillance, 1917 to 1991. Commun Dis Intell 1993;17(11):226–236.
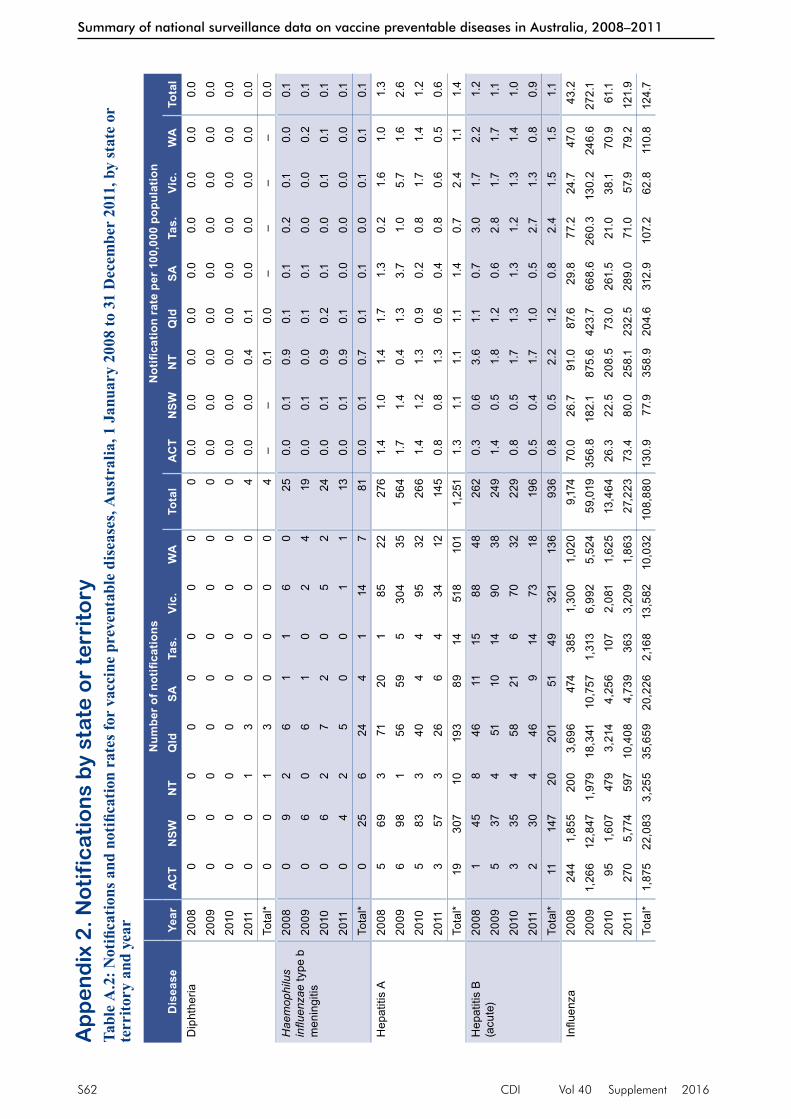
S62 CDI Vol 40 Supplement 2016
Summary of national surveillance data on vaccine preventable diseases in Australia, 2008–2011
Ap
pe
nd
ix 2
. No
tifi
ca
tio
ns
by
sta
te o
r te
rrit
ory
Tabl
e A
.2: N
otifi
catio
ns a
nd n
otifi
catio
n ra
tes f
or v
acci
ne p
reve
ntab
le d
isea
ses,
Aus
tral
ia, 1
Jan
uary
200
8 to
31
Dec
embe
r 20
11, b
y st
ate
or
terr
itory
and
yea
r
Dis
ease
Year
Num
ber o
f not
ifica
tions
Not
ifica
tion
rate
per
100
,000
pop
ulat
ion
AC
TN
SWN
TQ
ldSA
Tas.
Vic.
WA
Tota
lA
CT
NSW
NT
Qld
SATa
s.Vi
c.W
ATo
tal
Dip
hthe
ria20
080
00
00
00
00
0.0
0.0
0.0
0.0
0.0
0.0
0.0
0.0
0.0
2009
00
00
00
00
00.
00.
00.
00.
00.
00.
00.
00.
00.
020
100
00
00
00
00
0.0
0.0
0.0
0.0
0.0
0.0
0.0
0.0
0.0
2011
00
13
00
00
40.
00.
00.
40.
10.
00.
00.
00.
00.
0To
tal*
00
13
00
00
4–
–0.
10.
0–
––
–0.
0H
aem
ophi
lus
influ
enza
e ty
pe b
m
enin
gitis
2008
09
26
11
60
250.
00.
10.
90.
10.
10.
20.
10.
00.
120
090
60
61
02
419
0.0
0.1
0.0
0.1
0.1
0.0
0.0
0.2
0.1
2010
06
27
20
52
240.
00.
10.
90.
20.
10.
00.
10.
10.
120
110
42
50
01
113
0.0
0.1
0.9
0.1
0.0
0.0
0.0
0.0
0.1
Tota
l*0
256
244
114
781
0.0
0.1
0.7
0.1
0.1
0.0
0.1
0.1
0.1
Hep
atiti
s A
2008
569
371
201
8522
276
1.4
1.0
1.4
1.7
1.3
0.2
1.6
1.0
1.3
2009
698
156
595
304
3556
41.
71.
40.
41.
33.
71.
05.
71.
62.
620
105
833
404
495
3226
61.
41.
21.
30.
90.
20.
81.
71.
41.
220
113
573
266
434
1214
50.
80.
81.
30.
60.
40.
80.
60.
50.
6To
tal*
1930
710
193
8914
518
101
1,25
11.
31.
11.
11.
11.
40.
72.
41.
11.
4H
epat
itis
B
(acu
te)
2008
145
846
1115
8848
262
0.3
0.6
3.6
1.1
0.7
3.0
1.7
2.2
1.2
2009
537
451
1014
9038
249
1.4
0.5
1.8
1.2
0.6
2.8
1.7
1.7
1.1
2010
335
458
216
7032
229
0.8
0.5
1.7
1.3
1.3
1.2
1.3
1.4
1.0
2011
230
446
914
7318
196
0.5
0.4
1.7
1.0
0.5
2.7
1.3
0.8
0.9
Tota
l*11
147
2020
151
4932
113
693
60.
80.
52.
21.
20.
82.
41.
51.
51.
1In
fluen
za20
0824
41,
855
200
3,69
647
438
51,
300
1,02
09,
174
70.0
26.7
91.0
87.6
29.8
77.2
24.7
47.0
43.2
2009
1,26
612
,847
1,97
918
,341
10,7
571,
313
6,99
25,
524
59,0
1935
6.8
182.
187
5.6
423.
766
8.6
260.
313
0.2
246.
627
2.1
2010
951,
607
479
3,21
44,
256
107
2,08
11,
625
13,4
6426
.322
.520
8.5
73.0
261.
521
.038
.170
.961
.120
1127
05,
774
597
10,4
084,
739
363
3,20
91,
863
27,2
2373
.480
.025
8.1
232.
528
9.0
71.0
57.9
79.2
121.
9To
tal*
1,87
522
,083
3,25
535
,659
20,2
262,
168
13,5
8210
,032
108,
880
130.
977
.935
8.9
204.
631
2.9
107.
262
.811
0.8
124.
7

CDI Vol 40 Supplement 2016 S63
Summary of national surveillance data on vaccine preventable diseases in Australia, 2008–2011
Dis
ease
Year
Num
ber o
f not
ifica
tions
Not
ifica
tion
rate
per
100
,000
pop
ulat
ion
AC
TN
SWN
TQ
ldSA
Tas.
Vic.
WA
Tota
lA
CT
NSW
NT
Qld
SATa
s.Vi
c.W
ATo
tal
Mea
sles
2008
039
311
20
28
650.
00.
61.
40.
30.
10.
00.
00.
40.
320
091
191
323
237
1010
50.
30.
30.
40.
70.
20.
40.
70.
40.
520
101
252
142
014
1169
0.3
0.3
0.9
0.3
0.1
0.0
0.3
0.5
0.3
2011
2190
518
40
3917
194
5.7
1.2
2.2
0.4
0.2
0.0
0.7
0.7
0.9
Tota
l*23
173
1175
112
9246
433
1.6
0.6
1.2
0.4
0.2
0.1
0.4
0.5
0.5
Men
ingo
cocc
al
dise
ase
(inva
sive
)
2008
381
885
211
6424
287
0.9
1.2
3.6
2.0
1.3
0.2
1.2
1.1
1.4
2009
296
660
223
4228
259
0.6
1.4
2.7
1.4
1.4
0.6
0.8
1.2
1.2
2010
175
353
256
4322
228
0.3
1.0
1.3
1.2
1.5
1.2
0.8
1.0
1.0
2011
272
461
2110
5021
241
0.5
1.0
1.7
1.4
1.3
2.0
0.9
0.9
1.1
Tota
l*8
324
2125
989
2019
995
1,01
50.
61.
12.
31.
51.
41.
00.
91.
01.
2M
umps
2008
077
5229
172
1395
285
0.0
1.1
23.6
0.7
1.1
0.4
0.2
4.4
1.3
2009
040
1335
121
4520
166
0.0
0.6
5.8
0.8
0.7
0.2
0.8
0.9
0.8
2010
140
226
10
1315
980.
30.
60.
90.
60.
10.
00.
20.
70.
420
111
680
377
424
1415
50.
30.
90.
00.
80.
40.
80.
40.
60.
7To
tal*
222
567
127
377
9514
470
40.
10.
87.
40.
70.
60.
30.
41.
60.
8Pe
rtuss
is20
0814
47,
528
478
2,26
31,
478
198
1,73
146
414
,284
41.3
108.
421
7.4
53.6
93.0
39.7
32.9
21.4
67.2
2009
351
12,4
2421
66,
216
5,37
562
34,
175
778
30,1
5898
.917
6.1
95.6
143.
633
4.1
123.
577
.734
.713
9.0
2010
712
9,34
532
98,
218
7,39
628
07,
077
1,45
234
,809
196.
813
0.8
143.
218
6.6
454.
555
.012
9.6
63.4
158.
020
1182
913
,182
378
8,98
82,
352
351
8,65
03,
992
38,7
2222
5.3
182.
616
3.4
200.
814
3.4
68.6
156.
216
9.6
173.
3To
tal*
2,03
642
,479
1,40
125
,685
16,6
011,
452
21,6
336,
686
117,
973
142.
114
9.8
154.
514
7.4
256.
871
.810
0.0
76.2
140.
3P
neum
ococ
cal
dise
ase
(inva
sive
)
2008
1954
761
326
120
3935
516
11,
628
5.5
7.9
27.7
7.7
7.6
7.8
6.8
7.4
7.7
2009
3047
687
260
145
3936
915
01,
556
8.5
6.7
38.5
6.0
9.0
7.7
6.9
6.7
7.2
2010
2550
056
271
140
4640
620
01,
644
6.9
7.0
24.4
6.2
8.6
9.0
7.4
8.7
7.5
2011
2652
912
934
114
247
426
243
1,88
37.1
7.3
55.8
7.6
8.7
9.2
7.7
10.3
8.4
Tota
l*10
02,
052
333
1,19
854
717
11,
556
754
6,71
17.
07.
236
.76.
98.
58.
57.
28.
37.
7
Tabl
e A
.2 c
ontin
ued:
Not
ifica
tions
and
not
ifica
tion
rate
s for
vac
cine
pre
vent
able
dis
ease
s, A
ustr
alia
, 1 J
anua
ry 2
008
to 3
1 D
ecem
ber
2011
, by
stat
e or
terr
itory
and
yea
r

S64 CDI Vol 40 Supplement 2016
Summary of national surveillance data on vaccine preventable diseases in Australia, 2008–2011
Dis
ease
Year
Num
ber o
f not
ifica
tions
Not
ifica
tion
rate
per
100
,000
pop
ulat
ion
AC
TN
SWN
TQ
ldSA
Tas.
Vic.
WA
Tota
lA
CT
NSW
NT
Qld
SATa
s.Vi
c.W
ATo
tal
Q fe
ver
2008
216
73
162
170
216
378
0.6
2.4
1.4
3.8
1.1
0.0
0.4
0.3
1.8
2009
014
13
131
90
252
311
0.0
2.0
1.3
3.0
0.6
0.0
0.5
0.1
1.4
2010
114
81
151
100
168
335
0.3
2.1
0.4
3.4
0.6
0.0
0.3
0.3
1.5
2011
114
41
164
70
2510
352
0.3
2.0
0.4
3.7
0.4
0.0
0.5
0.4
1.6
Tota
l*4
600
860
843
087
261,
376
0.3
2.1
0.9
3.5
0.7
0.0
0.4
0.3
1.6
Rub
ella
2008
017
04
10
77
360.
00.
20.
00.
10.
10.
00.
10.
30.
220
090
70
63
06
527
0.0
0.1
0.0
0.1
0.2
0.0
0.1
0.2
0.1
2010
113
05
00
223
440.
30.
20.
00.
10.
00.
00.
40.
10.
220
112
170
103
011
1558
0.5
0.2
0.0
0.2
0.2
0.0
0.2
0.6
0.3
Tota
l*3
540
257
046
3016
50.
20.
20.
00.
10.
10.
00.
20.
30.
2Te
tanu
s20
080
10
10
01
14
0.0
0.0
0.0
0.0
0.0
0.0
0.0
0.0
0.0
2009
02
00
00
10
30.
00.
00.
00.
00.
00.
00.
00.
00.
020
100
10
00
01
02
0.0
0.0
0.0
0.0
0.0
0.0
0.0
0.0
0.0
2011
01
01
00
01
30.
00.
00.
00.
00.
00.
00.
00.
00.
0To
tal*
05
02
00
32
120.
00.
00.
00.
00.
00.
00.
00.
00.
0
* To
tal c
ases
for 4
-yea
r per
iod
and
aver
age
annu
al ra
te p
er 1
00,0
00 p
opul
atio
n.
Not
ifica
tions
sou
rce:
Nat
iona
l Not
ifiab
le D
isea
ses
Sur
veill
ance
Sys
tem
, Offi
ce o
f Hea
lth P
rote
ctio
n, D
epar
tmen
t of H
ealth
.
Dat
a ex
tract
ed in
Nov
embe
r 201
3 ve
rsio
n an
d su
bjec
t to
retro
spec
tive
revi
sion
.
Tabl
e A
.2 c
ontin
ued:
Not
ifica
tions
and
not
ifica
tion
rate
s for
vac
cine
pre
vent
able
dis
ease
s, A
ustr
alia
, 1 J
anua
ry 2
008
to 3
1 D
ecem
ber
2011
, by
stat
e or
terr
itory
and
yea
r

CDI Vol 40 Supplement 2016 S65
Summary of national surveillance data on vaccine preventable diseases in Australia, 2008–2011
Appendix 3. Hospitalisations by state or territoryTable A.3: Hospitalisation rates for vaccine preventable diseases, Australia, 1 January 2008 to 31 December 2011, by state or territory and year
Disease YearHospitalisation rate per 100,000 population
ACT NSW NT Qld SA Tas. Vic. WA TotalDiphtheria* 2008 0.0 0.0 4.5 0.0 0.0 0.0 0.1 0.1 0.1
2009 0.0 0.0 3.5 0.1 0.1 0.0 0.0 0.0 0.12010 0.0 0.0 3.5 0.0 0.1 0.0 0.1 0.0 0.12011 0.0 0.0 2.6 0.1 0.0 0.0 0.1 0.0 0.1Total† 0.0 0.0 3.5 0.1 0.0 0.0 0.1 0.0 0.1
Haemophilus influenzae meningitis‡
2008 0.0 0.1 1.8 0.2 0.0 0.2 0.1 0.0 0.12009 0.0 0.1 0.9 0.2 0.1 0.2 0.0 0.1 0.12010 0.3 0.1 0.0 0.1 0.2 0.0 0.1 0.2 0.12011 0.0 0.2 0.4 0.3 0.2 0.2 0.0 0.2 0.2Total† 0.1 0.1 0.8 0.2 0.1 0.1 0.0 0.1 0.1
Hepatitis A 2008 1.4 0.7 0.0 1.4 0.7 0.4 1.2 0.3 0.92009 1.1 0.8 0.9 0.9 2.1 0.6 3.5 0.8 1.62010 0.6 1.0 2.2 0.8 0.7 0.4 1.1 0.4 0.92011 0.8 0.7 0.0 0.5 0.9 0.4 0.5 0.3 0.6Total† 1.0 0.8 0.8 0.9 1.1 0.4 1.6 0.4 1.0
Hepatitis B (acute) (principal diagnosis only)
2008 0.9 0.4 0.9 0.4 0.7 0.6 1.2 0.6 0.72009 0.6 0.4 0.9 0.5 0.1 1.2 1.2 0.8 0.72010 0.3 0.4 1.7 0.4 0.7 0.4 1.0 0.8 0.62011 0.0 0.3 3.0 0.4 0.4 0.8 0.7 1.1 0.6Total† 0.4 0.4 1.7 0.4 0.5 0.7 1.0 0.9 0.6
Influenza 2008 7.8 11.0 39.6 19.6 15.8 15.4 11.5 14.6 13.92009 15.5 29.2 85.8 37.1 24.7 31.7 23.2 37.0 30.22010 3.0 7.7 35.3 14.8 21.6 4.9 13.7 16.1 12.72011 6.0 17.3 108.1 37.6 41.8 13.7 18.4 15.6 23.9Total† 8.0 16.3 67.5 27.4 26.1 16.4 16.7 20.8 20.2
Measles 2008 0.0 0.3 0.0 0.0 0.1 0.0 0.1 0.1 0.12009 0.0 0.2 0.4 0.1 0.2 0.2 0.3 0.1 0.22010 0.0 0.1 0.4 0.2 0.0 0.2 0.2 0.2 0.22011 0.5 0.5 0.4 0.1 0.0 0.2 0.4 0.2 0.3Total† 0.1 0.3 0.3 0.1 0.1 0.1 0.3 0.2 0.2
Meningococcal disease 2008 1.1 1.9 5.0 2.9 2.5 0.2 2.0 1.7 2.12009 1.1 1.9 3.1 2.1 2.1 0.4 1.2 1.8 1.72010 0.6 1.3 1.7 1.7 2.2 1.2 1.2 1.9 1.52011 0.5 1.5 3.5 2.2 2.1 2.0 1.5 1.4 1.7Total† 0.8 1.6 3.3 2.2 2.2 0.9 1.5 1.7 1.7
Mumps 2008 0.0 0.4 5.0 0.2 0.1 0.2 0.6 0.6 0.42009 0.0 0.2 3.1 0.3 0.4 0.2 0.6 0.3 0.42010 0.3 0.4 1.3 0.5 0.2 0.2 0.3 0.4 0.42011 0.0 0.4 0.4 0.4 0.2 0.6 0.5 0.6 0.4Total† 0.1 0.4 2.4 0.3 0.2 0.3 0.5 0.5 0.4
Pertussis 2008 1.4 5.6 13.6 2.8 3.9 2.4 2.0 1.9 3.62009 2.8 9.5 8.4 6.8 14.2 5.7 3.9 2.6 7.02010 1.9 4.6 10.9 6.9 17.3 3.3 6.0 3.2 6.22011 5.2 7.6 7.8 7.0 7.8 1.4 7.2 5.8 7.0Total† 2.9 6.8 10.1 5.9 10.8 3.2 4.8 3.5 6.2

S66 CDI Vol 40 Supplement 2016
Summary of national surveillance data on vaccine preventable diseases in Australia, 2008–2011
Disease YearHospitalisation rate per 100,000 population
ACT NSW NT Qld SA Tas. Vic. WA TotalPneumococcal disease§ 2008 14.1 12.2 46.4 11.6 12.1 10.6 12.8 13.8 12.7
2009 12.7 13.1 47.8 9.4 12.7 12.9 13.6 10.8 12.62010 12.4 11.9 45.7 9.7 12.1 11.2 12.7 11.9 12.02011 14.9 13.8 87.8 11.8 14.8 12.9 15.0 13.5 14.5Total† 13.5 12.8 57.1 10.6 12.9 11.9 13.5 12.5 13.0
Q fever 2008 0.3 0.8 0.0 1.7 1.3 0.0 0.2 0.0 0.72009 0.0 0.6 0.0 1.8 0.5 0.2 0.3 0.0 0.72010 0.0 0.7 1.3 2.0 0.6 0.0 0.1 0.3 0.82011 0.0 0.8 2.2 1.9 0.3 0.0 0.2 0.3 0.8Total† 0.1 0.7 0.9 1.9 0.7 0.0 0.2 0.2 0.7
Rotavirus 2008 5.5 6.0 30.9 10.4 8.8 2.8 2.9 5.7 6.52009 4.5 6.1 62.8 7.9 8.3 3.8 2.8 4.7 6.12010 4.4 9.4 75.3 5.8 12.3 7.1 4.7 6.9 8.02011 9.0 4.7 40.2 11.0 5.9 6.8 2.4 1.7 5.6Total† 5.9 6.6 52.5 8.8 8.8 5.1 3.2 4.7 6.6
Rubella 2008 0.0 0.0 0.0 0.0 0.1 0.4 0.0 0.0 0.02009 0.3 0.0 0.0 0.0 0.0 0.0 0.1 0.0 0.02010 0.0 0.1 0.0 0.0 0.0 0.0 0.0 0.0 0.02011 0.0 0.0 1.3 0.0 0.0 0.0 0.0 0.0 0.0Total† 0.1 0.0 0.3 0.0 0.0 0.1 0.0 0.0 0.0
Tetanus* 2008 0.0 0.1 0.0 0.1 0.0 0.0 0.2 0.2 0.12009 0.0 0.1 0.0 0.1 0.0 0.2 0.0 0.0 0.12010 0.0 0.0 0.0 0.1 0.2 0.0 0.1 0.1 0.12011 0.0 0.0 0.0 0.2 0.1 0.0 0.1 0.3 0.1Total† 0.0 0.1 0.0 0.1 0.1 0.0 0.1 0.2 0.1
Varicella 2008 7.2 3.7 7.7 4.7 3.8 3.4 3.6 3.2 3.92009 3.7 4.1 5.8 4.2 3.2 4.6 3.9 3.4 4.02010 1.4 4.0 5.7 4.2 3.1 3.7 4.2 2.7 3.92011 2.7 3.3 7.8 3.3 4.2 2.5 3.8 3.4 3.5Total† 3.7 3.8 6.7 4.1 3.6 3.6 3.9 3.2 3.8
Zoster 2008 25.3 24.4 14.1 23.4 30.8 24.7 27.7 18.8 24.82009 18.3 23.6 19.0 24.3 34.4 20.4 25.9 22.1 24.72010 18.5 26.7 16.1 25.1 33.4 26.9 31.0 22.7 27.32011 23.9 27.6 17.3 26.7 33.4 32.1 30.9 23.8 28.2Total† 21.5 25.6 16.6 24.9 33.0 26.0 28.9 21.9 26.3
* Hospitalisations for rare diseases such as diphtheria should be interpreted with caution due to possible misclassification, coding and data related issues. Diphtheria hospitalisations coded here include non-respiratory and non-toxigenic diphtheria infections.
† Average annual rate per 100,000 population. The rates are based on hospitalisations (in public and private hospitals) by date of admission and state of residence.
‡ Haemophilus influenzae (Hib) hospitalisations include only G00.0 (Hib meningitis). J05.1 (acute epiglottitis) used in previous reports is no longer included due to evidence that the specificity of epiglottitis for Hib infection is now extremely low in Australia.
§ Pneumococcal meningitis, septicaemia or pneumonia.
Table A.3 continued: Hospitalisation rates for vaccine preventable diseases, Australia, 1 January 2008 to 31 December 2011, by state or territory and year

CDI Vol 40 Supplement 2016 S67
Summary of national surveillance data on vaccine preventable diseases in Australia, 2008–2011
References1. Chiu C, Dey A, Wang H, Menzies R, Deeks S, Mahajan D, et al. Vaccine preventable diseases in Australia, 2005 to
2007. Commun Dis Intell 2010;34 Suppl:ix–S167.
2. Pillsbury A, Quinn HE, McIntyre PB. Australian vaccine preventable disease epidemiological review series: pertussis, 2006–2012. Commun Dis Intell 2014;38(3):E179–E194.
3. Chiew M, Dey A, Martin N, Wang H, Davis S, McIntyre P. Australian vaccine preventable disease epidemiological review series: Measles 2000–2011. Commun Dis Intell 2015;39(1):E1–E9.
4. Bag SK, Dey A, Wang H, Beard FH. Australian vaccine preventable disease epidemiological review series: Mumps 2008–2012. Commun Dis Intell 2015;39(1):E10–E18.
5. Chan J, Dey A, Wang H, Martin N, Beard F. Australian vaccine preventable disease epidemiological review series: Rubella 2008–2012. Commun Dis Intell 2015;39(1):E19–E26.
6. Naidu L, Chiu C, Habig A, Lowbridge C, Jayasinghe S, Wang H, et al. Vaccine preventable diseases and vaccina-tion coverage in Aboriginal and Torres Strait Islander people, Australia 2006–2010. Commun Dis Intell 2013;37 Suppl:S1–S92.
7. Public Health Committee, National Health and Medical Research Council. Surveillance case definitions. Canberra: National Health and Medical Research Council; 1994.
8. Communicable Diseases Network Australia. Surveillance case definitions for the Australian National Notifiable Diseases Surveillance System, 1 January 2004 to 1 November 2014. Accessed on 21 November 2014. Available from: http://www.health.gov.au/internet/main/publishing.nsf/Content/cdna-casedefinitions.htm/$File/consolidated-case-definitions-nov2014.pdf
9. McIntyre P, Amin J, Gidding H, Hull B, Torvaldsen S, Tucker A, et al. Vaccine preventable diseases and vaccination coverage in Australia, 1993–1998. Commun Dis Intell 2000;24 Suppl:iii–S83.
10. McIntyre P, Gidding H, Gilmour R, Lawrence G, Hull B, Horby P, et al. Vaccine preventable diseases and vaccination coverage in Australia, 1999 to 2000. Commun Dis Intell 2002;26 Suppl:iii–S111.
11. Brotherton J, McIntyre P, Puech M, Wang H, Gidding H, Hull B, et al. Vaccine preventable diseases and vaccination coverage in Australia, 2001 to 2002. Commun Dis Intell 2004;28 Suppl 2:i–S116.
12. Brotherton J, Wang H, Schaffer A, Quinn H, Menzies R, Hull B, et al. Vaccine preventable diseases and vaccination coverage in Australia, 2003 to 2005. Commun Dis Intell 2007;31 Suppl:S1–S152.
13. Australian Government Department of Health. Australian national notifiable diseases and case definitions. Accessed on 21 November 2014. Available from: http://www.health.gov.au/casedefinitions
14. National Centre for Immunisation Research and Surveillance. Vaccination history tables. Accessed on 21 November 2014. Available from: http://ncirs.edu.au/immunisation/history/index.php
15. Diphtheria. In: Heymann DL, ed. Control of Communicable Diseases Manual. 19th edn. Washington, DC: American Public Health Association; 2008. p. 195–200.
16. Tiwari TS, Wharton M. Diphtheria toxoid. In: Plotkin SA, Orenstein WA, Offit PA, eds. Vaccines. 6th edn. Philadelphia, PA: Elsevier Saunders; 2013. p. 153–166.
17. Hatanaka A, Tsunoda A, Okamoto M, Ooe K, Nakamura A, Miyakoshi M, et al. Corynebacterium ulcerans diphtheria in Japan. Emerg Infect Dis 2003;9(6):752–753.
18. DeWinter LM, Bernard KA, Romney MG. Human clinical isolates of Corynebacterium diphtheriae and Corynebacterium ulcerans collected in Canada from 1999 to 2003 but not fitting reporting criteria for cases of diphtheria. J Clin Microbiol 2005;43(7):3447–3449.
19. Tiwari TS, Golaz A, Yu DT, Ehresmann KR, Jones TF, Hill HE, et al. Investigations of 2 cases of diphtheria-like illness due to toxigenic Corynebacterium ulcerans. Clin Infect Dis 2008;46(3):395–401.
20. Elden S, Coole L, Efstratiou A, Doshi N. Laboratory-confirmed case of toxigenic Corynebacterium ulcerans. Euro Surveill 2007;12(13):pii=3166.
21. Communicable Diseases Network Australia. Diphtheria case definition. 2013. Accessed on 9 July 2015. Available from: http://www.health.gov.au/internet/main/publishing.nsf/Content/cda-surveil-nndss-casedefs-cd_dipth.htm
22. Queensland Health. Diphtheria: Public Health Significance and Occurrence 2012. Accessed on 9 July 2015. Available from: https://www.health.qld.gov.au/cdcg/index/diphtheria.asp#phso
23. NNDSS Annual Report Writing Group. Australia’s notifiable disease status, 2011: annual report of the National Notifiable Diseases Surveillance System. Commun Dis Intell 2013;37(4):E313–E393.
24. McIntyre P. Vaccines against invasive Haemophilus influenzae type b disease. J Paediatr Child Health 1994;30(1):14–18.
25. Wang H, Deeks S, Glasswell A, McIntyre P. Trends in invasive Haemophilus influenzae type b disease in Australia, 1995–2005. Commun Dis Intell 2008;32(3):316–325.
26. Hanna JN, Wild BE. Bacterial meningitis in children under five years of age in Western Australia. Med J Aust 1991;155(3):160–164.
27. McIntyre PB, O’Brien KL, Greenwood B, van de Beek D. Effect of vaccines on bacterial meningitis worldwide. Lancet 2012;380(9854):1703–1711.
28. McIntyre PB, Leeder SR, Irwig LM. Invasive Haemophilus influenzae type b disease in Sydney children 1985–1987: a population-based study. Med J Aust 1991;154(12):832–837.

S68 CDI Vol 40 Supplement 2016
Summary of national surveillance data on vaccine preventable diseases in Australia, 2008–2011
29. Heath PT, Booy R, Azzopardi HJ, Slack MP, Fogarty J, Moloney AC, et al. Non-type b Haemophilus influenzae dis-ease: clinical and epidemiologic characteristics in the Haemophilus influenzae type b vaccine era. Pediatr Infect Dis J 2001;20(3):300–305.
30. Hanna JN, Hills SL, Humphreys JL. Impact of hepatitis A vaccination of Indigenous children on notifications of hepatitis A in north Queensland. Med J Aust 2004;181(9):482–485.
31. Communicable Diseases Network Australia. Haemophilus influenzae type B infection (invasive) case definition. 2014. Accessed on 9 July 2015. Available from: http://www.health.gov.au/internet/main/publishing.nsf/Content/cda-surveil-nndss-casedefs-cd_hib.htm
32. Communicable Diseases Network Australia. Hepatitis A case definition. 2013. Accessed on 9 July 2015. Available from: http://www.health.gov.au/internet/main/publishing.nsf/Content/cda-surveil-nndss-casedefs-cd_hepa.htm
33. Donnan E, Fielding J, Gregory J, Lalor K, Rowe S, Goldsmith P, et al. A multistate outbreak of hepatitis A associated with semidried tomatoes in Australia, 2009. Clin Infect Dis 2012; 54(6):775–781.
34. Hepatitis, viral. II. Viral hepatitis B. In: Heymann DL, ed. Control of Communicable Diseases Manual. 19th edn. Washington, DC: American Public Health Association; 2008. p. 284–293.
35. Kaldor JM, Plant AJ, Thompson SC, Longbottom H, Rowbottom J. The incidence of hepatitis B infection in Australia: an epidemiological review. Med J Aust 1996;165(6):322–326.
36. O’Sullivan BG, Gidding HF, Law M, Kaldor JM, Gilbert GL, Dore GJ. Estimates of chronic hepatitis B virus infection in Australia, 2000. Aust N Z J Public Health 2004;28(3):212–216.
37. Ryder SD, Beckingham IJ. ABC of diseases of liver, pancreas, and biliary system: chronic viral hepatitis. BMJ 2001;322(7280):219–221.
38. Communicable Diseases Network Australia. Hepatitis B (newly acquired) case definition. 2015. Accessed on 9 July 2015. Available from: http://www.health.gov.au/internet/main/publishing.nsf/Content/cda-surveil-nndss-casedefs-cd_hepbnew.htm
39. Nicholson KG, Wood JM, Zambon M. Influenza. Lancet 2003;362(9397):1733–1745.
40. Communicable Diseases Network Australia. Influenza laboratory-confirmed. 2008. Accessed on 9 July 2015. Available from: http://www.health.gov.au/internet/main/publishing.nsf/Content/cda-surveil-nndss-casedefs-cd_flu.htm
41. Moss W, Griffin DE. Measles. Lancet 2012;379:153–164.
42. Perry RT, Halsey NA. The clinical significance of measles: a review. J Infect Dis 2004;189 Suppl 1:S4–S16.
43. Campbell H, Andrews N, Brown KE, Miller E. Review of the effect of measles vaccination on the epidemiology of SSPE. Int J Epidemiol 2007;36:1134–1148.
44. Communicable Diseases Network Australia. Measles case definition. 2004. Accessed on 9 July 2015. Available from: http://www.health.gov.au/internet/main/publishing.nsf/Content/cda-surveil-nndss-casedefs-cd_measl.htm
45. Greaves F, Donaldson L. Measles in the UK: a test of public health competency in a crisis. BMJ 2013;346:f2793.
46. Khetsuriani N, Imnadze P, Baidoshvili L, Jabidze L, Tatishili N, Kurtsikashvili G, et al. Impact of unfounded vaccine safety concerns on the nationwide measles-rubella immunization campaign, Georgia, 2008. Vaccine 2010;28(39):6455–6462.
47. Mulholland EK, Griffiths UK, Biellik R. Measles in the 21st century. N Engl J Med 2012;366(19):1755–1757.
48. Heywood AE, Gidding HF, Riddell MA, McIntyre PB, MacIntyre CR, Kelly HA. Elimination of endemic measles transmis-sion in Australia. Bull World Health Organ 2009;87(1):64–71.
49. Rosewell A, Reinten-Reynolds T, Spokes P. Measles in NSW, 2002–2011. N S W Public Health Bull 2012;23(9–10):201–207.
50. Apicella MA. Neisseria meningitidis. In: Mandell GL, Bennett JE, Dolin R, eds. Mandell, Douglas, and Bennett’s Principles and Practice of Infectious Diseases. 7th edn. Philadelphia, PA: Churchill Livingstone Elsevier; 2010. p. 2737–2752.
51. Granoff DM, Pelton S, Harrison LH. Meningococcal vaccines. In: Plotkin SA, Orenstein WA, Offit PA, eds. Vaccines. 6th edn. Philadelphia, PA: Elsevier Saunders; 2013. p. 388–418.
52. Communicable Diseases Network Australia. Meningococcal disease (invasive) surveillance case definition 2010. Accessed on 9 July 2015. Available from: http://www.health.gov.au/internet/main/publishing.nsf/Content/cda-surveil-nndss-casedefs-cd_mening.htm
53. Hivid A, Rubin S, Mühlemann K. Mumps. Lancet 2008;371:932–944.
54. Savage E, Ramsay M, White J, Beard S, Lawson H, Hunjan R, et al. Mumps outbreaks across England and Wales in 2004: observational study. BMJ 2005;330:1119–1120.
55. Barskey AE, Glasser JW, LeBaron CW. Mumps resurgences in the United States: a historical perspective on unexpected elements. Vaccine 2009;27:6186–6195.
56. Senanayake SN. Mumps: a resurgent disease with protean manifestations. Med J Aust 2008;189(8):456–459.
57. Communicable Diseases Network Australia. Mumps case definition. 2004. Accessed on 9 July 2015. Available from: http://www.health.gov.au/internet/main/publishing.nsf/Content/cda-surveil-nndss-casedefs-cd_mumps.htm
58. Bangor-Jones RD, Dowse GK, Giele CM, Van Buynder PG, Hodge MM, Whitty MM. A prolonged mumps outbreak among highly vaccinated Aboriginal people in the Kimberley region of Western Australia. Med J Aust 2009;191(7):398–401.

CDI Vol 40 Supplement 2016 S69
Summary of national surveillance data on vaccine preventable diseases in Australia, 2008–2011
59. Aratchige PE, McIntyre PB, Quinn HE, Gilbert GL. Recent increases in mumps incidence in Australia: the “forgotten” age group in the 1998 Australian Measles Control Campaign. Med J Aust 2008;189(8):434–437.
60. Pertussis and parapertussis. In: Heymann DL, ed. Control of Communicable Diseases Manual. 19th edn. Washington, DC: American Public Health Association; 2008. p. 455–461.
61. Communicable Diseases Network Australia. Pertussis case definition. 2014. Accessed on 9 July 2015. Available from: http://www.health.gov.au/internet/main/publishing.nsf/Content/cda-surveil-nndss-casedefs-cd_pertus.htm
62. Quinn HE, McIntyre PB. The impact of adolescent pertussis immunization, 2004–2009: lessons from Australia. Bull World Health Organ 2011;89(9):666–674.
63. Quinn HE, Snelling TL, Macartney KK, McIntyre PB. Duration of protection after first dose of acellular pertussis vaccine in infants. Pediatrics 2014;133(3):e513–e519.
64. Pillsbury A, Quinn H, McIntyre P. Australian vaccine preventable disease epidemiological review series: Pertussis, 2006–2012. Commun Dis Intell 2014;38(3):E179–E194.
65. Quinn H. Pertussis control in Australia – the current state of play. Commun Dis Intell 2014;38(3):E177–E178.
66. Musher DM. Streptococcus pneumoniae. In: Mandell GL, Bennett JE, Dolin R, eds. Mandell, Douglas, and Bennett’s Principles and Practice of Infectious Diseases. 7th edn. Philadelphia, PA: Churchill Livingstone Elsevier; 2010. p. 2623–2642.
67. Communicable Diseases Network Australia. Pneumococcal disease (invasive) case definition. 2004. Accessed on 9 July 2015. Available from: http://www.health.gov.au/internet/main/publishing.nsf/Content/cda-surveil-nndss-casedefs-cd_pnuemo.htm
68. Poliomyelitis, acute. In: Heymann DL, ed. Control of Communicable Diseases Manual. 19th edn. Washington, DC: American Public Health Association; 2008. p. 484–491.
69. Centers for Disease Control and Prevention (CDC). Update on vaccine-derived polioviruses. MMWR Morb Mortal Wkly Rep 2006;55(40):1093–1097.
70. Communicable Diseases Network Australia. Poliomyelitis (paralytic and non-paralytic) case definition. 2014. Accessed on 9 July 2015. Available from: http://www.health.gov.au/internet/main/publishing.nsf/Content/cda-surveil-nndss-casedefs-cd_polio.htm
71. Maurin M, Raoult D. Q fever. Clin Microbiol Rev 1999;12(4):518–553.
72. Parker NR, Barralet JH, Bell AM. Q fever. Lancet 2006;367(9511):679–688.
73. Wade AJ, Cheng AC, Athan E, Molloy JL, Harris OC, Stenos J, et al. Q Fever Outbreak at a cosmetics supply factory. Clin Infect Dis 2006;42(7):e50–e52.
74. Australian Technical Advisory Group on Immunisation. The Australian Immunisation Handbook. 10th edn. Canberra: Australian Government Department of Health 2013.
75. Communicable Diseases Network Australia. Q fever case definition. 2004. Accessed on 9 July 2015. Available from: http://www.health.gov.au/internet/main/publishing.nsf/Content/cda-surveil-nndss-casedefs-cd_qfev.htm
76. Gidding HF, Wallace C, Lawrence GL, McIntyre PB. Australia’s National Q Fever Vaccination Program. Vaccine 2009;27(14):2037–2041.
77. Clark HF, Offit PA, Parashar UD. Rotavirus vaccines. In: Plotkin SA, Orenstein WA, Offit PA, eds. Vaccines. 6th edn. Philadelphia, PA: Elsevier Saunders; 2013. p. 715–734.
78. Parashar UD, Gibson CJ, Bresse JS, Glass RI. Rotavirus and severe childhood diarrhea. Emerg Infect Dis 2006;12(2):304–306.
79. Velázquez FR, Matson DO, Calva JJ, Guerrero L, Morrow AL, Carter-Campbell S, et al. Rotavirus infection in infants as protection against subsequent infections. N Engl J Med 1996;335(14):1022–1028.
80. Kirkwood CD, Boniface K, Bishop RF, Barnes GL. Australian Rotavirus Surveillance Program: annual report, 2009/2010. Commun Dis Intell 2010;34(4):427–434.
81. Kirkwood CD, Boniface K, Bishop RF, Barnes GL, Australian Rotavirus Surveillance Group. Australian Rotavirus Surveillance Program annual report, 2008/2009. Commun Dis Intell 2009;33(4):382–388.
82. Kirkwood CD, Cannan D, Boniface K, Bishop RF, Barnes GL, Australian Rotavirus Surveillance Group. Australian Rotavirus Surveillance Program annual report, 2007/08. Commun Dis Intell 2008;32(4):425–429.
83. Kirkwood CD, Roczo S, Boniface K, Bishop RF, Barnes GL, Australian Rotavirus Surveillance Group. Australian Rotavirus Surveillance Program annual report, 2010/11. Commun Dis Intell 2011;35(4):281–287.
84. Dey A, Wang H, Menzies R, Macartney K. Changes in hospitalisations for acute gastroenteritis in Australia after the national rotavirus vaccination program. Med J Aust 2012;197(8):453–457.
85. Newall AT, MacIntyre R, Wang H, Hull B, Macartney K. Burden of severe rotavirus disease in Australia. J Paediatr Child Health 2006;42(9):521–527.
86. Best JM. Rubella. Semin Fetal Neonatal Med 2007;12(3):182–192.
87. Communicable Diseases Network Australia. Rubella case definition. 2004. Accessed on 9 July 2015. Available from: http://www.health.gov.au/internet/main/publishing.nsf/Content/cda-surveil-nndss-casedefs-cd_rubela.htm
88. Song N, Gao Z, Wood JG, Hueston L, Gilbert GL, MacIntyre CR, et al. Current epidemiology of rubella and congenital rubella syndrome in Australia: progress towards elimination. Vaccine 2012;30(27):4073–4078.

S70 CDI Vol 40 Supplement 2016
Summary of national surveillance data on vaccine preventable diseases in Australia, 2008–2011
89. Tetanus. In: Heymann DL, ed. Control of Communicable Diseases Manual. 19th edn. Washington, DC: American Public Health Association; 2008. p. 602–608.
90. Communicable Diseases Network Australia. Tetanus case definition. 2012. Accessed on 9 July 2015. Available from: http://www.health.gov.au/internet/main/publishing.nsf/Content/cda-surveil-nndss-casedefs-cd_tetanus.htm
91. Quinn HE, McIntyre PB. Tetanus in the elderly – an important preventable disease in Australia. Vaccine 2007;25(7):1304–1309.
92. Chickenpox/Herpes zoster. In: Heymann DL, ed. Control of Communicable Diseases Manual. 19th edn. Washington, DC: American Public Health Association; 2008. p. 109–116.
93. Gershon AA, Takahashi M, Seward JF. Varicella vaccine. In: Plotkin SA, Orenstein WA, Offit PA, eds. Vaccines. 6th edn. Philadelphia, PA: Elsevier Saunders; 2013. p. 837–869.
94. Bowsher D. The lifetime occurrence of Herpes zoster and prevalence of post-herpetic neuralgia: a retrospective survey in an elderly population. Eur J Pain 1999;3(4):335–342.
95. Schmader K. Herpes zoster in older adults. Clin Infect Dis 2001;32(10):1481–1486.
96. Communicable Diseases Network Australia. Varicella-zoster infection (chickenpox) case definition. 2008. Accessed on 9 July 2015. Available from: http://www.health.gov.au/internet/main/publishing.nsf/Content/cdna-casedef-chick-enpox.htm
97. Communicable Diseases Network Australia. Varicella-zoster infection (shingles) case definition. 2008. Accessed on 9 July 2015. Available from: http://www.health.gov.au/internet/main/publishing.nsf/Content/cdna-casedef-shingles.htm
98. Communicable Diseases Network Australia. Varicella-zoster infection (unspecified) case definition. 2008. Accessed on 9 July 2015. Available from: http://www.health.gov.au/internet/main/publishing.nsf/Content/cdna-casedef-varicella-unspec.htm
99. Heywood A, Wang H, Macartney K, McIntyre P. Varicella and herpes zoster hospitalizations before and after implementa-tion of one-dose varicella vaccination in Australia: an ecological study. Bull World Health Organ 2014;92(8):593–604.
100.


