commonwealth of pennsylvania state employees’ retirement
TRANSCRIPT

Commonwealth of Pennsylvania State Employees’ Retirement System2010 Actuarial Report

COMMONWEALTH OF PENNSYLVANIA
STATE EMPLOYEES’ RETIREMENT SYSTEM
2010 ACTUARIAL REPORT
DEFINED BENEFIT PLAN
HAY GROUP, INC. JUNE 8, 2011

Dear Mr. Knepp: The purpose of this letter is to certify the actuarial adequacy of the contributions being made by the Commonwealth of Pennsylvania and other participating agencies to the Pennsylvania State Employees’ Retirement System (SERS), and to discuss the approach currently being taken toward meeting the financing objectives of the plan. The results provided herein are based upon the December 31, 2010 annual actuarial valuation. The funding objective of the plan is set forth in the State Employees’ Retirement Code (SERC). The annual employer contribution is equal to the sum of the following for the fiscal year beginning July 1, 2011:
(1) The employer share of the normal cost. (2) The fresh start amortization of the December 31, 2009 unfunded liability over a 30-year
period beginning July 1, 2010 and ending on June 30, 2040. (3) The amortization of the change in liability due to Act 2010-120 over a 30-year period
beginning July 1, 2011 and ending on June 30, 2041. (4) The amortization of changes in liability due to actual experience differing from assumed
experience after December 31, 2009 over 30-year periods beginning with the July first following the actuarial valuation determining such changes.
The amortization payments are level amounts over the remaining applicable amortization periods. The employer cost is determined as a percent of retirement covered compensation. The total employer cost is the average contribution amount that needs to be received from the employer groups participating in the system. Some employer groups contribute a higher percent of compensation, and some employer groups contribute a lower percent of compensation depending on the benefits payable to their employees. All costs and liabilities have been determined in conformance with generally accepted actuarial principles and procedures in accordance with the principles of practice prescribed by the American Academy of Actuaries. The calculations were performed on the basis of actuarial assumptions and methods, which are internally consistent, and reasonable (taking into account the past experience of SERS and reasonable expectations) and which in combination represent the best estimate of anticipated experience under the plan.
Hay Group, Inc. Suite 600 4301 North Fairfax Drive Arlington, VA 22203-1653 USA tel +1.703.841.3100 fax +1.703.841.3108 www.haygroup.com
June 8, 2011 Mr. Leonard M. Knepp Executive Director State Employees' Retirement System 30 North Third Street Suite 150 Harrisburg, PA 17101-1716

Mr. Leonard M. Knepp June 8, 2011 Page 2 The actuarial valuation is based on financial and participant data, which is prepared by SERS staff. The data are reviewed for internal and year-to-year consistency as well as general reasonableness prior to their use in the actuarial valuation. The actuarial valuation uses assumptions regarding future rates of investment return and rates of retirement, withdrawal, death, and disability among SERS members and their beneficiaries. The current set of assumptions used in the December 31, 2010 actuarial valuation was adopted by the State Employees’ Retirement Board (the Board) and was based on actual experience of SERS during the years 2006 through 2010. The investment data analyzed during the experience study supported the continued use of an 8.0% annual investment return in the December 31, 2010 actuarial valuation. We continue to closely monitor this assumption and will recommend changing it if the investment data warrants such change. The actuarial value of assets is developed by recognizing the difference between the expected actuarial value of assets and the market value of assets over a five-year period. Apart from the statutory funding requirements set forth in the SERC, there are also separate accounting standards that SERS uses for financial reporting purposes. Governmental Accounting Standards Board (GASB) Statement No. 25, Financial Reporting for Defined Benefit Pension Plans and Note Disclosures for Defined Contribution Plans establishes a range of actuarial cost and amortization methods for the Unfunded Actuarial Accrued Liability. The scheduled payments since July 1, 2005 have been below the amount required to meet the GASB minimum. Previously this was a result of financing changes implemented by Act 2003-40 in December 2003. Currently this is a result of the contribution collars required under Act 2010-120. Based upon the valuation results, it is our opinion that, provided future employer contributions are made in accordance with current law, the Pennsylvania State Employees' Retirement System is in sound condition in accordance with generally accepted actuarial principles and procedures. The employer contribution has been below the GASB Statement No. 25 minimum since July 1, 2005 and will likely remain below the minimum through June 30, 2015. Thereafter, provided that employer contributions are made in accordance with current law, we expect employer contributions to exceed the GASB minimum. It should be noted that, with the recent passage of Act 2010-120 (Act 120), significant reform to many key provisions of SERS has been legislated. This was an appropriate response to the significant funding challenges SERS has been facing in recent years, and will continue to face in coming years. By reducing pensions for future Commonwealth employees and providing funding relief to SERS employers through the use of contribution collars, Act 120 addressed both SERS’ long-term and short-term funding challenges.

MJuP AcootcoyeonstatdeGreovm RH BBME BCME
Mr. Leonard Mune 8, 2011 age 3
As actuaries foollars results therwise appontributions wears. It is thenly to the shotatute establist least the neetermined an
Group would ecognize, givver coming y
mechanism for
Respectfully suHay Group, Inc
By __________Brent M. MowMember AmerEnrolled Actua
By __________Craig R. GrabyMember AmerEnrolled Actua
M. Knepp
or SERS, Hayin employer licable actuawill never be erefore essentort-term collashed. We expext few yearsnual employeprefer that S
ven the extraoyears, that ther a temporary
ubmitted, c.
___________
wery, F.S.A. rican Academyary No. 11-388
___________y rican Academyary No. 11-73
y Group consfunding for F
arially requiremade; rather
ial to the longars provided bpect that the cs, and this wer funding reSERS fundingordinary funde contribution
y period, after
____________
y of Actuaries85
____________
y of Actuaries19
siders it impoFY2012 (anded funding ler, Act 120 prog-term fundinby Act 120 bucontribution cwill continue quirement is g be based uding challengn collars reprwhich fundin
_ By _ Adam
s Mem Enro
_
s
ortant to note d likely for thevels. This ovides that thng of the systeut also to the collars will goto be the cabelow the co
upon our actuges the Commresent an impng on an actu
____________m J. Reese, F.
mber Americanolled Actuary N
that the estabhe next few yis not to say
hey will be deem that the Clong-term funovern employase until suchollared contribuarially determmonwealth o
portant and neuarial basis wi
____________.S.A. n Academy ofNo. 11-4303
blishment of years) at levey that requireeferred and pommonwealtnding obligatyer contributioh time as thebution level. mined fundin
of Pennsylvanecessary fundill resume.
_________
f Actuaries
contribution ls below the ed employer aid in future th adhere not tions that the on levels for e actuarially While Hay
ng level, we nia is facing ding deferral
State Employees' Retirement System
i
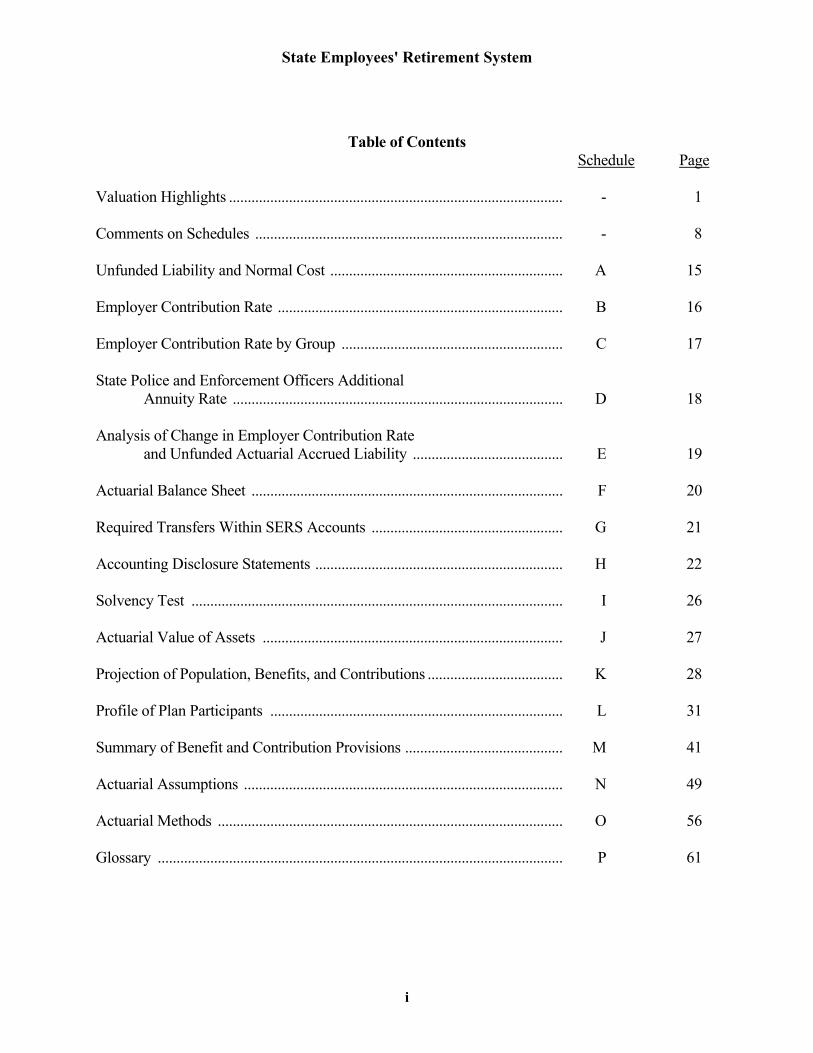
Table of Contents Schedule Page Valuation Highlights ......................................................................................... - 1 Comments on Schedules .................................................................................. - 8 Unfunded Liability and Normal Cost .............................................................. A 15 Employer Contribution Rate ............................................................................ B 16 Employer Contribution Rate by Group ........................................................... C 17 State Police and Enforcement Officers Additional Annuity Rate ........................................................................................ D 18 Analysis of Change in Employer Contribution Rate and Unfunded Actuarial Accrued Liability ........................................ E 19 Actuarial Balance Sheet ................................................................................... F 20 Required Transfers Within SERS Accounts ................................................... G 21 Accounting Disclosure Statements .................................................................. H 22 Solvency Test ................................................................................................... I 26 Actuarial Value of Assets ................................................................................ J 27 Projection of Population, Benefits, and Contributions .................................... K 28 Profile of Plan Participants .............................................................................. L 31 Summary of Benefit and Contribution Provisions .......................................... M 41 Actuarial Assumptions ..................................................................................... N 49 Actuarial Methods ............................................................................................ O 56 Glossary ............................................................................................................ P 61

State Employees' Retirement SystemValuation Highlights
December 31, 2010 December 31, 2009Valuation Valuation
SERS Plan Contribution Normal Cost 4.08% 9.53% Amortization of Liabilities 14.85% -3.89% Contribution Before Change Prescribed by Law 18.93% 5.64% Total SERS Plan Contribution* 8.00% 5.00%
Benefits Completion Plan Contribution 0.01% 0.01%
Total Contribution 8.01% 5.01%
* Reflects Rates Prescribed by Law (12/31/10 - Act 2010-120; 12/31/09 - Act 2010-46)
Active Participants: Number 109,255 110,107 Average age 46.6 46.5 Average service 12.2 12.2 Average annualized compensation 51,228$ 50,813$ Total annualized compensation 5,596,915,000$ 5,594,867,000$ Funding payroll 5,851,704,000$ 5,935,988,000$
Annuitants and Beneficiaries: Number 111,713 109,639 Average age 68.6 68.5 Total annual pension 2,087,317,311$ 1,987,987,717$
Inactive and Vested Participants: Number 6,326 6,190
Market Value of Assets 25,879,380,227$ 24,654,710,857$ Actuarial Value of Assets 29,443,945,435$ 30,204,693,112$
Funded Status (Market Assets) 66.1% 68.9% Funded Status (Actuarial Assets) 75.2% 84.4%
Summary of Employer Contributions as a Percent of Total Compensation
Demographic Characteristics of the Population
Assets
1

State Employees' Retirement System
SERS PlanBenefits
Completion Plan Total Class A-3 and A-4 Members: Age 65 Retirement 4.82% 0.01% 4.83% Age 55 Retirement 6.91% 0.01% 6.92% Park Rangers 6.88% 0.01% 6.89% Capitol Police 6.88% 0.01% 6.89%
Class AA Members: Age 60 Retirement 6.98% 0.01% 6.99% Age 50 Retirement 10.00% 0.01% 10.01% Park Rangers 9.68% 0.01% 9.69% Capitol Police 9.68% 0.01% 9.69% Enforcement Officers 10.00% 0.01% 10.01%
Class A Members: Age 60 Retirement 5.58% 0.01% 5.59% Age 50 Retirement 8.00% 0.01% 8.01% Park Rangers 7.87% 0.01% 7.88% Capitol Police 7.87% 0.01% 7.88% State Police 16.13% 0.01% 16.14% Enforcement Officers 8.00% 0.01% 8.01%
Class D-4 Legislators 12.00% 0.01% 12.01%
Class E Members 8.84% 0.01% 8.85%
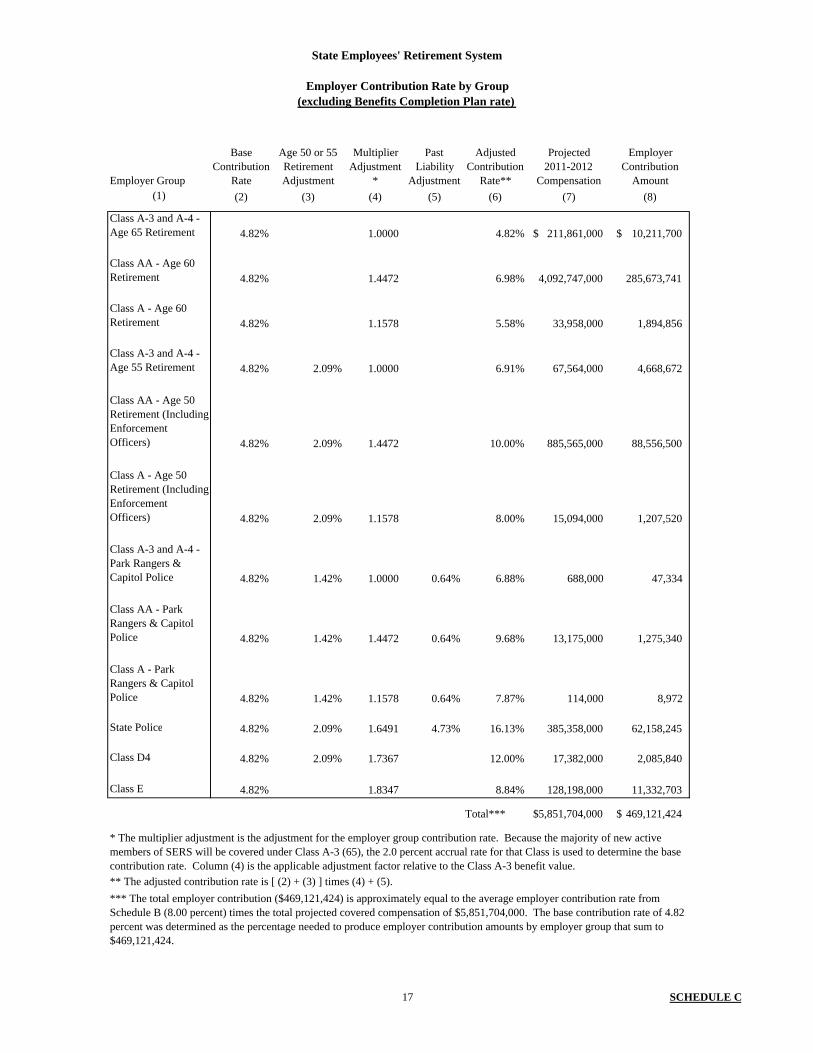
The above group rates result in employer contribution rates (expressed as a percentage of total projected covered compensation for active members in fiscal year 2011-2012) of 8.00% for the SERS Plan, 0.01% for the Benefits Completion Plan and 8.01% in Total.
Employer Contribution Rate by GroupFiscal Year 2011 - 2012,
Including Classes A-3 and A-4
2

State Employees' Retirement System
3
General Discussion The liabilities and costs in this report were based upon actuarial assumptions adopted by the State Employees' Retirement Board (the Board) and funding procedures specified in the SERC. The SERC requires that the Board conduct a study of the actuarial experience of the SERS plan every five years as a basis for setting the actuarial assumptions used in the valuation. A five-year study was conducted and delivered to the Board for review and approval in January 2011. The Board approved the recommendations of the actuary and the new assumptions were first used in the December 31, 2010 valuation. The most important actuarial assumptions are the investment return, which is used as the basis for the valuation interest rate, and salary growth. The annual investment return assumption of 8.0 percent, which has been in use since the December 31, 2008 actuarial valuation, was just approved by the Board in January 2011 after it was affirmed by the actuarial experience study. Salary growth is the total of assumed increases in salary rates and career salary growth. It is generally assumed that the salary rates will increase at 3.05 percent a year due to general salary schedule increases and that career salary growth (promotion and longevity growth) will average an additional 3.15 percent a year. Thus, the total average salary increase for an individual will generally be 6.20 percent a year. The investment return and the salary rate increase assumptions are based on an underlying inflation rate of 2.75 percent a year. The SERS plan employer contribution is determined as a percent of covered compensation that is the total of (1) the employer normal cost percent and (2) the net amortization of the unfunded liability, but not less than any applicable minimum contribution prescribed by the SERC and not more than the total contribution amount that results from applying the collars established by Act 2010-120 to limit the extent of annual increase in the employer contribution rate. The final actuarially determined total employer contribution as of December 31, 2010 is 18.93 percent of covered compensation, which is the sum of (1) the employer normal cost of 4.08 percent of compensation plus (2) the net amortization of the unfunded liability of 14.85 percent of compensation. To determine the maximum 2011-2012 employer contribution rate under Act 2010-120, we add the fiscal 2011-2012 contribution collar of 3 percent of payroll to the final 2010-2011 employer contribution requirement of 5.00 percent of payroll, to produce a result of 8.00 percent of compensation. Therefore, the 2011-2012 employer contribution rate is limited to 8.00 percent of covered compensation, well below the actuarially determined rate that would otherwise be required. See Schedule O for further discussion of the Act 2010-120 employer contribution collars. The funded ratio is the ratio of assets to the actuarial accrued liability. As a consequence of the global economic downturn, SERS experienced very unfavorable investment results during calendar 2008. Thus, SERS’ funded status, as measured by the funded ratio, declined significantly during 2008, to a level of 66.2 percent based on market value and 89.0 percent based on actuarial value of plan assets as of December 31, 2008. As a result of more favorable investment results during calendar year 2009, the funded ratio based on market value of assets increased slightly from 66.2 percent to 68.9 percent; however, the funded ratio based on the actuarial value of assets (which recognizes investment losses over a five-year period) decreased from 89.0 percent to 84.4 percent. During calendar year 2010, the funded ratio based on market value of assets decreased from 68.9

State Employees' Retirement System
4
percent to 66.1 percent, and the funded ratio based on the actuarial value of assets decreased from 84.4 percent to 75.2 percent. Chart 1 below presents a history of SERS funded ratios, relative to the ultimate 100% target.
SERS reached a milestone during 2010 in terms of the make-up of the covered participant group. Specifically, for the first time in the history of SERS, the count of pensioners (111,713) now exceeds the count of active participants (109,255), a clear sign of a mature retirement system. Chart 2 below illustrates the maturing of the SERS population since 2000.
65%
75%
85%
95%
105%
115%
125%
135%
145%
1992 1994 1996 1998 2000 2002 2004 2006 2008 2010
Fund
ed S
tatu
s
Year (As of December 31)
Chart 1SERS Historical Funded Status =
Assets / Actuarial Accrued Liability
Funded Status (Actuarial Assets) Funded Status (Market Assets) Target Funded Status
0
20
40
60
80
100
120
2000 2001 2002 2003 2004 2005 2006 2007 2008 2009 2010
Num
ber
of P
artic
ipan
ts (
in t
hou
san
ds)
Year (As of December 31)
Chart 2SERS Participation
Pensioner Count First Exceeds Active Count in 2010
Active Participants Annuitants and Beneficiaries
State Employees' Retirement System
5
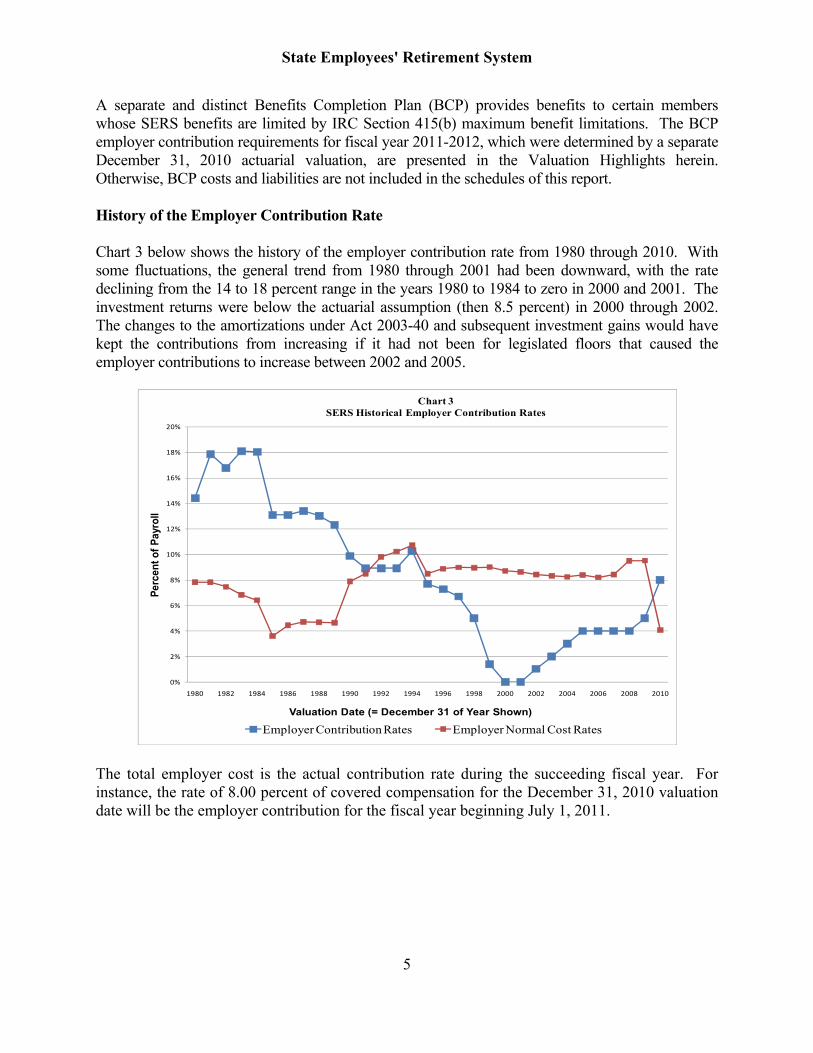
A separate and distinct Benefits Completion Plan (BCP) provides benefits to certain members whose SERS benefits are limited by IRC Section 415(b) maximum benefit limitations. The BCP employer contribution requirements for fiscal year 2011-2012, which were determined by a separate December 31, 2010 actuarial valuation, are presented in the Valuation Highlights herein. Otherwise, BCP costs and liabilities are not included in the schedules of this report. History of the Employer Contribution Rate Chart 3 below shows the history of the employer contribution rate from 1980 through 2010. With some fluctuations, the general trend from 1980 through 2001 had been downward, with the rate declining from the 14 to 18 percent range in the years 1980 to 1984 to zero in 2000 and 2001. The investment returns were below the actuarial assumption (then 8.5 percent) in 2000 through 2002. The changes to the amortizations under Act 2003-40 and subsequent investment gains would have kept the contributions from increasing if it had not been for legislated floors that caused the employer contributions to increase between 2002 and 2005.
The total employer cost is the actual contribution rate during the succeeding fiscal year. For instance, the rate of 8.00 percent of covered compensation for the December 31, 2010 valuation date will be the employer contribution for the fiscal year beginning July 1, 2011.
0%
2%
4%
6%
8%
10%
12%
14%
16%
18%
20%
1980 1982 1984 1986 1988 1990 1992 1994 1996 1998 2000 2002 2004 2006 2008 2010
Per
cent
of
Pay
roll
Valuation Date (= December 31 of Year Shown)
Chart 3SERS Historical Employer Contribution Rates
Employer Contribution Rates Employer Normal Cost Rates

State Employees' Retirement System
6
History of Inflation, Investment Return and Salary Growth Table 1 below shows the rate of inflation, the nominal and real investment return based on the market value of assets, and the nominal and real salary growth for the past twenty years. The nominal rates are the actual investment rate and salary growth. The real rates are the nominal rates adjusted by removing inflation. The inflation rates shown are based on the Consumer Price Index for All Urban Consumers (CPI-U) data. The nominal rate of salary growth is the percentage increase in general pay levels specified by the predominant collective bargaining agreement.
Table 1: Comparison of Annual Rates of Growth
Year Inflation
Investment Return Salary Growth
Nominal Real Nominal Real
1991 3.1 22.6 19.0 1.0 (2.0) 1992 2.9 7.4 4.4 2.1 (0.8) 1993 2.7 13.2 10.2 5.1 2.3 1994 2.7 (1.1) (3.7) 3.9 1.2 1995 2.5 25.5 22.4 3.8 1.2
1996 3.3 15.9 12.2 2.0 (1.3) 1997 1.7 18.0 16.0 3.0 1.3 1998 1.6 16.3 14.5 3.0 1.4 1999 2.7 19.9 16.8 3.0 0.3 2000 3.4 2.2 (1.1) 3.0 (0.4)
2001 1.6 (7.9) (9.3) 3.3 1.7 2002 2.4 (10.9) (13.0) 3.5 1.1 2003 1.9 24.3 22.0 2.0 0.1 2004 3.3 15.1 11.4 1.9 (1.4) 2005 3.4 14.5 10.7 3.0 (0.4)
2006 2.5 16.4 13.6 3.5 1.0 2007 4.1 17.2 12.6 2.8 (1.2) 2008 0.1 (28.7) (28.8) 3.0 2.9 2009 2.7 9.1 6.2 3.0 0.3 2010 1.5 11.9 10.2 3.0 1.5
Average
1991-2010 2.5% 9.1% 6.5% 3.0% 0.5%
The averages represent the geometric averages of all of the rates over the 20-year period, not the arithmetic averages.

State Employees' Retirement System
7
Chart 4 below presents a 15-year history of SERS annual investment returns relative to the actuarially assumed returns of 8.5% for 1996 through 2008 and 8.0% for 2009 and 2010.
-30%
-20%
-10%
0%
10%
20%
30%
1996 1998 2000 2002 2004 2006 2008 2010
Chart 4SERS Historical Annual Investment Returns
Actual Return on Assets Assumed Return on Assets

State Employees' Retirement System
8
Comments on Schedules Employer Contribution Rate Schedules A and B summarize the development of the employer contribution rate before allocation by group. The employer contribution is equal to the sum of (1) the employer share of the normal cost and (2) amortization of the unfunded liability. The normal cost is the level percentage of compensation needed to fund the liability for any prospective benefits earned by new active members over the period of their actual service. The normal cost calculation uses data for all active members in Class A-3 (65) who had not yet completed one year of credited service. The employer share of the normal cost decreased from 9.53 percent in 2009 to 4.08 percent in 2010. The normal cost dropped significantly due to Act 2010-120 and the fact that the cost to fund Class A-3 (65) benefits is much lower than the cost to fund Class AA (60) benefits. Portions of the unfunded liability are amortized over either 10 years or 30 years as required by the SERC. Under Act 120, the total December 31, 2009 unfunded liability was amortized over 30 years as part of a fresh start that combined all of the unfunded liability amortizations into one amortization. The net losses in 2010 were amortized over 30 years. The total unfunded liability as of December 31, 2010 was $9.74 billion. As of December 31, 2009, the total unfunded liability was $5.59 billion. Schedule B shows the allocation of the total unfunded liability by year into those liabilities being amortized over 10 years and those being amortized over 30 years. All amortization payments are level dollar amounts over the applicable amortization period. There are currently no 10-year amortizations. The total net charge for the amortization of the unfunded liability is 14.85 percent of compensation in 2010. The employer contribution rate is equal to the total of the normal cost and the amortization of the unfunded liabilities, but not less than 4 percent and not more than the rate based on the collar (which limits the contribution increases during the next several years) applicable to the 2011/2012 employer contribution rate. The employer contribution rate calculated as a result, 8.00 percent of covered compensation, will be applied for the fiscal year beginning July 1, 2011. Employer Contribution Rates by Group Schedule C summarizes the development of the employer contribution rate for each group of members with different benefits. The Class A-3 (65) rate is used to determine the base contribution rate because the majority of new members enter that class. The base employer contribution rate for Class A-3 benefits is 4.82 percent of compensation. The employer contribution rate for each class is a function of the Class A-3 (65) rate. Three adjustments are made for the Class rates. The first is to add the cost of earlier full retirement conditions if applicable. The second is to multiply by the applicable adjustment factor relative to the Class A-3 benefit value. Third, the Park Rangers, Capitol Police and State Police Officers are

State Employees' Retirement System
9
also charged the amount necessary to fund the past service cost of benefit improvements that were effective in prior years. These charges are further explained in Schedule O. The complete schedule of contributions by group is shown in Table 2.
Table 2 Employer Contribution Rate by Group
Fiscal Year 2011/2012 (Excluding Benefits Completion Plan Contribution)
Class AA Age 60 benefit 6.98% Age 50 benefit 10.00 Park Rangers 9.68 Capitol Police 9.68 Enforcement Officers 10.00 Class A Age 60 benefit 5.58 Age 50 benefit 8.00 Park Rangers 7.87 Capitol Police 7.87 State Police 16.13 Enforcement Officers 8.00 Class A3/A4 Age 65 benefit 4.82 Age 55 benefit 6.91 Park Rangers 6.88 Capitol Police 6.88
Class D-4 Legislators 12.00 Class E Members 8.84
Schedule D shows the development of the contribution rates for additional annuities for certain State Police and Enforcement Officers. These members receive an additional annuity that is equal to the accumulated member contributions and interest at retirement determined as if the members were at least age 60 at retirement. These benefits have been fully funded by past contributions so no future contribution is required. Since there are no longer any active members eligible for these benefits, the assets available for and present value of additional annuities are zero. Change in Employer Contribution Rate Schedule E contains an analysis of the change in the employer contribution rate and unfunded liability from the 2009 to 2010 valuation. The largest increase in the unfunded liability, $2.69 billion, resulted from benefit changes under Act 2010-120. Since the normal cost required to fund Act 120 benefits is significantly lower than the

State Employees' Retirement System
10
pre-Act 120 normal cost, Act 120 gives rise to (i) a much smaller portion of the total plan liability being funded through future normal costs and (ii) a much larger portion being funded through the amortization of the unfunded accrued liability. Therefore, this increase of $2.69 billion resulted in an increase to the unfunded accrued liability amortization of 4.09 percent of compensation. This cost was offset by a 4.62 percent drop in the normal cost rate under Act 120. The net result was a cost reduction of 0.53 percent. Another increase in the unfunded liability, $1.25 billion, resulted primarily from recognition (under the five-year asset smoothing method) of another 20 percent of the large investment loss from 2008, which more than offset the 20 percent recognition of investment gains from the other four years of the five-year smoothing period. This net loss of $1.25 billion resulted in an increase in the employer cost of 1.90 percent of compensation. Another increase in the unfunded liability, $741 million, resulted from underfunding due to a retroactive Fresh Start and other changes. This net loss of $741 million resulted in an increase in the employer cost of 1.00 percent of compensation. The remainder of the increase in the unfunded liability was the result of demographic changes. Changes in demographic assumptions resulted in an increase of $98.4 million. Changes in the demographics of the new entrant population resulted in an increase of $64.2 million. These losses resulted in an increase in the employer cost of 0.15 percent and 0.10 percent respectively. The largest reduction in the unfunded liability was due to smaller than expected pay increases, which resulted in a gain of $421 million, and therefore a decrease in employer cost of 0.64 percent of compensation. The other decrease in the unfunded liability, $236 million, resulted from changes in economic assumptions. This gain resulted in a decrease in the employer cost of 0.36 percent of compensation. Actuarial Balance Sheet and Account Balance Transfers Schedule F contains the actuarial balance sheet that compares the total assets and liabilities of $44.9 billion. The assets include current assets and the present value of future contributions. The liabilities include the present value of all benefits to current active and retired members. Each year the account balances in the three benefit payment accounts are compared to the actuarial liabilities developed in the valuation. If needed, transfers are made to bring the accounts into balance with the liabilities. The accounts go out of balance during the year as a result of differences between actual experience and the reserves set for retirees. In 2010, a transfer of $240.4 million was made from the State Accumulation Account to the Annuity Reserve Account to keep the latter account in balance. There were also transfers of $0.7 million and $23.8 million from the State Accumulation Account to the Enforcement Officers’ Benefit Account and the State Police Benefit Account, respectively, to keep these accounts in balance. No other transfers were necessary. The details of these transfers are shown in Schedule G.

State Employees' Retirement System
11
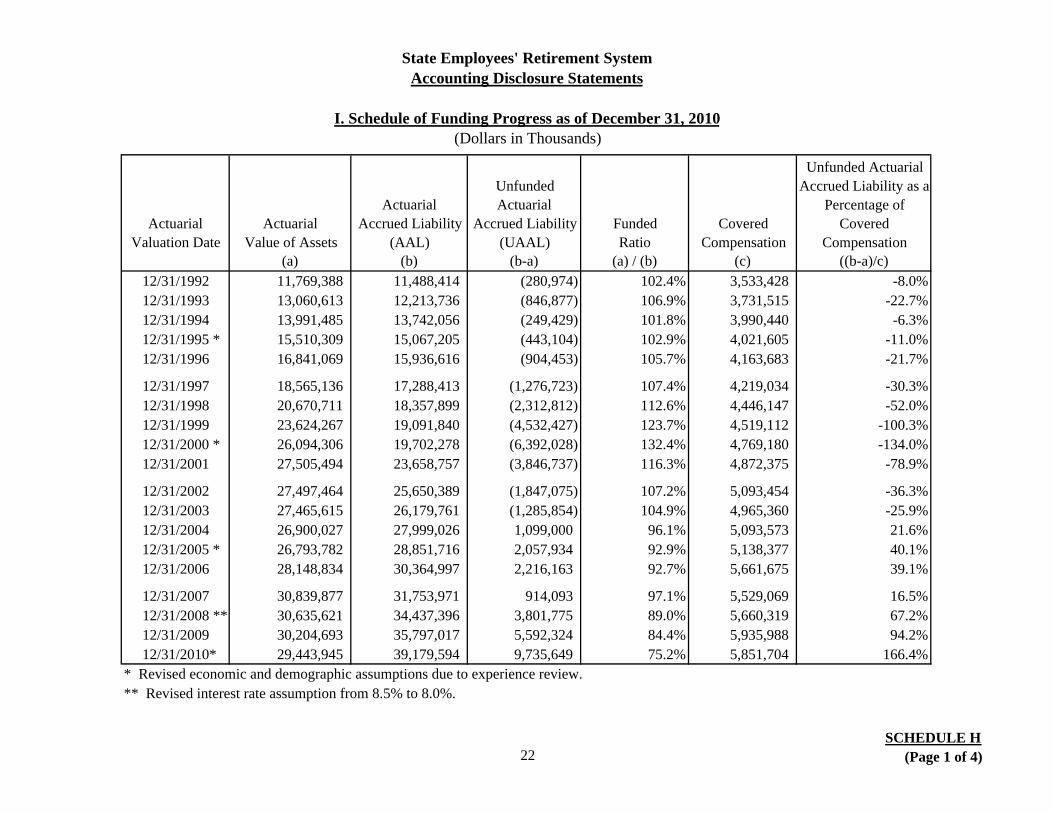
Accounting Disclosure Statements Schedule H is a statement of disclosure to report the information required by the Governmental Accounting Standards Board (GASB) Statement No. 25. Page 1 of Schedule H shows the funding progress from December 31, 1992 through December 31, 2010. Page 2 of Schedule H shows a comparison of the actual contributions to the system over recent years to the Annual Required Contribution (ARC) as defined by GASB Statement No. 25. GASB Statement No. 25 defines the ARC to be equal to the employer normal cost plus an amount to amortize the unfunded actuarial accrued liability over an acceptable amortization period. The 2011-2012 employer contribution is lower than the ARC. GASB requires that the net unfunded liability be funded over a period of no more than 30 years. Because the employer contribution collars under Act 120 will result in employer contribution rates for a number of years that will be lower than the actuarially determined rates, we anticipate that the actual employer contributions to SERS will be lower than the ARC through June 30, 2015. Thereafter, provided that employer contributions are made in accordance with current law, we expect employer contributions to exceed the GASB minimum. Overall, the amortization schedules are reasonable and if met will assure the long-term financial soundness of SERS. Schedule I shows the results of the solvency test. A short-term solvency test is one means of checking a pension system’s progress under its funding program. In this solvency test, the SERS assets are compared with the actuarial accrued liabilities. The liabilities are classified into the following categories:
Liability for active participant contributions in the Fund, Liability for future benefits to present annuitants and beneficiaries, and Liability for service already rendered by the active participants.
The schedule shows that from 1992 through 2003 the total actuarial accrued liability was fully covered by the assets. In 2004 the funded ratio dropped below 100 percent and it is currently at 75.2 percent. Absent unusual circumstances, the funded status of defined benefit plans will be below 100 percent and gradually approach 100 percent funding as liabilities become fully amortized. The State Employees’ Retirement Fund had exceeded 100 percent of liabilities as a result of the high level of investment returns between 1985 and 1999. The funded ratio dropped below 100 percent largely as a result of the low investment returns of 2000 to 2002 and 2008, the Act 2001-9 benefit increases, the 2002-2003 COLAs, and the amortization schedule. Also, the implementation of Act 120 led to a lower December 31, 2010 normal cost and a higher accrued liability (and unfunded accrued liability). The current funding policy will eventually restore the funded ratio to 100 percent provided that contributions are made as provided in current law. SERS is being funded in accordance with generally accepted actuarial principles and procedures even though the accrued liabilities are temporarily greater than the assets.

State Employees' Retirement System
12
Plan Assets Schedule J summarizes the development of the actuarial value of assets as of December 31, 2010. The assets are based on the financial statements prepared by SERS. The asset valuation method smoothes out year-to-year fluctuations in the market value. The approach gradually recognizes, over a 5-year period, the differences between total investment return and the actuarial assumed annual rate of return (8.5 percent prior to 2009; 8.0 percent for 2009 and later). This smoothing method recognizes 20 percent of the 2010 asset gain of $734 million this year, with the remainder to be recognized over the next four years. Chart 5 below presents a history since 1992 of SERS asset values, including both the actuarial value and the market value.
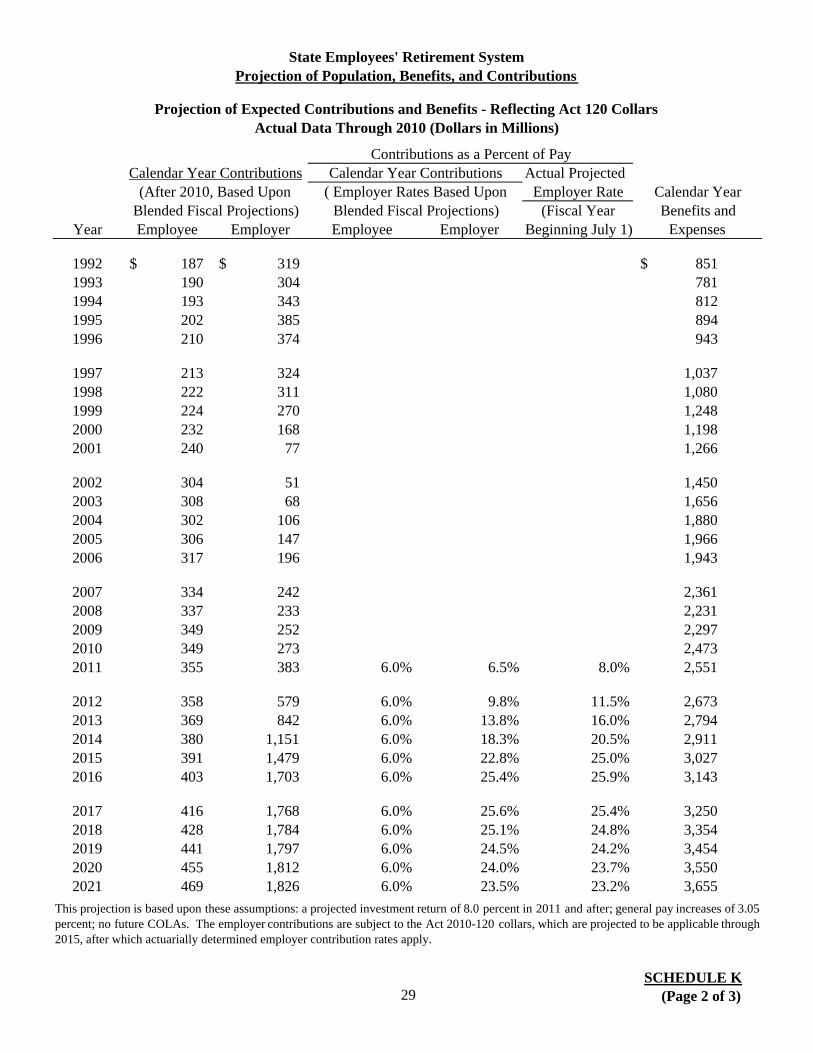
Projection Schedule K shows the number of participants, contributions, and benefits from 1992 through 2010 with a projection through 2021. The first page of Schedule K shows new annuitants, annuitant deaths, new beneficiaries, and beneficiary deaths during the year. The second and third pages of Schedule K show the projection of employer and employee contributions and a projection of the benefits and expenses. The projected employee and employer contributions are shown in dollars and as a percentage of compensation. The second page of the Schedule K projection shows projected contributions under Act 120, fully reflecting the employer contribution collars under Act 120. The third page of the Schedule K projection also projects contributions under Act 120; however, this projection presents future
$0
$5
$10
$15
$20
$25
$30
$35
$40
1992 1994 1996 1998 2000 2002 2004 2006 2008 2010
Bill
ions
Year (As of December 31)
Chart 5SERS Actuarial (5-Year Smoothed) & Market
Values of Assets
Actuarial Value Market Value

State Employees' Retirement System
13
employer contribution rates without applying the Act 120 contribution collars; thus, these projected employer contributions reflect the actuarially determined employer contribution rates. Participant Data Sections I and II of Schedule L provide a distribution of the total of the active, inactive, and terminated vested participants as of December 31, 2010 by benefit class, sex, age, and length of service. Inactive participants include employees on furlough as well as employees with prior SERS service currently participating in the Pennsylvania Public School Employees’ Retirement System (PSERS). The table also shows the average annualized salary in 2010 by age group and sex. Section III of the schedule shows retired annuitants, disabled annuitants, survivors and beneficiaries receiving benefits by age, sex, and benefit amounts. Although we have made tests to check for reasonableness and consistency, we have not independently audited the data, which were submitted by SERS. As appropriate, we have made certain adjustments to the SERS data, including the use of a minimum annual salary assumption of $20,000. Section III of Schedule L shows the monthly annuities that were being paid as of December 31, 2010. Total benefits from the fund include lump sum payments and death benefits so these are much higher than the sum of annuities shown in Schedule L and in the highlights. Plan Provisions Schedule M contains a summary of the principal provisions of the plan. As a consequence of Act 2010-120 being signed into law in November 2010 and becoming effective (for most purposes) January 1, 2011, there were significant changes in plan provisions in 2010. Actuarial Assumptions Schedule N summarizes the actuarial assumptions used for the valuation. The two types of assumptions are economic assumptions, such as the investment return and salary growth assumptions, and demographic assumptions, such as the assumed rates of mortality and retirement. For the December 31, 2010 valuation, as a result of the 2006-2010 actuarial experience study and the large number of actuarial assumption changes that were recommended, changes were made to most of the actuarial assumptions used for the SERS actuarial valuation. Although the 8.0 percent annual interest rate assumption was reviewed, study results supported continuing with 8.0 percent for the December 31, 2010 valuation, consistent with the return assumption used for both the December 31, 2008 and December 31, 2009 valuations.

State Employees' Retirement System
14
Actuarial Methods Schedule O explains the asset valuation and funding method used in the valuation, and the determination of the annual contribution, including a discussion of the Act 120 employer contribution collars. The asset valuation method spreads investment gains and losses over five years. The funding method provides for reasonable levels of contribution that will fund the cost of future benefits with a credit for amortization of the excess of assets over liabilities. Schedule O also explains how the individual class rates are determined. The final section of Schedule O discusses the plan provisions that are not valued. Glossary Schedule P defines certain terms used in this actuarial report.

State Employees' Retirement SystemUnfunded Liability and Normal Cost as of December 31, 2010
I. Present Value of Benefits:
A) Active and Inactive Participants1) Superannuation and Withdrawal 24,164,150,537$ 2) Disability 911,756,256 3) Death 798,142,741 4) Refunds 45,387,813 5) Special Police and Enforcement -
Officer Benefits6) Subtotal 25,919,437,347$
B) Annuitants and Beneficiaries 18,995,355,294 C) Total 44,914,792,641$
II. Present Value of Member and Employer Contributions:
A) Employer Portion of Normal Cost 2,380,902,534$ B) Member Contributions 3,354,296,138 C) Total 5,735,198,672$
III. Actuarial Accrued Liability: (I) - (II) 39,179,593,969$
IV. Actuarial Value of Assets 29,443,945,435$
V. Unfunded Liability (III) - (IV) 9,735,648,534$
VI. Employer Normal Cost Rate
A) Total Normal Cost Rate for new active members to fund:1) Superannuation and Withdrawal 8.80%2) Disability 0.72%3) Death 0.41%4) Refunds 0.40%5) Total 10.33%
B) Member Contribution Rate 6.25%
C) Employer Normal Cost Rate (A) - (B) 4.08%
15 SCHEDULE A

State Employees' Retirement SystemEmployer Contribution Rate in Fiscal Year 2011 - 2012
Outstanding Payment as aInitial Years
From July 1
Initial Amountof Liability
Balance as of 12/31/10
Annual Payment Amount
Percent of Compensation*
I. Amortization of Liability (Asset) For: A) Liability Fresh Start 30 2010 $5,592,323,524 $5,542,957,661 $496,751,745 8.49% B) Changes in 2010 30 2011 4,192,690,873 4,192,690,873 372,425,969 6.36%
Total 9,735,648,534$ 869,177,714$ 14.85%
II. Employer Normal Cost 4.08%
III. Total Employer Cost before Act 2010-120 = (I) + (II) 18.93%
IV. Total Employer Cost (III), reflecting the 8.00 percent contribution prescribed by Act 2010-120 8.00%
* The payment is expressed as a percentage of the total projected covered compensation for active members in fiscal year 2011-2012 of$5,851,704,000. Percentages may not add due to rounding.
Funding Period
16 SCHEDULE B
State Employees' Retirement System
Employer Contribution Rate by Group(excluding Benefits Completion Plan rate)
Employer Group
Base Contribution
Rate
Age 50 or 55 Retirement Adjustment
Multiplier Adjustment
*
Past Liability
Adjustment
Adjusted Contribution
Rate**
Projected 2011-2012
Compensation
Employer Contribution
Amount(1) (2) (3) (4) (5) (6) (7) (8)
Class A-3 and A-4 - Age 65 Retirement 4.82% 1.0000 4.82% 211,861,000$ 10,211,700$
Class AA - Age 60 Retirement 4.82% 1.4472 6.98% 4,092,747,000 285,673,741
Class A - Age 60 Retirement 4.82% 1.1578 5.58% 33,958,000 1,894,856
Class A-3 and A-4 - Age 55 Retirement 4.82% 2.09% 1.0000 6.91% 67,564,000 4,668,672
Class AA - Age 50 Retirement (Including Enforcement Officers) 4.82% 2.09% 1.4472 10.00% 885,565,000 88,556,500
Class A - Age 50 Retirement (Including Enforcement Officers) 4.82% 2.09% 1.1578 8.00% 15,094,000 1,207,520
Class A-3 and A-4 - Park Rangers & Capitol Police 4.82% 1.42% 1.0000 0.64% 6.88% 688,000 47,334
Class AA - Park Rangers & Capitol Police 4.82% 1.42% 1.4472 0.64% 9.68% 13,175,000 1,275,340
Class A - Park Rangers & Capitol Police 4.82% 1.42% 1.1578 0.64% 7.87% 114,000 8,972
State Police 4.82% 2.09% 1.6491 4.73% 16.13% 385,358,000 62,158,245
Class D4 4.82% 2.09% 1.7367 12.00% 17,382,000 2,085,840
Class E 4.82% 1.8347 8.84% 128,198,000 11,332,703
Total*** 5,851,704,000$ 469,121,424$
** The adjusted contribution rate is [ (2) + (3) ] times (4) + (5).
* The multiplier adjustment is the adjustment for the employer group contribution rate. Because the majority of new active members of SERS will be covered under Class A-3 (65), the 2.0 percent accrual rate for that Class is used to determine the base contribution rate. Column (4) is the applicable adjustment factor relative to the Class A-3 benefit value.
*** The total employer contribution ($469,121,424) is approximately equal to the average employer contribution rate from Schedule B (8.00 percent) times the total projected covered compensation of $5,851,704,000. The base contribution rate of 4.82 percent was determined as the percentage needed to produce employer contribution amounts by employer group that sum to $469,121,424.
17 SCHEDULE C

State Employees' Retirement SystemState Police and Enforcement Officers Additional Annuity Rate
(Fiscal Year 2011 - 2012)
State PoliceEnforcement
Officers1) Balance in Benefit Account
as of December 31, 2010 $1,631,216,832 $43,303,763
2) Present Value of Benefits forAnnuitants and Beneficiaries 1,631,216,832 43,303,763
3) Assets available for additional annuitiesfor Active Members: (1) - (2) - -
4) Present Value of additional annuitiesfor Active Members - -
5) Present Value of Future Contributionto fund additional annuities: (4) - (3); not less than zero - -
6) Present Value of Future Compensationfor eligible Active Members * *
7) Contribution Rate as apercentage of payrollpayable January 1: (5) / (6) 0.00% 0.00%
* Not calculated because additional annuity is fully funded.
18 SCHEDULE D

State Employees' Retirement SystemAnalysis of the Change in Employer Contribution Rate
Normal UnfundedCost Liability Total
I. December 31, 2009 Valuation 9.53% -3.89% 5.64%
II. Changes in the December 31, 2010 Valuation:A)
-4.62% 4.09% -0.53%B) Loss from investment earnings 1.90% 1.90%C)
1.00% 1.00%
D) Pay increases different than assumptions -0.64% -0.64%E) Changes in Economic Assumptions -0.78% -0.36% -1.14%F) Changes in Demographic Assumptions 0.06% 0.15% 0.21%
G) Change in demographics of new entrants -0.11% 0.10% -0.01%H) Impact of Liability Fresh Start Amortization 12.38% 12.38%I) Change in amortization due to change in payroll 0.00% 0.12% 0.12%J) Total Change -5.45% 18.74% 13.29%
III. December 31, 2010 Valuation: 4.08% 14.85% 18.93% I + II(J)
I. December 31, 2009 Unfunded Liability
II. Expected Amortization Payment (as modified by the Fresh Start)
III. Expected Liability as of December 31, 2010[ ( I x 1.080 ) - II ]
IV. Change in Liability Due to:A)
B) Loss from investment earningsC)
D) Pay increases different than assumptionsE) Changes in Economic AssumptionsF) Changes in Demographic Assumptions
G) Change in demographics of new entrantsH) Total change
V. December 31, 2010 Unfunded Liability: III + IV(H)
64,191,000
(235,734,336)
98,384,109
2,694,534,957$
Underfunding due to retroactive Fresh Start and other changes
Underfunding due to retroactive Fresh Start and other changes
(421,223,587)
Benefit changes under Act 2010-120 (including increase in liability due to decrease in normal cost)
9,735,648,534$
Analysis of the Change in the Unfunded Liability
4,192,690,873$
5,592,323,524$
496,751,745
5,542,957,661$
Benefit changes under Act 2010-120 (including increase in liability due to decrease in normal cost)
741,206,894
1,251,331,836
19 SCHEDULE E

State Employees' Retirement SystemActuarial Balance Sheet as of December 31, 2010
Present Assets: Present Value of Benefits Payable to Annuitants and Beneficiaries from:
Members' Savings Account 4,409,444,260$ Annuity Reserve Account 17,320,834,699$ Annuity Reserve Account 17,320,834,699 State Police Benefit Account 1,631,216,832 State Police Benefit Account 1,631,216,832 Enforcement Officers' Benefit Account 43,303,763 State Accumulation Account * 2,474,580,673 Enforcement Officers' Benefit Account 43,303,763 Supplemental Annuity Account -
Total Present Assets (Market Value) 25,879,380,227$ Total for Annuitants and Beneficiaries 18,995,355,294$
Adjustment to Smooth Market Fluctuations 3,564,565,208
Total Present Assets (Actuarial Value) 29,443,945,435$
Present Value of Future Contributions Present Value of Benefits to Active and Inactive Members from:
Members' Savings Account and State Accumulation AccountMembers' Contributions (Employee) 3,354,296,138$ Superannuation and withdrawal 24,164,150,537$ Normal Cost Contributions (Employer) 2,380,902,534 Disability 911,756,256 Accrued Liability Amortization Death 798,142,741 (Employer) 9,735,648,534 Refunds 45,387,813
Supplemental Annuity Amortization Subtotal 25,919,437,347$ (Employer) - Special State Police Contributions State Police Benefit Account - (Employer) - Special Enforcement Officer Enforcement Officers' Benefit Account - Contributions (Employer) -
Total Present Value of Benefits toTotal Future Contributions 15,470,847,206$ Active and Inactive Members 25,919,437,347$
Total Assets 44,914,792,641$ Total Liabilities 44,914,792,641$
* Includes $3,821,602 in directed commissions.
ASSETS LIABILITIES
20 SCHEDULE F

State Employees' Retirement SystemRequired Transfers Within SERS Accounts
I. Annuity Reserve Account
Balance as reported by SERS 17,080,448,533$ Transfer from State Accumulation Account 240,386,166 Transfer to Supplemental Annuity Account -
December 31, 2010 balance after transfers 17,320,834,699$
II. State Accumulation Account *
Balance as reported by SERS 2,739,533,693$ Transfer to Enforcement Officers' Benefit Account (734,841) Transfer to State Police Benefit Account (23,832,013) Transfer to Annuity Reserve Account (240,386,166)
December 31, 2010 balance after transfers 2,474,580,673$
III. Enforcement Officers' Benefit Account
Balance as reported by SERS 42,568,922$ Transfer from State Accumulation Account 734,841 Transfer from Supplemental Annuity Account -
December 31, 2010 balance after transfers 43,303,763$
IV. State Police Benefit Account
Balance as reported by SERS 1,607,384,819$ Transfer from State Accumulation Account 23,832,013 Transfer from Supplemental Annuity Account -
December 31, 2010 balance after transfers 1,631,216,832$
V. Supplemental Annuity Account
Balance as reported by SERS -$ Transfer from Annuity Reserve Account - Transfer to State Police Benefit Account - Transfer to Enforcement Officers' Benefit Account -
December 31, 2010 balance after transfers -$
* Balance includes $3,821,602 in directed commissions.
21 SCHEDULE G
State Employees' Retirement SystemAccounting Disclosure Statements
I. Schedule of Funding Progress as of December 31, 2010(Dollars in Thousands)
Actuarial Valuation Date
Actuarial Value of Assets
Actuarial Accrued Liability
(AAL)
Unfunded Actuarial
Accrued Liability (UAAL)
Funded Ratio
Covered Compensation
Unfunded Actuarial Accrued Liability as a
Percentage of Covered
Compensation(a) (b) (b-a) (a) / (b) (c) ((b-a)/c)
12/31/1992 11,769,388 11,488,414 (280,974) 102.4% 3,533,428 -8.0%12/31/1993 13,060,613 12,213,736 (846,877) 106.9% 3,731,515 -22.7%12/31/1994 13,991,485 13,742,056 (249,429) 101.8% 3,990,440 -6.3%
12/31/1995 * 15,510,309 15,067,205 (443,104) 102.9% 4,021,605 -11.0%12/31/1996 16,841,069 15,936,616 (904,453) 105.7% 4,163,683 -21.7%
12/31/1997 18,565,136 17,288,413 (1,276,723) 107.4% 4,219,034 -30.3%12/31/1998 20,670,711 18,357,899 (2,312,812) 112.6% 4,446,147 -52.0%12/31/1999 23,624,267 19,091,840 (4,532,427) 123.7% 4,519,112 -100.3%
12/31/2000 * 26,094,306 19,702,278 (6,392,028) 132.4% 4,769,180 -134.0%12/31/2001 27,505,494 23,658,757 (3,846,737) 116.3% 4,872,375 -78.9%
12/31/2002 27,497,464 25,650,389 (1,847,075) 107.2% 5,093,454 -36.3%12/31/2003 27,465,615 26,179,761 (1,285,854) 104.9% 4,965,360 -25.9%12/31/2004 26,900,027 27,999,026 1,099,000 96.1% 5,093,573 21.6%
12/31/2005 * 26,793,782 28,851,716 2,057,934 92.9% 5,138,377 40.1%12/31/2006 28,148,834 30,364,997 2,216,163 92.7% 5,661,675 39.1%
12/31/2007 30,839,877 31,753,971 914,093 97.1% 5,529,069 16.5%12/31/2008 ** 30,635,621 34,437,396 3,801,775 89.0% 5,660,319 67.2%12/31/2009 30,204,693 35,797,017 5,592,324 84.4% 5,935,988 94.2%
12/31/2010* 29,443,945 39,179,594 9,735,649 75.2% 5,851,704 166.4%* Revised economic and demographic assumptions due to experience review.** Revised interest rate assumption from 8.5% to 8.0%.
22SCHEDULE H
(Page 1 of 4)

State Employees' Retirement SystemAccounting Disclosure Statements (continued)
II. Schedule of Employer Contributions as of December 31, 2010(Dollars in Thousands)
Calendar Year
Annual Required Contribution (ARC)
Actual Contribution
Percentage Contributed
1992 319,093 319,093 100.0%1993 310,089 304,122 98.1%1994 342,158 342,927 100.2%1995 376,692 384,506 102.1%1996 373,903 373,903 100.0%
1997 324,093 324,093 100.0%1998 310,501 310,501 100.0%1999 269,869 269,869 100.0%2000 168,002 168,002 100.0%2001 52,104 76,709 147.2%
2002 22,906 50,831 221.9%2003 55,079 67,947 123.4%2004 105,229 105,229 100.0%2005 319,190 147,163 46.1%2006 548,745 195,407 35.6%
2007 617,253 242,337 39.3%2008 584,248 233,138 39.9%2009 643,861 251,870 39.1%2010 866,822 272,525 31.4%
Notes Pertaining to Governmental Accounting Standards Board Statement No. 25
The actual contribution amounts in the above table include the employer share of regularcontributions, the employer share of purchased service and contributions for employee service underthe Public School Employees' Retirement System.
The information presented in the required supplementary schedules was determined as part of theactuarial valuations at the dates indicated. Additional information as of the latest actuarial valuationfollows.
23SCHEDULE H
(Page 2 of 4)

State Employees' Retirement System
SCHEDULE H (Page 3 of 4)
24
Accounting Disclosure Statements (continued)
Valuation Date December 31, 2010 Actuarial cost method Variation of Entry-age Actuarial Cost
Method Amortization method 10-year or 30-year schedule with level
payments Remaining amortization period 29 to 30 years Asset valuation method 5-year smooth market Actuarial Assumptions Investment rate of return 8.0 percent Projected compensation increases Average increase of 6.2 percent
(range: 4.3 to 11.05 percent) Inflation 2.75 percent Cost-of-living adjustments None The annual employer contribution as set forth in the SERC is equal to the sum of the following:
(1) The employer share of the normal cost. (2) The fresh start amortization of the December 31, 2009 unfunded liability over a 30-year
period beginning July 1, 2010 and ending on June 30, 2040. (3) The amortization of the change in liability due to Act 2010-120 over a 30-year period
beginning July 1, 2011 and ending on June 30, 2041. (4) The amortization of changes in liability due to actual experience differing from
assumed experience after December 31, 2009 over 30-year periods beginning with the July first following the actuarial valuation determining such changes.
Valuations are performed on December 31 of each year and the results are presented to the Board as a basis for determining the employer contribution rate for the year beginning July 1 after the valuation date. The Board has adopted the rate from the valuation unless information available after or as part of the valuation supports an adjustment to the valuation rate. Apart from the statutory funding requirements set forth in the SERC, there is a separate accounting standard that defines an Annual Required Contribution (ARC) for financial reporting purposes. As long as the statutory annual employer contribution, as defined above, is at least equal to the minimum contribution reported under GASB Statement No. 25, the statutory annual employer contribution will be deemed to be the ARC. Should the statutory annual employer contribution be less than the minimum contribution reported under GASB, the GASB minimum will be the ARC.

State Employees' Retirement System
SCHEDULE H (Page 4 of 4)
25
Accounting Disclosure Statements (continued)
GASB Statement No. 25 defines the ARC to be equal to the employer normal cost plus an amount to amortize the unfunded actuarial accrued liability. The Statement prescribes the maximum acceptable period over which the total unfunded actuarial liability should be amortized. GASB requires that the “equivalent single amortization period” for all combined amortizations should not exceed the maximum acceptable period. Under the contribution collars from Act 2010-120, the current contribution level results in an “equivalent single amortization period” in excess of the maximum acceptable period and thus an actual contribution less than the ARC. In this case, the ARC is determined using a 30-year amortization period. The Board has adopted the valuation rate as the contribution rate since 1995. The Board adopted slightly different rates in 1993 and 1994 based on information available after the valuation was performed. In 1993, the valuation rate of 9.27 percent was lowered to 8.92 percent because it was determined that the covered compensation reported for the valuation was unusually high and that future covered compensation was expected to be relatively lower. In 1994, the valuation rate of 8.53 percent was increased to 8.92 percent to allow for the extension of the early retirement window and acceleration of the longevity pay scales. The actuary agreed with the actions taken by the Board that resulted in some difference between the ARC and the actual contribution. The table presented on page 2 of Schedule H shows the ARC based on the actuarial valuation. The effect of the adjustments in 1993 and 1994 extended over three calendar years so the 1993 through 1995 actual contributions are different from the ARCs in those years. During 2001, 2002, and 2003, actual contributions exceeded the ARC. For the period July 1, 2001 through June 30, 2003, the ARC was set at zero. However, contributions were made by employers of some special class members for the cost of additional benefits including payment of past liabilities for retroactive benefit enhancements. Collection of those amounts resulted in the actual contributions exceeding the ARC for all or part of calendar years 2001, 2002 and 2003. All amortization payments are currently based upon a 30-year schedule of contributions which remain level during the amortization period. The employer cost is determined as a percent of covered compensation, and the employer contributes that percent of the compensation of all covered members during each fiscal year. The employer contribution has been below the GASB Statement No. 25 minimum since July 1, 2005, and we anticipate that the employer contribution to SERS will be lower than the ARC through June 30, 2015. Thereafter, provided that employer contributions are made in accordance with current law, we expect actual employer contributions to exceed the GASB minimum.

State Employees' Retirement SystemSolvency Test
(1) (2) (3)Active
Participants TotalActive Annuitants (Employer Actuarial Actuarial
Valuation Participant and Financed Accrued Value ofDate Contributions Beneficiaries Portion) Liability (AAL) Assets
December 31, 1992 1,994,567$ 4,621,318$ 4,872,529$ 11,488,414$ 11,769,388$ 100.0 % 100.0 % 100.0 % 102.4 % December 31, 1993 2,170,593 4,806,907 5,236,236 12,213,736 13,060,613 100.0 100.0 100.0 106.9 December 31, 1994 2,352,731 5,039,221 6,350,104 13,742,056 13,991,485 100.0 100.0 100.0 101.8 December 31, 1995 2,499,485 5,649,454 6,918,265 15,067,205 15,510,309 100.0 100.0 100.0 102.9 December 31, 1996 2,646,630 6,027,333 7,262,653 15,936,616 16,841,069 100.0 100.0 100.0 105.7 December 31, 1997 2,748,177 6,951,411 7,588,825 17,288,413 18,565,136 100.0 100.0 100.0 107.4 December 31, 1998 2,904,232 7,200,000 8,253,666 18,357,899 20,670,711 100.0 100.0 100.0 112.6 December 31, 1999 2,989,489 7,779,993 8,322,358 19,091,840 23,624,267 100.0 100.0 100.0 123.7 December 31, 2000 3,182,776 8,148,876 8,370,626 19,702,278 26,094,306 100.0 100.0 100.0 132.4 December 31, 2001 3,344,107 8,684,734 11,629,915 23,658,757 27,505,494 100.0 100.0 100.0 116.3 December 31, 2002 3,498,672 10,129,669 12,022,048 25,650,389 27,497,464 100.0 100.0 100.0 107.2 December 31, 2003 3,588,664 11,296,520 11,294,578 26,179,761 27,465,615 100.0 100.0 100.0 104.9 December 31, 2004 3,593,576 12,779,570 11,625,880 27,999,026 26,900,027 100.0 100.0 90.5 96.1 December 31, 2005 3,696,477 14,000,196 11,155,043 28,851,716 26,793,782 100.0 100.0 81.6 92.9 December 31, 2006 3,916,841 14,474,525 11,973,631 30,364,997 28,148,834 100.0 100.0 81.5 92.7 December 31, 2007 3,849,293 16,255,843 11,648,835 31,753,971 30,839,877 100.0 100.0 92.2 97.1 December 31, 2008 4,068,036 17,305,971 13,063,389 34,437,396 30,635,621 100.0 100.0 70.9 89.0 December 31, 2009 4,280,680 17,962,741 13,553,596 35,797,017 30,204,693 100.0 100.0 58.7 84.4 December 31, 2010 4,409,444 18,995,355 15,774,795 39,179,594 29,443,945 100.0 100.0 38.3 75.2
Actuarial Accrued Liabilities For
(Amounts in Thousands)(1) (2) Ratio
FundedPortion of Accrued LiabilitiesCovered by Reported Assets
(3)
26 SCHEDULE I

State Employees' Retirement SystemActuarial Value of Assets
I. Development of 12/31/10 Expected Actuarial Value: A) Actuarial Value as of 12/31/09 30,204,693,112$ B) Contributions in 2010 621,574,047C) Benefits and Expenses in 2010 (2,473,296,441)D) Investment return at 8.0% to 12/31/10 on (A) 2,416,375,449E) Investment return at 8.0% to 12/31/10 on (B) and (C): (74,068,896)
8.0% x .5 x ((B) + (C))F) Expected Actuarial Value as of 12/31/10: 30,695,277,271$
(A) + (B) + (C) + (D) + (E)
II. Previous Differences Not Yet Amortized:
A) Unrecognized amount of 12/31/06 Difference: 502,644,985$ .2 x $2,513,224,923
B) Unrecognized amount of 12/31/07 Difference: 1,171,884,478 .4 x $2,929,711,196
C) Unrecognized amount of 12/31/08 Difference: (8,167,298,074) .6 x ($13,612,163,456)
D) Unrecognized amount of 12/31/09 Difference: 942,786,356 .8 x $1,178,482,945
E) Total (5,549,982,255)$
III. Gain or Loss from 2010
A) Market Value of Assets on 12/31/10 25,879,380,227$ B) Expected Market Value II(E) + I(F) 25,145,295,016C) Gain (loss) from 2010 Investments (A) - (B) 734,085,211$
IV. Development of Actuarial Value of Assets as of 12/31/10:
A) 20% of $2,513,224,923 (12/31/06 Difference): 502,644,985$ B) 20% of $2,929,711,196 (12/31/07 Difference): 585,942,239C) 20% of ($13,612,163,456) (12/31/08 Difference): (2,722,432,691)D) 20% of $1,178,482,945 (12/31/09 Difference): 235,696,589E) 20% of $734,085,211 (12/31/10 Difference): 146,817,042F) Total Difference: (1,251,331,836)$
(A) + (B) + (C) + (D) + (E)G) Actuarial Value at 12/31/10: I(F) + IV(F) 29,443,945,435$
27 SCHEDULE J

State Employees' Retirement SystemProjection of Population, Benefits, and Contributions
Projection of Annuitants, Beneficiaries and Active ParticipantsActual Data Through 2010
Calendar Year
New Annuitants During the
Year
AnnuitantDeaths During
the Year
Total Annuitants
(End of Year)
New Beneficiaries During the
Year
Beneficiary Deaths
During the Year
Total Beneficiaries (End of Year)
Total Annuitants
and Beneficiaries
Active Participants
1992 73,897 6,595 80,492 109,609 1993 73,894 6,796 80,690 111,962 1994 73,780 7,055 80,835 114,120 1995 74,110 7,094 81,204 112,637 1996 75,609 7,477 83,086 110,922
1997 77,667 7,790 85,457 108,684 1998 78,017 7,817 85,834 108,893 1999 80,095 7,948 88,043 108,035 2000 80,289 8,103 88,392 109,469 2001 80,911 8,306 89,217 109,716
2002 82,805 8,423 91,228 111,059 2003 85,808 8,604 94,412 109,018 2004 89,869 8,858 98,727 108,405 2005 92,120 9,059 101,179 109,981 2006 92,879 9,181 102,060 110,972
2007 97,657 9,473 107,130 109,610 2008 98,492 9,654 108,146 110,866 2009 99,776 9,863 109,639 110,107 2010 101,701 10,012 111,713 109,255 2011 5,262 3,317 103,646 663 540 10,135 113,781 109,255
2012 5,306 3,363 105,589 673 588 10,220 115,809 109,255 2013 5,382 3,396 107,575 679 629 10,270 117,845 109,255 2014 5,393 3,422 109,546 684 663 10,291 119,837 109,255 2015 5,263 3,449 111,360 690 689 10,292 121,652 109,255 2016 5,165 3,480 113,045 696 711 10,277 123,322 109,255
2017 5,022 3,504 114,563 701 726 10,252 124,815 109,255 2018 4,717 3,533 115,747 707 736 10,223 125,970 109,255 2019 4,504 3,564 116,687 713 742 10,194 126,881 109,255 2020 4,258 3,595 117,350 719 745 10,168 127,518 109,255 2021 4,055 3,643 117,762 729 748 10,149 127,911 109,255
The retirement projections in Schedule K are based upon the current retirement assumptions used for thevaluation.
28SCHEDULE K
(Page 1 of 3)
State Employees' Retirement SystemProjection of Population, Benefits, and Contributions
Actual ProjectedEmployer Rate
(Fiscal YearYear Employee Employer Employee Employer Beginning July 1)
1992 187$ 319$ 851$ 1993 190 304 781 1994 193 343 812 1995 202 385 894 1996 210 374 943
1997 213 324 1,037 1998 222 311 1,080 1999 224 270 1,248 2000 232 168 1,198 2001 240 77 1,266
2002 304 51 1,450 2003 308 68 1,656 2004 302 106 1,880 2005 306 147 1,966 2006 317 196 1,943
2007 334 242 2,361 2008 337 233 2,231 2009 349 252 2,297 2010 349 273 2,473 2011 355 383 6.0% 6.5% 8.0% 2,551
2012 358 579 6.0% 9.8% 11.5% 2,673 2013 369 842 6.0% 13.8% 16.0% 2,794 2014 380 1,151 6.0% 18.3% 20.5% 2,911 2015 391 1,479 6.0% 22.8% 25.0% 3,027 2016 403 1,703 6.0% 25.4% 25.9% 3,143
2017 416 1,768 6.0% 25.6% 25.4% 3,250 2018 428 1,784 6.0% 25.1% 24.8% 3,354 2019 441 1,797 6.0% 24.5% 24.2% 3,454 2020 455 1,812 6.0% 24.0% 23.7% 3,550 2021 469 1,826 6.0% 23.5% 23.2% 3,655
Expenses
This projection is based upon these assumptions: a projected investment return of 8.0 percent in 2011 and after; general pay increases of 3.05percent; no future COLAs. The employer contributions are subject to the Act 2010-120 collars, which are projected to be applicable through2015, after which actuarially determined employer contribution rates apply.
Contributions as a Percent of Pay
(After 2010, Based Upon Calendar YearBlended Fiscal Projections) Benefits and
Projection of Expected Contributions and Benefits - Reflecting Act 120 CollarsActual Data Through 2010 (Dollars in Millions)
Calendar Year Contributions( Employer Rates Based Upon
Blended Fiscal Projections)
Calendar Year Contributions
29SCHEDULE K
(Page 2 of 3)

State Employees' Retirement SystemProjection of Population, Benefits, and Contributions
Actual ProjectedEmployer Rate
(Fiscal YearYear Employee Employer Employee Employer Beginning July 1)
1992 187$ 319$ 851$ 1993 190 304 781 1994 193 343 812 1995 202 385 894 1996 210 374 943
1997 213 324 1,037 1998 222 311 1,080 1999 224 270 1,248 2000 232 168 1,198 2001 240 77 1,266
2002 304 51 1,450 2003 308 68 1,656 2004 302 106 1,880 2005 306 147 1,966 2006 317 196 1,943
2007 334 242 2,361 2008 337 233 2,231 2009 349 252 2,297 2010 349 273 2,473 2011 355 705 6.0% 12.0% 18.9% 2,551
2012 358 1,205 6.0% 20.3% 21.6% 2,673 2013 369 1,417 6.0% 23.1% 24.7% 2,794 2014 380 1,525 6.0% 24.2% 23.7% 2,911 2015 391 1,521 6.0% 23.4% 23.1% 3,027 2016 403 1,535 6.0% 22.9% 22.7% 3,143
2017 416 1,553 6.0% 22.5% 22.3% 3,250 2018 428 1,567 6.0% 22.0% 21.8% 3,354 2019 441 1,581 6.0% 21.6% 21.3% 3,454 2020 455 1,595 6.0% 21.1% 20.9% 3,550 2021 469 1,610 6.0% 20.7% 20.5% 3,655
Benefits andCalendar Year(After 2010, Based Upon
Blended Fiscal Projections)
This projection is based upon these assumptions: a projected investment return of 8.0 percent in 2011 and after; general pay increases of3.05 percent; no future COLAs. No Act 2010-120 employer contribution collars are assumed in this projection, therefore actuariallydetermined employer contribution rates apply.
Calendar Year Contributions
Expenses
Projection of Expected Contributions and Benefits - Without Act 120 CollarsActual Data Through 2010 (Dollars in Millions)
Contributions as a Percent of PayCalendar Year Contributions
( Employer Rates Based UponBlended Fiscal Projections)
30SCHEDULE K
(Page 3 of 3)

State Employees' Retirement SystemI. Age, Service and Salary Profile of Active Participants as of December 31, 2010
Age AverageGroup 0 - 4 5 - 9 10 - 14 15 - 19 20 - 24 25 - 29 30+ Total Salary
Less than 20 9 0 0 0 0 0 0 9 25,862$ 20-24 829 12 0 0 0 0 0 841 29,636 25-29 2,056 561 4 0 0 0 0 2,621 36,494 30-34 1,600 1,303 343 3 0 0 0 3,249 42,316 35-39 1,292 1,178 875 270 10 0 0 3,625 46,535 40-44 1,353 1,177 1,007 1,055 425 18 0 5,035 50,167 45-49 1,325 1,170 873 997 1,223 563 37 6,188 52,690 50-54 1,306 1,284 937 963 1,270 1,293 800 7,853 54,113 55-59 1,177 1,252 933 991 1,052 1,066 1,536 8,007 56,022 60-64 858 843 654 572 486 397 753 4,563 55,298 65+ 357 371 276 210 116 91 270 1,691 58,241
Total 12,162 9,151 5,902 5,061 4,582 3,428 3,396 43,682 51,050$
Age AverageGroup 0 - 4 5 - 9 10 - 14 15 - 19 20 - 24 25 - 29 30+ Total Salary
Less than 20 20 0 0 0 0 0 0 20 24,461$ 20-24 848 28 0 0 0 0 0 876 27,946 25-29 2,094 623 36 0 0 0 0 2,753 34,044 30-34 1,633 1,400 448 22 0 0 0 3,503 39,543 35-39 1,409 1,167 795 374 28 0 0 3,773 41,953 40-44 1,479 1,284 854 847 652 51 0 5,167 44,183 45-49 1,624 1,298 899 844 998 777 136 6,576 46,309 50-54 1,493 1,430 1,031 1,012 1,033 994 1,040 8,033 47,838 55-59 1,128 1,239 907 941 1,091 902 1,429 7,637 49,905 60-64 524 751 559 487 468 332 477 3,598 48,697 65+ 150 192 179 134 102 68 118 943 46,822
Total 12,402 9,412 5,708 4,661 4,372 3,124 3,200 42,879 45,083$
Active Participants*
Average Age 46.95Average Service 12.13
Males - Full Years of Service to December 31, 2010
Average Age 47.95Average Service 12.53
Females - Full Years of Service to December 31, 2010
* The following three pages contain information on members in special categories. These include selectedhazardous duty members, legislators, judges and district justices. The above information is for all other activemembers. Page five of Schedule L is the total of all active categories. Page six is the total of all activeparticipants and inactive and vested participants.
31SCHEDULE L
(Page 1 of 10)

State Employees' Retirement SystemI. Age, Service and Salary Profile of Active Participants as of December 31, 2010
Age AverageGroup 0 - 4 5 - 9 10 - 14 15 - 19 20 - 24 25 - 29 30+ Total Salary
Less than 20 0 0 0 0 0 0 0 0 -$ 20-24 163 0 0 0 0 0 0 163 37,624 25-29 1,322 188 1 0 0 0 0 1,511 46,005 30-34 1,008 828 155 4 0 0 0 1,995 51,274 35-39 632 788 931 308 11 0 0 2,670 58,274 40-44 485 597 927 1,582 657 8 0 4,256 67,450 45-49 287 427 440 825 1,087 256 1 3,323 68,404 50-54 196 249 306 308 449 322 53 1,883 65,384 55-59 119 160 214 240 206 150 89 1,178 63,981 60-64 71 121 155 179 125 61 48 760 60,946 65+ 22 17 35 35 18 11 11 149 65,369
Total 4,305 3,375 3,164 3,481 2,553 808 202 17,888 61,631$
Age AverageGroup 0 - 4 5 - 9 10 - 14 15 - 19 20 - 24 25 - 29 30+ Total Salary
Less than 20 0 0 0 0 0 0 0 0 -$ 20-24 41 0 0 0 0 0 0 41 39,362 25-29 285 36 0 0 0 0 0 321 43,668 30-34 258 184 27 1 0 0 0 470 47,402 35-39 187 180 129 29 0 0 0 525 50,473 40-44 155 142 144 125 28 0 0 594 54,085 45-49 152 98 110 94 81 22 1 558 55,937 50-54 99 105 73 82 77 56 18 510 58,884 55-59 57 67 71 74 40 27 26 362 58,086 60-64 19 28 22 31 21 9 12 142 64,696 65+ 3 5 5 6 6 2 1 28 57,100
Total 1,256 845 581 442 253 116 58 3,551 53,391$
* Enforcement officers, correction officers, psychiatric security aides, and officers of the PennsylvaniaState Police and the Delaware River Port Authority
Selected Hazardous Duty*
Males - Full Years of Service to December 31, 2010
Average Service 9.29
Average Age 42.71Average Service 11.90
Females - Full Years of Service to December 31, 2010
Average Age 43.12
32SCHEDULE L
(Page 2 of 10)

State Employees' Retirement SystemI. Age, Service and Salary Profile of Active Participants as of December 31, 2010
Age AverageGroup 0 - 4 5 - 9 10 - 14 15 - 19 20 - 24 25 - 29 30+ Total Salary
Less than 20 0 0 0 0 0 0 0 0 -$ 20-24 0 0 0 0 0 0 0 0 - 25-29 4 1 0 0 0 0 0 5 79,623 30-34 6 2 0 0 0 0 0 8 81,019 35-39 8 6 2 0 0 0 0 16 79,623 40-44 13 2 4 1 0 0 0 20 80,181 45-49 7 4 9 5 0 0 0 25 84,027 50-54 12 10 5 2 5 2 1 37 83,916 55-59 4 5 8 5 2 3 4 31 84,920 60-64 3 4 3 4 6 4 4 28 84,137 65+ 3 2 2 2 2 4 9 24 84,933
Total 60 36 33 19 15 13 18 194 83,279$
Age AverageGroup 0 - 4 5 - 9 10 - 14 15 - 19 20 - 24 25 - 29 30+ Total Salary
Less than 20 0 0 0 0 0 0 0 0 -$ 20-24 0 0 0 0 0 0 0 0 - 25-29 0 0 0 0 0 0 0 0 - 30-34 2 0 0 0 0 0 0 2 79,623 35-39 0 1 0 0 0 0 0 1 79,623 40-44 2 0 1 1 1 0 0 5 81,857 45-49 3 0 0 2 1 0 0 6 82,304 50-54 2 0 1 1 0 0 0 4 82,415 55-59 0 1 0 0 1 1 1 4 83,851 60-64 1 2 0 3 1 0 0 7 79,623 65+ 1 0 2 3 2 1 0 9 79,623
Total 11 4 4 10 6 2 1 38 81,079$
*Legislators are not required to join the retirement system, therefore the total participantcount may not add to 253.
Legislators*
Males - Full Years of Service to December 31, 2010
Average Service 12.92
Average Age 52.18Average Service 12.54
Females - Full Years of Service to December 31, 2010
Average Age 54.89
33SCHEDULE L
(Page 3 of 10)

State Employees' Retirement SystemI. Age, Service and Salary Profile of Active Participants as of December 31, 2010
Age AverageGroup 0 - 4 5 - 9 10 - 14 15 - 19 20 - 24 25 - 29 30+ Total Salary
Less than 20 0 0 0 0 0 0 0 0 -$ 20-24 0 0 0 0 0 0 0 0 - 25-29 0 0 0 0 0 0 0 0 - 30-34 1 1 0 0 0 0 0 2 83,057 35-39 5 2 2 0 0 0 0 9 89,936 40-44 21 11 6 1 0 0 0 39 102,086 45-49 23 17 15 10 2 1 0 68 105,703 50-54 27 33 25 19 7 3 0 114 114,437 55-59 29 48 27 50 24 21 6 205 114,431 60-64 14 39 40 54 29 22 13 211 126,743 65+ 3 13 13 28 19 13 12 101 130,808
Total 123 164 128 162 81 60 31 749 118,295$
Age AverageGroup 0 - 4 5 - 9 10 - 14 15 - 19 20 - 24 25 - 29 30+ Total Salary
Less than 20 0 0 0 0 0 0 0 0 -$ 20-24 0 0 0 0 0 0 0 0 - 25-29 0 0 0 0 0 0 0 0 - 30-34 0 1 0 0 0 0 0 1 80,935 35-39 4 5 1 0 0 0 0 10 81,041 40-44 6 11 7 0 0 0 0 24 111,149 45-49 20 10 5 6 0 0 0 41 116,657 50-54 16 18 16 6 4 1 0 61 128,530 55-59 10 14 11 22 13 3 3 76 131,148 60-64 2 6 6 13 6 7 2 42 129,312 65+ 0 1 4 3 5 5 1 19 128,064
Total 58 66 50 50 28 16 6 274 124,138$
Judges And Magisterial District Judges
Males - Full Years of Service to December 31, 2010
Average Service 11.82
Average Age 57.05Average Service 13.45
Females - Full Years of Service to December 31, 2010
Average Age 53.85
34SCHEDULE L
(Page 4 of 10)

State Employees' Retirement SystemI. Age, Service and Salary Profile of Active Participants as of December 31, 2010
Age AverageGroup 0 - 4 5 - 9 10 - 14 15 - 19 20 - 24 25 - 29 30+ Total Salary
Less than 20 9 0 0 0 0 0 0 9 25,862$ 20-24 992 12 0 0 0 0 0 1,004 30,933 25-29 3,382 750 5 0 0 0 0 4,137 40,020 30-34 2,615 2,134 498 7 0 0 0 5,254 45,792 35-39 1,937 1,974 1,810 578 21 0 0 6,320 51,640 40-44 1,872 1,787 1,944 2,639 1,082 26 0 9,350 58,315 45-49 1,642 1,618 1,337 1,837 2,312 820 38 9,604 58,584 50-54 1,541 1,576 1,273 1,292 1,731 1,620 854 9,887 57,066 55-59 1,329 1,465 1,182 1,286 1,284 1,240 1,635 9,421 58,384 60-64 946 1,007 852 809 646 484 818 5,562 58,925 65+ 385 403 326 275 155 119 302 1,965 62,838
Total 16,650 12,726 9,227 8,723 7,231 4,309 3,647 62,513 54,983$
Age AverageGroup 0 - 4 5 - 9 10 - 14 15 - 19 20 - 24 25 - 29 30+ Total Salary
Less than 20 20 0 0 0 0 0 0 20 24,461$ 20-24 889 28 0 0 0 0 0 917 28,456 25-29 2,379 659 36 0 0 0 0 3,074 35,049 30-34 1,893 1,585 475 23 0 0 0 3,976 40,503 35-39 1,600 1,353 925 403 28 0 0 4,309 43,090 40-44 1,642 1,437 1,006 973 681 51 0 5,790 45,509 45-49 1,799 1,406 1,014 946 1,080 799 137 7,181 47,489 50-54 1,610 1,553 1,121 1,101 1,114 1,051 1,058 8,608 49,080 55-59 1,195 1,321 989 1,037 1,145 933 1,459 8,079 51,052 60-64 546 787 587 534 496 348 491 3,789 50,248 65+ 154 198 190 146 115 76 120 999 48,951
Total 13,727 10,327 6,343 5,163 4,659 3,258 3,265 46,742 46,206$
All Active Participants
Males - Full Years of Service to December 31, 2010
Average Service 11.91
Average Age 46.58Average Service 12.36
Females - Full Years of Service to December 31, 2010
Average Age 46.71
35SCHEDULE L
(Page 5 of 10)

State Employees' Retirement SystemII. Age and Service Profile of Active Participants and Inactive and Vested Participants
As of December 31, 2010
AgeGroup 0 - 4 5 - 9 10 - 14 15 - 19 20 - 24 25 - 29 30+ Total
Less than 20 9 0 0 0 0 0 0 9 20-24 992 12 0 0 0 0 0 1,004 25-29 3,396 767 6 0 0 0 0 4,169 30-34 2,632 2,237 503 8 0 0 0 5,380 35-39 1,957 2,126 1,864 587 21 0 0 6,555 40-44 1,903 1,957 2,051 2,675 1,089 26 0 9,701 45-49 1,685 1,772 1,448 1,882 2,326 829 39 9,981 50-54 1,611 1,692 1,376 1,360 1,772 1,646 869 10,326 55-59 1,409 1,593 1,284 1,336 1,323 1,273 1,694 9,912 60-64 1,044 1,081 907 854 695 520 867 5,968 65+ 436 436 347 298 162 126 315 2,120
Total 17,074 13,673 9,786 9,000 7,388 4,420 3,784 65,125
AgeGroup 0 - 4 5 - 9 10 - 14 15 - 19 20 - 24 25 - 29 30+ Total
Less than 20 20 0 0 0 0 0 0 20 20-24 894 28 0 0 0 0 0 922 25-29 2,397 686 36 0 0 0 0 3,119 30-34 1,924 1,732 482 23 0 0 0 4,161 35-39 1,651 1,561 971 411 28 0 0 4,622 40-44 1,714 1,660 1,113 1,009 688 51 0 6,235 45-49 1,891 1,595 1,145 997 1,096 809 137 7,670 50-54 1,744 1,754 1,307 1,174 1,144 1,061 1,086 9,270 55-59 1,438 1,554 1,163 1,119 1,188 966 1,522 8,950 60-64 773 890 656 570 534 376 527 4,326 65+ 208 236 219 161 125 83 129 1,161
Total 14,654 11,696 7,092 5,464 4,803 3,346 3,401 50,456
Average Age 47.02Average Service 11.72
Active Participants and Inactive and Vested Participants
Males - Full Years of Service to December 31, 2010
Females - Full Years of Service to December 31, 2010
Average Age 46.75Average Service 12.31
36SCHEDULE L
(Page 6 of 10)

State Employees' Retirement SystemIII. Age and Benefit Profile of Annuitants and Beneficiaries as of December 31, 2010
Age Number Annual Annuity Number Annual Annuity Number Annual AnnuityUnder 25 - -$ - -$ - -$
25-29 - - - - - - 30-34 - - - - - - 35-39 - - - - - - 40-44 - - - - - -
45-49 - - - - - - 50-54 413 14,845,515 133 4,360,295 546 19,205,810 55-59 1,626 60,276,743 1,147 42,601,506 2,773 102,878,249 60-64 6,142 209,628,054 3,585 104,264,860 9,727 313,892,914 65-69 6,408 198,367,981 4,071 93,286,372 10,479 291,654,352
70-74 5,483 149,900,017 3,690 68,758,248 9,173 218,658,265 75-79 4,306 96,228,511 3,161 44,156,988 7,467 140,385,498 80-84 3,632 69,725,057 3,086 35,060,713 6,718 104,785,770 85-89 2,395 39,000,089 2,555 24,674,986 4,950 63,675,075
90 & over 1,104 14,481,159 1,722 14,360,070 2,826 28,841,229
Total 31,509 852,453,126$ 23,150 431,524,036$ 54,659 1,283,977,162$
Average Age 72.7Average Annual Annuity $23,491
Male Female Total
Superannuation Annuitants
37SCHEDULE L
(Page 7 of 10)

State Employees' Retirement SystemIII. Age and Benefit Profile of Annuitants and Beneficiaries as of December 31, 2010
Age Number Annual Annuity Number Annual Annuity Number Annual Annuity Under 25 - -$ - -$ - -$
25-29 16 9,164 36 22,045 52 31,209 30-34 155 153,218 191 147,713 346 300,931 35-39 301 531,253 345 492,732 646 1,023,985 40-44 616 2,732,339 562 1,273,242 1,178 4,005,582
45-49 921 12,914,028 827 4,151,624 1,748 17,065,652 50-54 1,514 27,905,433 1,634 13,521,166 3,148 41,426,599 55-59 2,707 50,362,729 3,945 57,427,642 6,652 107,790,371 60-64 5,499 124,803,930 4,612 75,023,082 10,111 199,827,012 65-69 3,913 81,474,983 2,473 34,906,347 6,386 116,381,329
70-74 2,087 31,958,715 1,627 17,335,707 3,714 49,294,422 75-79 1,485 21,742,664 1,272 11,893,850 2,757 33,636,514 80-84 810 11,409,691 800 6,696,875 1,610 18,106,566 85-89 261 3,288,090 410 3,052,151 671 6,340,241
90 & over 75 921,705 147 1,290,382 222 2,212,087
Total 20,360 370,207,942$ 18,881 227,234,557$ 39,241 597,442,499$
Average Age 62.6Average Annual Annuity $15,225
Male Female Total
Early Retirement Annuitants
38SCHEDULE L
(Page 8 of 10)

State Employees' Retirement SystemIII. Age and Benefit Profile of Annuitants and Beneficiaries as of December 31, 2010
Age Number Annual Annuity Number Annual Annuity Number Annual Annuity Under 25 - -$ - -$ - -$
25-29 - - - - - - 30-34 8 80,037 9 94,059 17 174,096 35-39 48 577,455 43 473,170 91 1,050,625 40-44 112 1,683,396 114 1,265,008 226 2,948,404
45-49 302 4,992,079 265 3,523,688 567 8,515,767 50-54 412 7,315,287 527 8,087,685 939 15,402,972 55-59 729 12,720,653 840 13,444,626 1,569 26,165,280 60-64 871 13,624,255 872 12,664,978 1,743 26,289,233 65-69 563 6,731,744 558 6,532,314 1,121 13,264,058
70-74 318 3,172,778 361 3,303,648 679 6,476,426 75-79 191 1,779,615 243 1,973,042 434 3,752,656 80-84 113 1,133,935 141 1,035,621 254 2,169,555 85-89 50 478,057 73 501,750 123 979,807
90 & over 14 106,749 24 158,570 38 265,319
Total 3,731 54,396,041$ 4,070 53,058,158$ 7,801 107,454,199$
Average Age 61.4Average Annual Annuity $13,774
Male Female Total
Disabled Annuitants
39SCHEDULE L
(Page 9 of 10)
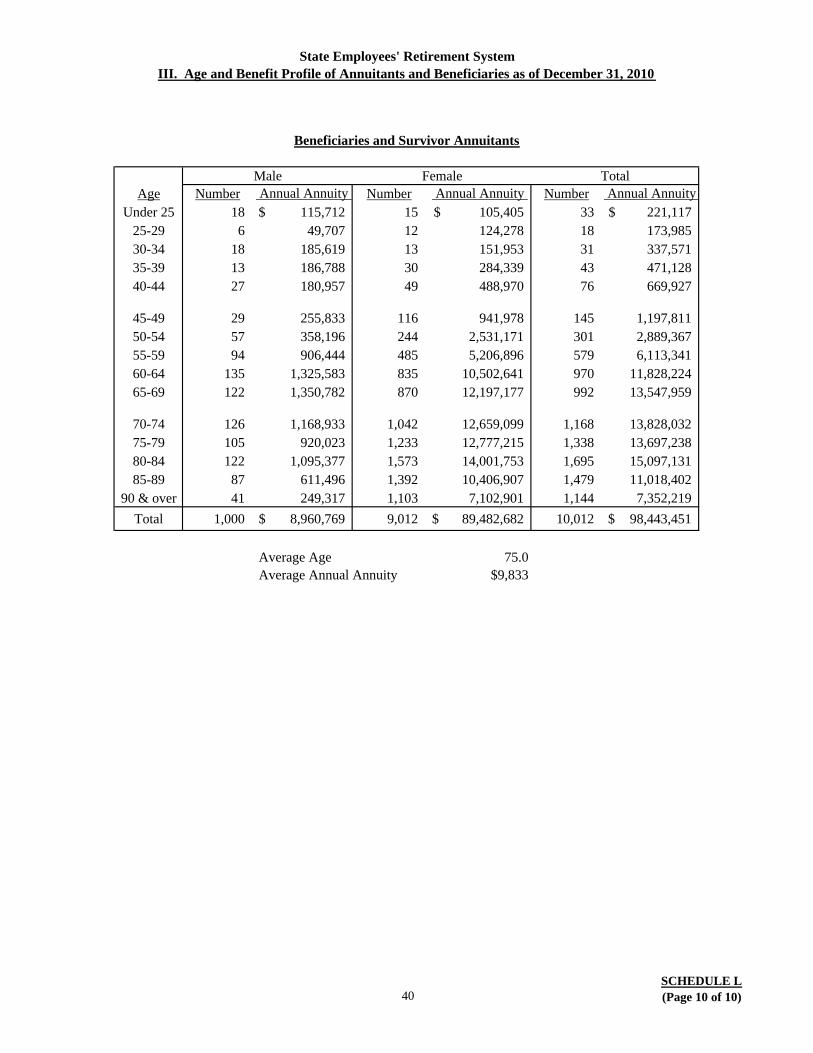
State Employees' Retirement SystemIII. Age and Benefit Profile of Annuitants and Beneficiaries as of December 31, 2010
Age Number Annual Annuity Number Annual Annuity Number Annual Annuity Under 25 18 115,712$ 15 105,405$ 33 221,117$
25-29 6 49,707 12 124,278 18 173,985 30-34 18 185,619 13 151,953 31 337,571 35-39 13 186,788 30 284,339 43 471,128 40-44 27 180,957 49 488,970 76 669,927
45-49 29 255,833 116 941,978 145 1,197,811 50-54 57 358,196 244 2,531,171 301 2,889,367 55-59 94 906,444 485 5,206,896 579 6,113,341 60-64 135 1,325,583 835 10,502,641 970 11,828,224 65-69 122 1,350,782 870 12,197,177 992 13,547,959
70-74 126 1,168,933 1,042 12,659,099 1,168 13,828,032 75-79 105 920,023 1,233 12,777,215 1,338 13,697,238 80-84 122 1,095,377 1,573 14,001,753 1,695 15,097,131 85-89 87 611,496 1,392 10,406,907 1,479 11,018,402
90 & over 41 249,317 1,103 7,102,901 1,144 7,352,219
Total 1,000 8,960,769$ 9,012 89,482,682$ 10,012 98,443,451$
Average Age 75.0Average Annual Annuity $9,833
Male Female Total
Beneficiaries and Survivor Annuitants
40SCHEDULE L(Page 10 of 10)

State Employees' Retirement System
SCHEDULE M (Page 1 of 8)
41
Benefit and Contribution Provisions as of December 31, 2010 (as embodied in Act 31 of 1974, and amended through Act 120 in November 2010)
The State Employees' Retirement System makes provision for retirement, disability, and death benefits for all State employees, except those specifically excluded under Section 5301 of the SERC, and certain other eligible groups. The major provisions are summarized as follows: Eligible Employees Class A-3 - All eligible employees hired after December 31, 2010, except
members of the judiciary. Certain groups have effective dates after December 31, 2010 that are tied to the expiration of collective bargaining agreements. Members of the General Assembly who joined SERS on or after December 1, 2010 are also part of this class.
Class A-4 - Same as Class A-3 except that this class is for members who elect
to pay a higher member contribution amount and receive a higher benefit.
Class AA - All eligible employees hired after June 30, 2001 but prior to
January 1, 2011, except State Police Officers, members of the judiciary and legislators, and employees hired before July 1, 2001, who elected Class AA by December 31, 2001.
Class A - State Police Officers hired on or after March 1, 1974 but prior to
January 1, 2011, members of the judiciary who have not elected Class E-1 or E-2, legislators elected and became members before July 1, 2001, who have not elected Class AA or Class D-4 and Class A employees hired before July 1, 2001, who remained in Class A.
Class D-4 - Legislators coming into service after June 30, 2001 but prior to
December 1, 2010, who elect to be SERS members, and legislators who elected Class D-4 before July 1, 2001.
Class E-1 - Judges who elect Class E-1. Class E-2 - Magisterial District Judges who elect Class E-2.

State Employees' Retirement System
SCHEDULE M (Page 2 of 8)
42
Benefit and Contribution Provisions as of December 31, 2010 (continued) (as embodied in Act 31 of 1974, and amended through Act 120 in November 2010)
Age and Service Requirements for Superannuation (full formula benefits)
Class A-3 & Class A-4 General Conditions Age 65 with three years of credited state service; or a
total attained age and years of credited service of 92 (the “Rule of 92”) with credited service being at least 35 years.
Legislators and certain enforcement officers Age 55 with three years of credited state service.
Park Rangers & Capitol Police Age 55 with 20 years of Park Ranger or Capitol Police credited service. If total credited service is less than 20 years, General Conditions apply.
State Police Age 55. State Police are eligible for special unreduced benefits after 20 years of credited service, regardless of age; however, age 55 remains their superannuation age.
Class AA & Class A General Conditions Age 60 with three years of credited state service; or 35
or more years of credited service, regardless of age.
Legislators and certain enforcement officers Age 50 with three years of credited state service.
Park Rangers & Capitol Police Age 50 with 20 years of Park Ranger or Capitol Police credited service. If total credited service is less than 20 years, General Conditions apply.
State Police Age 50. State Police are eligible for special unreduced benefits after 20 years of credited service, regardless of age; however, age 50 remains their superannuation age.
Class D-4 Age 50 with three years of credited state service.
Class E-1 & Class E-2 Age 60 with three years of credited state service; or 35 or more years of credited service, regardless of age.

State Employees' Retirement System
SCHEDULE M (Page 3 of 8)
43
Benefit and Contribution Provisions as of December 31, 2010 (continued) (as embodied in Act 31 of 1974, and amended through Act 120 in November 2010) Formula for Superannuation Annuity The single life annuity applicable to members of Class AA and Class A-4 is equal to 2.5 percent of the high 3-year final average salary (FAS) of the member multiplied by the years and fractions of credited service. The single life annuity applicable to members of Class A and Class A-3 is equal to 2 percent of the high 3-year final average salary of the member multiplied by the years and fractions of credited service. The single life annuity applicable to Class A State Police is 50 percent of the highest full calendar year of compensation if the member has over 20 but less than 25 years of service. With more than 25 years of service the benefit is 75 percent of the highest annual salary. The benefit accrual rates for other classes of members are as follows: Class Benefit Accrual Rate
D-4 3.0 percent
E-1 4.0 percent for each of the first 10 years of judicial service, dropping to 3.0 percent for each subsequent year of judicial service.
E-2 3.0 percent for each year of judicial service. Members who have 41 or more years of combined Class A-3, A-4, A and AA service are entitled to a supplemental benefit ranging from 2 percent of the applicable single life annuity for members with 41 years of service to 10 percent of the applicable single life annuity for members with 45 or more years of service. The benefit for a member who works past age 70 is at least equal to a benefit that is the actuarial equivalent of the prior year’s benefit. This determination is made each year after age 70. In addition to the above benefits, a member who has elected Social Security Integration Coverage is entitled to a single life annuity of 2 percent of the members’ "Average Non-Covered Salary" for each year of Social Security Integration (SSI) coverage. All Class E members can elect SSI coverage. Other members must have elected SSI coverage before March, 1974. "Average Non-Covered Salary" is the average annual salary received while covered by the Retirement System since January 1, 1956 in excess of the maximum covered wages under Social Security.

State Employees' Retirement System
SCHEDULE M (Page 4 of 8)
44
Benefit and Contribution Provisions as of December 31, 2010 (continued) (as embodied in Act 31 of 1974, and amended through Act 120 in November 2010) Limitations on Annuity In almost all cases, SERS benefits are limited to no more than 100 percent of compensation. An exception to this limit is the actuarial increase portion of the benefit for certain members eligible for actuarial increases due to retirement beyond age 70. For such members, the 100 percent of salary limit only applies to the base benefit. Also, the amount of annual retirement benefit a member may receive shall not exceed the dollar limit specified under Section 415(b) of the Internal Revenue Code. Benefits in excess of the 415(b) limit are paid through the Benefits Completion Plan. Age and Service Requirements for Disability Retirement A member is eligible for disability retirement if the member is unable to perform his or her current job and has at least 5 years of service. An officer of the State Police or enforcement officer does not have a service requirement. Formula for Disability Benefit The disability benefit is equal to the benefit calculated as of normal retirement age, based on years of credited service at disability, if the result is greater than or equal to 33-1/3 percent of FAS at time of disability. If the benefit so calculated is less than 33-1/3 percent of FAS, the disability benefit is equal to the smaller of: (a) the benefit calculated as of normal retirement age based on Service projected to
retirement date, or
(b) 33-1/3 percent of FAS at time of disability. For service connected disabilities, the disability benefit payable will be increased, as needed, so that the sum of the plan benefit and the benefits paid or payable under the Workers’ Compensation Act, The Pennsylvania Occupational Disease Act, and the Social Security Act equals 70 percent of FAS. Eligibility for Vested Benefit All Class A-3 and A-4 members have a vested entitlement to an annuity after 10 years of credited service. All other classes are vested after 5 years of credited service. Vested Benefit The vested benefit is equal to the benefit calculated using years of credited service at the time of leaving the plan. The former member can receive the full benefit beginning at normal retirement age, or an actuarially reduced withdrawal annuity beginning at any date after separation but before retirement.

State Employees' Retirement System
SCHEDULE M (Page 5 of 8)
45
Benefit and Contribution Provisions as of December 31, 2010 (continued) (as embodied in Act 31 of 1974, and amended through Act 120 in November 2010) For those not in Classes A-3 or A-4, the withdrawal annuity is reduced from the earlier of age 60, or the age at which the member would have 35 years of credited service. Benefits for Park Rangers and Capitol Police who have 20 years of credited service are reduced from age 50. Benefits for other members who have an age 50 superannuation age are reduced from age 50 irrespective of the amount of credited service they have. For Classes A-3 and A-4, the withdrawal annuity is reduced from age 65. If prior to age 65 the member has both reached 35 years of credited service and met the conditions of the Rule of 92, then the member is eligible for unreduced benefits. Benefits for Park Rangers and Capitol Police who have 20 years of credited service are reduced from age 55. Benefits for other members who have an age 55 superannuation age are reduced from age 55 irrespective of the amount of credited service they have. Eligibility for Death Benefit Prior to Retirement A member is eligible if the member (1) is under superannuation age with 5 years (or 10 years under Classes A-3 and A-4) of credited service or (2) has attained superannuation age with 3 years of credited state service. Amount of Death Benefit Prior to Retirement An eligible beneficiary receives the full present value of the benefits to which the member would have been entitled had the member retired the day before he or she died, assuming the member had elected Option 1 if no other option had been elected. This death benefit includes the present value associated with benefits, if any, to which the member may not have been entitled because they exceeded the member’s highest consecutive twelve months of salary and are limited by appropriate IRS limitations. Death Benefits After Retirement A member who elects the maximum single life annuity is entitled to a refund of the unpaid balance of the accumulated member contributions and interest at the time of retirement. A member may elect one of several optional reduced pensions in lieu of the maximum single life annuity to provide additional death benefit protection. The optional forms of benefit are actuarially equivalent to the maximum single life benefit using 4.0 percent interest per annum, and the actuarial equivalence factors described below. The beneficiary of a disabled member who did not elect an alternative option receives benefits determined under Option 1. Option 1 provides that the beneficiary will receive a benefit equal to the present value of the maximum single life annuity at retirement reduced by any payments received by the annuitant. The Option 1 benefit is provided to a disabled member without any reduction in the member’s benefit.

State Employees' Retirement System
SCHEDULE M (Page 6 of 8)
46
Benefit and Contribution Provisions as of December 31, 2010 (continued) (as embodied in Act 31 of 1974, and amended through Act 120 in November 2010) A Supplemental Death Benefit is payable to a beneficiary of a member who had a retirement benefit limited by 100 percent of final compensation. The Supplemental Death Benefit is the present value of the excess of the retirement benefit payable to the member before applying the 100 percent of final compensation limit over the 100 percent of final compensation limit, subject to limits imposed by IRC Section 401(a)(9). If the benefit payable to the member is larger than the IRC Section 415(b) limit, the part of the Supplemental Death Benefit in excess of the IRC Section 415(b) limit will be payable from the Benefits Completion Plan. The Supplemental Death Benefit payment is in addition to any death benefit that may be paid as a result of the optional election. The “Extra Piece” The SERC provides for an “extra piece” to be added to the annual benefit if the member’s accumulated deductions exceed one-half of the actuarially equivalent value of the annual benefit. The extra piece is equal to the difference between the total accumulated deductions and one-half of the actuarially equivalent value of the annual benefit. This provision does not apply to Classes A-3 and A-4 Cost-of-Living Allowances (COLAs) Supplemental annuities applying cost-of-living increases to the benefits of annuitants have been instituted from time to time. The last cost-of-living increase was a two-stage increase under Act 2002-38. The first stage was applicable to annuitants who retired on or before July 1, 1990, and it became effective in July of 2002. The second stage provided cost-of-living increases to annuitants who retired after July 1, 1990, but prior to July 2, 2002, and it became effective in July of 2003. Rate of Member Contribution
(i) Regular member contributions, excluding Social Security Integration contributions
Class A-3 - 6.25 percent of total compensation Class A-4 - 9.30 percent Class AA - 6.25 percent Class A - 5.00 percent Class D-4 - 7.50 percent Class E-1 - 10.00 percent during the first 10 years of judicial service
and 7.50 percent thereafter. Class E-2 - 7.50 percent

State Employees' Retirement System
SCHEDULE M (Page 7 of 8)
47
Benefit and Contribution Provisions as of December 31, 2010 (continued) (as embodied in Act 31 of 1974, and amended through Act 120 in November 2010)
(ii) Additional contribution for Social Security Integration Credit Any member who elects the Social Security Integration Credit pays 5.00 percent of
any salary in excess of the amount of salary covered by Social Security during the year for which contributions are being made. A member electing to end additional contributions is ineligible to make future contributions or accrue future benefits.
(iii) Waiver of contributions
Members may elect to waive future contributions on an annual basis if their maximum single life annuity exceeds 110 percent of their highest calendar year compensation. This waiver does not apply to Classes A-3 and A-4.
Interest Credited on Member Contributions A rate of 4 percent, the statutory rate of interest, has been credited on the member contributions since the inception of the system. Refund of Accumulated Member Contributions On the death of a member not qualifying for death benefits, the accumulated member contributions and interest will be paid to the beneficiary. Upon application, a member terminating service when not eligible for another form of benefit is paid a refund of the accumulated contributions and interest. Other terminating members may elect to receive a lump sum payment of a portion of the present value of their benefit, not to exceed their accumulated contributions and interest under Option 4 as part of the members’ option. Their lump sum payment results in a decrease to the annuity benefit otherwise payable. Under Act 120, Classes A-3 and A-4 are not eligible to receive a lump sum and reduced annuity under Option 4. Employer Contributions The employer pays the balance of the cost in excess of the members' contributions with payment schedules determined by law. Act 2010-120 made changes to the SERS funding rules which have significantly affected the required employer contributions. See Section III of Schedule O for the details. Actuarial Equivalence The actuarial table used to determine optional and early retirement benefits for members who entered service after August 1983 is the 1983 Group Annuity Mortality (1983GAM) Unisex table.

State Employees' Retirement System
SCHEDULE M (Page 8 of 8)
48
Benefit and Contribution Provisions as of December 31, 2010 (continued) (as embodied in Act 31 of 1974, and amended through Act 120 in November 2010) Members who entered service before August 1983 receive the better of benefits based on the 1983 GAM table or a variation of the 1971 Group Annuity Mortality (1971GAM) male table. The 1971 GAM table that applies in determining the benefits for members who entered service before August 1983 is:
For service before August, 1983:
Males (members or survivors) – 1971 GAM for males Females (members or survivors) – 1971 GAM for males, set back 6 years
For service after August, 1983:
Members (male or female) – 1971 GAM for males, set back 6 years Survivors (male or female) – 1971 GAM for males

State Employees' Retirement System
SCHEDULE N (Page 1 of 7)
49
Actuarial Assumptions
This schedule shows the actuarial assumptions used for the valuation. These assumptions were based upon a review of experience under SERS from 2006 through 2010. Schedule N contains an extract of the full set of rates used in the valuation. The full set of rates is in the Seventeenth Investigation of Actuarial Experience of the State Employees’ Retirement System of the Commonwealth of Pennsylvania – January 12, 2011, which can be obtained from SERS. The rates are the probabilities that an event will occur in the year after the valuation and are all assumed to occur at the beginning of the year. For example, the male retirement rate of 25.0 percent at age 60 means that 250 of every 1,000 male employees age 60 and who are eligible for full benefits are expected to retire at the date of the valuation. Interest Rate: 8.0 percent compounded annually. The assumed interest rate of 8.0 percent is the investment return less investment and administrative expenses. Mortality After Retirement:
Non-disabled Retirees, Beneficiaries and Survivors: The RP-2000 Healthy Annuitant Mortality Table projected to 2008 and updated to reflect actual SERS experience through 2010. The table includes a margin for future improvement in life expectancy.
Disability Retirees: The RP-2000 Disabled Retiree Mortality Table projected to 2008 and updated to reflect actual SERS experience through 2010. The table includes a margin for future improvement in life expectancy.
Spouse Age Difference: Females are assumed to be 2 years younger than males.

State Employees' Retirement System
50 SCHEDULE N (Page 2 of 7)
Actuarial Assumptions (continued)
Demographic Assumptions for General Employees while Active Members Rates of Separation for Eligibility for Full Unreduced Benefits: (35 years of credited service under age 60; 3 years of credited service over age 60)
Representative Rates of Separation for Eligibility for Full Unreduced Benefits
Age Male Female 53 25.0% 23.0%
54 26.0 23.0
55 27.0 23.0
56 28.0 23.0
57 - 59 30.0 23.0
60 25.0 25.0
61 20.0 20.0
62 25.0 25.0
63 – 64 20.0 20.0
65 25.0 25.0
66 – 79 20.0 20.0
80 100.0 100.0
Rates of Separation for Eligibility for Reduced Benefits (only apply to members not eligible for full unreduced benefits)
Representative Rates of Separation for Eligibility for Reduced Benefits
Age
5 – 14 Years of Credited Service
15 or More Years of Credited Service
Male Female Male Female 25 1.0% 1.0% N/A N/A
30 1.5 1.5 N/A N/A
35 1.5 1.5 1.5% 1.5%
40 1.0 1.0 1.5 1.5
45 1.0 1.0 1.5 1.5
50 1.0 1.0 2.0 2.0
55 1.0 1.0 5.5 5.5

State Employees' Retirement System
51 SCHEDULE N (Page 3 of 7)
Actuarial Assumptions (continued) Rates of Separation Due to Withdrawal It is assumed that the benefit will be reduced from age 58 for general members (to factor 35 years of service before age 60) and from age 50 for members eligible for age 50 retirement.
Representative Rates of Separation Due to Withdrawal
Age
Male Female Years of Credited Service Years of Credited Service 0 5 9 14 0 5 9 14
20 20.7% N/A N/A N/A 22.4% N/A N/A N/A
25 16.2 0.8% 0.8% N/A 20.5 2.7% 1.9% N/A
30 13.9 0.8 0.6 0.6% 17.9 2.4 1.7 1.8%
35 13.6 0.7 0.4 0.4 12.8 1.9 1.2 1.3
40 13.0 0.5 0.4 0.4 10.0 1.9 0.7 0.5
45 12.1 0.5 0.2 0.2 9.8 1.8 0.7 0.5
50 11.3 0.5 0.2 0.2 9.8 1.8 0.4 0.5
55 11.3 0.6 0.6 0.6 9.8 1.5 1.2 1.2
Rates of Separation Due to Death and Disability (Disability rates only apply to members not eligible for full retirement)
Representative Rates of Separation Due to Death and Disability
Age Death Disability
Male Female Male Female 20 0.04% 0.02% N/A N/A
25 0.04 0.02 0.02% 0.04%
30 0.05 0.02 0.07 0.09
35 0.06 0.03 0.12 0.16
40 0.08 0.04 0.19 0.21
45 0.12 0.06 0.33 0.33
50 0.22 0.09 0.46 0.50
55 0.27 0.14 0.60 0.63
60 0.32 0.24 N/A N/A

State Employees' Retirement System
SCHEDULE N (Page 4 of 7)
52
Actuarial Assumptions (continued) For Special Benefit Classes if Different from General Employee Rates:
Rates of Separation Due to Withdrawal Years of Service
State Police/ Hazardous Duty Legislators Judicial Officers
0 15.0% 5.0% 2.0%
1 5.0 5.0 2.0
2 3.0 5.0 1.0
3 2.5 10.0 1.0
4 1.5 5.0 1.0
5 0.9 10.0 0.5
6 0.7 5.0 0.5
7 0.6 5.0 0.4
8 0.4 5.0 0.4
9 0.3 5.0 0.3
10+ 0.2 1.3 0.3
Rates of Separation Due to Early Retirement at Any Age State Police/
Hazardous Duty Legislators Judicial Officers 0.8% 3.0% 0.5%*
* The Judicial Officer rate increase to 1.2% at beginning at age 50.
Representative Rates of Separation Due to Retirement other than
State Police with 19 or More Years of Credited Service
Age State Police/
Hazardous Duty Legislators Judicial Officers 50 7.0% 5.0% N/A
55 7.0 7.5 2.3
60 12.0 12.0 5.0
65 25.0 25.0 10.0
70 25.0 25.0 100.0
75 25.0 25.0 N/A
80 100.0 100.0 N/A

State Employees' Retirement System
SCHEDULE N (Page 5 of 7)
53
Actuarial Assumptions (continued)
Rates of Separation due to Retirement for State Police with 19* or More Years of Credited Service
Years of Service
Rate
Years of Service
Rate
19* – 23 5.0% 31 20.0%
24* 15.0 32 – 34 40.0
25 50.0 35 – 39 50.0
26 – 29 20.0 40+ 100.0
30 30.0
* State Police with 19 and 24 years of service at the beginning of the year are assumed to retire at the point they reach 20 and 25 years respectively during the year and to receive the FOP award. Years of Service Purchased by Eligible Members
Service
Number of Years Purchased
0 0.4
1 0.3
2 0.2
3 0.1
4+ 0.0
It is assumed that the member will elect to pay for the reduction through an actuarial debt and that all purchased service is a 2 percent accrual. Under Act 2010-120, the assumed purchase years have been reduced by 50%. Form of Payment: Members are assumed to elect the maximum benefit 33 percent of the time, some form of joint and survivor annuity 26 percent of the time, and some form of guaranteed present value (including joint and survivor with a guaranteed present value) 41 percent of the time. Also, 85 percent of members are assumed to elect a full Option 4 withdrawal of contributions and interest. Career Salary Increases The career salary scale shown on the following page includes average increases in the employee salary due to promotions and longevity growth. The average career salary growth is 3.15 percent

State Employees' Retirement System
SCHEDULE N (Page 6 of 7)
54
Actuarial Assumptions (continued) per year. In addition, it is assumed that the salary schedules will increase by 3.05 percent a year. The scale on the following page does not include the assumed 3.05 percent general salary increase.
Career Salary Scale for Members Years of Credited Service
Annual Increase
Years of Credited Service
Annual Increase
1 8.00% 16 2.50%
2 6.00 17 2.40
3 4.50 18 2.30
4 4.00 19 2.20
5 3.75 20 2.10
6 3.50 21 2.00
7 3.25 22 1.90
8 3.20 23 1.80
9 3.15 24 1.70
10 3.10 25 1.60
11 3.00 26 1.50
12 2.90 27 1.40
13 2.80 28 1.30
14 2.70 29 1.25
15 2.60 30+ 1.25
The above scale does not apply to members in Classes D and E. It is assumed that only the general salary increase (3.05 percent each year) would apply to members in these classes. New Class A-3 and A-4 Assumptions The following tables are the early and superannuation retirement rates applicable to the new Class A-3 and A-4 members.

State Employees' Retirement System
SCHEDULE N (Page 7 of 7)
55
Actuarial Assumptions (continued)
Early Retirement Rates for Class A-3 and Class A-4 Active Employees with 15 or more Years of Service
Ages Rate
35 1.5%40 1.545 1.550 2.0 55 5.5 60 5.5 61 6.0 62 20.0 63 10.0 64 15.0 65 N/A
Superannuation Retirement Rates for Class A-3 and Class A-4 Employees
Age Rate 55 15.0% 56 16.0 57 17.0 58 18.0 59 19.0 60 20.0 61 20.0 62 25.0 63 20.0 64 20.0 65 25.0
66 to 79 20.0 80 100.0

State Employees' Retirement System
SCHEDULE O (Page 1 of 5)
56
Actuarial Methods I. Asset Valuation The actuarial value of assets is developed by recognizing the difference between the expected actuarial value of assets and the market value of assets over a five-year period. The expected actuarial value is last year's actuarial value brought forward to reflect actual contributions, benefit payments and expenses, and assumed investment income. Each year 20 percent of the difference between this expected value and the market value is recognized in determining the current actuarial value of assets with the remaining 80 percent to be recognized over the next four years. II. Funding Method The State Employees' Retirement System funding policy provides for employer contributions at actuarially determined rates that will amortize liabilities over a ten-year or 30-year period beginning with the July first following the measurement of the liability. See Section III below for details regarding the specific liabilities subject to amortization and the applicable amortization periods. This policy assures that the SERS is appropriately funded and also that the fund will accumulate sufficient assets to pay benefits when they are due. The policy is set by the State Employees' Retirement Board in conformance with specific legal requirements as to the method of funding. A variation of the Entry-Age Actuarial Cost Method is used to determine the liabilities and costs related to all SERS benefits including retirement, withdrawal, death and disability benefits. The sig-nificant difference between the method used for SERS and the typical Entry-Age Actuarial Cost Method is that the normal cost is based on the benefits and contributions for new employees rather than for all current employees from their date of entry. The SERS variation should produce approximately the same results as the typical method over the long run. III. Determination of the Annual Contribution The annual employer contribution is equal to the sum of the following:
(1) The employer share of the normal cost. (2) The fresh start amortization of the December 31, 2009 unfunded liability over a 30-
year period beginning July 1, 2010 and ending on June 30, 2040. (3) The amortization of the change in liability due to Act 2010-120 over a 30-year period
beginning July 1, 2011 and ending on June 30, 2041. (4) The amortization of changes in liability due to actual experience differing from
assumed experience after December 31, 2009 over 30-year periods beginning with the July first following the actuarial valuation determining such changes.

State Employees' Retirement System
SCHEDULE O (Page 2 of 5)
57
Actuarial Methods (continued) The amortization payments are level amounts over the remaining applicable amortization period. The employer cost is determined as a percent of compensation, and the employer contributes that percent of the compensation of all covered members during each fiscal year. The actuarially determined employer cost for fiscal year 2011/2012 is the total of (1) the employer normal cost percent and (2) the net amortization payment for fiscal year 2011/2012 divided by the projected covered compensation for the fiscal year. However, Act 2010-120 established employer contribution collars for the purpose of temporarily limiting the extent of annual increase in the employer contribution rate. To determine the maximum 2011/2012 employer contribution rate under Act 2010-120, we add the fiscal 2011/2012 contribution collar of 3 percent of payroll to the final 2010/2011 employer contribution requirement of 5.00 percent of payroll, to produce a result of 8.00 percent of compensation. Therefore, the 2011/2012 employer contribution rate is limited to 8.00 percent of covered compensation, well below the actuarially determined rate (of 18.93 percent of covered compensation) that would otherwise be required. The other contribution collars established under Act 2010-120 limit the annual increase in the employer contribution rate to:
3.5 percent of covered compensation for fiscal year 2012/2013 and 4.5 percent of covered compensation for each fiscal year thereafter until the collar ceases to
apply, after which the actuarially determined contribution rates apply (subject to a minimum employer contribution rate equal to the employer normal cost percent)
The assumptions used in determining the actuarial cost are stated in Schedule N, and the employer cost, as a percent of covered compensation, is determined in Schedules A and B. The assumptions used for the current valuation were based upon an evaluation of SERS experience from 2006 through 2010. The annual investment return assumption is 8.0 percent. Salary growth is the total of assumed increases in salary rates and career salary growth. It is generally assumed that the total payroll will increase at 3.05 percent a year and that employee career salary growth (promotion and longevity growth) will average an additional 3.15 percent a year. Therefore, the average total salary growth for an individual will generally be 6.20 (3.05 plus 3.15) percent a year. The investment return and the salary rate increase assumptions are based on an assumed underlying inflation of 2.75 percent a year. All costs and liabilities have been determined in conformance with generally accepted actuarial principles and procedures in accordance with the principles of practice prescribed by the Actuarial Standards Board of the American Academy of Actuaries. The calculations were performed on the basis of actuarial assumptions and methods, which are internally consistent, and reasonable (taking into account past experience under SERS and reasonable expectations) and which in combination represent the best estimate of anticipated experience under the plan.
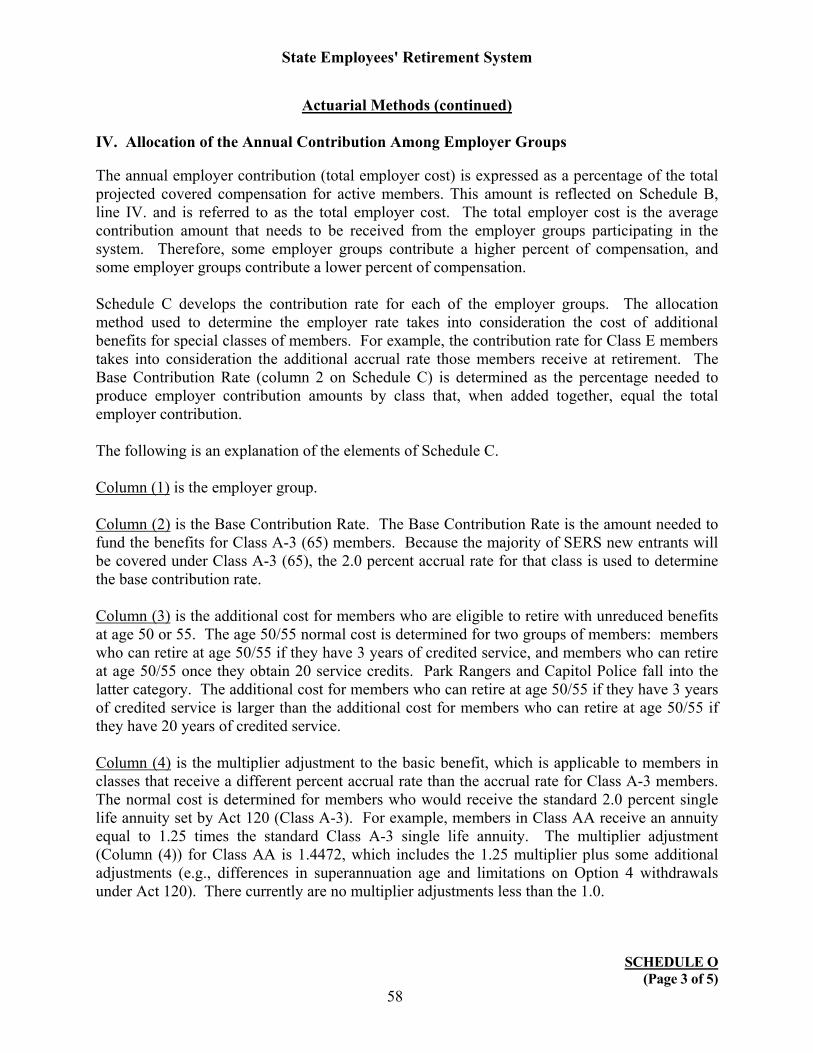
State Employees' Retirement System
SCHEDULE O (Page 3 of 5)
58
Actuarial Methods (continued) IV. Allocation of the Annual Contribution Among Employer Groups The annual employer contribution (total employer cost) is expressed as a percentage of the total projected covered compensation for active members. This amount is reflected on Schedule B, line IV. and is referred to as the total employer cost. The total employer cost is the average contribution amount that needs to be received from the employer groups participating in the system. Therefore, some employer groups contribute a higher percent of compensation, and some employer groups contribute a lower percent of compensation. Schedule C develops the contribution rate for each of the employer groups. The allocation method used to determine the employer rate takes into consideration the cost of additional benefits for special classes of members. For example, the contribution rate for Class E members takes into consideration the additional accrual rate those members receive at retirement. The Base Contribution Rate (column 2 on Schedule C) is determined as the percentage needed to produce employer contribution amounts by class that, when added together, equal the total employer contribution. The following is an explanation of the elements of Schedule C. Column (1) is the employer group. Column (2) is the Base Contribution Rate. The Base Contribution Rate is the amount needed to fund the benefits for Class A-3 (65) members. Because the majority of SERS new entrants will be covered under Class A-3 (65), the 2.0 percent accrual rate for that class is used to determine the base contribution rate. Column (3) is the additional cost for members who are eligible to retire with unreduced benefits at age 50 or 55. The age 50/55 normal cost is determined for two groups of members: members who can retire at age 50/55 if they have 3 years of credited service, and members who can retire at age 50/55 once they obtain 20 service credits. Park Rangers and Capitol Police fall into the latter category. The additional cost for members who can retire at age 50/55 if they have 3 years of credited service is larger than the additional cost for members who can retire at age 50/55 if they have 20 years of credited service. Column (4) is the multiplier adjustment to the basic benefit, which is applicable to members in classes that receive a different percent accrual rate than the accrual rate for Class A-3 members. The normal cost is determined for members who would receive the standard 2.0 percent single life annuity set by Act 120 (Class A-3). For example, members in Class AA receive an annuity equal to 1.25 times the standard Class A-3 single life annuity. The multiplier adjustment (Column (4)) for Class AA is 1.4472, which includes the 1.25 multiplier plus some additional adjustments (e.g., differences in superannuation age and limitations on Option 4 withdrawals under Act 120). There currently are no multiplier adjustments less than the 1.0.

State Employees' Retirement System
SCHEDULE O (Page 4 of 5)
59
Actuarial Methods (continued) Column (5) is the past-service liability component for certain employee groups. These employee groups were granted benefit improvements that were retroactive at the date of passage and, therefore, cover all credited service for the class. Upon establishment of a benefit improvement it was determined that the employers of the individual employee group, not the Commonwealth, would fund the benefit improvement. At implementation of the new benefit provision, a liability is established for the members who are eligible for the new benefit provisions, and a schedule is determined to pay off the increase in liability. For example, Park Rangers and Capitol Police Officers were formerly covered under the age 60 retirement provisions. Effective with the valuation at December 31, 1992, Park Rangers and Capitol Police Officers became eligible to retire at age 50 upon attaining 20 years of service. At that valuation, a liability was established that would fund the increase in benefits. The liability for the increase in benefits for past service is paid off in equal installments by the employers of the member group. Each year, the annual contribution as a percent of payroll is determined as the annual payment divided by the funding payroll for the group. The outstanding balance is carried forward with interest each year. The following table shows the payment schedule for the two groups of employees who have a past service liability.
Amortization Schedule for Past Liabilities
Employer Group Payment Last Payment
(fiscal year beginning) State Police $19,004,493 July 2029 Park Rangers / Capitol Police $93,603 July 2027
Column (6) is the adjusted contribution rate, and is equal to column (2) plus column (3), multiplied by column (4). Column (5) is added. Column (7) is the projected compensation for the class of employees. The projected compensation is for the fiscal year to which the contribution rate is applicable. Column (8) is the dollar amount of the employer group contribution. Except when the base employer contribution rate is zero, the sum of the dollar amounts for each group is (approximately) equal to the total employer contribution (as a percent of covered compensation) multiplied by the total projected covered compensation for the active members.

State Employees' Retirement System
SCHEDULE O (Page 5 of 5)
60
Actuarial Methods (continued) V. Plan Provisions Not Valued The cost effect of two plan provisions was not included in this valuation because the effect of the provisions is minimal. These are the limit on the amount of retirement benefit imposed by Section 5702(c) (100 percent limit) and the supplemental death benefit payable when the retirement benefit is limited by Section 5702(c). These two provisions are not valued because they only apply to very few SERS members. Since by definition the liability for the supplemental death benefit is lower than the reduction in liability for the 100 percent limit, the net effect of not including these provisions in the actuarial valuation is a minimal overstatement in the total employer cost. VI. Determination of Present Value of Benefits for Inactive and Vested Members The present value of benefits for inactive members not currently receiving benefits is determined using the same methods and procedures as for active members. They are valued using the final average compensation and service as of separation and are assumed to begin receiving benefits in accordance with the active employee assumptions.

State Employees' Retirement System
SCHEDULE P (Page 1 of 2)
61
Glossary Accrued Service. Service credited under the system, which was rendered before the date of the actuarial valuation. Active Participants. Active members who are in a position covered by SERS and on payroll, on leave with pay, or on certain unpaid leave (e.g., military leave). Inactive members on leave without pay are also included as active participants if there is an expectation they will return to paid service. Actuarial Accrued Liability. The portion of the actuarial present value of benefits not provided for by the actuarial present value of future normal costs. Also referred to as Past Service Liability. Actuarial Assumptions. Estimates of future experience with respect to rates of mortality, disability, turnover, retirement, investment income and salary growth. Decrement assumptions (rates of mortality, disability, turnover and retirement) are generally based on past experience, often modified for projected changes in conditions. Economic assumptions (salary increases and investment income) consist of an underlying rate in an inflation-free environment plus a provision for a long-term average rate of inflation. Actuarial Cost Method. A mathematical budgeting procedure for allocating the actuarial present value of future benefits between future normal costs and the actuarial accrued liability. Actuarial Present Value. The amount of funds currently required to provide a payment or series of payments in the future. It is determined by discounting projected future payments at assumed rates of interest and probabilities of payment. Amortization. Paying off an amount with periodic payments of interest and principal -- as opposed to paying off with a lump sum payment. Annuitants. Participants of SERS who are currently receiving benefits for reason of superannuation retirement, early retirement, deferred retirement, or disability retirement. Beneficiaries and other payment recipients. Beneficiaries, survivors or alternate payees who are receiving benefits as a result of the death of an active member or annuitant or due to a divorce (based upon a domestic relations order). Funding Payroll. The contribution determinations for the funding of SERS are based on a fiscal year running from July 1 to June 30. The Total Annualized Compensation is adjusted to an appropriate fiscal year Funding Payroll using the salary scale assumption and expected turnover and replacement estimates. Inactive and Vested Participants. In general, inactive and vested participants are former active members who are not expected to return to paid service in a position covered by SERS. Inactive and vested participants include employees on furlough as well as employees with prior SERS service currently participating in the Pennsylvania Public School Employees’ Retirement System
State Employees' Retirement System
SCHEDULE P (Page 2 of 2)
62
Glossary (continued)
(PSERS). All inactive and vested participants are entitled to either a refund of accumulated deductions from SERS or a monthly benefit. Inactive and vested participants will eventually change statuses; for example, they may terminate non-vested and receive a refund of their accumulated deductions, they may retire and commence annuity payments, they may return to active membership, etc. Total Annualized Compensation. The Total Annualized Compensation is a snapshot of compensation on December 31. For full-time employees, it is equal to the compensation during the calendar year ending December 31. For part-time employees, compensation is annualized using the current rate of compensation times the appropriate number of pay periods. Total Normal Cost. The portion of the actuarial present value of future benefits that is allocated to the current year by the actuarial cost method. Unfunded Actuarial Accrued Liability. The difference between actuarial accrued liability and the actuarial value of assets.