common pool resource management
TRANSCRIPT

6/4/2013
1
Jane Brock, MD, MSPH
CFMC
Wichita, Ks
June 6, 2013
Common‐Pool Resource Management
This material was prepared by CFMC (PM‐4010‐163 CO 2013), the Medicare Quality Improvement Organization for Colorado under contract with the Centers for Medicare & Medicaid Services (CMS), an agency of the U.S. Department of Health and Human Services. The contents presented do not necessarily reflect CMS policy.
6/4/2013
2
The Tragedy of the Commons
“The… problem has no technical solution; it requires a fundamental extension of morality.” Garret Hardin
Science, New Series, Vol. 162 (3859): 1243‐8, 1968.
6/4/2013
3
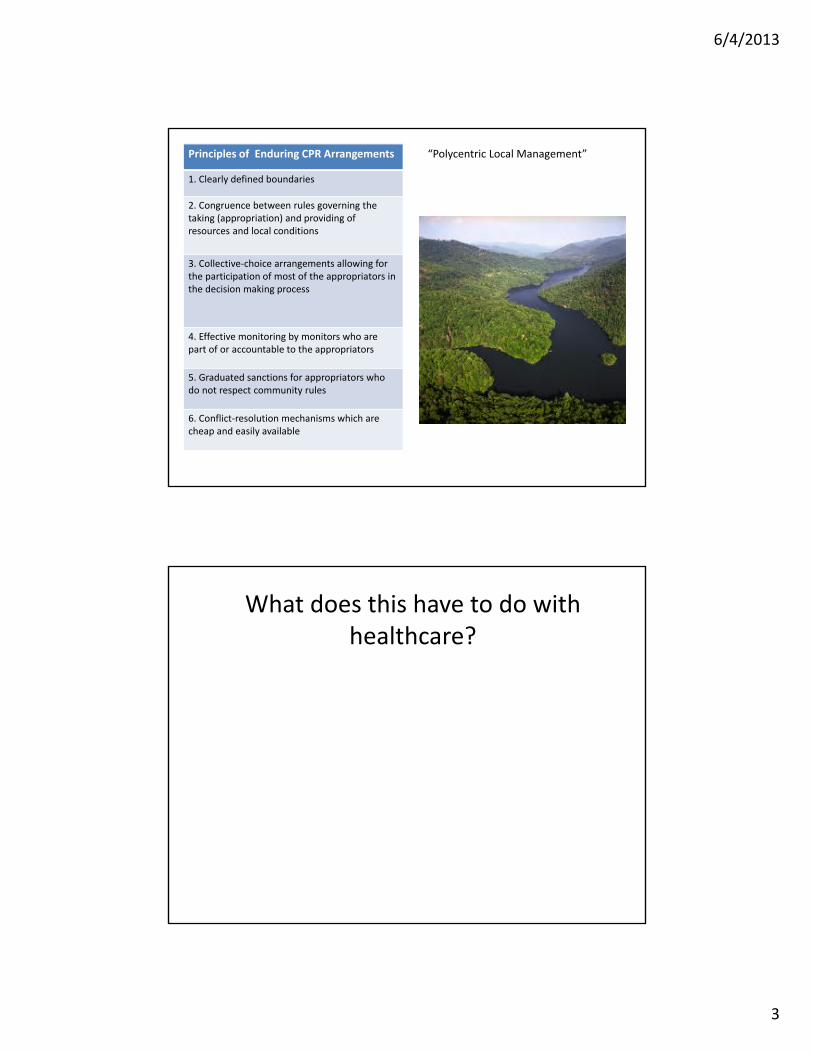
Principles of Enduring CPR Arrangements
1. Clearly defined boundaries
2. Congruence between rules governing the taking (appropriation) and providing of resources and local conditions
3. Collective‐choice arrangements allowing for the participation of most of the appropriators in the decision making process
4. Effective monitoring by monitors who are part of or accountable to the appropriators
5. Graduated sanctions for appropriators who do not respect community rules
6. Conflict‐resolution mechanisms which are cheap and easily available
“Polycentric Local Management”
What does this have to do with healthcare?

6/4/2013
4
Medicare spending
7
Bundled services/payments
Who lives here and what do they need?
6/4/2013
5
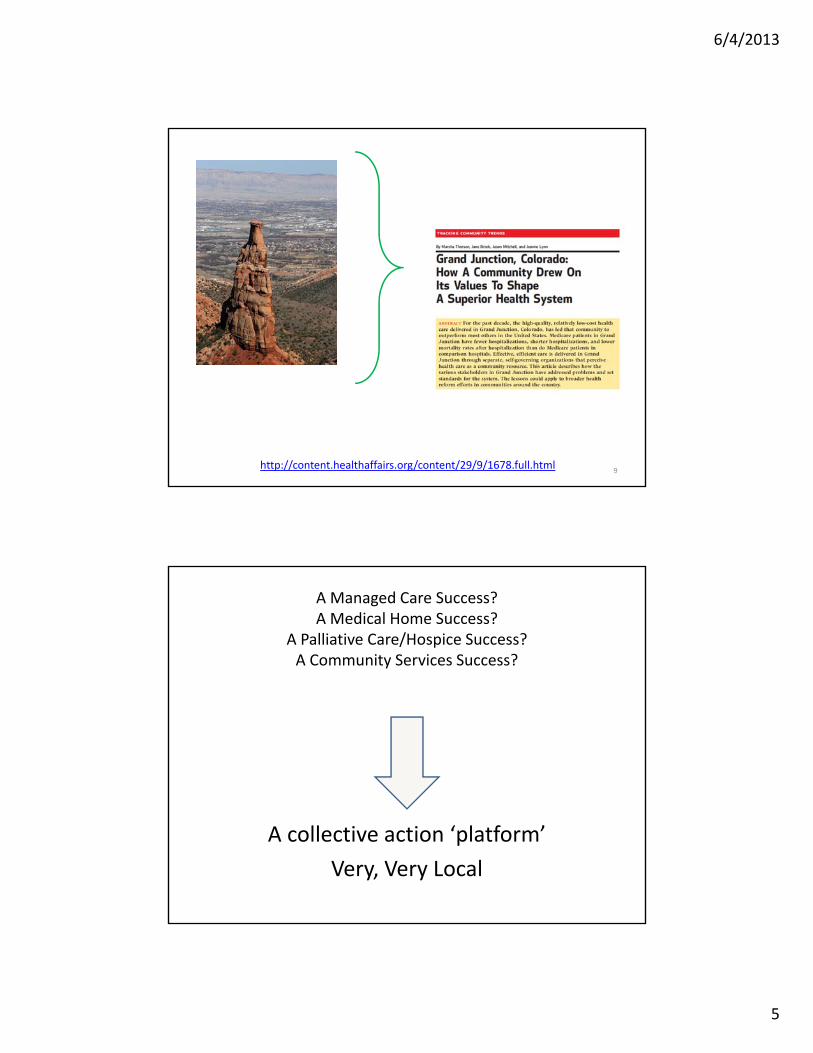
9http://content.healthaffairs.org/content/29/9/1678.full.html
A collective action ‘platform’
Very, Very Local
A Managed Care Success?A Medical Home Success?
A Palliative Care/Hospice Success?A Community Services Success?

6/4/2013
6
Common‐Pool Resource Management
CPR Management
Clearly defined borders Geographic isolation
Local adaptation of access ‘rules’ Local payer serving community needs
Participation of ‘appropriators’ in decision‐making process
Longstanding culture of collective action
Effective monitoring by appropriators Physician utilization comparison ranking
Graduated sanctions for those not respecting community rules
Payment incentives, pride in ranking
Conflict resolution mechanisms that are cheap and accessible
IPA culture, payment incentives, social networks – ‘the grocery store factor’
http://en.wikipedia.org/wiki/Common‐pool_resource
What we’ve learned through studying readmissions
12

6/4/2013
7
The Care Transitions Theme, 2008
13
FFS Medicare beneficiaries living in zip codes of interest
Target Population
FFS beneficiaries discharged from hospitals of interest
2% absolute reduction in readmissions
795,157
We started with hospitals..

6/4/2013
8
Why are people readmitted?
No Community infrastructure for achieving common goals
Unreliable system supportLack of standard and known processesUnreliable information transferUnsupported patient activation during transfers
Provider‐Patient interfaceUnmanaged condition worseningUse of suboptimal medication regimensReturn to an emergency department
I think it’s an elephant!
What did the QIOs actually DO?Building a Community Initiative
The Role of community‐based non‐medical support increasingly apparent
6/4/2013
9
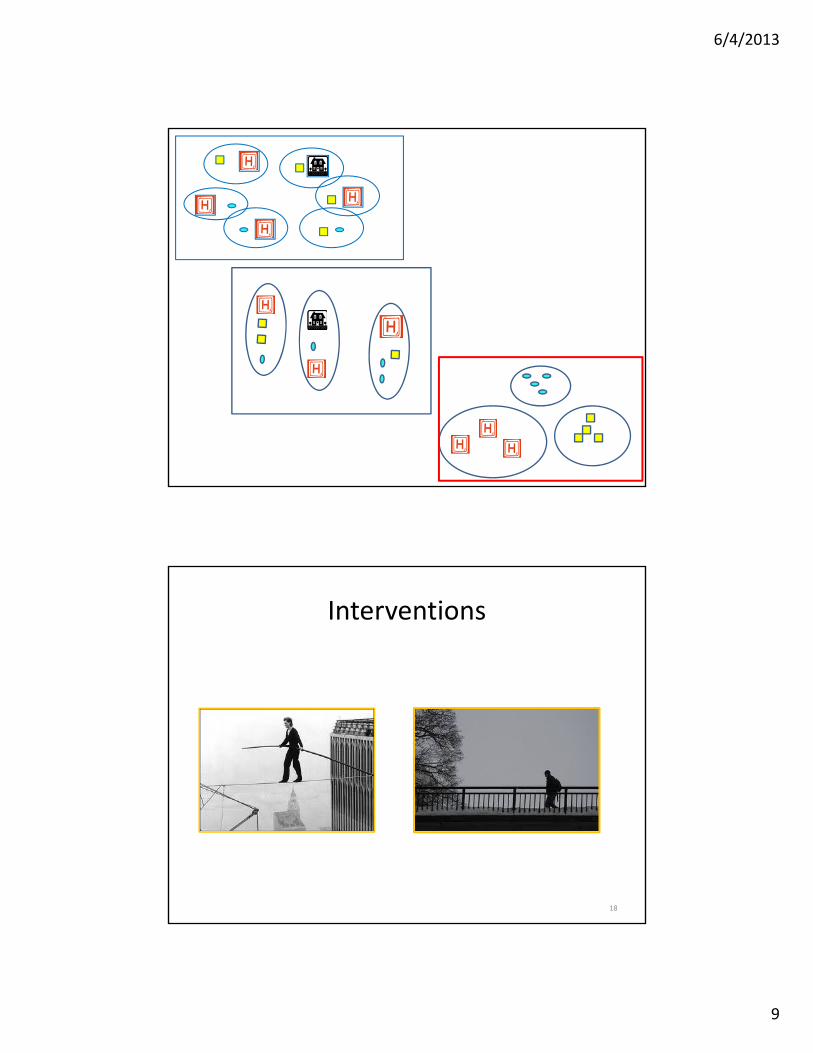
Interventions
18
6/4/2013
10
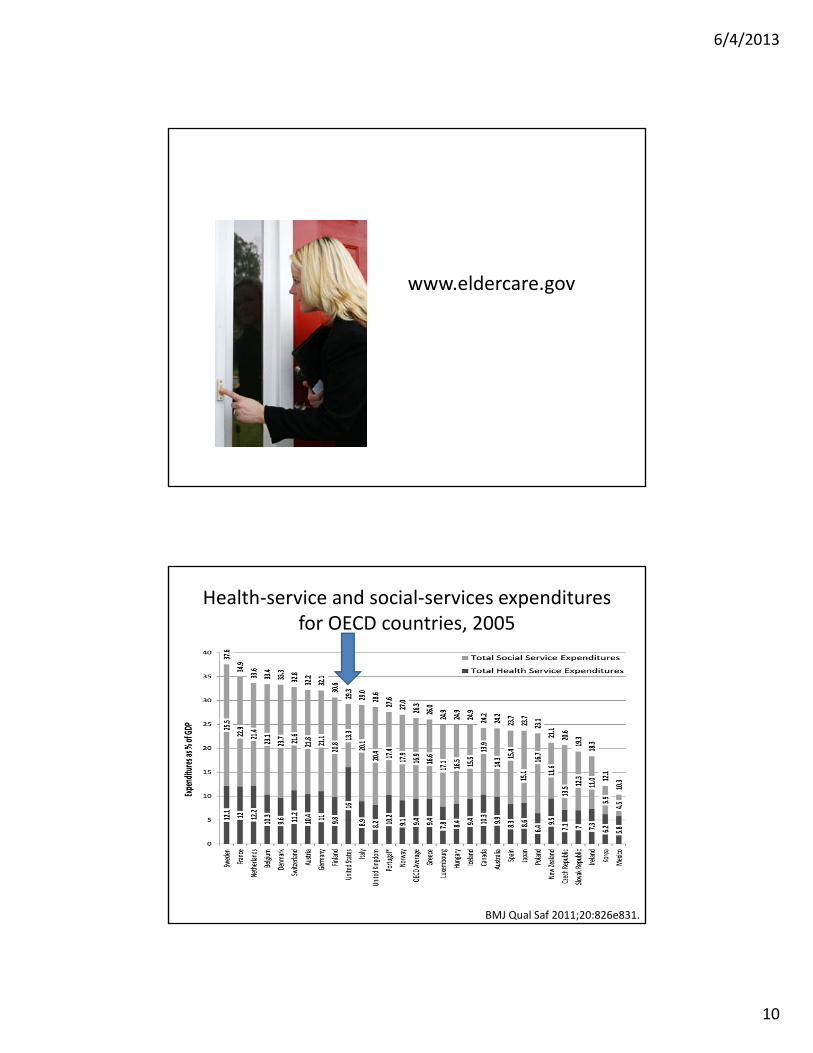
www.eldercare.gov
Health‐service and social‐services expenditures for OECD countries, 2005
BMJ Qual Saf 2011;20:826e831.
6/4/2013
11
19.68%
19.48%
p=0.0024
18.80%
19.00%
19.20%
19.40%
19.60%
19.80%
20.00%
Jan07‐Mar07
N = 66590
Apr07‐Jun07
N = 64621
Jul07‐Sep07N = 62060
Oct07‐Dec07
N = 62822
Jan08‐Mar08
N = 65689A
Apr08‐Jun08
N = 61781
Jul08‐Sep08N = 59098
B
Oct08‐Dec08
N = 59962
Jan09‐Mar09
N = 61517C
Apr09‐Jun09
N = 58825
Jul09‐Sep09N = 56395
Oct09‐Dec09
N = 57766
Jan10‐Mar10
N = 60616D
Apr10‐Jun10
N = 59422
Jul10‐Sep10N = 57984
Oct10‐Dec10
N = 59630
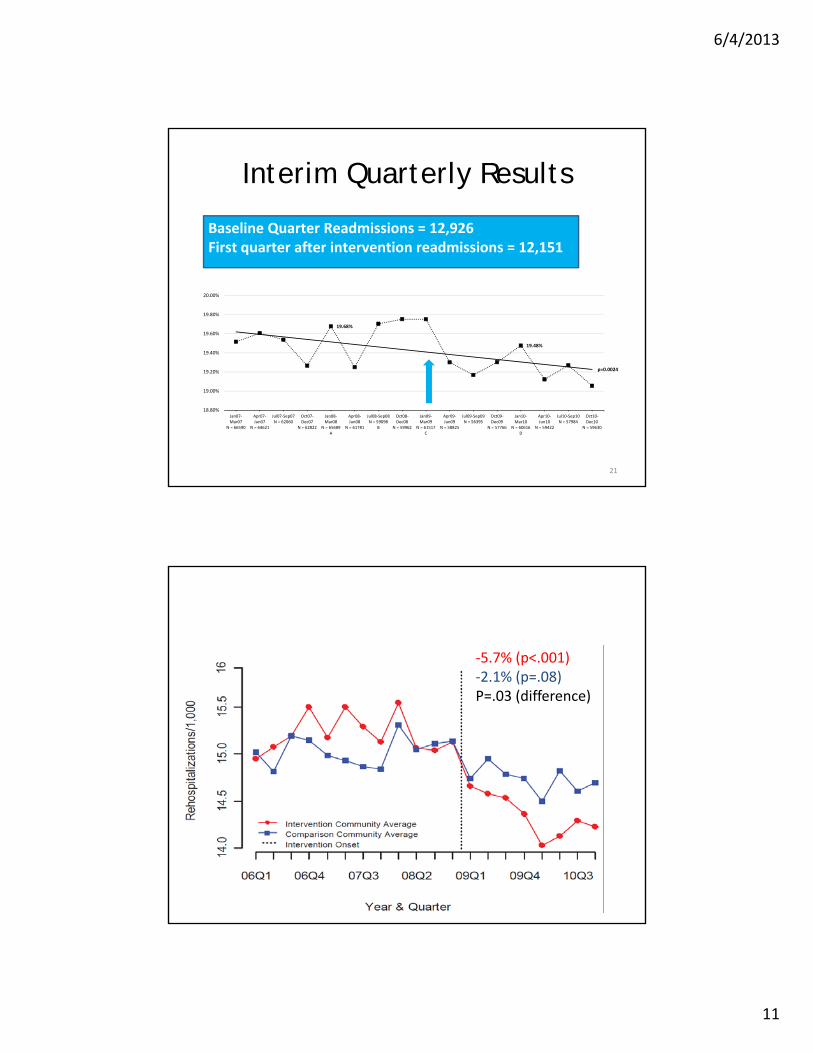
Baseline Quarter Readmissions = 12,926First quarter after intervention readmissions = 12,151
Interim Quarterly Results
21
‐5.7% (p<.001)‐2.1% (p=.08)P=.03 (difference)
Rehospitalization , Intervention vs Comparison

6/4/2013
12
‐5.7% (p<.001)‐3.1% (p<.001)P=.01 (difference)
Hospitalization, Intervention vs Comparison
Summary of results
5.7% ↓(1 hospitalization for every 1000 Medicare beneficiaries)
2.7x that experienced by comparison communities
Rehospitalizations
Hospitalizations
5.74% ↓(5 hospitalization for every 1000 beneficiaries)
1.8x that experienced by comparison communities
$4,000,000 $1,000,000vs.
6/4/2013
13
Where we are now
• Many CMS initiatives to reduce readmissions
– CCTP, HENs, penalties
• QIOs
– 222 formally recruited communities (7 Million)
– Work based on Collective Impact
• Population readmission rates
• Coordinating role
– Using community organizing techniques
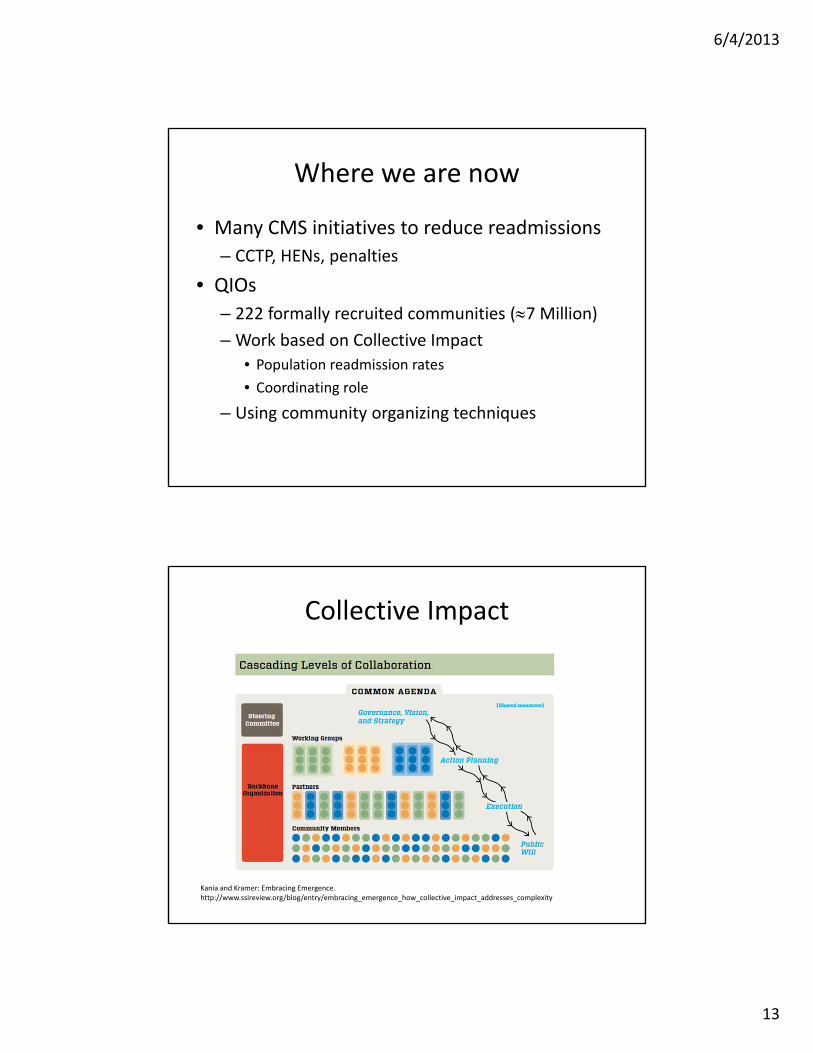
Kania and Kramer: Embracing Emergence. http://www.ssireview.org/blog/entry/embracing_emergence_how_collective_impact_addresses_complexity
Collective Impact

6/4/2013
14
ZIP Code Level Readmissions per 1000 Beneficiaries (January 1, 2010 – December 31, 2010)
27

6/4/2013
15
National Coalition of QIO‐recruited Communities Early Progress
9.1%
National Coalition of QIO‐recruited Communities Early Progress
6.8%

6/4/2013
16
Kansas Quarterly Readmission Rates per 1,000 Medicare FFS Beneficiaries
9.0
10.0
11.0
12.0
13.0
14.0
15.0
Q12009
Q2 Q3 Q4 Q12010
Q2 Q3 Q4 Q12011
Q2 Q3 Q4 Q12012
Q2 Q3
Observed Seasonally Adjusted
Start of 10th SOW
Data: 30-day, all cause readmission rates; 1/1/2009 – 9/30/2012.Seasonally Adjusted: Calculations done by the National Coordinating Center to adjust for variety of issues including more hospitalizations in winter months, number of days in the quarter, and major holidays in the quarter.
Kansas Quarterly Admission Rates per 1,000 Medicare FFS Beneficiaries
65.0
70.0
75.0
80.0
85.0
90.0
Q12009
Q2 Q3 Q4 Q12010
Q2 Q3 Q4 Q12011
Q2 Q3 Q4 Q12012
Q2 Q3
Observed Seasonally Adjusted
Start of 10th
Seasonally Adjusted: Calculations done by the National Coordinating Center to adjust for variety of issues including more hospitalizations in winter months, number of days in the quarter, and major holidays in the quarter.

6/4/2013
17
33
“Somebody has to do something, and it's just incredibly pathetic that it has to be us.”
• Jerry Garcia