common core state standards math – standards of ... must understand the relationship between two...
TRANSCRIPT
© 2012 Noyce Foundation
Performance Assessment Task House Prices
Grade 9 task aligns in part to CCSSM grade 8 The task challenges a student to demonstrate understanding of the concept of scatter plots. A student must understand the relationship between two sets of data, be able to display such data in a scatter plot, and describe trends and shape of the plot including correlations (positive, negative, and no) and lines of best fit. A student must make sense of scatter plots in order to make inferences on the data and evaluate the validity of the conclusions they draw. A student must approximate and interpret rates of change from graphic and numeric data to determine a rule or formula.
Common Core State Standards Math - Content Standards Statistics and Probability Investigate patterns of association in bivariate data. 8.SP.1 Construct and interpret scatter plots for bivariate measurement data to investigate patterns of association between two quantities. Describe patterns such as clustering, outliers, positive or negative association, linear association, and nonlinear association. Functions Define, evaluate, and compare functions. 8.F.1 Understand that a function is a rule that assigns to each input exactly one output. The graph of a function is the set of ordered pairs consisting of an input and the corresponding output. Use functions to model relationships between quantities. 8.F.4 Construct a function to model a linear relationship between two quantities. Determine the rate of change and initial value of the function from a description of a relationship or from two (x, y) values, including reading these from a table or from a graph. Interpret the rate of change and initial value of a linear function in terms of the situation it models, and in terms of its graph or a table of values.
Common Core State Standards Math – Standards of Mathematical Practice MP.1 Make sense of problems and persevere in solving them. Mathematically proficient students start by explaining to themselves the meaning of a problem and looking for entry points to its solution. They analyze givens, constraints, relationships, and goals. They make conjectures about the form and meaning of the solution and plan a solution pathway rather than simply jumping into a solution attempt. They consider analogous problems, and try special cases and simpler forms of the original problem in order to gain insight into its solution. They monitor and evaluate their progress and change course if necessary. Older students might, depending on the context of the problem, transform algebraic expressions or change the viewing window on their graphing calculator to get the information they need. Mathematically proficient students can explain correspondences between equations, verbal descriptions, tables, and graphs or draw diagrams of important features and relationships, graph data, and search for regularity or trends. Younger students might rely on using concrete objects or pictures to help conceptualize and solve a problem. Mathematically proficient students check their answers to problems using a different method, and they continually ask themselves, “Does this make sense?” They can understand the approaches of others to solving complex problems and identify correspondences between different approaches. MP. 2 Reason abstractly and quantitatively. Mathematically proficient students make sense of quantities and their relationships in problem situations. They bring two complementary abilities to bear on problems involving quantitative relationships: the ability to decontextualize—to abstract a given situation and represent it symbolically and manipulate the representing symbols as if they have a life of their own, without necessarily attending to their referents—and the ability to contextualize, to pause as needed during the manipulation process in order to probe into the referents for the symbols involved. Quantitative

© 2012 Noyce Foundation
reasoning entails habits of creating a coherent representation of the problem at hand; considering the units involved; attending to the meaning of quantities, not just how to compute them; and knowing and flexibly using different properties of operations and objects.
Assessment Results This task was developed by the Mathematics Assessment Resource Service and administered as part of a national, normed math assessment. For comparison purposes, teachers may be interested in the results of the national assessment, including the total points possible for the task, the number of core points, and the percent of students that scored at standard on the task. Related materials, including the scoring rubric, student work, and discussions of student understandings and misconceptions on the task, are included in the task packet.
Grade Level Year Total Points Core Points % At Standard 9 2007 9 4 55%
Copyright © 2007 by Mathematics Assessment Page 31 House Prices Test 9 Resource Service. All rights reserved.
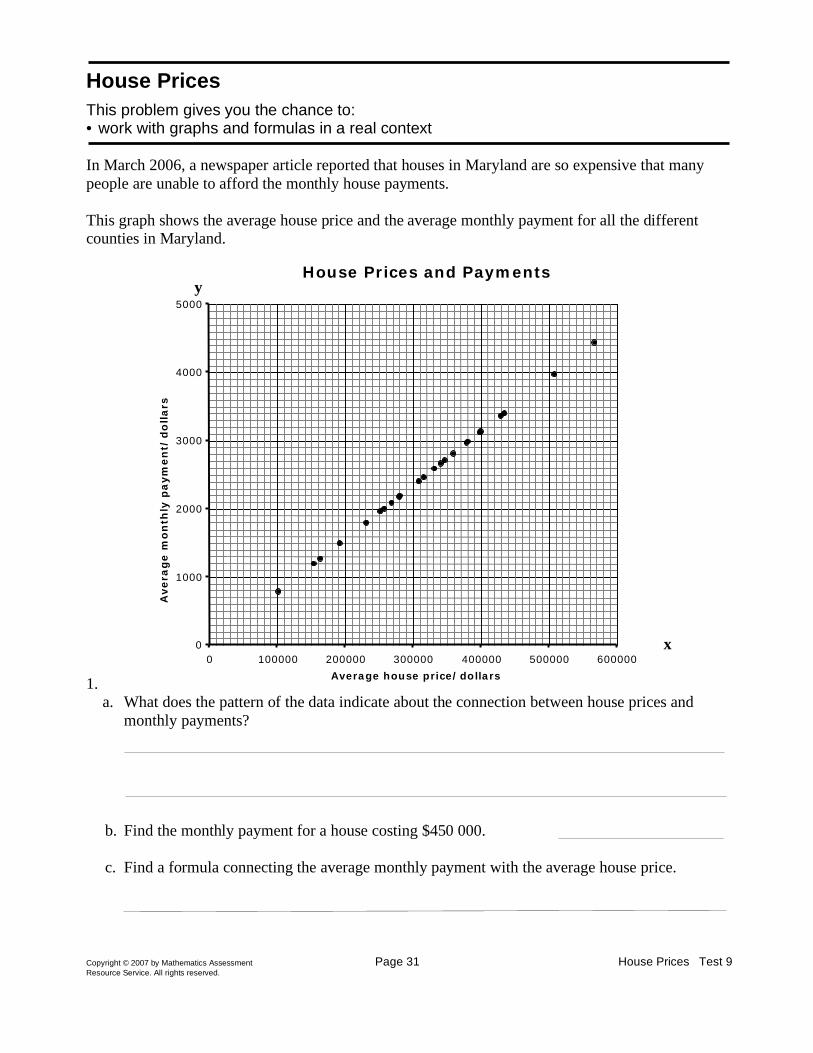
House Prices This problem gives you the chance to: • work with graphs and formulas in a real context In March 2006, a newspaper article reported that houses in Maryland are so expensive that many people are unable to afford the monthly house payments. This graph shows the average house price and the average monthly payment for all the different counties in Maryland. 1.
a. What does the pattern of the data indicate about the connection between house prices and monthly payments?
b. Find the monthly payment for a house costing $450 000. c. Find a formula connecting the average monthly payment with the average house price.
x
y House Prices and Payments
0
1000
2000
3000
4000
5000
0 100000 200000 300000 400000 500000 600000 Average house price/dollars
Avera
ge m
on
thly
pa
ym
en
t/d
olla
rs
y
Copyright © 2007 by Mathematics Assessment Page 32 House Prices Test 9 Resource Service. All rights reserved.
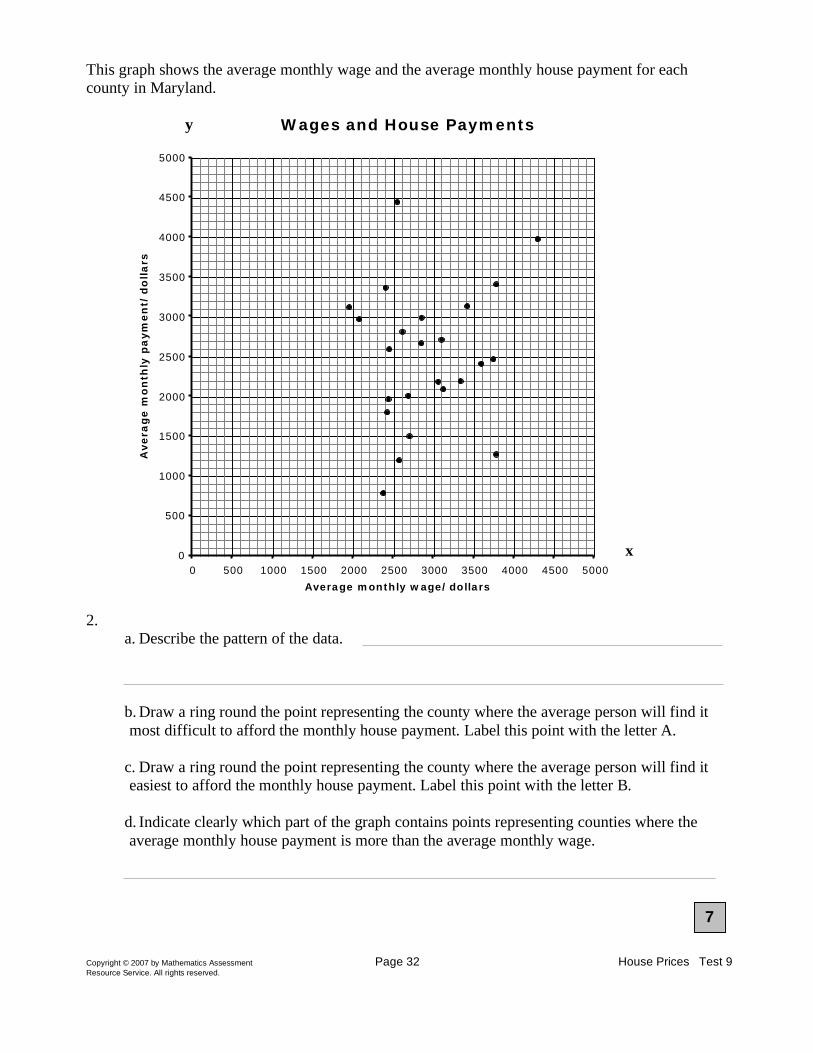
This graph shows the average monthly wage and the average monthly house payment for each county in Maryland. 2.
a. Describe the pattern of the data.
b. Draw a ring round the point representing the county where the average person will find it most difficult to afford the monthly house payment. Label this point with the letter A.
c. Draw a ring round the point representing the county where the average person will find it easiest to afford the monthly house payment. Label this point with the letter B.
d. Indicate clearly which part of the graph contains points representing counties where the average monthly house payment is more than the average monthly wage.
7
Wages and House Payments
0
500
1000
1500
2000
2500
3000
3500
4000
4500
5000
0 500 1000 1500 2000 2500 3000 3500 4000 4500 5000 Average monthly wage/dollars
Avera
ge m
on
thly
pa
ym
en
t/d
olla
rs
y
x
Copyright © 2007 by Mathematics Assessment Page 33 House Prices Test 9 Resource Service. All rights reserved.
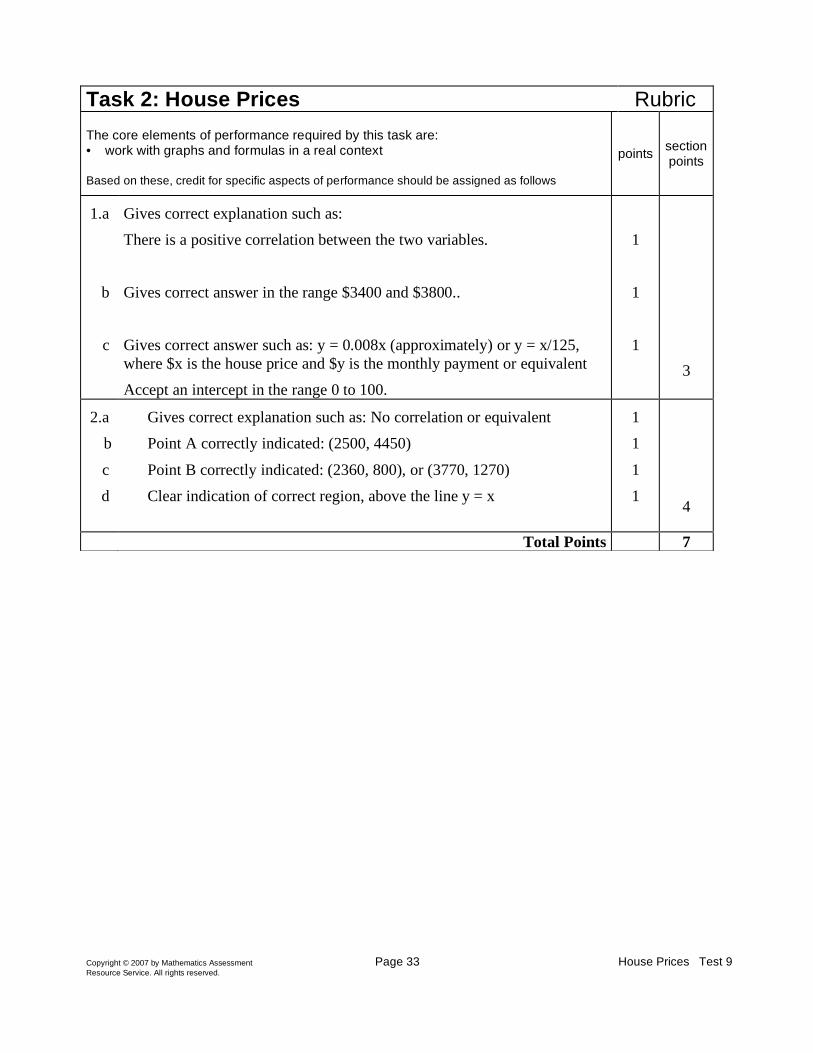
Task 2: House Prices Rubric The core elements of performance required by this task are: • work with graphs and formulas in a real context Based on these, credit for specific aspects of performance should be assigned as follows
points section points
1.a
b
c
Gives correct explanation such as: There is a positive correlation between the two variables.
Gives correct answer in the range $3400 and $3800..
Gives correct answer such as: y = 0.008x (approximately) or y = x/125, where $x is the house price and $y is the monthly payment or equivalent Accept an intercept in the range 0 to 100.
1
1
1
3
2.a b
c d
Gives correct explanation such as: No correlation or equivalent Point A correctly indicated: (2500, 4450)
Point B correctly indicated: (2360, 800), or (3770, 1270) Clear indication of correct region, above the line y = x
1 1
1 1
4
Total Points 7
Algebra - 2007 34Copyright © 2007 by Noyce Foundation
House Pr icesWork the task. L ook at the rubric. What did you have to know mathematically to find the formulafor connecting house prices and payments? To identify the area where themonthly payment is morethan monthly income, what did you think about? What mathematics did you use?
L ook at student responses for describing the graphs in 1a and 2a. Did your students have themathematical vocabulary for discussing correlation and no correlation? What other types ofdescriptors did they use?
Did they talk aboutthe scale?Describea pattern of going up?Did they try to give a numerical answer?Did they read information into the data, e.g. “the higher the wage thehigher the payment”?
What types of experiences would help students to develop the language of reading and interpretingdata and scatterplots? How could their descriptions be improved?
While the main purpose of the task is to look at data and work with formulas, the task also showssome problems students have with making sense of decimal and decimal place value. L ook atstudent work for 1b. How many of your students:
$3500 $4500 $3040 or$3050
$35,000 or$45,000
$350,000 Other
What are the implications for instruction?
Now look at student equations for 1c. Use my categories or make categories of your own. Howmany of your students:
Could give the correct equation?Did notattempt this part of the task? Why doyou think so many students were unwilling toattempt this part of the task?Gave a ratio instead of using algebraic notation, e.g.
o $100,000 house price equals $800 in house payments oro for every $100000 divideby $100
Used a third variable: x=y/sy, x/y times x = payment, ym=xUsed the formula for a line, y=mx+bMadea decimal error: e.g. x=4/5y or y=.8xT ried to finda set difference: 100,000 – 10,000, 100,000 – 1000, p = h - 100,000,p = h - 10,000
What other types of errors did you see?

Algebra - 2007 35Copyright © 2007 by Noyce Foundation
L ook at student work for identifying the points onthe graph. Students made the most errors whenfinding the point where it will bemost difficult to make the payment. How many of your studentsput:(2500,4500) (1900,3100) (4300,4000) Circled a
regionMarked
points withno labels
Didn’tattempt
What opportunities do students have to make sense of themeaning of points ona graph, i.e. findapoint based on context andmeaning rather than from a numerical reference? What are some of thetasks you could use with students to help promote this type of thinking?The most difficult part of the task for students was 2d, indicate thepart of thegraphwhere theaverage monthly house payment is more than the average monthly wage. Have your studentsworked with graphing inequalities?How many of your students:
o Drew a line to show where average wage equals monthly payment?o Circled a few correct points, butnotall?o Gave a description that only fit pointA?o Said the area in the middle? At the top? At the left? At the
right?o Gave a rangewithoutmentioning axes or labels: e.g. between 2000 and3000 or over 2500?o Did notattempt this part of the task?
What do you want students to understand aboutinequalities? When working with inequalities arethe problems presented in a context? Do you have any favorite tasks to help students make sense ofinequalities? What further experiences do students need?

Algebra - 2007 36Copyright © 2007 by Noyce Foundation
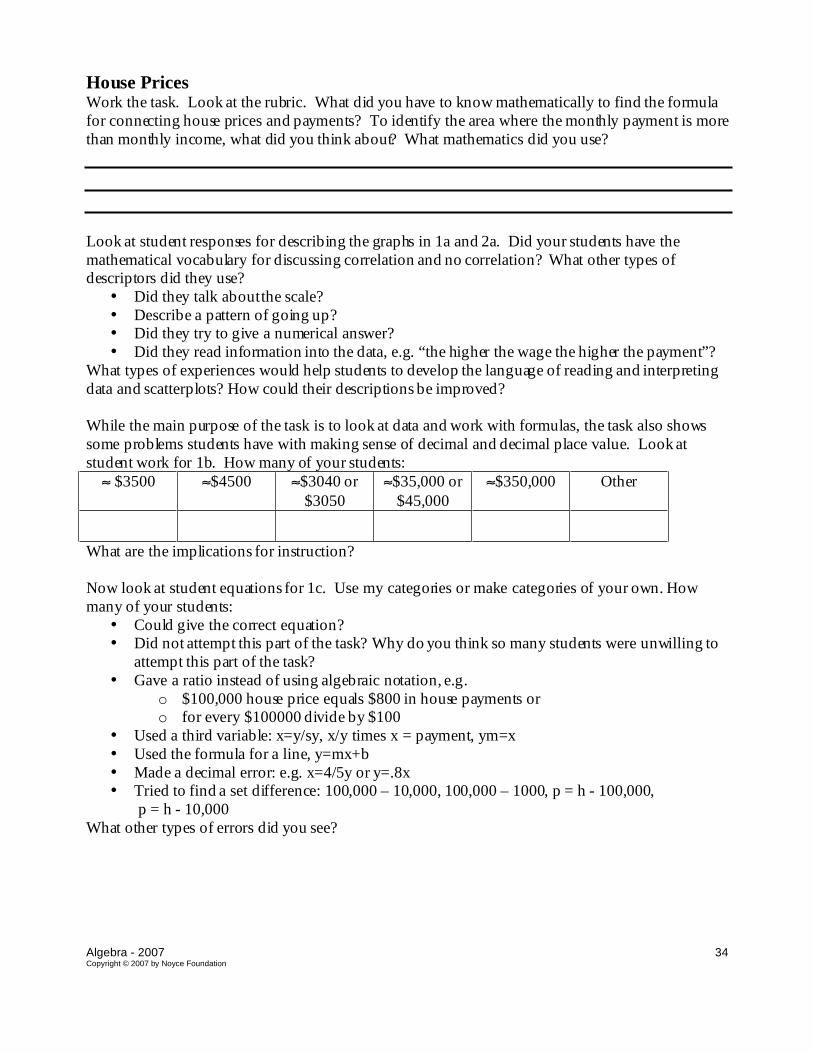
L ooking at Student Wor k on House Pr icesStudent A is comfortable using the graphas a tool and draws lines on both graphs to help makesense of the situation. While thestudent has oneof the topscores on this task, the student does nothave the formal vocabulary for talking aboutdata, such as correlation or no correlation. The studentdrew in the line for wage equalingpayment, butdid notclarify which part of thegraphrepresentsthe inequality payment greater than wage.Student A
Algebra - 2007 37Copyright © 2007 by Noyce Foundation
Student A, par t 2

Algebra - 2007 38Copyright © 2007 by Noyce Foundation
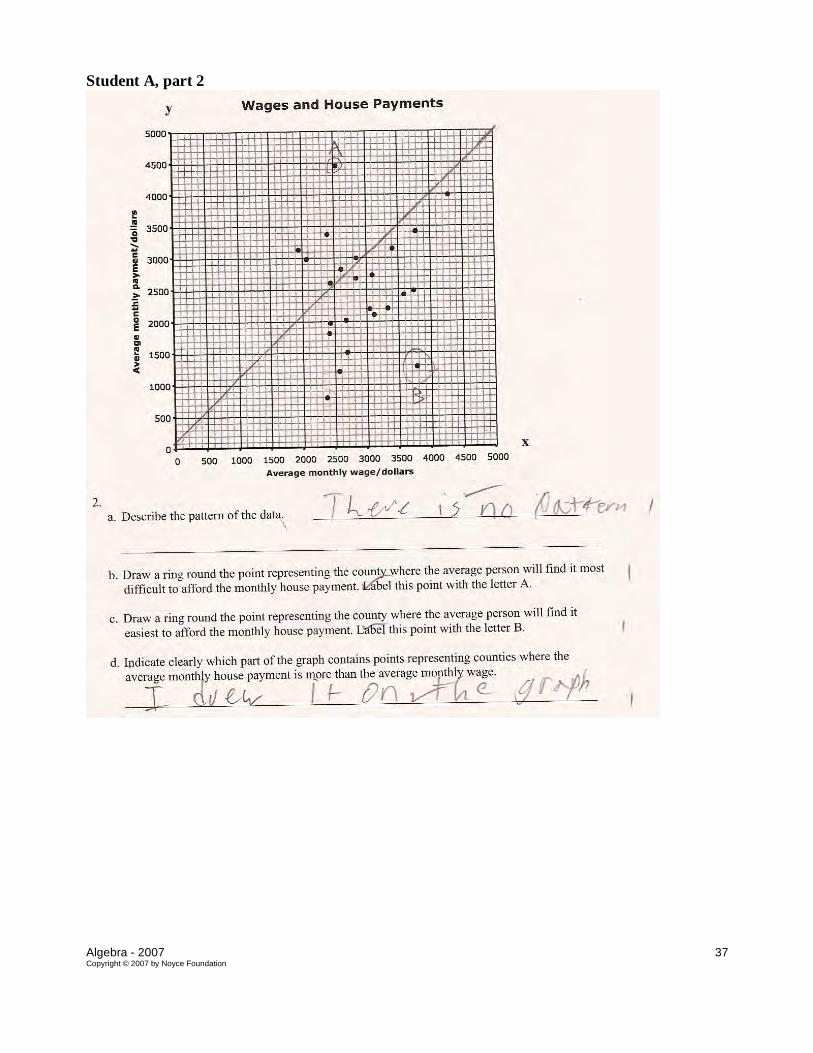
Student B also lacks the formal vocabulary for discussing data on a scatterplot. Thestudent drawslines to show the specific points currently on the graphwhere the payment is higher than the wage,butthe lines don’t define the entire area of the graphwhere this is true. So thestudent is makingsense of context, butnotreasoning aboutthe domain of the solution.Student B
Algebra - 2007 39Copyright © 2007 by Noyce Foundation
Student B , par t 2
Student C, representing about38% of the students, did notattempt to make a formula in part 1c. Inthinking aboutthegraph, the studentmakes a logical conclusion that is notsupported by the data. Inpart 2d, the student identifies two points that meet the constraints, butdoes notdefine the entireregion represented on the graphfor payments greater than wage.

Algebra - 2007 40Copyright © 2007 by Noyce Foundation
Student C
Algebra - 2007 41Copyright © 2007 by Noyce Foundation
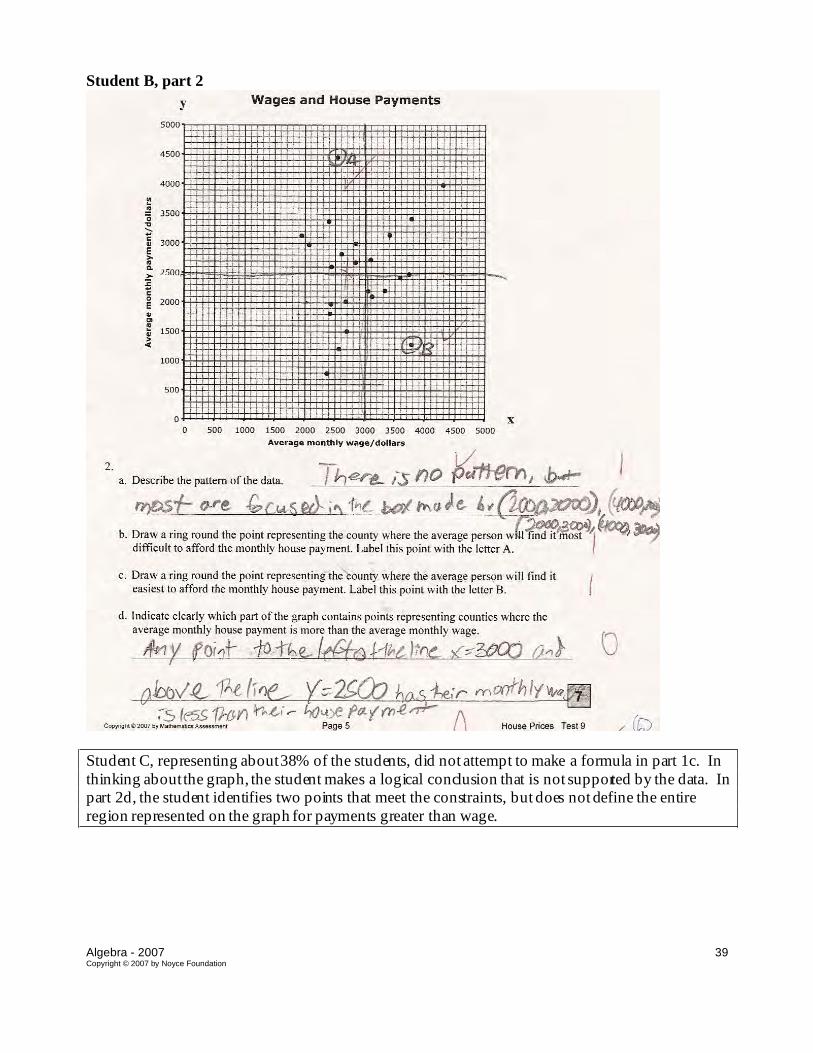
Student D does nottalk aboutthe trend in the data in part 1a, butinstead describes the scale. Inattempting the formula, the student gives a specific value (if the house costs 300,000 then thepayment is 2,500) reading a value from thegraph. The student is using the variable as a label, theequation really reads thehouse payment is $2500 for a house which equals or costs $300,000. Inpart 2a thestudent is givingan opinion rather than finding a trend in the data. In 2d, thestudentidentifies discrete points on thegraph: onetrue, one false, and onewhere the values are equal.Student D

Algebra - 2007 42Copyright © 2007 by Noyce Foundation
Student E makes an attempt to findthe relationship between payment and house price. The studentmakes a table of values, butis possibly relying onnumber sense to equate the two values rather thanknowing how to calculate a value. Are students given enoughopportunities to findrelationships andpatterns that are notbased on whole-number values? In part 2d thestudent identifies onepoint thatmeets the condition of payment exceeding wage, but does notthink aboutthepossibility of moresolutions. Howcan we help students build the internal dialog of asking questions, such as “ Is thisthe only case when this is true? What tools mighthelp me find all thepossibilities?”Student E

Algebra - 2007 43Copyright © 2007 by Noyce Foundation
Student E , par t 2

Algebra - 2007 44Copyright © 2007 by Noyce Foundation
Finding the relationship between average monthly payment was truly a problem-solving struggle forstudents. The work of StudentF shows the amount of investigating the student needed to do solvethe problem. Howwould you categorize the strategies used? Which calculation finally helped thestudent with the solution? What algebraic tools would you want thestudent to use instead? In part2d the student findssome of thepoints that meet the criteria, butincludes onethat does not. Thestudent does notuse the information aboutwage equaling monthly payment to help define theareafor the inequality.Student F

Algebra - 2007 45Copyright © 2007 by Noyce Foundation
Student F , par t 2

Algebra - 2007 46Copyright © 2007 by Noyce Foundation
Algebra T ask 2 House Pr ices
StudentTask
Work with graphsand formulas in a real context.
C ore I dea 5Data Analysis
Select and use appropr iate statistical methods to analyze data.Understand the relationship between two sets of data, displaysuch data in a scatterplot, and describe trendsand shapeof theplot including correlations (positive, negative, andno) andlines of best fit.Make inferences based on the data and evaluate the validity ofconclusions drawn.
C ore I dea 3AlgebraicProper ties andR epresentations
R epresent and analyze mathematical situations and structuresusing algebraic symbols.
Use symbolic expressions to represent relationships arisingfrom various contexts.Approximate and interpret rates of change, fromgraphic andnumeric data.
Mathematic in this task:Understanding informationon a scatterplot, looking for trendssuch as correlationor nocorrelationRecognizing that a linear function passing throughthe origin is a proportion andfindingaformula for a proportionReading and interpretingpoints on a graphGraphing inequalities
Based on teacher observations, this is what algebra students knew and were able to do:Read and locate points on a scatterplot to meet constraints of the contextRecognize when there is no pattern in a scatterplotDescribea trend in a scatterplot
Areas of difficulty for algebra students:Finding a formula for a lineon a graphGraphing an inequality on a graph from a verbal description

Algebra - 2007 47Copyright © 2007 by Noyce Foundation
The maximum score available for this task is 7 points.The minimumscore for a level 3 response, meeting standards, is 4 points.
Most students, 93%, could either �nd the monthly payment from the graph or could state that there was nopattern to the second scatterplot. About half the students, 55%, could explain the trend of the �rst graph, �ndthe monthly payment, and locate the two points on the second graph for easiest and most di� cult to a�ord.Some students, about 32%, could also describe the randomness of the second scatterplot. A few students,about 11% could also write a formula for a line on graph. Only 2.5% of the students could meet all thedemands of the task including graphing and labeling an inequality on a graph. 7% of the students scored nopoints on the task. 75% of the students with this score attempted the task.

Algebra - 2007 48Copyright © 2007 by Noyce Foundation
House Pr icesPoints Understandings M isunderstandings
0 75% of the students with thisscore attempted the task.
Students could not locate the y coordinate onthe graph. Students had difficulty withdecimal errors, giving an answer in the tenthousands (6%), hundred thousands (6%), oreven hundreds. Another decimal error wasunderstanding what is halfway between 3000and 4000. 4% of the students putnumberssuch as 3050 for 3500.
1 Students could findthemonthly payment or noticethat the pattern on graph2 wasrandom.
About6% of thestudents madea falsestatement aboutthe graph, “Thehigher thewage the higher thepayment.” About9% saidit increases or it decreases.
4 Students could state the trendfor the first graph, findthepayment on the graph, andlocate the points for easiestand hardest to afford.
13% of the students just said that the graphgoes up for the first graph. For pointA thetwo most common errors were (1900,3100)and (4300,4000). 8% of the students markeda region for thepoints instead of a specificpoint. 5% marked two points, but didn’t labelthem A and B .
5 Students in this groupcouldalso identify the lack ofpattern or randomness of thesecondgraph.
Students struggled with writing a formula.38% did not even attempta formula. About4% gave a formula with a decimal error (e.g.y=.8 x instead of y = .008 x). Some studentsadded a third variable (ym=x; y/x=paymt).Some students tried to give a rule aroundplace value (100,00 – 10,000; h- 100,000;takeoff 2 zeroes; y=x/100) Others gave ratios (forevery 100,000 its 100; ) Many wrote y=mx+b,with no attempt to give values for m andb.
6 Students could write anequation for the proportion inpart 1.
Students could notgraph an inequality. 16%did notattempt to find thearea for paymentlarger than wage. 16% circled a few correctpoints, butnot all. 8% just picked pointA .10% said the middle, 6% left side, 10% thetop, 3% theright. 16% gave a range, such as2000 to 3000, with no labels or reference tothe other variable.
7 Students could meetall thedemands of the task: readandlocate points on graph, describe atrend in scatterplots, write aformula for the equation of a lineon a graph, and graph aninequality.

Algebra - 2007 49Copyright © 2007 by Noyce Foundation
I mplications for I nstructionsStudents need opportunities to work with data in context in a variety of formats. Students need tohave conversations aboutthe data to help them build the academic vocabulary of discussing data,such as understanding correlation and nocorrelation. Students should beable to apply the skills ofwriting an equation for a line to practical situations, such as findingthe formula for a line ona datagraph.Students at this grade level should beencouraged to make and test conjectures. Students should alsodevelop the habit of mindto use points on the graph to verify thevalidity of their formulas. Nostudent in the sample showed evidence of checking their formula against points on thegraph. Aquick test would show that 100,000 – 10,000 does notequal the paymentof $800.Many of the students struggled with decimal place value and calculations with decimals. Theymightbenefit froma two or three week separate class to review and understand decimals. Someschools do this as an after school class or Saturday class. Some schools mighthave a secondmathclass to work on mathematical concepts to support weaker students placed in Algebra.
Action R esear ch – Wh at W ould I t T ake?Sit down with colleagues and discuss some of thegaps in students’ mathematical knowledgewhenthey come to algebra. Do they have weaknesses in working with decimals, understanding fractions,understanding number operations, mathematical literacy and working with word problems, percents,and measurement? How can you design a program to support these students?
Are these gaps reasonable to fill within the constraints of the regular program? How much timemightit take to work with a small groupof students to diagnose and give them the information theyneed? How is the type of instruction they need different from the instruction in teaching a conceptfor the first time? What does it take to help students confronta misconception and replace it with adifferent idea?
Pick onesmall topic or problem area that everyoneagrees is problematic for students. Finda varietyof lessons from thematerials upfor adoption on the intervention list. Divideupthe lessons andhave each teacher try a set in their classroomor with a small groupof students in a pull outprogramduring prep or a few days of an after school class. Which materials seemed to have the mostpromising results? Now have all teachers try those materials, for that onetopic. If possible try tovideo tape the sessions or arrangeto view the lessons during each other’ s preps. What would it taketo really implement oneof those programs? What would be the pros and cons? What kind ofprofessional development would beneeded by thestaff to assist in implementation? How can thework besplit between all math teachers to allow for discussion and collaboration to make thiseffective and a team effort? Would it bepossible to build in some common prep periodsforplanning?