commoditymonthly 031208 edited -...
TRANSCRIPT

Investment research
Commodity sales: Martin Vorgod,, Dealer, FX, MM and derivatives sales, +45 45 14 32 86, [email protected]
Editor in Chief: Steen Bocian, Chief Economist, + 45 45 12 85 31, [email protected]
Web: http://www.danskebank.com/danskeresearch
Commodity Monthly
December 3, 2008
Economic slowdown continues Commodity Research: Arne Lohmann Rasmussen, Senior Analyst, +45 45 12 85 32, [email protected]
Over the last couple of months it has become clear that the economic crisis had turned into a global recession. Furthermore, the crisis has spread to emerging markets with a vengeance, and commodity demand is not just slowing, but is currently falling compared to earlier this year. The short-term outlook for the global economy is very bleak. Over the last couple of days global PMIs have nose-dived: the indicators were a record low in November in countries such as UK, Germany, Japan and China. In the US the ISM has dropped to the weakest level since 1982. Overall, the data releases point to an unprecedented drop in manufacturing activity in Q4. In light of the weak outlook, we published our new global growth forecasts in Global Scenarios last week. Basically, we forecast that in the coming three to six months the major economies are expected to continue to contract as the negative impact from the credit crisis, a further deepening of the housing slowdown, a backlash in emerging markets, and the negative recession dynamics, already in train, dominate.
With the short-term outlook for commodities looking dire, we also revised down our oil price forecasts for Q1 and Q2 2009 to approximately USD 50 a barrel on average. However, in our view there is already a very negative growth trajectory priced into commodities. The market seems to have overlooked the fact that the next couple of quarters are going to see very accommodative economic policies on a global scale. The Federal Reserve is, for example, most likely going to introduce a Zero Interest Rate Policy, and new fiscal stimuli have or will be introduced in almost all countries. In that respect one should not forget the aggressive easing that China recently introduced with fiscal packages, rate cuts and the removal of credit quotas. All in all, we expect that by mid-2009 the major OECD economies should return to positive growth rates and that a subsequent slow recovery will materialize in H2 2009. Our forecast for commodity prices is closely connected to this growth outlook. Hence, we look for more or less stable prices in H1 2009 and rising prices in line with the improved growth outlook during H2 2009. We also argue that the supply side will gain growing attention going forward and eventually support prices. A consequence of the current collapse in commodity prices and the financial credit crisis is a significant slowdown in commodity production and commodity investments. The latter points to a renewed tightness in many commodity markets when the global economy eventually recovers.
But one should expect ongoing high volatility over the coming months. Trying to call a bottom in commodity markets is like catching a falling knife at the moment. Therefore, one should not, for example, be surprised to see oil below USD 40 for a shorter period of time, depending on e.g. OPEC action. On top of the weak growth we could add closure of long commodity positions both from speculators and investors, but also from businesses that choose to close down loss-incurring commodity hedges entered into in the summer when the outlook for commodities was very different from today. Just as speculative activity might have added to prices in the first half of 2008, it cannot be ruled out that the opposite is now happening. Speculators are entering short positions to bet on an even more severe �global recession�. Hence, just as commodity prices might have �overshot� earlier in the year, it certainly cannot be ruled out that we are now seeing some sort of �undershooting�.

D E C E M B E R 3 , 2 0 0 8 C O M M O D I T I E S M O N T H L Y
D A N S K E M A R K E T S R E S E A R C H 2
Energy
OPEC showing signs of indecisiveness
OPEC did not cut production at the extraordinary OPEC meeting in Cairo November 29 despite clear evidence that the oil market is over supplied. OPEC deferred a decision to the ordinary OPEC meeting on December 17. The inaction of OPEC is probably a key reason why oil is once again trading below USD 50 a barrel.
But in reality, OPEC�s inaction at the meeting was not the only important news from the meeting. We find it quite surprising that Saudi Arabia attacked the hawks of OPEC, notably Iran and Venezuela, for not complying with quotas, considering that both countries claim compliance. Probably the first sign that the cartel is starting to crack, at a time when it is maybe facing the toughest demand contraction in the history of OPEC. Historically it has proved very difficult for OPEC to stabilise oil prices and adhere to quotas when the global economy is heading for a recession. Consider the development in oil prices after the Asian crisis in 1998 or after 9/11 in 2001.
Another explanation for OPEC�s inaction could be that the cartel, or rather the Saudis, are trying to convince its fellow members of OPEC and e.g. Russia that it is of utmost importance this time to comply with quotas (and words in the case of Russia). Maybe a very timely warning, as the latest Reuters survey indicated that OPEC might only have slashed production by 66% of the 1.5 mb/d pledged by November 1.
The obvious question is of course how much oil OPEC will actually take off the market over the coming months in order to stabilize it. Comments by Saudi Minister Ali al-Naimi indicate that he thinks that if OPEC complied to the current 2 mb/d production cuts, everything would be fine. However, we very much doubt this will be the case. If OPEC only cut production by this amount we would see a significant further rise in OECD stocks. End-September OECD crude oil stocks were standing at 55 days forward cover � up more than two days compared to the 2003-2007 average.
If production is not cut further we could see a counter-seasonal build up in stocks in Q4 and Q1 next year, and we are sure that OPEC President Khelil has made this clear to his members. Hence, we base our forecast on the presumption that OPEC adheres 80% to its quotas and slashes quotas by another 1.5 mb/d at the December 17 meeting and follows up with a final albeit smaller cut in Q1 next year. Remember that many OPEC countries including Iran, Iraq and Venezuela, will face budgetary problems if oil prices stay at current levels. A problem magnified by the fact that OPEC oils trade at a significant discount to Brent and WTI.
As mentioned on the front page, we have revised our 2009 average oil price forecast down from USD 80 a barrel to USD 60. In the first two quarters we forecast around USD 50. But in line with better global economic growth in H2 2009, we expect prices to approach USD 75 by end-2009.
Our forecast oil price rise in H2 2009 depends, of course, on the slow global recovery that we forecast actually materializing. But it also depends on the supply side. Not just OPEC slashing production, but also that the market turns its attention to the slowdown in non-OPEC supply growth that we anticipate going forward.
Our view is that the current price collapse and the very difficult funding/credit situation will be a severe impediment for non-OPEC oil supply growth in 2009, and not least in 2010. Many oil companies operate with a hurdle-rate of USD65/barrel. Marginal costs today might be as high as USD 80 a barrel. Even though marginal costs are also falling at the moment, it could, according to the IEA, take 12-18 months before overall costs start to decline.
Oil investment plans are being slashed dramatically at the moment. Remember, that the IEA warned in connection with the release of the new Global Energy Outlook that the oil market might tighten again in 2010�2012 due to lack of investment. Looking into 2010�2012, oil prices could very well again trade above USD100/barrel. The current investment slowdown combined with a global economic recovery points to a very tight oil market in just a few years. The IEA has repeatedly warned about this negative effect of the current price collapse and the financial crisis

D E C E M B E R 3 , 2 0 0 8 C O M M O D I T I E S M O N T H L Y
D A N S K E M A R K E T S R E S E A R C H 3
Two regions especially are suffering: Canada and Russia. In Canada, Suncor has already announced that it will cut investment by 30-40% in 2009. Hence, the outlook for supply growth from Canadian oil sands looks less promising even though the effect will mostly be felt in 2010. Russia is definitely an area in which oil production could disappoint heavily in 2009. Russian oil companies are very dependent on debt to finance investments, and with the current state of the Russian banking sector and the bleak outlook for the Russian economy, it does not bode well for Russian oil production going forward. Heavy export taxes also work as an impediment for Russian oil production at the moment even though this issue is expected to be resolved eventually. There are also growing signs that Russia is approaching OPEC. We doubt that Russia will take any direct part in production cuts. But production is expected to fall anyway in 2009.
We also note that the oil majors are talking about revising their investments plans. There are now indications that the upstream companies are trying to pressure the oil service companies, which during the five-year oil-boom generated very high profits. We also expect smaller debt-burdened oil companies to be forced to slash investment programmes and cancel rig orders going forward. The bleaker outlook is already reflected in lower rig rates and not least in the stock market, where oil service companies have seen their market value eroded heavily during the bear market. The latest survey by the IEA also showed that the so-called decline rates are on the rise. Hence, the need for investment is even higher, merely to keep production afloat. We forecast that non-OPEC production will be close to flat again in 2009, if not falling.

D E C E M B E R 3 , 2 0 0 8 C O M M O D I T I E S M O N T H L Y
D A N S K E M A R K E T S R E S E A R C H 4
Energy � charts
Crude oil prices WTI futures curve
.
jan06
maj sep jan07
maj sep jan08
maj sep
perc
ent
40
60
80
100
120
140
perc
ent
40
60
80
100
120
140USD/barrel USD/barrel
WTI 1-pos, NYMEX
Brent, 1-pos
.
1 4 7 10 13 16
perc
ent
40
50
60
70
80
90
100
40
50
60
70
80
90
100
One month ago
USD/barrel
Last valid
Source: ECOWIN Source: ECOWIN
Natural Gas, Henry Hub, 1-pos Bunker fuel oil, 380 cst Amsterdam
.
jan06
maj sep jan07
maj sep jan08
maj sep
perc
ent
4
6
8
10
12
14
perc
ent
4
6
8
10
12
14 USD/mmBtu USD/mmBtu
.
jan06
maj sep jan07
maj sep jan08
maj sep
perc
ent
100
200
300
400
500
600
700
800
perc
ent
100
200
300
400
500
600
700
800 USD/ton USD/ton
Source: ECOWIN Source: ECOWIN
Gasoline RBOB, 1-pos NYMEX RBOB gasoline futures curve
.
jan06
maj sep jan07
maj sep jan08
maj sep
perc
ent
100
150
200
250
300
350
400
perc
ent
100
150
200
250
300
350
400 c/gallon c/gallon
.
0 1 2 3 4 5 6 7 8 9 10
perc
ent
1,0
1,1
1,2
1,3
1,4
1,5
1,6
1,7
1,8
perc
ent
1,0
1,1
1,2
1,3
1,4
1,5
1,6
1,7
1,8
one month ago
Last valid
USD/gallon USD/gallon
Source: ECOWIN Source: ECOWIN
Heating oil, 1-pos NYMEX Coal, 1-pos, API2
.
jan06
maj sep jan07
maj sep jan08
maj sep
perc
ent
100
150
200
250
300
350
400
450
perc
ent
100
150
200
250
300
350
400
450 c/gallon c/gallon
.
03 04 05 06 07 08
perc
ent
25
50
75
100
125
150
175
200
225
perc
ent
25
50
75
100
125
150
175
200
225 USD/ton USD/ton
Coal API2 1.pos. future
Source: ECOWIN Source: ECOWIN
D E C E M B E R 3 , 2 0 0 8 C O M M O D I T I E S M O N T H L Y
D A N S K E M A R K E T S R E S E A R C H 5
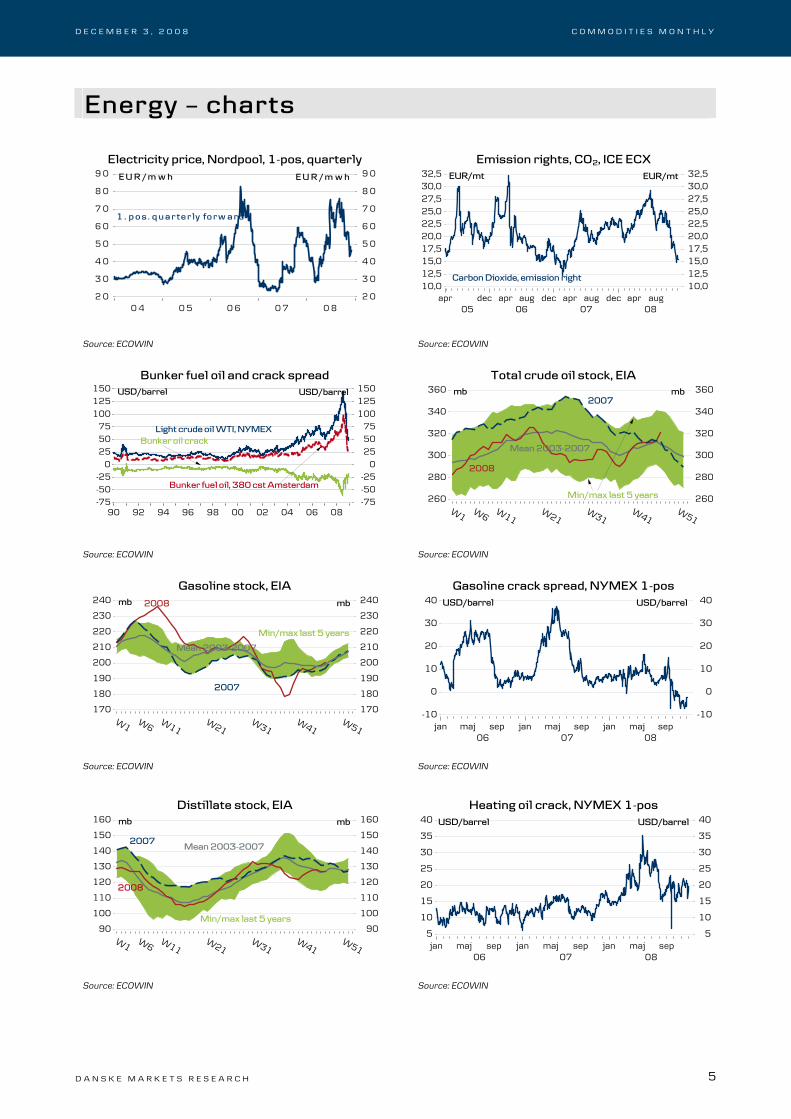
Energy � charts
Electricity price, Nordpool, 1-pos, quarterly Emission rights, CO2, ICE ECX
.
0 4 0 5 0 6 0 7 0 8
perc
ent
2 0
3 0
4 0
5 0
6 0
7 0
8 0
9 0
perc
ent
2 0
3 0
4 0
5 0
6 0
7 0
8 0
9 0
1 . p o s . q u a r t e r ly fo r w a r d
E U R / m w h E U R / m w h
.
apr05
dec06
apr aug dec07
apr aug dec08
apr aug
perc
ent
10,012,515,017,520,022,525,027,530,032,5
p
10,012,515,017,520,022,525,027,530,032,5
Carbon Dioxide, emission right
EUR/mt EUR/mt
Source: ECOWIN Source: ECOWIN
Bunker fuel oil and crack spread Total crude oil stock, EIA
.
90 92 94 96 98 00 02 04 06 08
perc
ent
-75-50-25
0255075
100125150
perc
ent
-75-50-25
0255075
100125150
Light crude oil WTI, NYMEX
USD/barrel USD/barrel
Bunker fuel oil, 380 cst Amsterdam
Bunker oil crack
W1 W6 W11W21
W31W41
W51
perc
ent(
milli
ons)
260
280
300
320
340
360
perc
ent (
milli
ons)
260
280
300
320
340
360
Mean 2003-2007
2007
2008
Min/max last 5 years
mb mb
Source: ECOWIN Source: ECOWIN
Gasoline stock, EIA Gasoline crack spread, NYMEX 1-pos
.
W1 W6 W11W21
W31W41
W51
perc
ent (
milli
ons)
170
180
190
200
210
220
230
240
perc
ent (
milli
ons)
170
180
190
200
210
220
230
240
Mean 2003-2007
2008
Min/max last 5 years
mb mb
2007
jan06
maj sep jan07
maj sep jan08
maj seppe
rcen
t-10
0
10
20
30
40
p
-10
0
10
20
30
40 USD/barrel USD/barrel
Source: ECOWIN Source: ECOWIN
Distillate stock, EIA Heating oil crack, NYMEX 1-pos
.
W1 W6 W11W21
W31W41
W51
perc
ent (
milli
ons)
90
100
110
120
130
140
150
160
perc
ent (
milli
ons)
90
100
110
120
130
140
150
160 mb
Mean 2003-2007
Min/max last 5 years
2008
mb
2007
jan06
maj sep jan07
maj sep jan08
maj sep
perc
ent
5
10
15
20
25
30
35
40
5
10
15
20
25
30
35
40 USD/barrel USD/barrel
Source: ECOWIN Source: ECOWIN

D E C E M B E R 3 , 2 0 0 8 C O M M O D I T I E S M O N T H L Y
D A N S K E M A R K E T S R E S E A R C H 6
Base metals PMI �s plummet and push base metal even lower
The immense pressure on commodity prices, not least the cyclical sensitive base metals, continued in November. The fact that global manufacturing PMI�s plummeted in November does not bode well for demand in the current quarter for base metals. Global construction and other investments seem to have almost come to a halt at the moment and certainly adds to worries in the market.
The pressure on the base metal markets is evident in the stock build we are seeing across the board. Aluminium and copper LME stocks rose 19% and 23% in November. However, the rising stocks might also reflect both consumers and producers trying to create liquidity by delivering metal to warehouses. It is also said in the market that many companies need an exchange registered warrant to get finance for new raw material inventory. But even these anomalies cannot hide that the base metal market will remain soft for a prolonged period. There is simply an oversupply at the moment that has to be worked off.
We have earlier argued that many base metals are trading below marginal costs. Especially we have pointed to aluminium where the downside should be protected. But we have to admit that at the moment marginal costs are now falling very quickly. The combination of falling energy, alumina, shipping and even labour costs all work in favour of lower production costs. But even taking this into account, a significant fraction of e.g. aluminium production is now being produced at a loss.
However, as we wrote in the energy section, another side effect of the ongoing financial crisis and slide in commodity prices is emerging in the form of an increasingly serious negative impact on the supply of commodities and investment plans. Nickel producers are one area where the market has already begun to adapt to the new world order. The drop in global stainless steel production in the past couple of months will probably continue in the coming months, and production cuts of up to 8% for nickel and 5-6% for aluminium have already been announced. So far these production cuts have been ignored by the market, as there has also been a huge drop in demand and stock building. However, if demand starts to stabilise and then recover, a number of commodity markets could tighten again. But for now this is probably an H2 2009 story when it comes to the base metal complex.
In line with our new oil forecast we have also revised our base metal forecasts lower. Basically we think that the market is about to form a bottom. But again it is like catching a falling knife. But it seems that a very negative growth trajectory is priced into spot prices. If we are right that the growth outlook should improve somewhat during 2009, this should mean higher prices over the course of 2009. We expect aluminium and copper prices at USD 2,400 and USD 4,700 a tonne at end-2009. But we do not expect significantly higher prices for the next 3-6 months. Our average forecast prices for 2009 for aluminium and copper are USD 2,100 and USD 4,225 a tonne, respectively.
Global PMI�s in free fall
.
02 03 04 05 06 07 08
perc
ent
38
42
46
50
54
58
perc
ent
38
42
46
50
54
58 Net figure Net figure
G4 manufacturing PMI
Emerging Markets Manufacturing PMI
China PMI
Putting pressure on base metals
.../figurbibliotek/
90 92 94 96 98 00 02 04 06 08
perc
ent
37,5
42,5
47,5
52,5
57,5
62,5
perc
ent
-80
-60
-40
-20
0
20
40
60
80 Index<< Copper. LME
ISM >>
% y/y
<< Aluminium
Copper, LME
D E C E M B E R 3 , 2 0 0 8 C O M M O D I T I E S M O N T H L Y
D A N S K E M A R K E T S R E S E A R C H 7
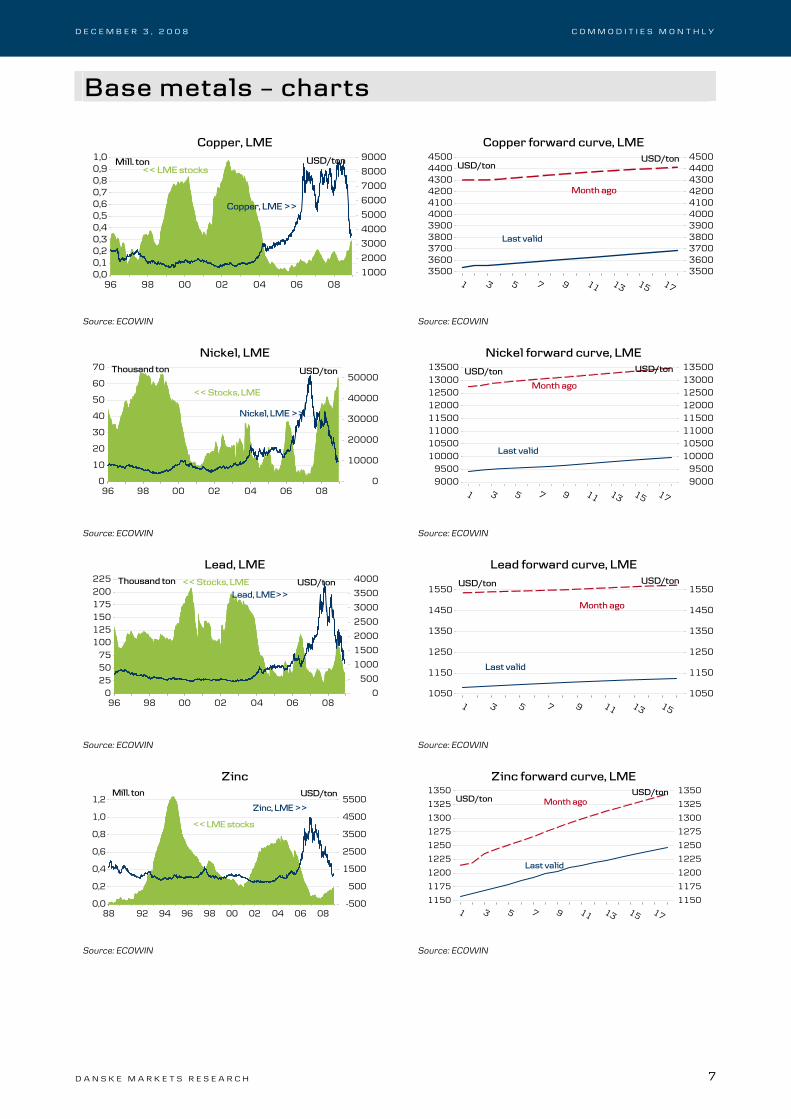
Base metals � charts
Copper, LME Copper forward curve, LME
.
96 98 00 02 04 06 08
perc
ent
1000
2000
3000
4000
5000
6000
7000
8000
9000
perc
ent (
milli
ons)
0,00,10,20,30,40,50,60,70,80,91,0
Copper, LME >>
<< LME stocksUSD/tonMill. ton
1 3 5 7 9 11 13 15 17
perc
ent
35003600370038003900400041004200430044004500
perc
ent
35003600370038003900400041004200430044004500
USD/tonUSD/ton
Last valid
Month ago
Source: ECOWIN Source: ECOWIN
Nickel, LME Nickel forward curve, LME
.
96 98 00 02 04 06 08
perc
ent
0
10000
20000
30000
40000
50000
perc
ent (
thou
sand
s)
0
10
20
30
40
50
60
70
Nickel, LME >>
<< Stocks, LME
USD/tonThousand ton
1 3 5 7 9 11 13 15 17
perc
ent
90009500
1000010500110001150012000125001300013500
perc
ent
90009500
1000010500110001150012000125001300013500 USD/ton USD/ton
Month ago
Last valid
Source: ECOWIN Source: ECOWIN
Lead, LME Lead forward curve, LME
.
96 98 00 02 04 06 08
perc
ent
0
500
1000
1500
2000
2500
3000
3500
4000
perc
ent (
thou
sand
s)
0255075
100125150175200225
Lead, LME>><< Stocks, LME USD/tonThousand ton
1 3 5 7 9 11 13 15pe
rcen
t
1050
1150
1250
1350
1450
1550
perc
ent
1050
1150
1250
1350
1450
1550USD/ton USD/ton
Last valid
Month ago
Source: ECOWIN Source: ECOWIN
Zinc Zinc forward curve, LME
.
88 92 94 96 98 00 02 04 06 08
perc
ent
-500
500
1500
2500
3500
4500
5500
perc
ent (
milli
ons)
0,0
0,2
0,4
0,6
0,8
1,0
1,2Zinc, LME >>
<< LME stocks
USD/tonMill. ton
.
1 3 5 7 9 11 13 15 17
perc
ent
1150
1175
1200
1225
1250
1275
1300
1325
1350
perc
ent
1150
1175
1200
1225
1250
1275
1300
1325
1350USD/ton
USD/ton
Last valid
Month ago
Source: ECOWIN Source: ECOWIN

D E C E M B E R 3 , 2 0 0 8 C O M M O D I T I E S M O N T H L Y
D A N S K E M A R K E T S R E S E A R C H 8
Aluminium, LME Aluminium forward curve, LME
.
96 98 00 02 04 06 08
perc
ent
1000
1500
2000
2500
3000
3500
perc
ent (
milli
ons)
0,0
0,2
0,4
0,6
0,8
1,0
1,2
1,4
<< Stocks, LME
USD/tonMill. ton
Aluminium, LME >>
.
1 3 5 7 9 11 13 15 17
perc
ent
1600
1700
1800
1900
2000
2100
2200
2300
2400
perc
ent
1600
1700
1800
1900
2000
2100
2200
2300
2400 USD/ton USD/ton
Month ago
Last valid
Source: ECOWIN Source: ECOWIN
Tin, LME Tin forward curve, LME
.
96 98 00 02 04 06 08
perc
ent
2500
7500
12500
17500
22500
27500
perc
ent
-5000
5000
15000
25000
35000
45000
Tin, LME >><< Stocks, LME
USD/tonTon
.
1 3 5 7 9 11 13 15
perc
ent
11500
12000
12500
13000
13500
14000
14500
15000
15500
perc
ent
11500
12000
12500
13000
13500
14000
14500
15000
15500 USD/ton USD/ton
Last valid
Month ago
Source: ECOWIN Source: ECOWIN
Metal price index and ISM Metal price index and ifo
.../figurbibliotek/
90 92 94 96 98 00 02 04 06 08
perc
ent
37,5
42,5
47,5
52,5
57,5
62,5
perc
ent
-80
-60
-40
-20
0
20
40
60
80 Index<< Metal price index
ISM >>
% y/y
.../figurbibliotek/
94 96 98 00 02 04 06 08
perc
ent
-30
-20
-10
0
10
20
30
40
perc
ent
-60
-40
-20
0
20
40
60
80 Value y/y
<< Metal price index
% y/yifo business indicator, Germany >>
Source: ECOWIN Source: ECOWIN
Steel Billets, LME Stainless steel
.
jan08
mar maj jul sep nov
perc
ent
200
400
600
800
1000
1200
perc
ent
200
400
600
800
1000
1200USD/ton USD/ton
Steel Billet future, LME Mediterranean
Steel Billet future, LME Far East
.
01 02 03 04 05 06 07 08
perc
ent
1000
2000
3000
4000
5000
6000
perc
ent
1000
2000
3000
4000
5000
6000 USD/ton
Stainless steel, CR type 304
USD/ton
Source: ECOWIN Source: ECOWIN
D E C E M B E R 3 , 2 0 0 8 C O M M O D I T I E S M O N T H L Y
D A N S K E M A R K E T S R E S E A R C H 9
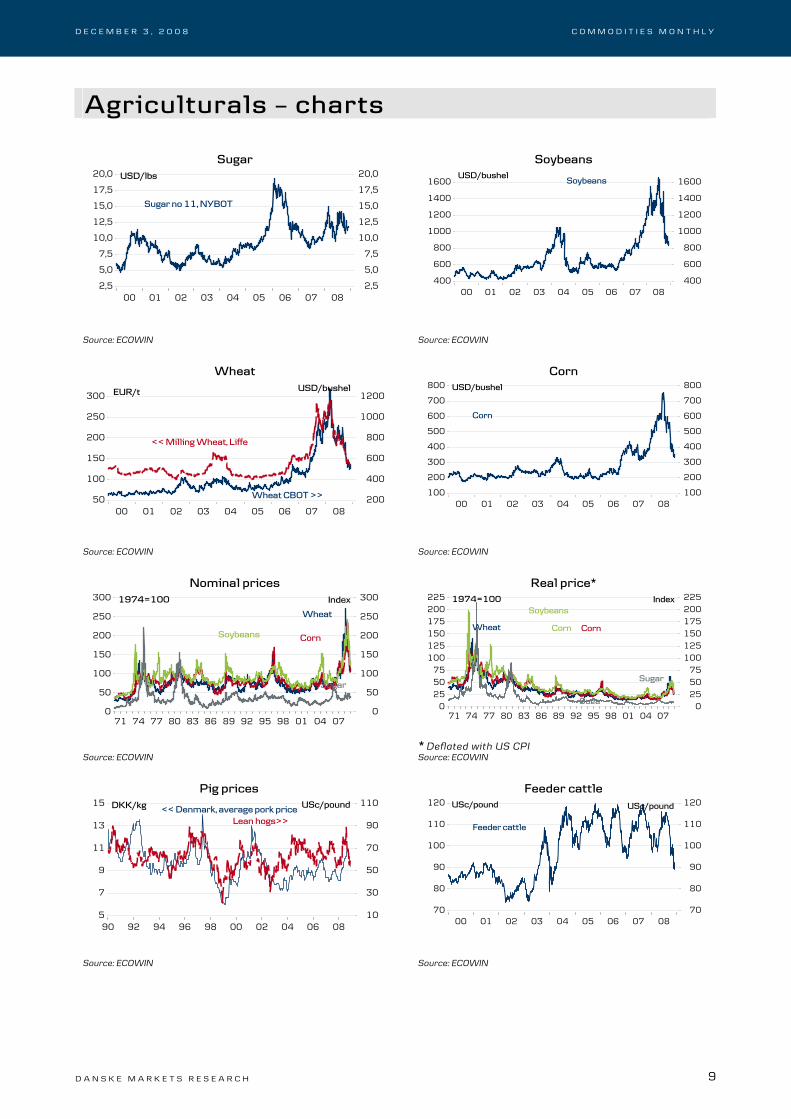
Agriculturals � charts
Sugar Soybeans
.
00 01 02 03 04 05 06 07 08
perc
ent
2,5
5,0
7,5
10,0
12,5
15,0
17,5
20,0
perc
ent
2,5
5,0
7,5
10,0
12,5
15,0
17,5
20,0
Sugar no 11, NYBOT
USD/lbs
.
00 01 02 03 04 05 06 07 08
perc
ent
400
600
800
1000
1200
1400
1600
perc
ent
400
600
800
1000
1200
1400
1600 SoybeansUSD/bushel
Source: ECOWIN Source: ECOWIN
Wheat Corn
00 01 02 03 04 05 06 07 08200
400
600
800
1000
1200
50
100
150
200
250
300
Wheat CBOT >>
EUR/t
<< Milling Wheat, Liffe
USD/bushel
.
00 01 02 03 04 05 06 07 08
perc
ent
100
200
300
400
500
600
700
800
perc
ent
100
200
300
400
500
600
700
800
Corn
USD/bushel
Source: ECOWIN Source: ECOWIN
Nominal prices Real price*
.
71 74 77 80 83 86 89 92 95 98 01 04 07
perc
ent
0
50
100
150
200
250
300
perc
ent
0
50
100
150
200
250
300
Sugar
Wheat
1974=100
CornSoybeans
Index
.
71 74 77 80 83 86 89 92 95 98 01 04 07pe
rcen
t0
255075
100125150175200225
perc
ent
0255075
100125150175200225
Sugar
Wheat
1974=100 Index
Suga
Corn
Soybeans
Corn
* Deflated with US CPI
Source: ECOWIN Source: ECOWIN
Pig prices Feeder cattle
.
90 92 94 96 98 00 02 04 06 08
perc
ent
10
30
50
70
90
110
perc
ent
5
7
9
11
13
15 DKK/kg << Denmark, average pork priceLean hogs>>
USc/pound
.
00 01 02 03 04 05 06 07 08
perc
ent
70
80
90
100
110
120
perc
ent
70
80
90
100
110
120 USc/pound USc/pound
Feeder cattle
Source: ECOWIN Source: ECOWIN
D E C E M B E R 3 , 2 0 0 8 C O M M O D I T I E S M O N T H L Y
D A N S K E M A R K E T S R E S E A R C H 10
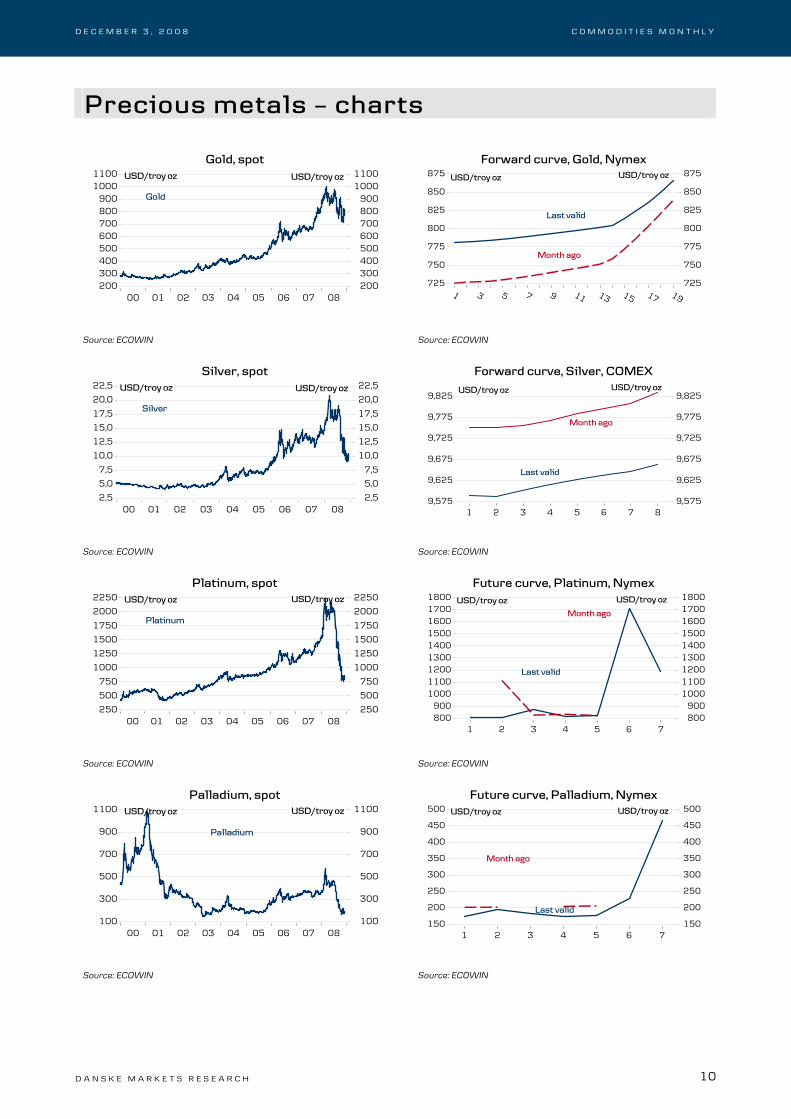
Precious metals � charts
Gold, spot Forward curve, Gold, Nymex
.
00 01 02 03 04 05 06 07 08
perc
ent
200300400500600700800900
10001100
perc
ent
200300400500600700800900
10001100 USD/troy oz USD/troy oz
Gold
.
1 3 5 7 9 11 13 15 17 19
perc
ent
725
750
775
800
825
850
875
perc
ent
725
750
775
800
825
850
875 USD/troy oz USD/troy oz
Last valid
Month ago
Source: ECOWIN Source: ECOWIN
Silver, spot Forward curve, Silver, COMEX
.
00 01 02 03 04 05 06 07 08
perc
ent
2,5
5,0
7,5
10,0
12,5
15,0
17,5
20,0
22,5
perc
ent
2,5
5,0
7,5
10,0
12,5
15,0
17,5
20,0
22,5 USD/troy oz USD/troy oz
Silver
.
1 2 3 4 5 6 7 8
perc
ent
9,575
9,625
9,675
9,725
9,775
9,825
perc
ent
9,575
9,625
9,675
9,725
9,775
9,825USD/troy oz USD/troy oz
Last valid
Month ago
Source: ECOWIN Source: ECOWIN
Platinum, spot Future curve, Platinum, Nymex
.
00 01 02 03 04 05 06 07 08
perc
ent
250
500
750
1000
1250
1500
1750
2000
2250
perc
ent
250
500
750
1000
1250
1500
1750
2000
2250 USD/troy oz USD/troy oz
Platinum
.
1 2 3 4 5 6 7
perc
ent
800900
100011001200130014001500160017001800
perc
ent
800900
100011001200130014001500160017001800 USD/troy oz USD/troy oz
Last valid
Month ago
Source: ECOWIN Source: ECOWIN
Palladium, spot Future curve, Palladium, Nymex
.
00 01 02 03 04 05 06 07 08
perc
ent
100
300
500
700
900
1100
perc
ent
100
300
500
700
900
1100 USD/troy oz USD/troy oz
Palladium
.
1 2 3 4 5 6 7
perc
ent
150
200
250
300
350
400
450
500
perc
ent
150
200
250
300
350
400
450
500 USD/troy oz USD/troy oz
Last valid
Month ago
Source: ECOWIN Source: ECOWIN

D E C E M B E R 3 , 2 0 0 8 C O M M O D I T I E S M O N T H L Y
D A N S K E M A R K E T S R E S E A R C H 11
Technical outlook Technical Analyst Klaus Ikast, + 45 45128501, [email protected] / [email protected] Tehnical Analyst Kim Cramer Larsson, + 45 45128499, [email protected] / [email protected]
Recovery in Corn. Every month we take a closer technical look at a specific commodity. This time we take a look at Corn.
Corn has made a bearish move since its peak in June 2008 and is now testing the strong support area at around 322-355. The support is the TDST line at 335 which is just above the 76.4 retracement level at around 322 based on the bullish trend starting in 2005. A trough to 322 could be seen before a recovery. A recovery that could take Corn back to 495, which then would be the 38.2 retracement of the recent bearish move. Look out for strong resistance at around 431. A break below 308 could trigger a further sell-off.

D E C E M B E R 3 , 2 0 0 8 C O M M O D I T I E S M O N T H L Y
D A N S K E M A R K E T S R E S E A R C H 12
Commodity prices
01-12-2008
Price Price %, m/m Price %, y/y Start level
EnergyNYMEX WTI - 1.pos. 52,0 67,8 -23,3 88,7 -41,4 96,0 -45,8
116,6 144,2 -19,2 226,0 -48,4 247,7 -52,9ICE Brent 1.pos. 51,5 65,4 -21,4 88,4 -41,8 94,0 -45,3ICE Carbon (�/tn), DEC-08 16,1 18,0 -10,4 22,4 -28,1 22,4 -28,2Electricity Nord Pool,�, 1.month 50,0 57,7 -13,3 - - - - -TTF Natural Gas,�, 1st. month 24,4 31,0 -21,5 - 14,1 24,6 -1,0Natural Gas, Nymex, 1.pos. 6,5 6,8 -4,0 7,3 -10,8 7,5 -13,0API2, steam coal, 1st month 89,7 100,7 -10,9 128,2 -30,0 125,0 -28,2
Aluminium 1.772 2.110 -16,02 2.510 -29,40 2.409 -26,44Copper 3.620 4.130 -12,35 6.715 -46,09 6.675 -45,77Lead 1.103 1.470 -24,97 3.030 -63,60 2.550 -56,75Nickel 10.200 11.970 -14,79 28.100 -63,70 26.300 -61,22Zinck 1.210 1.150 5,22 2.490 -51,41 2.370 -48,95
Gold 791,7 723,3 9,4 782,5 1,2 832,7 -4,9Silver 9,9 9,9 0,7 14,0 -29,2 14,8 -33,0
CBOT Wheat (US$/bushel) 547,3 557,0 -1,8 778,3 -29,7 795,3 -31,2Matif Mill Wheat (�/t) 132,3 144,0 -8,2 250,0 -47,1 251,0 -47,3CBOT Corn (US$/bushel) 361,0 402,0 -10,2 385,0 -6,2 456,0 -20,9CBOT Soybeans (US$/bushel) 867,0 925,8 -6,4 1.080,5 -19,8 1.199,5 -27,7NYBOT Sugar (US$/lb) 11,8 12,0 -2,0 9,7 20,8 10,8 8,9
Commodity indiciesReuters/CRB TR 242,2 268,4 -9,8 339,8 -28,7 358,7 -32,5S&P GSCI Energy TR 1.139,6 1.307,4 -12,8 1.828,0 -37,7 1.918,8 -40,6S&P GSCI Industrial Metals TR 1.051,6 1.225,8 -14,2 1.914,4 -45,1 1.835,6 -42,7S&P GSCI Agriculture TR 550,2 553,3 -0,6 786,6 -30,1 833,7 -34,0S&P GSCI Precious Metals TR 1.052,5 949,8 10,8 1.089,9 -3,4 1.133,1 -7,1AIG 122,8 132,0 -7,0 177,2 -30,7 185,0 -33,6Rogers commodity index TR 2.721,4 3.136,3 -13,2 4.208,5 -35,3 4.420,1 -38,4
Steel prices (EUR/t)EU domestic hot rolled coil 670,0 670,0 0,0 500,0 34,0 500,0 34,0EU domestic cold rolled coil 735,0 735,0 0,0 560,0 31,3 560,0 31,3EU domestic hotdip galv. Coil 837,5 837,5 0,0 610,0 37,3 610,0 37,3
Preciuos Metals: Spot Prices (US$/oz)
Agriculturals: Front Month Prices
Month ago Year ago This year
Base metals: LME 3M Prices (US$/t)
NYMEX Gasoline RBOB (Usc/gln) 1.pos.
YTD change, %
Source: ECOWIN
D E C E M B E R 3 , 2 0 0 8 C O M M O D I T I E S M O N T H L Y
D A N S K E M A R K E T S R E S E A R C H 13
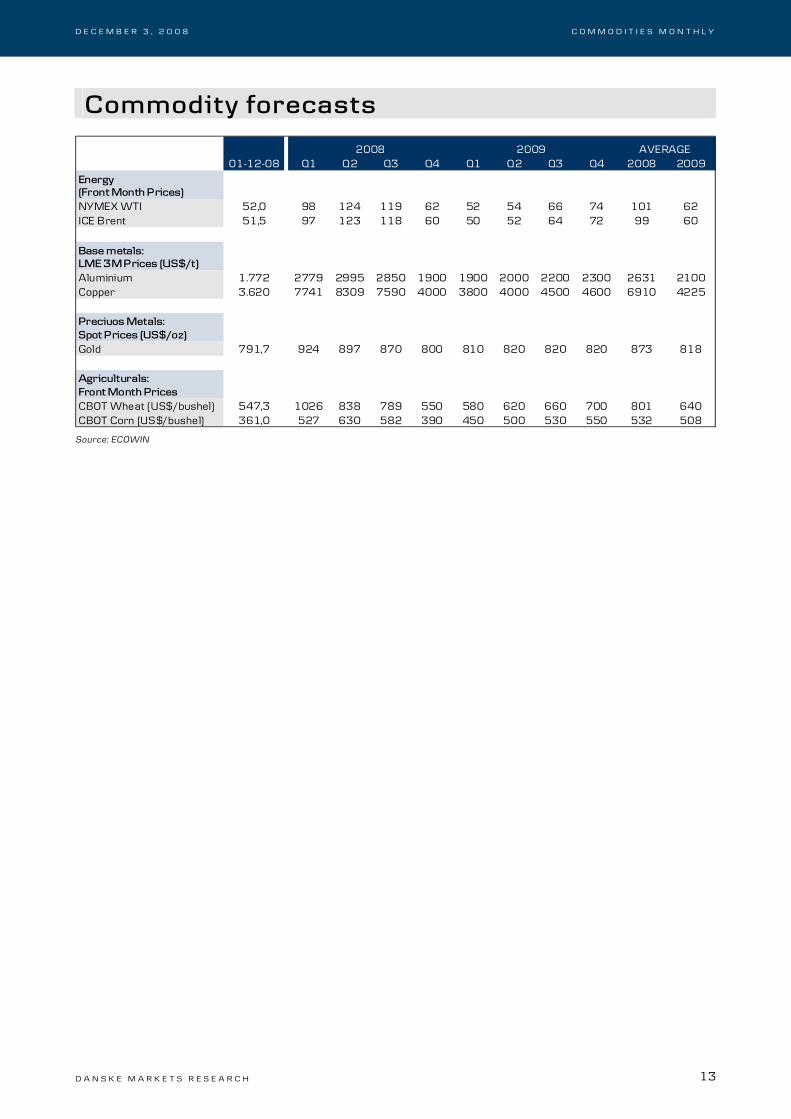
Commodity forecasts
2009 AVERAGE01-12-08 Q1 Q2 Q3 Q4 Q1 Q2 Q3 Q4 2008 2009
NYMEX WTI 52,0 98 124 119 62 52 54 66 74 101 62ICE Brent 51,5 97 123 118 60 50 52 64 72 99 60
Aluminium 1.772 2779 2995 2850 1900 1900 2000 2200 2300 2631 2100Copper 3.620 7741 8309 7590 4000 3800 4000 4500 4600 6910 4225
Gold 791,7 924 897 870 800 810 820 820 820 873 818
CBOT Wheat (US$/bushel) 547,3 1026 838 789 550 580 620 660 700 801 640CBOT Corn (US$/bushel) 361,0 527 630 582 390 450 500 530 550 532 508
2008
Agriculturals: Front Month Prices
Preciuos Metals: Spot Prices (US$/oz)
Base metals: LME 3M Prices (US$/t)
Energy (Front Month Prices)
Source: ECOWIN

D E C E M B E R 3 , 2 0 0 8 C O M M O D I T I E S M O N T H L Y
D A N S K E M A R K E T S R E S E A R C H 14
This report has been prepared by Danske Research, which is part of Danske Markets, a division of Danske Bank. Danske Bank is under supervision by the Danish Financial Supervisory Authority. Danske Bank has established procedures to prevent conflicts of interest and to ensure the provision of high quality research based on research objectivity and independence. These procedures are documented in the Danske Bank Research Policy. Employees within the Danske Bank Research Departments have been instructed that any request that might impair the objectivity and independence of research shall be referred to Research Management and to the Compliance Officer. Danske Bank Research departments are organised independently from and do not report to other Danske Bank business areas. Research analysts are remunerated in part based on the over-all profitability of Danske Bank, which includes investment banking revenues, but do not receive bonuses or other remuneration linked to specific corporate finance or dept capital transactions. Danske Bank research reports are prepared in accordance with the Danish Society o f investment Professionals� Ethical rules and the Recommendations of the Danish and Norwegian Securities Dealers Associations. Financial models and/or methodology used in this report Calculations and presentations in this report are based on standard econometric tools and methodology as well as publicly available statistics for each individual country. Documentation can be obtained from the above named authors upon request. Risk warning Major risks connected with recommendations or opinions in this report, including as sensitivity analysis of relevant assumptions, are stated throughout the text. First date of publication Please see the front page of this research report. Disclaimer This publication has been prepared by Danske Markets for information purposes only. It is not an offer or solicitation of any offer to purchase or sell any financial instrument. Whilst reasonable care has been taken to ensure that its contents are not untrue or misleading, no representation is made as to its accuracy or completeness and no liability is accepted for any loss arising from reliance on it. Danske Bank, its affiliates or staff, may perform services for, solicit business from, hold long or short positions in, or otherwise be interested in the investments (including derivatives), of any issuer mentioned herein. The Equity and Corporate Bonds analysts are not permitted to invest in securities under coverage in their research sector. This publication is not intended for retail customers in the UK or any person in the US. Danske Markets is a division of Danske Bank A/S. Danske Bank A/S is authorized by the Danish Financial Supervisory Authority and subject to limited regulation by the Financial Services Authority (UK). Details on the extent of our regulation by the Financial Services Authority are available from us on request. Copyright © Danske Bank A/S. All rights reserved. This publication is protected by copyright and may not be reproduced in whole or in part without permission