commodity trade-related illicit financial flows: evidence
TRANSCRIPT
© The Authors. All rights reserved. For more details, visit the project website: https://curbing-iffs.org/ This project is funded through the Swiss Programme for Research on Global Issues for Development (www.r4d.ch) by the Swiss Agency for Development and Cooperation (SDC) and the Swiss National Science Foundation (SNSF).
Curbing Illicit Financial Flows from Resource-rich Developing Countries:
Improving Natural Resource Governance to Finance the SDGs
Working Paper No. R4D-IFF-WP03-2019
Commodity Trade-related Illicit Financial Flows: Evidence of Abnormal Pricing in Commodity Exports from
Ghana
Preliminary Draft
Please do not cite without authors’ permission
January, 2019
Ama A. Ahene-Codjoe University of Ghana, Accra
Angela Alu
University of Ghana, Accra
Table of Contents
EXECUTIVE SUMMARY .............................................................................................................................. 3
ABBREVIATIONS ........................................................................................................................................... 5
1. INTRODUCTION .................................................................................................................................. 6
2. NATURAL RESOURCE SECTOR IN GHANA ........................................................................... 10
2.1. Cocoa Value Chain and Risks for IFFs ...................................................................................... 10
2.2. Gold Value Chain and Risks for IFFs ......................................................................................... 11
3. EMPIRICAL METHODOLOGIES .................................................................................................. 12
3.1. Partner-Country Trade Gap Method................................................................................................. 12
3.2. Price Filter Analysis Method ............................................................................................................... 14
3.2.1. Interquartile Price Filter Method ................................................................................................ 15
3.2.2. Arm’s Length Price Filter Method ............................................................................................. 15
4. DATA SOURCES .................................................................................................................................. 15
4.1. Gold and Cocoa Exports: 2011 – 2017............................................................................................. 15
4.2. Free Market Commodity Price Data: 2011–2017 ............................................................................ 16
5. ESTIMATES OF ABNORMAL PRICING ...................................................................................... 17
5.1. Gold (Semi-Manufactured) ................................................................................................................. 18
5.2. Cocoa Beans (HS Code: 1801.00.1100) ............................................................................................ 22
5.3. Cocoa Paste (HS Code: 1803.20.0000) .............................................................................................. 26
6. RISKS FOR IFFs IN GHANA’S NATURAL RESOURCE SECTOR ....................................... 31
7. SUMMARY AND CONCLUSIONS .................................................................................................. 32
REFERENCES ................................................................................................................................................ 33
APPENDICES ................................................................................................................................................. 36
EXECUTIVE SUMMARY
Illicit financial flows (IFFs) have emerged as important concerns in academic and policy debates
regarding development finance, domestic resource mobilization and natural resource governance.
This paper focuses on commodity trade-related IFFs which represent significant economic and
governance challenges for mineral-rich, developing countries like Ghana by eroding the financial
resources available to them for development finance. The two main, overlapping channels for IFFs
identified in this context include trade mispricing and transfer mispricing; however, existing empirical
evidence for Ghana remains severely limited.
This paper sets out to contribute to the limited literature on trade-based IFFs from Ghana by
providing novel evidence of abnormal pricing in Ghana's commodity exports, defined as the
magnitude of exports valued outside an assumed arm’s length price range. Our baseline estimates are
calculated using free-market price filter methods, whereby we compare each individual transaction-
level unit price of commodity exports with an assumed arm’s length price range based on free market
prices from commodity exchanges. The assumptions made to define the arm’s length price range are
based on extensive commodity sector research and expert interviews. Next, we also compare these
estimates with results based on the interquartile range price filter method, whereby the interquartile
range of observed export prices is denoted as the arm’s length price range. This method is useful to
consider when there is no clearly acknowledged single market price for a particular commodity. We
use transaction level trade micro data provided by the Ghana Revenue Authority (2011-17) for the
analysis. Our analysis focuses on two of Ghana’s most economically significant commodity exports,
gold (gold bullion and unwrought gold) and cocoa (superior quality cocoa beans and cocoa paste),
which represent approximately 70% of Ghana’s annual primary exports.
Based on some clearly discussed assumptions informed by extensive commodity sector research, our
findings indicate significant magnitude of abnormal undervaluation of commodity exports from
Ghana. Using contemporaneous market reference prices, we find that abnormally undervalued
export for gold (gold bullion and unwrought gold) equalled USD3.8 billion or 11% of the total
export value (35.6 billion USD) between 2011 and 2017. The estimates for cocoa beans and cocoa
paste are based on interquartile range price filter methods, due to lack of clear market reference
prices. A possible explanation for the observed price rigidities of cocoa bean exports is their
predominant trade in futures markets via forward contracts.
Based on our preferred interquartile range filters, we estimate that 2.7% of the 12.6 billion USD
worth of cocoa beans exported was undervalued; that is found below the 25th percentile of the per
unit price distribution of cocoa beans. Similarly, we estimate that 7.5% of the total export of cocoa
paste (1.8 billion USD) was undervalued. The relatively high undervaluation of cocoa paste exports
corresponds to IFF risks due to the presence of many multinational companies (MNCs) in the
industry. The results for overvaluation are quite negligible, especially using the market price filters as
benchmarks.
Our findings provide preliminary evidence and corroborate existing literature that IFFs via
commodity trading are a concern for Ghana. There is therefore an urgent need for regulatory
reforms and capacity development to monitor and block these IFFs. The Government of Ghana has
already taken some measures, such as the setting up of a Transfer Pricing Unit within the Revenue
Authority as well as an Anti-money Laundering Department, to counter these risks.
ABBREVIATIONS
AfDB African Development Bank
ASM Artisanal and Small-Scale Mining
CHED Cocoa Health and Extension Division
CMC Cocoa Marketing Company
CRIG Cocoa Research Institute of Ghana
CIF Cost Insurance Freight
FOB Free On Board
GSA Geological Survey Authority
GRA Ghana Revenue Authority
GFI Global Financial Integrity
GHEITI Ghana Extractive Industries Transparency Initiative
HS Code Harmonized Commodity Description and Coding System
IFFs Illicit Financial Flows
ICCO International Cocoa Association
LSM Large Scale Mining
LBCs Licensed Buying Companies
LBMA London Bullion Market Association
MoFEP Ministry of Finance and Economic Planning
NY New York
OASL Office of the Administrator of Stool Lands
ODA Official Development Assistance
OSSC One Stop Service Centre
OECD Organization for Economic Co-operation and Development
PMMC Precious Minerals Marketing Company
QCC Quality Control Company
REER Real Effective Exchange Rate
SPD Seed Production Division
SDGs Sustainable Development Goals
UNECA United Nations Economic Commission for Africa
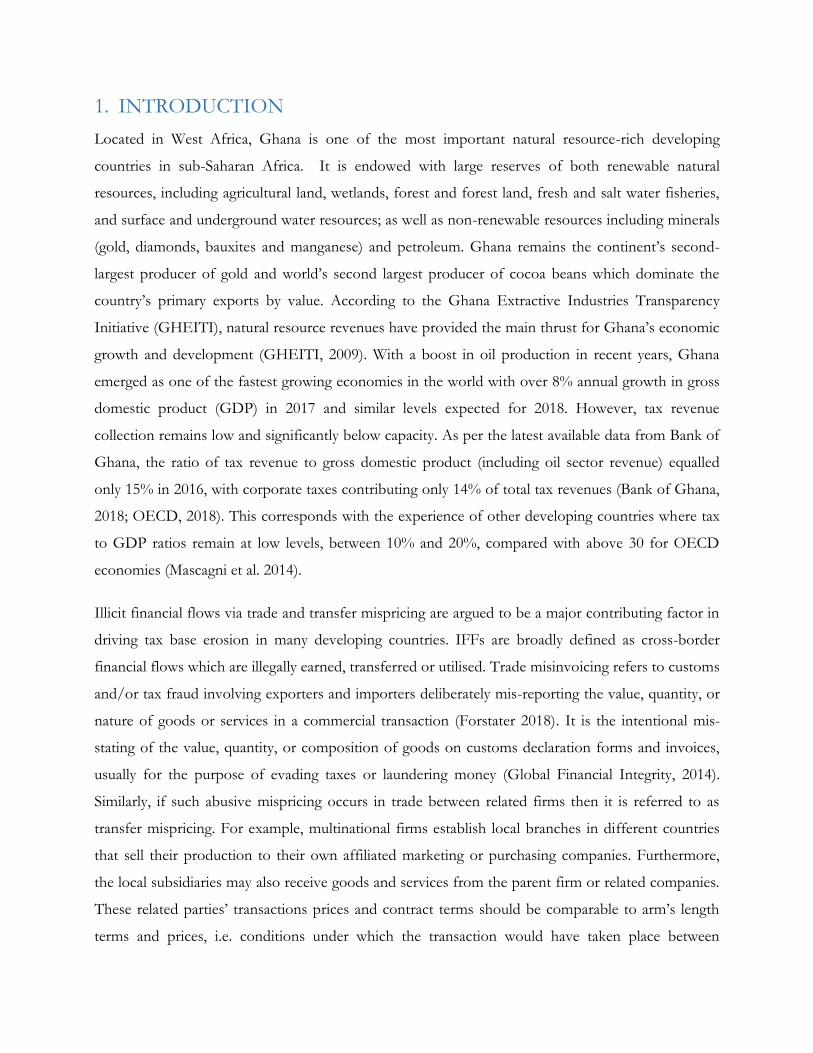
1. INTRODUCTION
Located in West Africa, Ghana is one of the most important natural resource-rich developing
countries in sub-Saharan Africa. It is endowed with large reserves of both renewable natural
resources, including agricultural land, wetlands, forest and forest land, fresh and salt water fisheries,
and surface and underground water resources; as well as non-renewable resources including minerals
(gold, diamonds, bauxites and manganese) and petroleum. Ghana remains the continent’s second-
largest producer of gold and world’s second largest producer of cocoa beans which dominate the
country’s primary exports by value. According to the Ghana Extractive Industries Transparency
Initiative (GHEITI), natural resource revenues have provided the main thrust for Ghana’s economic
growth and development (GHEITI, 2009). With a boost in oil production in recent years, Ghana
emerged as one of the fastest growing economies in the world with over 8% annual growth in gross
domestic product (GDP) in 2017 and similar levels expected for 2018. However, tax revenue
collection remains low and significantly below capacity. As per the latest available data from Bank of
Ghana, the ratio of tax revenue to gross domestic product (including oil sector revenue) equalled
only 15% in 2016, with corporate taxes contributing only 14% of total tax revenues (Bank of Ghana,
2018; OECD, 2018). This corresponds with the experience of other developing countries where tax
to GDP ratios remain at low levels, between 10% and 20%, compared with above 30 for OECD
economies (Mascagni et al. 2014).
Illicit financial flows via trade and transfer mispricing are argued to be a major contributing factor in
driving tax base erosion in many developing countries. IFFs are broadly defined as cross-border
financial flows which are illegally earned, transferred or utilised. Trade misinvoicing refers to customs
and/or tax fraud involving exporters and importers deliberately mis-reporting the value, quantity, or
nature of goods or services in a commercial transaction (Forstater 2018). It is the intentional mis-
stating of the value, quantity, or composition of goods on customs declaration forms and invoices,
usually for the purpose of evading taxes or laundering money (Global Financial Integrity, 2014).
Similarly, if such abusive mispricing occurs in trade between related firms then it is referred to as
transfer mispricing. For example, multinational firms establish local branches in different countries
that sell their production to their own affiliated marketing or purchasing companies. Furthermore,
the local subsidiaries may also receive goods and services from the parent firm or related companies.
These related parties’ transactions prices and contract terms should be comparable to arm’s length
terms and prices, i.e. conditions under which the transaction would have taken place between
unrelated parties. However, transfer mispricing occurs when related parties distort the price of a
transaction outside an arm’s length range, usually with the objective of reducing the multinational
firm’s overall tax bill. In the natural resource sector, mispricing of transactions between related
parties is therefore one of the main transfer pricing risks related to international commodity trade
(Readhead, 2018).
However, this phenomenon remains relatively under-analysed in Ghana. Existing evidence is limited
to the large asymmetries observed in trade statistics between Ghana and its trading partners. In
Ghana, some estimates, by Global Financial Integrity (GFI, 2014) and Africa Centre for Energy
Policy (ACEP, 2015), based on aggregate, macroeconomic data suggest that more than 1 billion US
dollars (USD) is lost annually through trade misinvoicing. However, the validity of the underlying
methodology has been heavily criticized due to significant data and methodological limitation,
therefore there is an urgent need for better, more informed estimates. Reducing IFFs could make
more resources available for financing the Sustainable Development Goals (SDGs). This is
particularly important because most of the funding for SDGs is expected to come from domestic
resources. Indeed, one of the SDGs (goal 16:4) is to significantly reduce illicit financial flows,
strengthen the recovery and return of stolen assets and combat all forms of organised crimes by 2030
(SDGs, 2015).
In recent years, the policy focus on IFFs and related practices has increased significantly in Ghana.
With the incumbent government’s aim of steering Ghana out of an Aid-dependency era to one that
is dependent on its internal resources, there is thus the need to examine the fiscal systems in place to
prescribe appropriate policies to reduce IFFs in Ghana.1 Indeed, it has been globally acknowledged
that emphasis has to be laid on the need to build strong domestic fiscal and financial systems as well
as improve on domestic revenue mobilisation for financing the development agenda of African
countries in a sustainable manner (AfDB, OECD Development Centre, and UNECA 2010). This
has become even more critical as traditional sources of development finance, such as Official
Development Assistance (ODA), are dwindling following the global financial crisis and other
challenges facing developed countries. For instance, aid from OECD countries decreased by 2.7% in
2011 compared to 2010 because of the crisis. Bilateral aid to sub-Saharan Africa also fell by 0.9% (28
billion USD in real terms) whilst bilateral ODA to the group of Least Developed Countries fell by
8.9% in real terms to USD 27.7 billion during the same period (Balma et al. 2018).
1 This government is led by President Nana Akuffo Addo, who launched the “Ghana Beyond Aid” agenda.
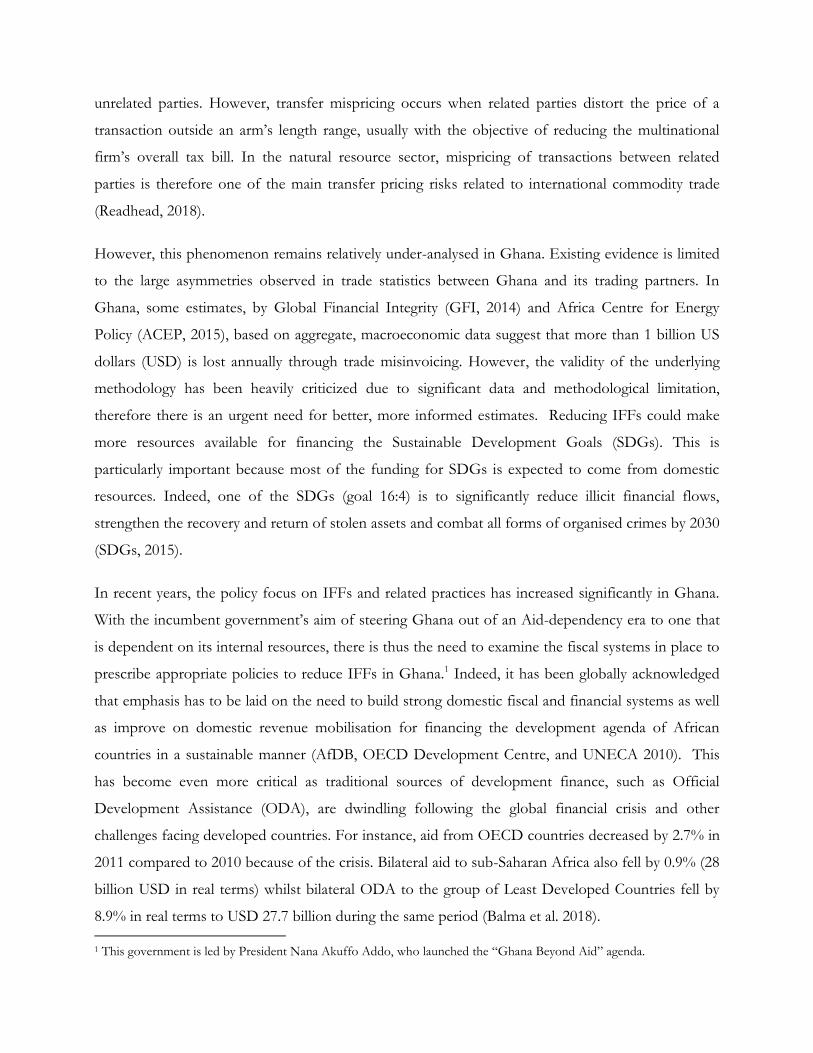
Using Ghana’s foremost trading commodities, gold and cocoa, this paper estimates the magnitude of
abnormal pricing (henceforth, AP) in Ghana’s exports.2 In addition, the paper analyses the drivers
underpinning the AP observed for gold and cocoa. Traditionally, there are two broad motivations for
AP, namely, high customs duties (de Boyrie et al., 2007; Boyce and Ndikumana, 2001; Beja et al.,
2005) and capital flight (Schulze, 1994). When firms pay high customs duty rates or Value-Added
Tax (VAT) on international trade, or are subject to quantitative restrictions, they have a reason to
understate the true value of imports and exports. Similarly, AP is viewed as a method for capital
flight, which is because of fears of expropriation in interplay between unsound economic policy and
political instability (Schulze, 1994). Indeed, it has been argued that AP is the main channel for IFFs,
including capital flight (Kar, 2014; Kar and Cartwright, 2008; Kar and Freitas, 2012). Therefore, a
reliable estimation of the possible tax and revenue losses due to AP could be indicative of the
magnitude of IFFs in a country of interest. This is a major motivation for this paper’s focus on AP in
the context of gold and cocoa for Ghana. Besides, unlike the partner country trade statistics used by
the GFI for estimating the magnitude of IFFs, this paper adopts the price filter methods; utilising
both the market price arm’s length and the interquartile price range filters.3
Developed by Simon Pak and his co-authors in the 1990s, the price filter analysis method which
addresses some of the challenges posed by the partner country trade statistics method makes use of
commodity prices to estimate arm’s length price range within which trade prices are considered
normal; but above or below which trading is evaluated as abnormally priced. AP occurs when the
values of transactions declared at customs agencies are different from estimated arm’s-length values
of the transactions (Hong & Pak, 2017). Exports are described as under-valued when trade values fall
below a lower-set boundary, and over-priced when values are above an upper-set boundary.
This study’s main findings are as follows. The per unit export values for gold especially show a trend
consistent with the daily market prices chosen as reference. Hence compared with the interquartile
range filter, AP estimates using market reference prices with selected filters as benchmarks are this
study’s preference estimates for undervaluation and overvaluation. We observe that most of the per
unit prices of gold are found below the market reference prices, albeit showing similar undulating
2 Aside petroleum oil. 3 The Partner Country Trade method is based on the principle of double-counting in international trade statistics, whereby the exporting country’s statistics are compared to the importing partner’s corresponding statistics (Bhagwati, 1964; 1967; 1985). This method has been heavily criticised and the main reasons are provided in the methodology section of the paper.
pattern within the study period 2011 to 2017. Upon setting our 30% arm’s length price range from
the market reference prices, we find that gold exports are undervalued by roughly 11% of the total
value of gold exported, which is 35.6 billion USD. The undervalued amount thus constitutes 3.8
billion USD. Five of the countries Ghana trades with and consequently lose some of the money to
are South Africa (999.4 million USD), Switzerland (753.6 million USD), India (91.7 million USD),
United Arab Emirates (25.5 million USD) and the Netherlands (14.1 million USD).
Unlike gold, the per unit prices of cocoa beans and cocoa paste do not show clear response to
prevailing spot market prices for the study period. For superior quality cocoa beans exported, the per
unit prices mainly fluctuated between 2 and 4 USD per kilogramme, whilst the per unit prices of
cocoa paste show a near linear trend just below 4 USD per kilogramme (refer to relevant figures in
Section 5). These price rigidities observed in the marketing of cocoa and its products makes the use
of contemporaneous market prices as reference for AP estimates not so suitable. A possible
explanation to the per unit prices of cocoa beans’ lack of response to the market reference prices is
the sale of cocoa beans in the futures markets via forward contracts by COCOBOD. Although
endogenously determined due to the use of products’ own declared export prices, the use of
interquartile range in estimating AP is more appropriate. Based on our preferred interquartile range
filters, we estimate that 2.7% of the 12.6 billion USD worth of cocoa beans exported was
undervalued; that is found below the 25th percentile of the per unit price distribution of cocoa beans.
Similarly, we estimate that 7.5% of the total export of cocoa paste (1.8 billion USD) was
undervalued. The relatively high undervaluation of cocoa paste exports could be due to the presence
of many multinational companies (MNCs) in the industry.
Overall, the study finds overvaluation in Ghana somewhat negligible based on the market reference
price filters. For example, overvaluation of gold exports is less than 0.5% of its total export value of
35.6 billion USD. In relation to cocoa beans and cocoa paste, the overvalued estimates are 2% and
3.8%, respectively, of the total value of corresponding products exported; using the interquartile
range filters. These imply that 2% of cocoa beans and 3.8% of cocoa paste are valued above the 75th
percentile of their per unit price distributions.
Similar to related studies on the topic, the findings here suggest that estimates of AP differ
significantly depending on the method used4. Method notwithstanding, this study suggests Ghana
loses significant potential revenues to partner countries through undervaluation of its exported
commodities. There is therefore an urgent need for government to put in more effort in providing
expert knowledge and skills to track, monitor and block the sources of these IFFs. Although the
government of Ghana has already put in measures, such as the setting up of a transfer pricing unit at
GRA as well as an anti-money laundering department, constant skills development of personnel in
these units needs to be ensured for successful outcomes.
2. NATURAL RESOURCE SECTOR IN GHANA
2.1. Cocoa Sector and Risks for IFFs
Cocoa is one of Ghana’s main exports commodities. The industry provides employment for over
three million farmers, employees of haulage companies, licensed buying companies and others along
the cocoa value chain. Cocoa contributed about 2.3% of Ghana’s real GDP over the period 2010 –
2017, and about 9.9% of mean agricultural GDP over the same period (Table 1). Agricultural exports
contribute between 29% (including oil) and 33% (excluding oil) to Ghana’s foreign exchange
earnings. Cocoa is also by far the most important agricultural export commodity, contributing about
80.7% of average agricultural export earnings between 2014 and 2017 (ISSER, 2018).
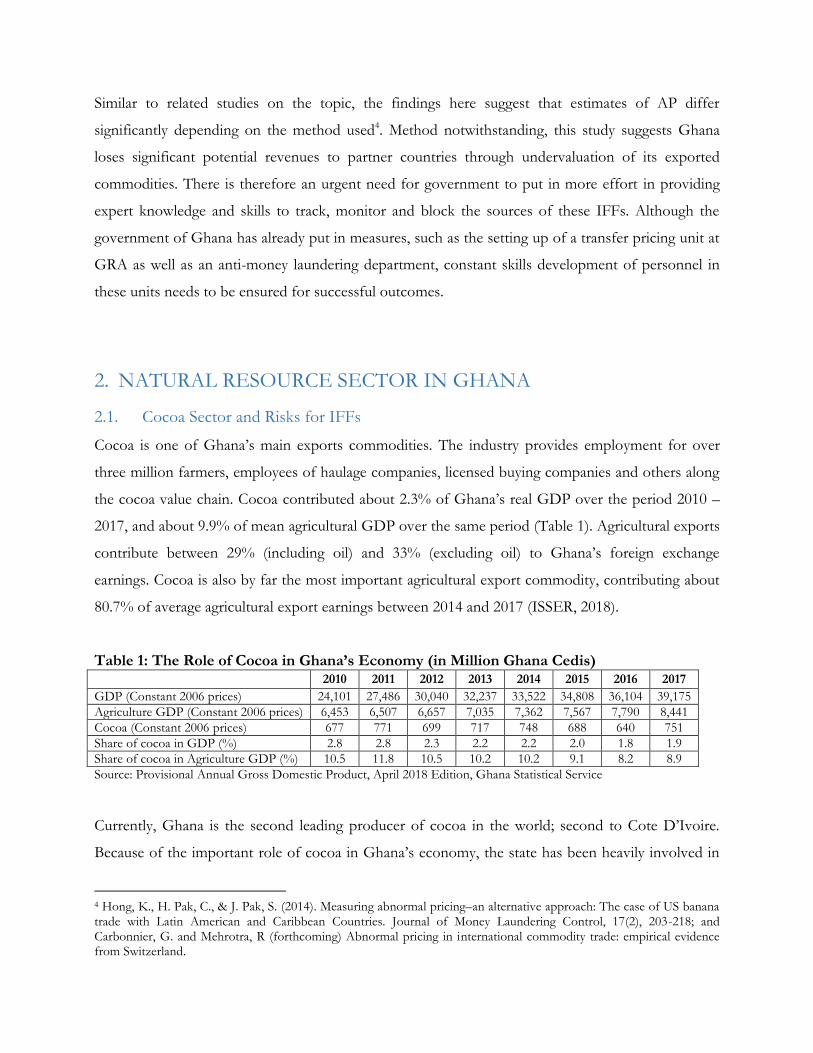
Table 1: The Role of Cocoa in Ghana’s Economy (in Million Ghana Cedis) 2010 2011 2012 2013 2014 2015 2016 2017
GDP (Constant 2006 prices) 24,101 27,486 30,040 32,237 33,522 34,808 36,104 39,175
Agriculture GDP (Constant 2006 prices) 6,453 6,507 6,657 7,035 7,362 7,567 7,790 8,441
Cocoa (Constant 2006 prices) 677 771 699 717 748 688 640 751
Share of cocoa in GDP (%) 2.8 2.8 2.3 2.2 2.2 2.0 1.8 1.9
Share of cocoa in Agriculture GDP (%) 10.5 11.8 10.5 10.2 10.2 9.1 8.2 8.9
Source: Provisional Annual Gross Domestic Product, April 2018 Edition, Ghana Statistical Service
Currently, Ghana is the second leading producer of cocoa in the world; second to Cote D’Ivoire.
Because of the important role of cocoa in Ghana’s economy, the state has been heavily involved in
4 Hong, K., H. Pak, C., & J. Pak, S. (2014). Measuring abnormal pricing–an alternative approach: The case of US banana trade with Latin American and Caribbean Countries. Journal of Money Laundering Control, 17(2), 203-218; and Carbonnier, G. and Mehrotra, R (forthcoming) Abnormal pricing in international commodity trade: empirical evidence from Switzerland.
the entire domestic value chain, from production to export. However, cocoa production is primarily
the preserve of smallholder farmers. Annual production is close to one million metric tonnes. The
Seed Production Division (SPD), the Cocoa Research Institute of Ghana (CRIG) and other input
suppliers assist farmers with seeds and other inputs for cocoa production.
After production, cocoa beans are sold to licensed buying companies following inspection by the
Quality Control Unit of the Ghana COCOBOD. The beans are then transported to the coast where
most of the cocoa beans are exported by the Cocoa Marketing Company. Some of the beans are also
sold to cocoa processing companies that make other products such as cocoa paste out of them for
export. Chocolate and other confectionary items are also made for sale on the local market. The
sector is regulated by COCOBOD, the Ministry of Finance, the Ministry of Agriculture and the
Ministry of Lands and Natural Resources.
Risks for IFFs in Ghana’s cocoa sector are expected in the area of abusive transfer pricing by the
cocoa processing companies who have subsidiaries in Ghana. In addition, there is a lack of
monitoring and data-collection capacity by regulatory agencies to monitor IFF risks in the sector.
2.2. Gold Sector and Risks for IFFs
Gold is one of the many minerals mined in Ghana. Ghana is the second largest producer of gold in
Africa, second to South Africa, and the tenth largest producer in the world. In 2016, gold production
in Ghana reached 4.2million ounces (2016 Annual Report, Mineral’s Commission). Gold is mined in
mainly four regions of Ghana through Large-Scale Mining (LSM) and Artisanal and Small-Scale
Mining (ASM).
The sector is regulated by a number of bodies which increases the scope for IFFs through
corruption. The regulators include the Ministry for Lands and Natural Resources, the Ministry for
Environment, Science and Technology, and the Ministry of Finance. Other agencies which also have
an oversight role include the Minerals Commission, the Lands Commission, the Office of the
Administrator of Stool Lands (OASL), the Environmental Protection Agency, the Bank of Ghana,
the Ghana Revenue Authority, the One Stop Service Centre (OSSC), the Geological Survey
Authority (GSA) and the Precious Minerals Marketing Company. Others include the traditional
authorities in charge of land, the town and country planning unit, the district mining committees and
the security services. Many of the LSM companies are members of the Ghana Chamber of Mines.
There is an association for the small-scale miners known as the Small-Scale Miners Association.
Mined amalgam gold is smelted to obtain dore bars that can be up to 23 carats; just below the 24
carats for which prices are usually quoted for global trading. However, 23 carats gold from Ghana is
relatively small and so far, been mined only in one of the villages in the Eastern region. Ghana does
not operate a commercial refinery that would produce and certify gold bars of very high purity such
as bullion bars as technically defined. After mining, gold is transported to Accra for assaying by
PMMC. Most of the gold is exported while the rest are mostly made into jewellery and sold on the
local market.
The main risks for IFFs in Ghana’s gold sector arise mainly in the area of export under-invoicing
where multinational companies mining gold in Ghana may have an incentive to undervalue their
exports with the aim of under declaring the value of exports and thereby have lower tax liability for
the government of Ghana. During data collection, we realised that the data capture processes of the
customs division of the Ghana Revenue Authority where officials pays closer attention to the values
of import commodities than exports because most export commodities are duty free. This situation
is worrying because resource rich countries such as Ghana provide many incentives to multinational
companies for the sake of increasing FDI, which most developing country governments consider
critical for growth and development.
3. EMPIRICAL METHODOLOGIES
There are two main methods for estimating trade mispricing – the Partner Country Trade Gap
Method and the Price Filter Method. Each method has its pros and cons, some of which are
discussed to guide the utilisation of this study for policy and other decision-making purposes. With
such in mind, this study makes use of the Price Filter Method in the estimation of abnormal pricing
through trade in Ghana. The method has two techniques namely, the interquartile price filter; and
the arm’s length price filter. The methods are briefly discussed here as follows.
3.1. Partner-Country Trade Gap Method
The Partner Country Trade Gap (PCTG) method is the most widely used approach for estimating
trade misinvoicing. It was first developed by Bhagwati in 1964 and is based on the principle of
double-counting in international trade statistics. It uses mirror statistics whereby one country’s
exports are another country’s imports and as such should balance out if there is no misinvoicing.
However, there have been several criticisms of the PCTG approach, which include the following:
1. Incorrect to assume that trade statistics in advanced economies exhibit no misinvoicing: One
main assumption of Partner Country mirror trade statistics is that it assumes advanced
economies’ trade statistics as arms-length values with which to compare developing countries’
trade statistics. However, a 2017 study by Hong and Pak using both aggregate trade statistics
from the IMF DOTS database and transaction-level trade data from Customs agencies show that
a significant degree of trade misinvoicing occurs in advanced economies as well.
2. Unobserved trade costs: Typically, import transactions are valued on Cost, Insurance and Freight
(CIF) basis. This has to be converted to Free-On-Board (FOB) values used for exports before
any trade gaps can be calculated. Unfortunately, because data on the transaction cost of trade is
generally not recorded, a 10% rule-of-thumb adjustment is used for these conversions. The rule
of thumb stems from aggregate differences between global export and import values. This means
that a standard 10% estimate of trade costs is limited in reliably converting bilateral trade values
across all commodities which have varying shipping and insurance costs.
3. Use of aggregate trade statistics: The bulk of the related literature in the area has focused on
calculating aggregate trade gaps, using total annual exports and imports figures. However, in
many of the cases, bilateral data between trading partners may not be available for all goods and
commodities being traded, leading to the generation of highly misleading estimates of trade gaps.
In addition, the use of aggregate trade gaps can mask under or over-invoicing in particular
commodities which cancel out when aggregated.
4. Data unavailability for certain countries, years, or commodities: Consistent time-series of bilateral
trade statistics for all commodities is not generally available for all countries engaged in
international trade. This can lead to misleading estimates of trade gaps. For instance, there is
missing data on cocoa exports from Ghana for several years in the International UN Comtrade
database.
5. Export and import transactions can be recorded in different years: Subject to the mode of
transportation and the distance between trading points, international trade can take significant
time to complete. This could lead to trade partners recording the same transaction in different
years, yet trade gaps are computed using statistics for one year.
6. Entrepôt trade: For many commodities, the source and destination countries recorded actually
reflects reports from intermediate ports where shipments are kept before they are finally shipped
to their ultimate destinations. Also, the chance to benefit from arbitrage opportunities that arise
when market prices fluctuate can lead international commodity trading firms to decide to divert
shipments in transit to storage warehouses. There is double-counting when exports and imports
passing through entrepôt ports are reported by both transit countries and the exporting-
importing partners. For example, some exporters from neighbouring countries such as Burkina
Faso bring their gold to Ghana for assaying before export and this could lead to the entrepôt
trade problem.
7. Exchange rates used for currency conversion: International trade transactions are conducted
either in vehicle currencies such as the US dollar or in local currencies. As a result, if different
exchange rates are used by trading partners to convert trade values, there could be gaps in their
mirror trade statistics. In addition, some developing countries maintain multiple exchange rate
regimes, which increases the probability of such errors.
8. Country idiosyncrasies: Estimations of trade gaps may be affected by some countries deciding
not to report bilateral trade flows of particular goods for particular years. For example, although
Switzerland is a major importer of gold, it did not report its international trade in unwrought
gold until 2012
3.2. Price Filter Analysis Method
As a result of the above shortcomings, alternative approaches such as the price filter analysis have
been developed for estimating AP in international trade (eg. Pak & Zdanowicz, 1994; and Hong et
al., 2014). Price filter analysis relies on transaction level trade micro-data on product type, quantity
and unit value (based on the Harmonized Commodity Description and Coding System (HS code).5
There are two main approaches to price filter analysis: Inter-quartile range filter and Arm’s length
price filter.
5 This is used internationally for classifying commodities. The classifications are usually up to the 6-digit level where the first two digits show the chapter of the HS code the specific commodity falls under. The third and fourth digits relate to the headings under the specified chapter and provide further details about the class of commodity. The fifth and sixth digits denote the sub-divisions of the heading, and then the individual countries and regional bodies are allowed to go up to the 10-digit level to cater for their domestic tariff arrangements as well as provide further clarity for their classifications. The HS codes are revised regularly, and sometimes, some are dropped altogether. For example, the described gold bullion in the data given by Ghana Customs has two different HS codes, namely, 7108.13.1000 and 7108.13.0010. The first is the current one being used now, and the second code is an older version that is not in use anymore.
3.2.1. Interquartile Price Filter Method
The inter-quartile price filter assumes that unit prices within the 25th and 75th percentile of the
observed distribution of unit prices for a specific commodity denotes the arm’s-length price range.
Any transaction that falls above or below this price range is categorised as abnormally priced.
3.2.2. Arm’s Length Price Filter Method
This framework compares actual transaction level unit prices for a particular commodity with their
contemporaneous free-market price, plus or minus a reasonable filter to account for price volatility,
contract variations between firms, commodity types, and various sector-specific issues. Transactions
which deviate significantly from arm’s length prices beyond what can be explained by reasonable
price volatility are then determined to be abnormally priced. One advantage of the free market price
filter approach is that researchers do not need to estimate arm’s length price at all, as the free market
price is readily available. In addition, the free market price filters have some other advantages over
the interquartile price filters; such as the following:
o Unlike the interquartile price filter, the free market price filter accounts for variation in
monthly commodity prices.
o The free market price filter is observed independently from the declared import values, while
the interquartile prices are estimated based on the declared import values. Therefore, the free
market price filter is not affected by related party transaction records in the import and
export database.
To apply this approach, however, requires free market prices, which may not be readily available,
especially when there is no established commodity market (Hong et al, 2014).
4. DATA SOURCES
4.1. Gold and Cocoa Exports: 2011 – 2017
Ghana Revenue Authority (GRA), Customs Division, provided the transaction-level gold and cocoa
export data for this study. The recorded transactions cover trading activities from 2011 – 2017. The
data also contains the weight of each exported commodity, detailed description of the commodity
type, and the receiving country of the exported commodity. The weight is described as net mass,
which is the weight of the commodity exported without packaging in the system unit of the HS
classification. The assigned unit for weight in the data is kilogramme (kg).
Using a 10 – digit HS code, Ghana Customs recorded 7 types of gold exported within the stipulated
years. This study however examines a combination of 2 of these – gold bullion (7108.13.1000) and
unwrought gold, non-monetary including gold plated with platinum (7108.12.0000). These were
chosen primarily because of their relatively high trade volumes and values. We also realised, upon
careful examinations of the gold data and discussions with Ghana Customs, Ghana Minerals’
Commission, Precious Minerals’ Marketing Company, and the Ghana Chamber of Mines, that gold
bullion, as described in Ghana, is any gold smelted into bars and does not necessarily correspond
with the technical description of gold bullion. Therefore, the term gold bullion as used in this study
is flimsy due to this mis-classifications. Indeed, the goods description under both gold bullion and
unwrought gold are the same and interviews with the above-named institutions confirmed the
similarities. These institutions reiterated that all the gold mined in Ghana are only semi-manufactured
or processed for exports or local use in the form of jewellery, dental and cultural ornaments.
Thus, due to the mis-classifications of gold bullion and unwrought gold as well as their similarities in
inter alia goods descriptions, this study combines the two in its analyses as semi-manufactured or
processed gold. Henceforth in the study, this would simply be referred to as gold.
Similarly, Ghana Customs used a 10 – digit HS code to classify the nine types of cocoa exported
within the study period. Two of these types – cocoa beans, superior quality raw beans
(1801.00.1100), and cocoa paste, wholly or partly defatted (1803.20.0000) are examined in this study.
Consequently, three of the export commodities from Ghana are examined for AP. The summary
statistics of these commodities are presented in Appendix Table A1.
4.2. Free Market Commodity Price Data: 2011–2017
Daily market price data is from Thomson Reuters Datastream. This database includes global
financial and macroeconomic information. The commodity exchanges’ data used as benchmarks for
the analyses are: the London Bullion Market Association (LBMA) for Gold Bullion LBM (USD/troy
ounce), Ghanaian Cocoa Ex Dock NY Prices for the assessment of the superior quality raw cocoa
beans (USD/metric ton), the African Cocoa Butter US Del Prices for the assessment of wholly and
partially defatted cocoa paste (USD/metric ton), and the International Cocoa Organisation (ICCO) –
Cocoa-ICCO Daily Prices (USD/metric ton) for comparisons of both types of cocoa.
5. ESTIMATES OF ABNORMAL PRICING
Using price filter methods, this section presents annual and total estimates of AP for the selected
gold and cocoa commodity exports. The estimations based on the free market price filter and the
inter quartile price filter methods utilise transaction-level exports data acquired from Ghana
Customs. For the free market price filter, declared export prices are compared with existing free
market prices. Unit prices (in US dollars per kilogramme) are calculated by dividing the export values
given in the data of the selected commodities by the weight exported.6 The unit prices are then
compared with the daily market prices declared for each commodity. Magnitudes of AP are
subsequently calculated using values that fall outside the estimated arm’s length price range. Those
that fall below are labelled under-valued amounts, and those that fall above are labelled over-valued
amounts of the exported commodities.
With regard to the calculation of the interquartile price range filter, the range between the 25th and
75th percentile of the unit prices distribution of reported export values is observed as the arm’s
length price range. Thus, the over-priced amounts are the values declared above the upper-quartile
price range whilst the under-priced are those declared below the lower quartile price range. Although
this method is better than the partner country analysis, the disadvantages are that the arm’s length
price range is endogenously determined, and it lacks the ability to consider product heterogeneity
amongst others. Hence, although this study calculates both the market price filter and the
interquartile range APs, the former is preferred especially in the case of gold estimates where trade
prices fluctuates more with its market reference prices. Unlike gold, the trade prices of cocoa beans
and cocoa paste do not fluctuate much with their market reference prices due to their contract and
market peculiarities including, inter alia, futures trading, hedging as well as government policies. Also,
because the analyses presented in this paper are based on export trade between Ghana and various
partners, the AP estimates are general rather than specific to a particular trading partner.
6 This is recorded as Net Mass in the data and the unit is kilogrammes.
5.1. Gold (Semi-Manufactured)
Gold mines in Ghana usually produce gold dore bars of about 80% purity, which are sent to
refineries abroad for further purification or sold locally for jewellery making and as savings and
investments. Our interviews with industry experts show that although some gold exports from
Ghana are described as bullion gold, what the country actually exports are dore gold of between 80 –
90% purity. The remaining elements are silver, copper and other trace metals.
Firm level transactions data show that Ghana exported gold to 45 countries between 2011 and 2017.
Upon cleaning the data to remove errors such as the listing of diamonds, gold dust, tar, soil samples,
and silver as well as extremely large per unit prices outliers, 20,933 transaction level observations
were left for the analysis; from an original 21,261 observations.
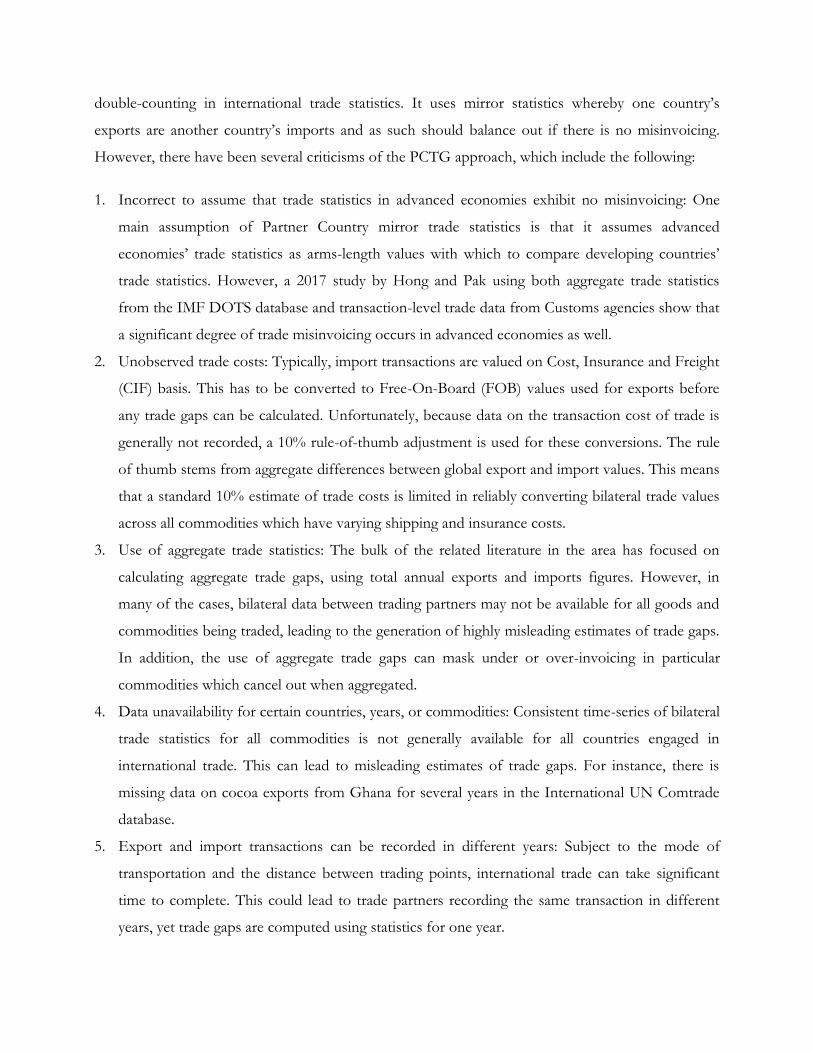
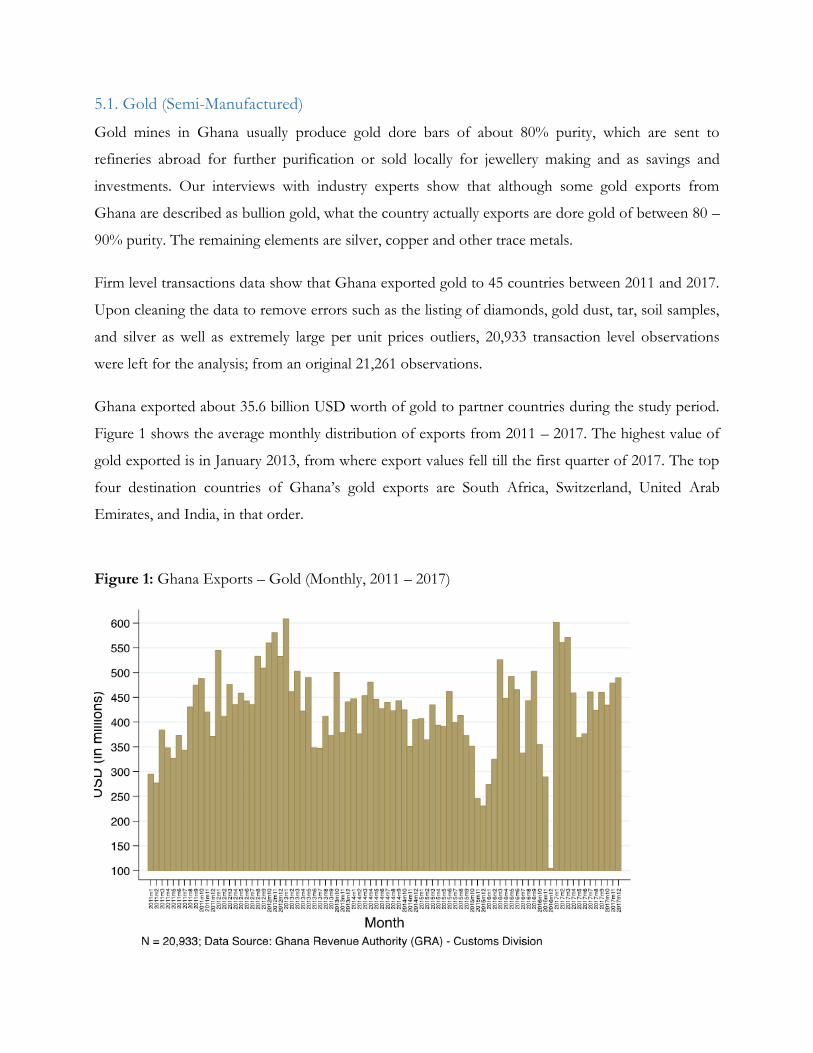
Ghana exported about 35.6 billion USD worth of gold to partner countries during the study period.
Figure 1 shows the average monthly distribution of exports from 2011 – 2017. The highest value of
gold exported is in January 2013, from where export values fell till the first quarter of 2017. The top
four destination countries of Ghana’s gold exports are South Africa, Switzerland, United Arab
Emirates, and India, in that order.
Figure 1: Ghana Exports – Gold (Monthly, 2011 – 2017)
Arm’s Length Estimations
Declared FOB price vs free market price
In estimating the magnitude of AP, this study first compares the declared export prices (FOB) with
the free market prices for gold bullion by the LBMA. Furthermore, an arm’s length price range is
determined by setting boundaries around the free market prices. That is, instead of making the free
market prices the sole arm’s length prices, we also give allowance for varied contract terms, market
and country transactions idiosyncrasies. Any declared export values falling within the arm’s length
range are considered normal, and those out of the range are considered abnormal. In setting the
boundaries (also known as filters), the following assumptions are made:
1. Product Heterogeneity (-): Since the gold bullion and unwrought gold in the GRA data refers to
semi-manufactured gold dore bars of 80 – 90% purity, we do not expect the export prices to be
same as the published daily export prices by LBMA used as benchmarks. We therefore assume
20% downward deviations from the benchmark prices.
2. Market conditions and contract terms (+/-): Varied contract terms could exist between trading
companies over a set period. To account for such as well as country idiosyncrasies, interest and
exchange rate volatilities, 10% is added to the filters.
3. Transport and insurance costs (+): Although these are present in all transactions undertaken
between trading partners, their impacts on the gold trade are quite negligible. This is particularly
so because the higher the volume of gold exported, the lower the transport and insurance costs
relative to the value of gold.7
For the reasons above, a 30% price filter is set around the benchmark (free market prices for gold
bullion by LBMA). This serves as the arm’s length price, deviations from which would indicate
whether Ghana’s gold was under – priced or over – priced between 2011 – 2017. The filters are
varied by 10 percent points below and above the 30% (i.e., 20% and 40%) for the purpose of
sensitivity analysis. The AP estimates based on the 20% and 40% filters are presented in Appendix B.
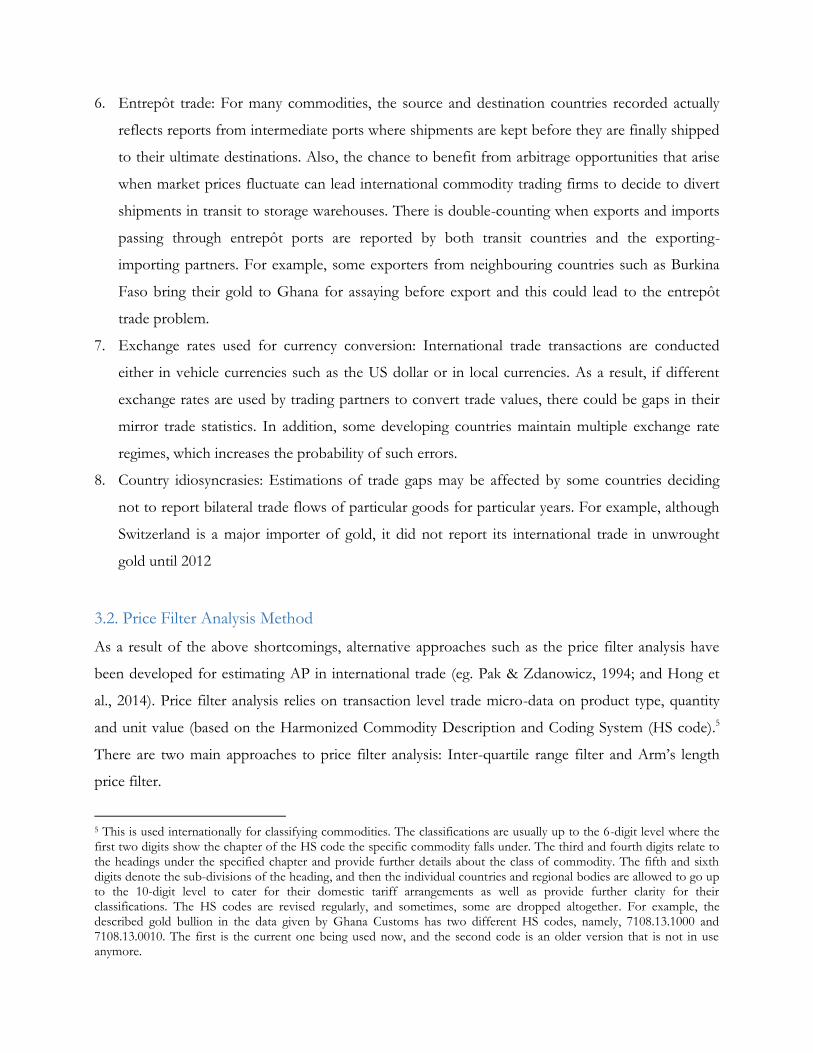
Figure 2 shows trends of the per unit prices of gold vis-a-vis the benchmark prices. Based solely on
the free market prices for gold bullion, most of the declared export prices fall below the free market
prices. Even so, this does not necessarily suggest that all these transactions are under-valued, hence
7 This information was gathered from two gold exporting agencies and a conversation with a contact at the Minerals’ Commission.
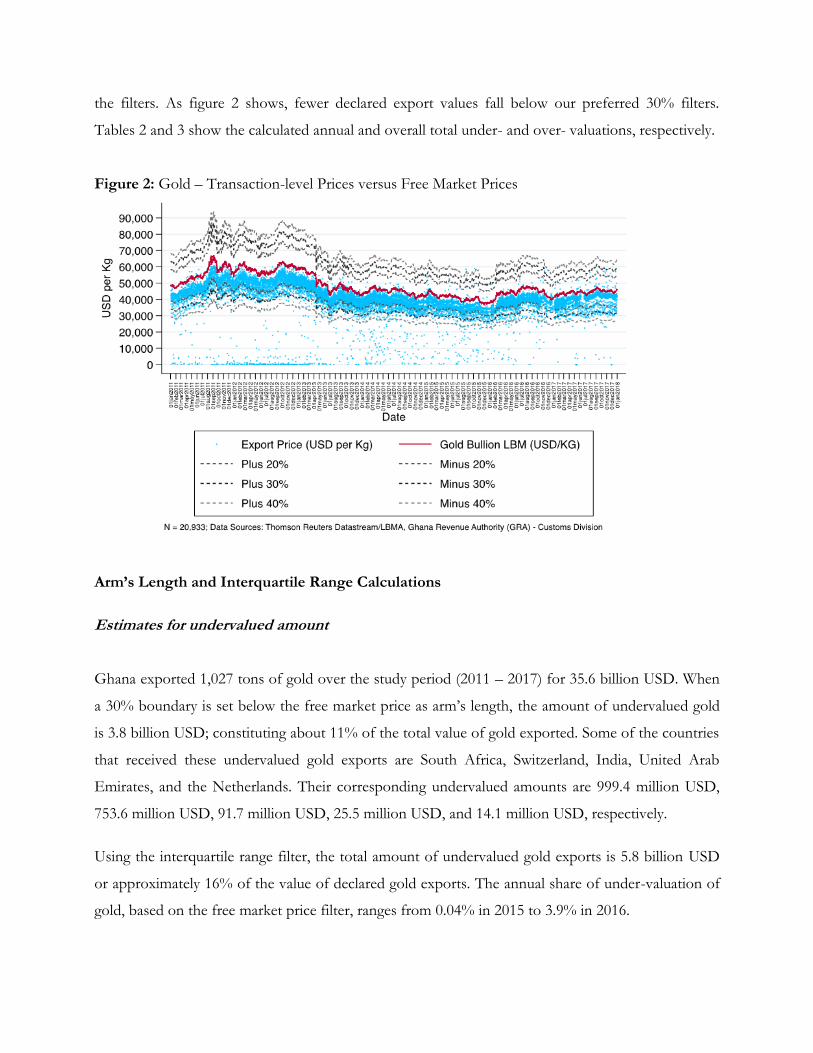
the filters. As figure 2 shows, fewer declared export values fall below our preferred 30% filters.
Tables 2 and 3 show the calculated annual and overall total under- and over- valuations, respectively.
Figure 2: Gold – Transaction-level Prices versus Free Market Prices
Arm’s Length and Interquartile Range Calculations
Estimates for undervalued amount
Ghana exported 1,027 tons of gold over the study period (2011 – 2017) for 35.6 billion USD. When
a 30% boundary is set below the free market price as arm’s length, the amount of undervalued gold
is 3.8 billion USD; constituting about 11% of the total value of gold exported. Some of the countries
that received these undervalued gold exports are South Africa, Switzerland, India, United Arab
Emirates, and the Netherlands. Their corresponding undervalued amounts are 999.4 million USD,
753.6 million USD, 91.7 million USD, 25.5 million USD, and 14.1 million USD, respectively.
Using the interquartile range filter, the total amount of undervalued gold exports is 5.8 billion USD
or approximately 16% of the value of declared gold exports. The annual share of under-valuation of
gold, based on the free market price filter, ranges from 0.04% in 2015 to 3.9% in 2016.
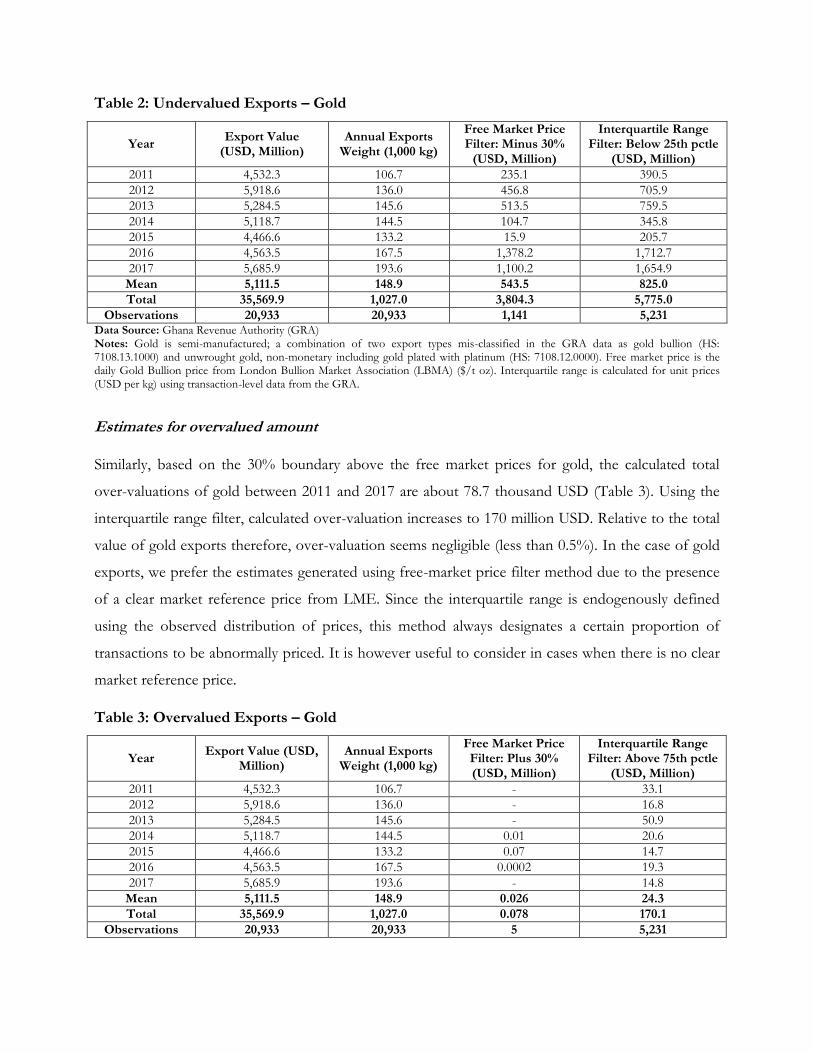
Table 2: Undervalued Exports – Gold
Year Export Value
(USD, Million) Annual Exports
Weight (1,000 kg)
Free Market Price Filter: Minus 30%
(USD, Million)
Interquartile Range Filter: Below 25th pctle
(USD, Million)
2011 4,532.3 106.7 235.1 390.5
2012 5,918.6 136.0 456.8 705.9
2013 5,284.5 145.6 513.5 759.5
2014 5,118.7 144.5 104.7 345.8
2015 4,466.6 133.2 15.9 205.7
2016 4,563.5 167.5 1,378.2 1,712.7
2017 5,685.9 193.6 1,100.2 1,654.9
Mean 5,111.5 148.9 543.5 825.0
Total 35,569.9 1,027.0 3,804.3 5,775.0
Observations 20,933 20,933 1,141 5,231 Data Source: Ghana Revenue Authority (GRA) Notes: Gold is semi-manufactured; a combination of two export types mis-classified in the GRA data as gold bullion (HS: 7108.13.1000) and unwrought gold, non-monetary including gold plated with platinum (HS: 7108.12.0000). Free market price is the daily Gold Bullion price from London Bullion Market Association (LBMA) ($/t oz). Interquartile range is calculated for unit prices (USD per kg) using transaction-level data from the GRA.
Estimates for overvalued amount
Similarly, based on the 30% boundary above the free market prices for gold, the calculated total
over-valuations of gold between 2011 and 2017 are about 78.7 thousand USD (Table 3). Using the
interquartile range filter, calculated over-valuation increases to 170 million USD. Relative to the total
value of gold exports therefore, over-valuation seems negligible (less than 0.5%). In the case of gold
exports, we prefer the estimates generated using free-market price filter method due to the presence
of a clear market reference price from LME. Since the interquartile range is endogenously defined
using the observed distribution of prices, this method always designates a certain proportion of
transactions to be abnormally priced. It is however useful to consider in cases when there is no clear
market reference price.
Table 3: Overvalued Exports – Gold
Year Export Value (USD,
Million) Annual Exports
Weight (1,000 kg)
Free Market Price Filter: Plus 30% (USD, Million)
Interquartile Range Filter: Above 75th pctle
(USD, Million)
2011 4,532.3 106.7 - 33.1
2012 5,918.6 136.0 - 16.8
2013 5,284.5 145.6 - 50.9
2014 5,118.7 144.5 0.01 20.6
2015 4,466.6 133.2 0.07 14.7
2016 4,563.5 167.5 0.0002 19.3
2017 5,685.9 193.6 - 14.8
Mean 5,111.5 148.9 0.026 24.3
Total 35,569.9 1,027.0 0.078 170.1
Observations 20,933 20,933 5 5,231
Data Source: Ghana Revenue Authority (GRA). Notes: Gold is semi-manufactured; a combination of two export types mis-classified in the GRA data as gold bullion (HS: 7108.13.1000) and unwrought gold, non-monetary including gold plated with platinum (HS: 7108.12.0000). Free market price is the daily Gold Bullion price from London Bullion Market Association (LBMA) ($/t oz). Interquartile range is calculated for unit prices (USD per kg) using transaction-level data from the GRA.
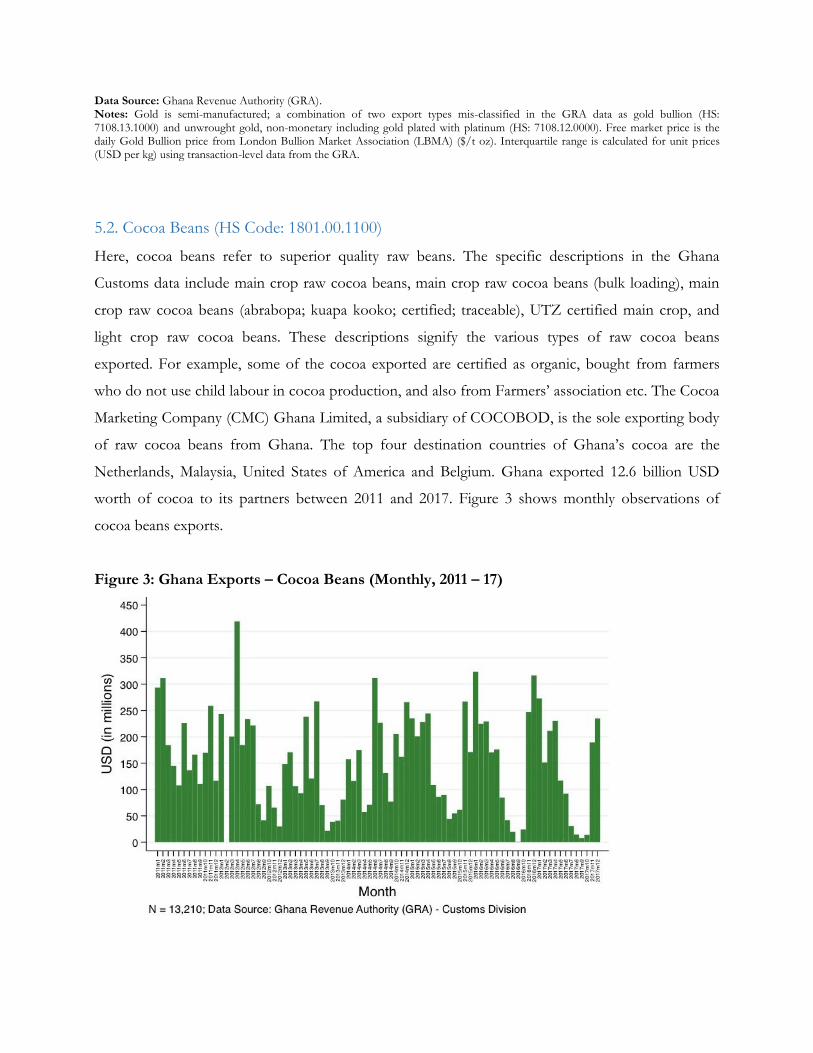
5.2. Cocoa Beans (HS Code: 1801.00.1100)
Here, cocoa beans refer to superior quality raw beans. The specific descriptions in the Ghana
Customs data include main crop raw cocoa beans, main crop raw cocoa beans (bulk loading), main
crop raw cocoa beans (abrabopa; kuapa kooko; certified; traceable), UTZ certified main crop, and
light crop raw cocoa beans. These descriptions signify the various types of raw cocoa beans
exported. For example, some of the cocoa exported are certified as organic, bought from farmers
who do not use child labour in cocoa production, and also from Farmers’ association etc. The Cocoa
Marketing Company (CMC) Ghana Limited, a subsidiary of COCOBOD, is the sole exporting body
of raw cocoa beans from Ghana. The top four destination countries of Ghana’s cocoa are the
Netherlands, Malaysia, United States of America and Belgium. Ghana exported 12.6 billion USD
worth of cocoa to its partners between 2011 and 2017. Figure 3 shows monthly observations of
cocoa beans exports.
Figure 3: Ghana Exports – Cocoa Beans (Monthly, 2011 – 17)
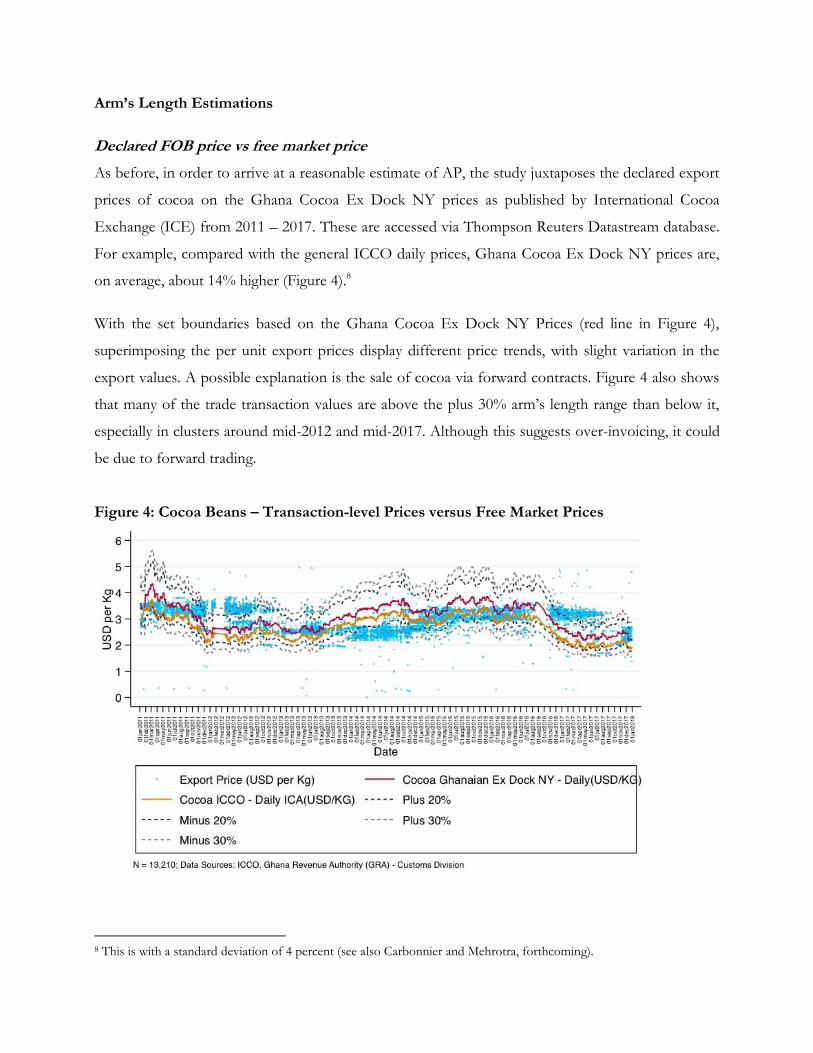
Arm’s Length Estimations
Declared FOB price vs free market price
As before, in order to arrive at a reasonable estimate of AP, the study juxtaposes the declared export
prices of cocoa on the Ghana Cocoa Ex Dock NY prices as published by International Cocoa
Exchange (ICE) from 2011 – 2017. These are accessed via Thompson Reuters Datastream database.
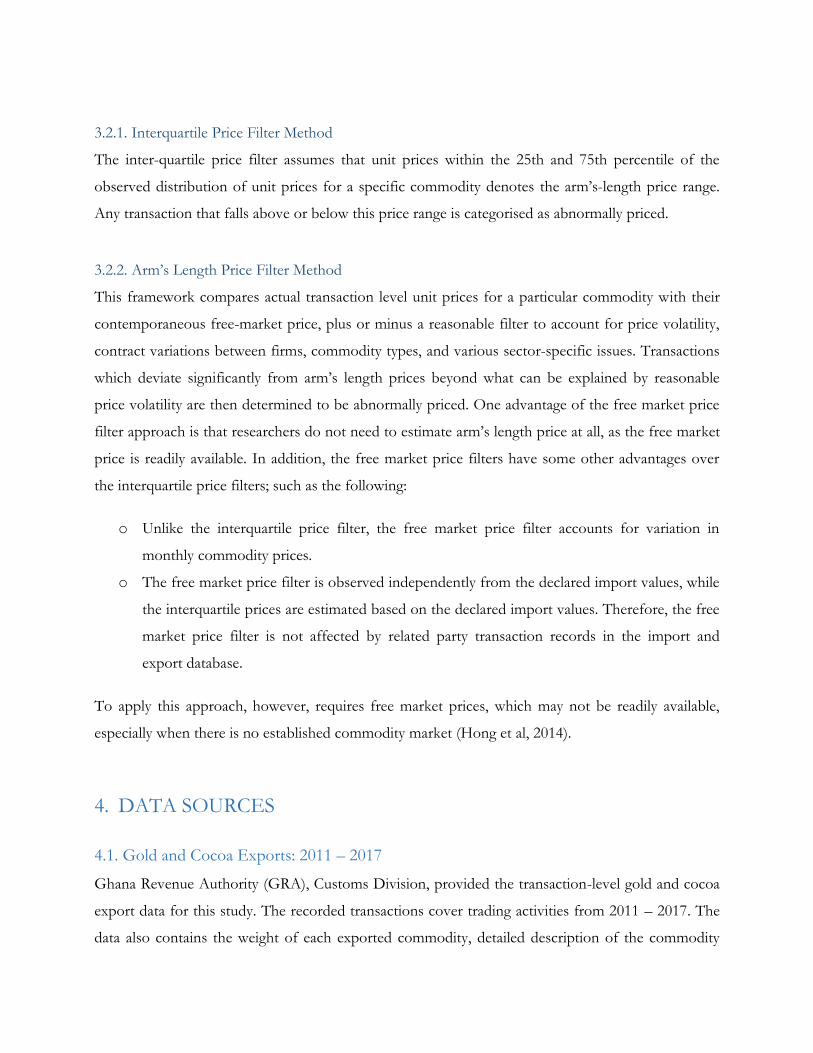
For example, compared with the general ICCO daily prices, Ghana Cocoa Ex Dock NY prices are,
on average, about 14% higher (Figure 4).8
With the set boundaries based on the Ghana Cocoa Ex Dock NY Prices (red line in Figure 4),
superimposing the per unit export prices display different price trends, with slight variation in the
export values. A possible explanation is the sale of cocoa via forward contracts. Figure 4 also shows
that many of the trade transaction values are above the plus 30% arm’s length range than below it,
especially in clusters around mid-2012 and mid-2017. Although this suggests over-invoicing, it could
be due to forward trading.
Figure 4: Cocoa Beans – Transaction-level Prices versus Free Market Prices
8 This is with a standard deviation of 4 percent (see also Carbonnier and Mehrotra, forthcoming).
Filters set around selected market prices to determine the arms’ length prices from which deviations
suggest AP are based on assumptions guided by our qualitative research as well as related literature.
The first filter is set at 20%. We also report estimates at 10% and 30% for the purpose of sensitivity
analyses (see Appendix B). We make the following assumptions in determining the filter thresholds:
1. Product Heterogeneity (+/-): Since Ghana’s cocoa beans are selected for export based on their
top-grade quality and size, they are not as heterogeneous as gold9. Variations are related to
various certifications such as Organic, Fairtrade and traceability, which attract additional price
premium of 150 USD per tonne (Dand, 2011) – about 5% of the average value of the Ghana
Cocoa Ex Dock NY prices per tonne for the period 2011 – 2017. We thus allow for 5%
dispersion around the selected market prices due to heterogeneity.
2. Transport and insurance costs (+): According to the Cocoa Marketing Company (CMC), a
subsidiary of COCOBOD, exports are done on FOB terms. However, customers sometimes
request shipments to be pre-financed by COCOBOD. On these occasions, the beans are
exported under CIF, which is usually around 100 USD per tonne or 10% of cost. In effect,
COCOBOD bears no cost for transport and insurance except for possible exchange rate
volatility affecting the pre-financed values. Ghana Customs, however, may not be aware of this
arrangement and thus record CIF values as FOB. This is because cocoa CIF shipments from
Ghana usually include bills of laden that are not stamped “freight paid” but have the cost of
freight deducted from invoice later on (Dand, 2011). Using the World market price in 1999,
Pedersen (2001) also estimated transport cost of cocoa exported from Tema to Rotterdam to be
around 13 percent of the market price. We thus approximate a 10% positive variation around the
market values.
3. Market conditions and contract terms (+/-): A peculiar feature of Ghana’s cocoa beans export is
Government’s control over the purchase and export of beans. Syndicated loans are used to
finance purchases and about 80% of the beans bought are exported on futures sales contracts.
Plausible portions of estimated AP could be reflecting these contracts cum market conditions,
which we assume to vary by 5% around the market values
Given these features, assuming 20% above and below the free market prices as the arm’s length
range seems reasonable for estimating the magnitudes of AP for cocoa. The data shows that Ghana
exported about 4.3 million tonnes of superior quality cocoa beans worth 12.6 billion USD over the
9 Informed via interviews with experts in the industry including personnel at COCOBOD.
study period (Table 4). The number of transactions observed during this period, after eliminating
huge outliers suspected to be mis-reporting, is 13,210.
Estimates of undervaluation
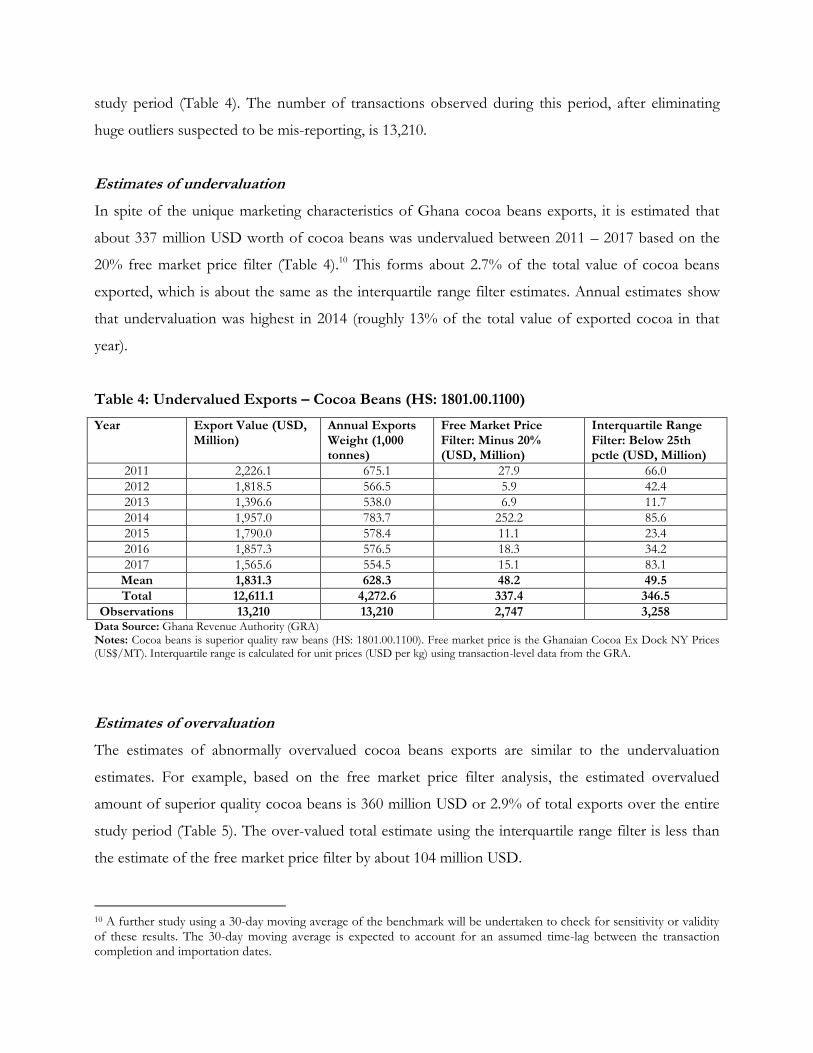
In spite of the unique marketing characteristics of Ghana cocoa beans exports, it is estimated that
about 337 million USD worth of cocoa beans was undervalued between 2011 – 2017 based on the
20% free market price filter (Table 4).10 This forms about 2.7% of the total value of cocoa beans
exported, which is about the same as the interquartile range filter estimates. Annual estimates show
that undervaluation was highest in 2014 (roughly 13% of the total value of exported cocoa in that
year).
Table 4: Undervalued Exports – Cocoa Beans (HS: 1801.00.1100)
Year Export Value (USD, Million)
Annual Exports Weight (1,000 tonnes)
Free Market Price Filter: Minus 20% (USD, Million)
Interquartile Range Filter: Below 25th pctle (USD, Million)
2011 2,226.1 675.1 27.9 66.0
2012 1,818.5 566.5 5.9 42.4
2013 1,396.6 538.0 6.9 11.7
2014 1,957.0 783.7 252.2 85.6
2015 1,790.0 578.4 11.1 23.4
2016 1,857.3 576.5 18.3 34.2
2017 1,565.6 554.5 15.1 83.1
Mean 1,831.3 628.3 48.2 49.5
Total 12,611.1 4,272.6 337.4 346.5
Observations 13,210 13,210 2,747 3,258 Data Source: Ghana Revenue Authority (GRA) Notes: Cocoa beans is superior quality raw beans (HS: 1801.00.1100). Free market price is the Ghanaian Cocoa Ex Dock NY Prices (US$/MT). Interquartile range is calculated for unit prices (USD per kg) using transaction-level data from the GRA.
Estimates of overvaluation
The estimates of abnormally overvalued cocoa beans exports are similar to the undervaluation
estimates. For example, based on the free market price filter analysis, the estimated overvalued
amount of superior quality cocoa beans is 360 million USD or 2.9% of total exports over the entire
study period (Table 5). The over-valued total estimate using the interquartile range filter is less than
the estimate of the free market price filter by about 104 million USD.
10 A further study using a 30-day moving average of the benchmark will be undertaken to check for sensitivity or validity of these results. The 30-day moving average is expected to account for an assumed time-lag between the transaction completion and importation dates.
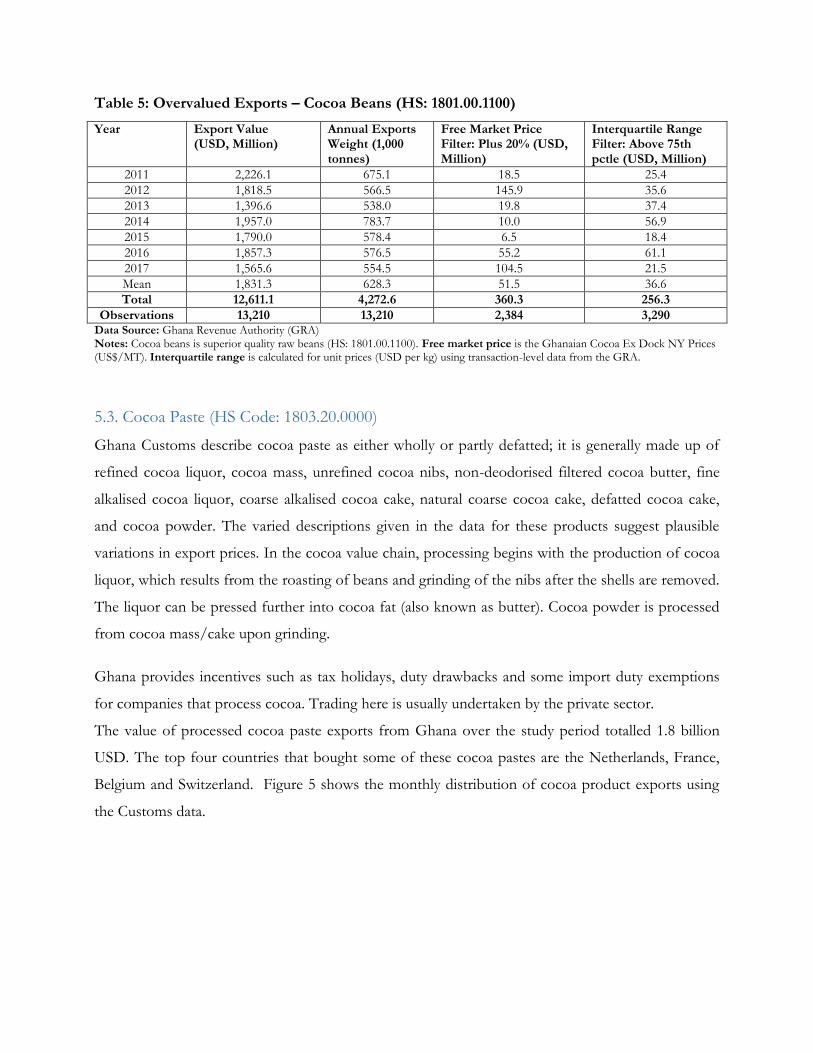
Table 5: Overvalued Exports – Cocoa Beans (HS: 1801.00.1100)
Year Export Value (USD, Million)
Annual Exports Weight (1,000 tonnes)
Free Market Price Filter: Plus 20% (USD, Million)
Interquartile Range Filter: Above 75th pctle (USD, Million)
2011 2,226.1 675.1 18.5 25.4
2012 1,818.5 566.5 145.9 35.6
2013 1,396.6 538.0 19.8 37.4
2014 1,957.0 783.7 10.0 56.9
2015 1,790.0 578.4 6.5 18.4
2016 1,857.3 576.5 55.2 61.1
2017 1,565.6 554.5 104.5 21.5
Mean 1,831.3 628.3 51.5 36.6
Total 12,611.1 4,272.6 360.3 256.3
Observations 13,210 13,210 2,384 3,290 Data Source: Ghana Revenue Authority (GRA) Notes: Cocoa beans is superior quality raw beans (HS: 1801.00.1100). Free market price is the Ghanaian Cocoa Ex Dock NY Prices (US$/MT). Interquartile range is calculated for unit prices (USD per kg) using transaction-level data from the GRA.
5.3. Cocoa Paste (HS Code: 1803.20.0000)
Ghana Customs describe cocoa paste as either wholly or partly defatted; it is generally made up of
refined cocoa liquor, cocoa mass, unrefined cocoa nibs, non-deodorised filtered cocoa butter, fine
alkalised cocoa liquor, coarse alkalised cocoa cake, natural coarse cocoa cake, defatted cocoa cake,
and cocoa powder. The varied descriptions given in the data for these products suggest plausible
variations in export prices. In the cocoa value chain, processing begins with the production of cocoa
liquor, which results from the roasting of beans and grinding of the nibs after the shells are removed.
The liquor can be pressed further into cocoa fat (also known as butter). Cocoa powder is processed
from cocoa mass/cake upon grinding.
Ghana provides incentives such as tax holidays, duty drawbacks and some import duty exemptions
for companies that process cocoa. Trading here is usually undertaken by the private sector.
The value of processed cocoa paste exports from Ghana over the study period totalled 1.8 billion
USD. The top four countries that bought some of these cocoa pastes are the Netherlands, France,
Belgium and Switzerland. Figure 5 shows the monthly distribution of cocoa product exports using
the Customs data.
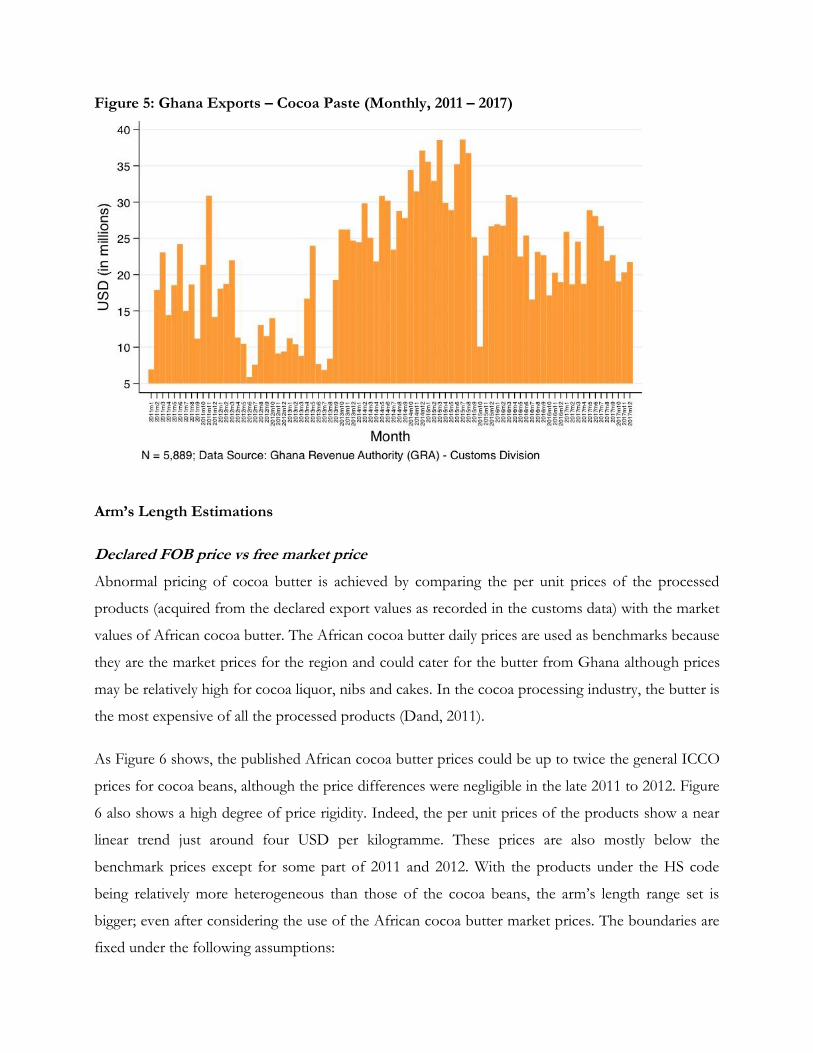
Figure 5: Ghana Exports – Cocoa Paste (Monthly, 2011 – 2017)
Arm’s Length Estimations
Declared FOB price vs free market price
Abnormal pricing of cocoa butter is achieved by comparing the per unit prices of the processed
products (acquired from the declared export values as recorded in the customs data) with the market
values of African cocoa butter. The African cocoa butter daily prices are used as benchmarks because
they are the market prices for the region and could cater for the butter from Ghana although prices
may be relatively high for cocoa liquor, nibs and cakes. In the cocoa processing industry, the butter is
the most expensive of all the processed products (Dand, 2011).
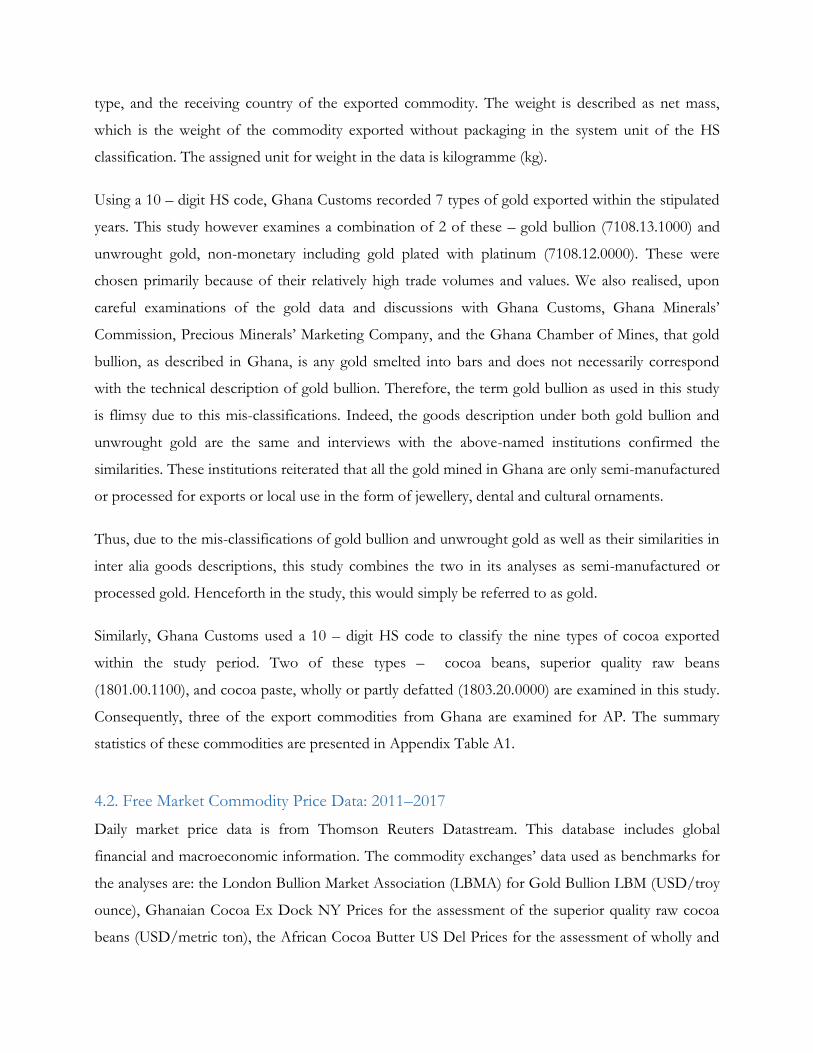
As Figure 6 shows, the published African cocoa butter prices could be up to twice the general ICCO
prices for cocoa beans, although the price differences were negligible in the late 2011 to 2012. Figure
6 also shows a high degree of price rigidity. Indeed, the per unit prices of the products show a near
linear trend just around four USD per kilogramme. These prices are also mostly below the
benchmark prices except for some part of 2011 and 2012. With the products under the HS code
being relatively more heterogeneous than those of the cocoa beans, the arm’s length range set is
bigger; even after considering the use of the African cocoa butter market prices. The boundaries are
fixed under the following assumptions:
1. Product Heterogeneity (+/-): With the different products captured here, covering the various
outcomes of processed cocoa, a variation of 10% around the benchmark is considered prudent
for the assessment. Since the prices for cakes/mass or even liquor, for instance, are lower than
the butter in general, the filter would cater for them as the benchmark caters for the butter. In
addition, some factories spend extra resources to get the product in the form required since
cocoa producing countries are unable to meet such quality demands (Dand, 2011). This could
lead to lower offer prices than the benchmark market prices. We add extra 5% for various
certification requirements such as Organic, Fairtrade, traceability, and Forest Alliance, yielding an
estimated 15% arm’s length range due to product heterogeneity.
2. Market conditions and contract terms (+/-): Processing the cocoa does not only have to meet
particular factory specifications (e.g., aromas, colours, fat content, degree of alkalisation) but also
be delivered at precise times and conditions for further processing to suit their customers’
standards (Dand, 2011). Traders would therefore have various contract terms with exporters
depending on their ability to deliver the needed quantity and specifications as well as on time,
which could eventually affect export prices. We therefore estimate around 15% plus or minus the
benchmark market prices for such variations in the market conditions and contracts.
3. Transport and insurance costs (+): The shipment of processed cocoa products is generally less
costly than the beans because they are less bulky. They are also treated as food, so extra care is
given during shipment and handling. It has been estimated that 1.25 kilogrammes of cocoa beans
make 1.0 kilogrammes of cocoa liquor (Dand, 2011). We therefore assume that with varied
weights of the various cocoa products, transport and insurance would cost between 5 - 8%.
In sum, we rationalise that setting the filters at 40% would better capture the heterogeneous aspect
of the products under this HS code. A 30% filter has also been included for sensitivity test (Figure
6).
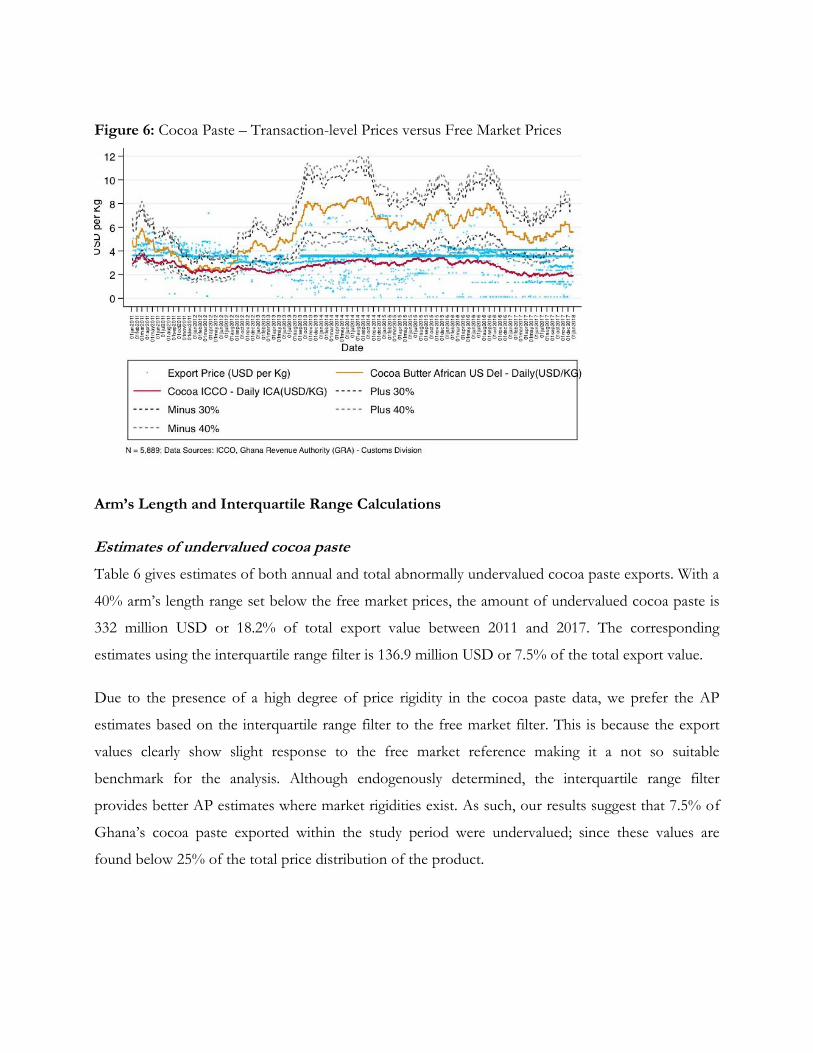
Figure 6: Cocoa Paste – Transaction-level Prices versus Free Market Prices
Arm’s Length and Interquartile Range Calculations
Estimates of undervalued cocoa paste
Table 6 gives estimates of both annual and total abnormally undervalued cocoa paste exports. With a
40% arm’s length range set below the free market prices, the amount of undervalued cocoa paste is
332 million USD or 18.2% of total export value between 2011 and 2017. The corresponding
estimates using the interquartile range filter is 136.9 million USD or 7.5% of the total export value.
Due to the presence of a high degree of price rigidity in the cocoa paste data, we prefer the AP
estimates based on the interquartile range filter to the free market filter. This is because the export
values clearly show slight response to the free market reference making it a not so suitable
benchmark for the analysis. Although endogenously determined, the interquartile range filter
provides better AP estimates where market rigidities exist. As such, our results suggest that 7.5% of
Ghana’s cocoa paste exported within the study period were undervalued; since these values are
found below 25% of the total price distribution of the product.
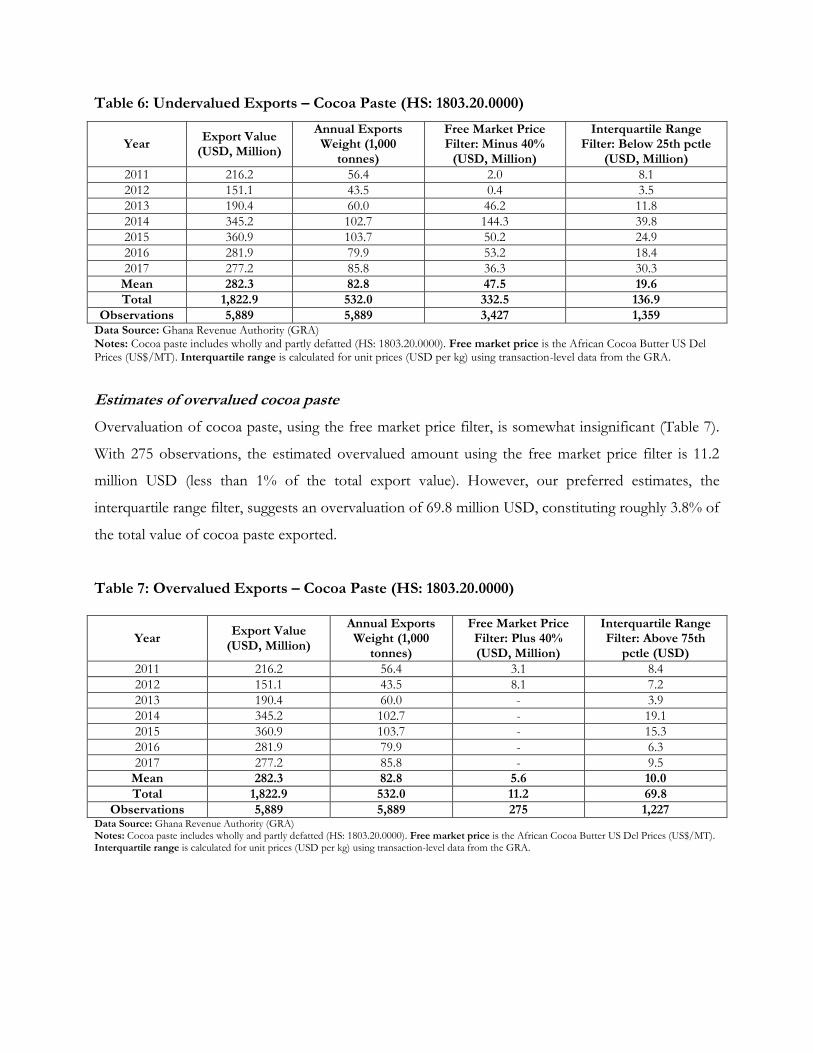
Table 6: Undervalued Exports – Cocoa Paste (HS: 1803.20.0000)
Year Export Value
(USD, Million)
Annual Exports Weight (1,000
tonnes)
Free Market Price Filter: Minus 40%
(USD, Million)
Interquartile Range Filter: Below 25th pctle
(USD, Million)
2011 216.2 56.4 2.0 8.1
2012 151.1 43.5 0.4 3.5
2013 190.4 60.0 46.2 11.8
2014 345.2 102.7 144.3 39.8
2015 360.9 103.7 50.2 24.9
2016 281.9 79.9 53.2 18.4
2017 277.2 85.8 36.3 30.3
Mean 282.3 82.8 47.5 19.6
Total 1,822.9 532.0 332.5 136.9
Observations 5,889 5,889 3,427 1,359 Data Source: Ghana Revenue Authority (GRA) Notes: Cocoa paste includes wholly and partly defatted (HS: 1803.20.0000). Free market price is the African Cocoa Butter US Del Prices (US$/MT). Interquartile range is calculated for unit prices (USD per kg) using transaction-level data from the GRA.
Estimates of overvalued cocoa paste
Overvaluation of cocoa paste, using the free market price filter, is somewhat insignificant (Table 7).
With 275 observations, the estimated overvalued amount using the free market price filter is 11.2
million USD (less than 1% of the total export value). However, our preferred estimates, the
interquartile range filter, suggests an overvaluation of 69.8 million USD, constituting roughly 3.8% of
the total value of cocoa paste exported.
Table 7: Overvalued Exports – Cocoa Paste (HS: 1803.20.0000)
Year Export Value
(USD, Million)
Annual Exports Weight (1,000
tonnes)
Free Market Price Filter: Plus 40% (USD, Million)
Interquartile Range Filter: Above 75th
pctle (USD)
2011 216.2 56.4 3.1 8.4
2012 151.1 43.5 8.1 7.2
2013 190.4 60.0 - 3.9
2014 345.2 102.7 - 19.1
2015 360.9 103.7 - 15.3
2016 281.9 79.9 - 6.3
2017 277.2 85.8 - 9.5
Mean 282.3 82.8 5.6 10.0
Total 1,822.9 532.0 11.2 69.8
Observations 5,889 5,889 275 1,227 Data Source: Ghana Revenue Authority (GRA) Notes: Cocoa paste includes wholly and partly defatted (HS: 1803.20.0000). Free market price is the African Cocoa Butter US Del Prices (US$/MT). Interquartile range is calculated for unit prices (USD per kg) using transaction-level data from the GRA.
6. RISKS FOR IFFs IN GHANA’S NATURAL RESOURCE SECTOR
One major driver of illicit financial flows in Ghana’s commodity sector is capital flight through
export under invoicing.
Given the structure of Ghana’s gold sector where the bulk of companies operating in the sector are
multi nationals, the revenue the state obtains from the sector is mainly through corporate and
income taxes as well as royalties and withholding tax (Annual Report, 2017, Minerals’ Commission).
However, these companies tend to under report/under invoice their exports to allow free movement
of money out of the country. This is because whatever taxes they need to pay to the government is
based on the value of exports declared. As such, if the undervaluation occurs, then it reduces their
tax liability to the state while the money that has been illicitly moved out of the state can be used by
the company for other purposes. It is also in line with abusive transfer pricing in the sense that many
of the companies that export gold from Ghana are subsidiaries of multinationals who may be
importing their own gold. The same can be said for the cocoa sector where the bulk of processing
companies are multinationals.
The weaknesses in the regulatory environment also contribute to IFFs in the commodity sector in
Ghana. One instance is where customs officials of GRA do not pay as much attention to volumes
and values of exports recorded as they do to imports. This is because most exports do not attract any
tax and as such, customs officials may not feel the same level of responsibility as they do for imports
to ensure that accurate values are recorded. For example, an official may be punished for causing
revenue loss to the state if he/she does not charge the right amount of tax on an imported item or if
it is discovered that there has been under invoicing. However, the same may not be true for exports
since no taxes are charged and as such, officers do not feel directly responsible to ensure that
accurate values are recorded.
In addition, the different regulatory agencies in the gold sector and the fact that they do not use an
integrated system can create opportunities for IFFs. For example, data reported by GRA, Ghana
Statistical Service, Bank of Ghana and the Minerals Commission on gold in Ghana show
discrepancies for the period of the study. Each of these institutions has their own focus for the data
they collect and as such create opportunities for companies in the sector to engage in IFFs.
7. SUMMARY AND CONCLUSIONS
As one of the natural resource rich developing countries, Ghana is expected to benefit from the
production and marketing of such resources for its socioeconomic development. However,
opportunities for IFFs reduce the potential of the natural resource sector to contribute to
development as it leads to financial leakages in the economy. Using improved data and a more robust
method of analysis – the price filter methods – this study provides estimates of AP for Ghana
between 2001 and 2017 using gold (gold bullion and unwrought gold) and cocoa (superior quality
cocoa beans and cocoa paste) as case studies. The current estimates are relatively more accurate as it
relies on transaction level microdata rather than the aggregate trade statistics used in the partner
country trade method.
Based on the market reference price filters for gold, this study finds that gold exports are
undervalued by roughly 11% of the total value of gold exported (35.6 billion USD). The undervalued
amount constituting 3.8 billion USD below the contemporaneous London market prices are lost to
countries Ghana trades with including South Africa (999.4 million USD), Switzerland (753.6 million
USD), India (91.7 million USD), United Arab Emirates (25.5 million USD) and the Netherlands
(14.1 million USD). Due to price rigidities observed in the marketing of cocoa and cocoa paste, the
interquartile range filters were preferred to the use of contemporaneous market prices as reference
for AP estimate. Thus, based on the interquartile range filters, we estimate that 2.7% of the 12.6
billion USD worth of cocoa beans exported and 7.5% of the total export of cocoa paste (1.8 billion
USD) were undervalued during the period of the study. We do not find the estimates of cocoa paste
so surprising as the industry is dominated by Multinational Companies (MNCs) with sophisticated
operational systems. With global subsidiaries, MNCs can easily shift prices as well as bargain to get as
much from a contract as possible to the plausible detriment of an exporting country with a weaker
industry. The overvaluation estimates of the selected products are somewhat negligible; less than
0.5% of the total value of exported gold. This suggests that overvaluation is hardly an issue in
Ghana’s gold exports.
Our findings thus corroborate existing literature that IFFs via commodity trading is a risk in Ghana.
There is therefore an urgent need for government to put in more effort in providing expert
knowledge and skills to track, monitor and block the sources of these IFFs. Although the
government of Ghana has already put in measures, such as the setting up of a transfer pricing unit at
GRA as well as an anti-money laundering department, to streamline illicit operations, constant skills
improvement of personnel of these units need to be ensured for successful outcomes.
REFERENCES
Aidt, T. S. 2003. “Economic Analysis of Corruption: A Survey.” The Economic Journal 113 (491):
F632–F652.
Andvig, J. C., O.-H. Fjeldstad, I. Amundsen, T. Sissener, and T. Søreide. 2001. “Corruption. A
Review of Contemporary Research.” Report R 2001:7, Chr. Michelsen Institute, Bergen,
Norway.
Balma, L., Bawumia, M., & Ncube, M. (2018) Managing Natural Revenue for Sustainable
Development in Ghana: Simulations using a DSGE Model.
Barasa, T. (2018). Illicit Financial Flows in Kenya: Mapping of the Literature and Synthesis of the
Evidence.
Bardhan, P. 1997. “Corruption and Development: A Review of Issues.” Journal of Economic
Literature 35 (3): 1320–46.
Beja E, Junvith P, Ragusett J (2005). Capital flight from Thailand, 1980–2000. In Epstein G (ed),
Capital flight and capital controls in developing countries. Shapter 6, pp. 143–172. Edward
Elgar Publishing
Berger, H., & Nitsch, V. (2012). ‘Gotcha’! A profile of smuggling in international trade. In C. C.
Storti & P. De Grauwe (Eds.), Illicit trade and the global economy (chap. 4). Cambridge,
MA: MIT Press.
Bhagwati, J. (1964). On the Underinvoicing of Imports. Bulletin of the Oxford University Institute
of Economics & Statistics
Boyce, J. K., & Ndikumana, L. (2001). Is Africa a net creditor? New estimates of capital flight from
severely indebted sub-Saharan African countries, 1970-96. Journal of Development Studies,
38(2), 27-56.
Crivelli, E., & Gupta, S. (2014). Resource blessing, revenue curse? Domestic revenue effort in
resource-rich countries. European Journal of Political Economy, 35, 88-101.
Dand, R. (2011) “The International Coco Trade” Third Edition. Woodhead Publishing.
de Boyrie, M. E., Nelson, J. A., & Pak, S. J. (2007). Capital movement through trade misinvoicing:
the case of Africa. Journal of Financial Crime, 14(4), 474-489.
Forstater, M. (2018). Illicit Financial Flows, Trade Misinvoicing, and Multinational Tax Avoidance:
The Same or Different?
GFI (2018). Kenya: Potential Revenue Losses Associated with Trade Misinvoicing
GHEITI (2009). Ghana Extractive Industries Transparency Initiative (GHEITI) aggregation and
reconciliation of mining sector payments and receipt (2004-2009). Ministry of Finance and
Economic Planning (MoFEP). Ghana.
Global Financial Integrity (2014). Illicit financial flows from the developing world: 2003–2012.
Retrieved April, 29, 2015.
Herkenrath, M. (2014). Illicit financial flows and their developmental impacts: An overview.
International Development Policy| Revue internationale de politique de développement,
5(5.3).
Hong, K. P., & Pak, S. J. (2017). Estimating trade misinvoicing from bilateral trade statistics: The
devil is in the details. The International Trade Journal, 31(1), 3-28.
Hong, K., H. Pak, C., & J. Pak, S. (2014). Measuring abnormal pricing–an alternative approach: The
case of US banana trade with Latin American and Caribbean Countries. Journal of Money
Laundering Control, 17(2), 203-218.
ISSER (2018). State of the Ghanaian Economy Report in 2017. Institute of Statistical, Social and Economic Research, University of Ghana, Accra, Ghana.
Kar, D., & Cartwright-Smith, D. (2008). Illicit Financial Flows from Developing Countries: 2002-
2006: Executive Report. Global Financial Integrity, a program of the Center for
International Policy.
Khan, M. S., & Haque, N. U. (1985). Foreign borrowing and capital flight: A formal analysis. Staff
Papers, 32(4), 606-628.
Kwaramba, M., Mahonye, N., & Mandishara, L. (2016). Capital flight and trade misinvoicing in
Zimbabwe. African Development Review, 28(S1), 50-64.
Mahmood, Z. (1997). Research note: Determinants of under-invoicing of imports in Pakistan.
Journal of International Development, 9(1), 85–96.
Mascagni, G., Moore, M., & McCluskey, R. (2014). Tax Revenue Mobilistation In Developing
Countries: Issues and Challenges. European Union (Belgium).
Outlook, A. E. (2010). OECD Development Centre, African Development Bank and UNECA.
Pak, S. J. (2014). A presentation: cost control/management towards reducing revenue leakages in
petroleum and mineral contracts training workshop. The Integrated Social Development
Centre (ISODEC). 13 – 17 November 2017. Accra, Ghana.
Pak, S. J. and Zdanowicz, J. S. (1994). A statistical analysis of the U.S. merchandise trade data base
and its uses in transfer pricing compliance and enforcement. Tax Management Transfer
Pricing Report, 3(1):50–57.
Patnaik, I., Gupta, A. S., & Shah, A. (2012). Determinants of trade misinvoicing. Open Economies
Review, 23(5), 891-910.
Pedersen, P.O (2001) “The Freight Transport and Logistical System of Ghana” Working paper
subseries on Globalisation and Economic Restructuring in Africa, no. xii; Centre for
Development Research (CDR) working paper 01.2. Copenhagen.
Qureshi, T. A., & Mahmood, Z. (2016). The Magnitude of Trade Misinvoicing and Resulting
Revenue Loss in Pakistan.
Schulze G (1994) Misinvoicing imports: the interdependence of tax and tariff evasion. Public Financ
Rev 22(3):335–365
Yalta, A. Y., & Demir, I. (2010). The extent of trade misinvoicing in Turkey: Did post-1990 policies
matter? Journal of Economic Cooperation and Development, 31(3), 41–66.
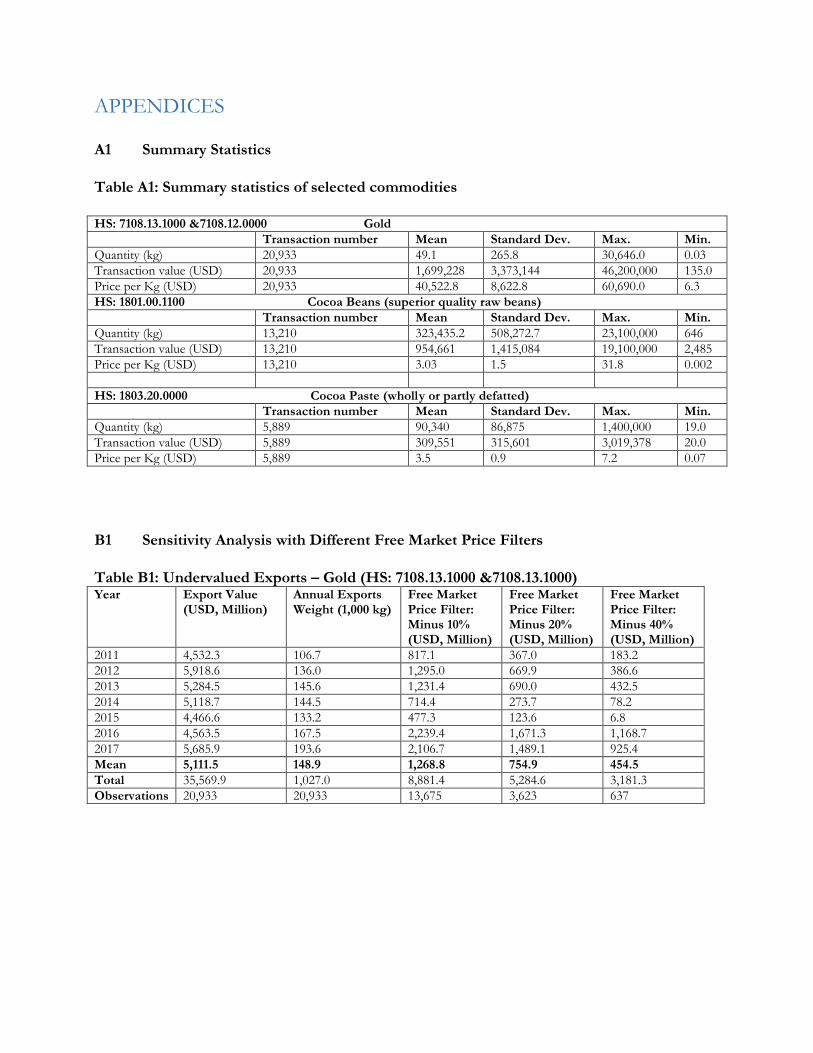
APPENDICES
A1 Summary Statistics
Table A1: Summary statistics of selected commodities
HS: 7108.13.1000 &7108.12.0000 Gold
Transaction number Mean Standard Dev. Max. Min.
Quantity (kg) 20,933 49.1 265.8 30,646.0 0.03
Transaction value (USD) 20,933 1,699,228 3,373,144 46,200,000 135.0
Price per Kg (USD) 20,933 40,522.8 8,622.8 60,690.0 6.3
HS: 1801.00.1100 Cocoa Beans (superior quality raw beans)
Transaction number Mean Standard Dev. Max. Min.
Quantity (kg) 13,210 323,435.2 508,272.7 23,100,000 646
Transaction value (USD) 13,210 954,661 1,415,084 19,100,000 2,485
Price per Kg (USD) 13,210 3.03 1.5 31.8 0.002
HS: 1803.20.0000 Cocoa Paste (wholly or partly defatted)
Transaction number Mean Standard Dev. Max. Min.
Quantity (kg) 5,889 90,340 86,875 1,400,000 19.0
Transaction value (USD) 5,889 309,551 315,601 3,019,378 20.0
Price per Kg (USD) 5,889 3.5 0.9 7.2 0.07
B1 Sensitivity Analysis with Different Free Market Price Filters
Table B1: Undervalued Exports – Gold (HS: 7108.13.1000 &7108.13.1000) Year Export Value
(USD, Million) Annual Exports Weight (1,000 kg)
Free Market Price Filter: Minus 10% (USD, Million)
Free Market Price Filter: Minus 20% (USD, Million)
Free Market Price Filter: Minus 40% (USD, Million)
2011 4,532.3 106.7 817.1 367.0 183.2
2012 5,918.6 136.0 1,295.0 669.9 386.6
2013 5,284.5 145.6 1,231.4 690.0 432.5
2014 5,118.7 144.5 714.4 273.7 78.2
2015 4,466.6 133.2 477.3 123.6 6.8
2016 4,563.5 167.5 2,239.4 1,671.3 1,168.7
2017 5,685.9 193.6 2,106.7 1,489.1 925.4
Mean 5,111.5 148.9 1,268.8 754.9 454.5
Total 35,569.9 1,027.0 8,881.4 5,284.6 3,181.3
Observations 20,933 20,933 13,675 3,623 637
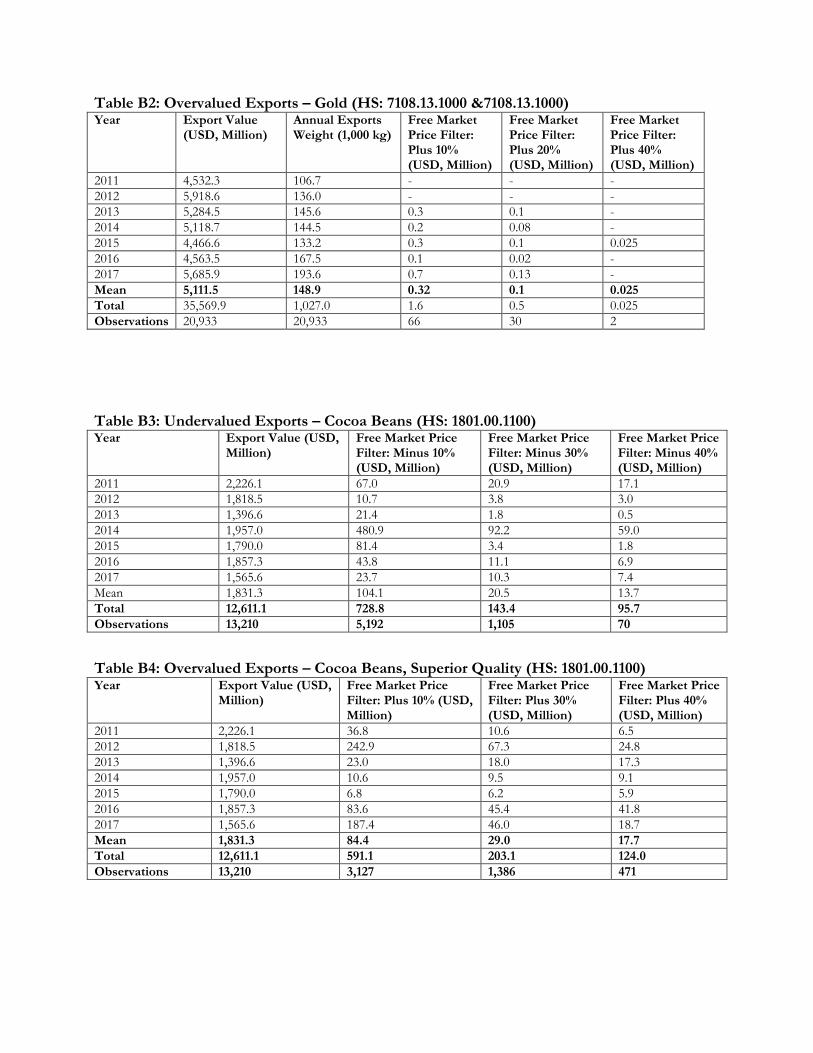
Table B2: Overvalued Exports – Gold (HS: 7108.13.1000 &7108.13.1000) Year Export Value
(USD, Million) Annual Exports Weight (1,000 kg)
Free Market Price Filter: Plus 10% (USD, Million)
Free Market Price Filter: Plus 20% (USD, Million)
Free Market Price Filter: Plus 40% (USD, Million)
2011 4,532.3 106.7 - - -
2012 5,918.6 136.0 - - -
2013 5,284.5 145.6 0.3 0.1 -
2014 5,118.7 144.5 0.2 0.08 -
2015 4,466.6 133.2 0.3 0.1 0.025
2016 4,563.5 167.5 0.1 0.02 -
2017 5,685.9 193.6 0.7 0.13 -
Mean 5,111.5 148.9 0.32 0.1 0.025
Total 35,569.9 1,027.0 1.6 0.5 0.025
Observations 20,933 20,933 66 30 2
Table B3: Undervalued Exports – Cocoa Beans (HS: 1801.00.1100) Year Export Value (USD,
Million) Free Market Price Filter: Minus 10% (USD, Million)
Free Market Price Filter: Minus 30% (USD, Million)
Free Market Price Filter: Minus 40% (USD, Million)
2011 2,226.1 67.0 20.9 17.1
2012 1,818.5 10.7 3.8 3.0
2013 1,396.6 21.4 1.8 0.5
2014 1,957.0 480.9 92.2 59.0
2015 1,790.0 81.4 3.4 1.8
2016 1,857.3 43.8 11.1 6.9
2017 1,565.6 23.7 10.3 7.4
Mean 1,831.3 104.1 20.5 13.7
Total 12,611.1 728.8 143.4 95.7
Observations 13,210 5,192 1,105 70
Table B4: Overvalued Exports – Cocoa Beans, Superior Quality (HS: 1801.00.1100) Year Export Value (USD,
Million) Free Market Price Filter: Plus 10% (USD, Million)
Free Market Price Filter: Plus 30% (USD, Million)
Free Market Price Filter: Plus 40% (USD, Million)
2011 2,226.1 36.8 10.6 6.5
2012 1,818.5 242.9 67.3 24.8
2013 1,396.6 23.0 18.0 17.3
2014 1,957.0 10.6 9.5 9.1
2015 1,790.0 6.8 6.2 5.9
2016 1,857.3 83.6 45.4 41.8
2017 1,565.6 187.4 46.0 18.7
Mean 1,831.3 84.4 29.0 17.7
Total 12,611.1 591.1 203.1 124.0
Observations 13,210 3,127 1,386 471
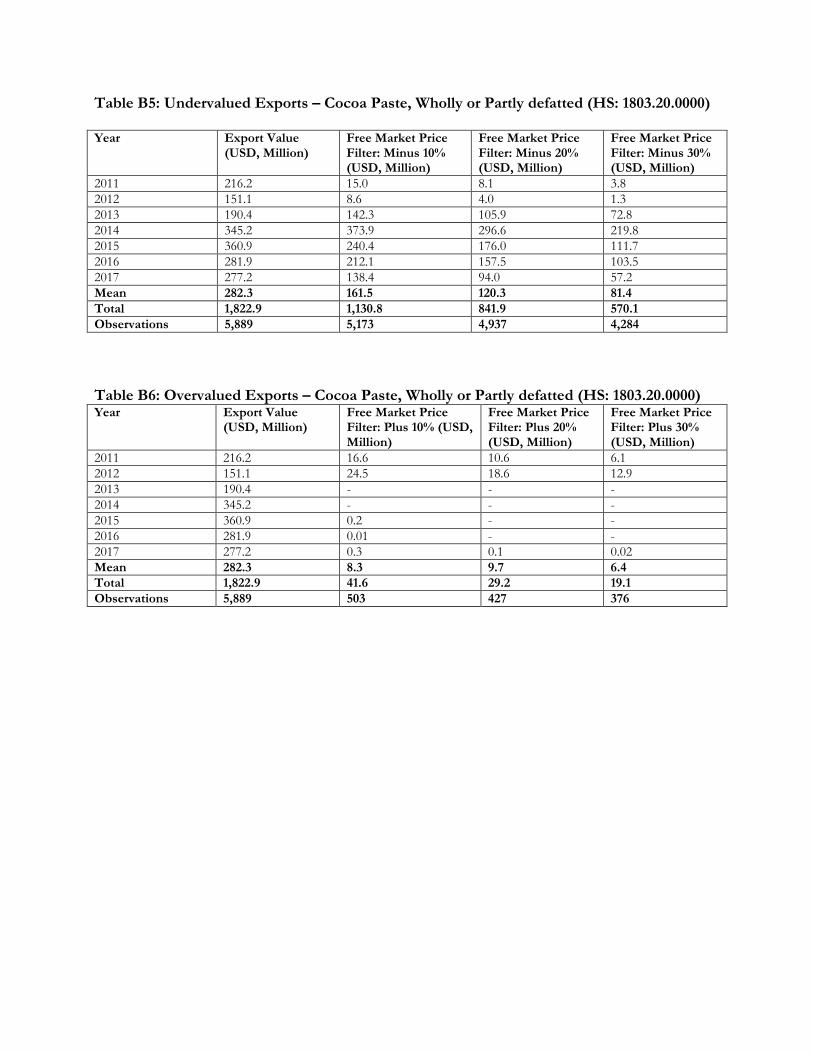
Table B5: Undervalued Exports – Cocoa Paste, Wholly or Partly defatted (HS: 1803.20.0000)
Year Export Value (USD, Million)
Free Market Price Filter: Minus 10% (USD, Million)
Free Market Price Filter: Minus 20% (USD, Million)
Free Market Price Filter: Minus 30% (USD, Million)
2011 216.2 15.0 8.1 3.8
2012 151.1 8.6 4.0 1.3
2013 190.4 142.3 105.9 72.8
2014 345.2 373.9 296.6 219.8
2015 360.9 240.4 176.0 111.7
2016 281.9 212.1 157.5 103.5
2017 277.2 138.4 94.0 57.2
Mean 282.3 161.5 120.3 81.4
Total 1,822.9 1,130.8 841.9 570.1
Observations 5,889 5,173 4,937 4,284
Table B6: Overvalued Exports – Cocoa Paste, Wholly or Partly defatted (HS: 1803.20.0000) Year Export Value
(USD, Million) Free Market Price Filter: Plus 10% (USD, Million)
Free Market Price Filter: Plus 20% (USD, Million)
Free Market Price Filter: Plus 30% (USD, Million)
2011 216.2 16.6 10.6 6.1
2012 151.1 24.5 18.6 12.9
2013 190.4 - - -
2014 345.2 - - -
2015 360.9 0.2 - -
2016 281.9 0.01 - -
2017 277.2 0.3 0.1 0.02
Mean 282.3 8.3 9.7 6.4
Total 1,822.9 41.6 29.2 19.1
Observations 5,889 503 427 376