commodities research · 2018-09-11 · energy market outlook: between scarcity and abundance march...
TRANSCRIPT

Energy Market Outlook: Between scarcity and abundance
March 2018
Commodities Research
PLEASE SEE ANALYST CERTIFICATIONS AND IMPORTANT DISCLOSURES STARTING AFTER PAGE 37
Michael Cohen
+1 212 526-3606
BCI, US

Oil market short-term overview

3 December 2017
As inventories draw, geopolitical supply concerns emerge
1. Prices have experienced justified strength as stocks draw, but high prices will create a hangover effect
2. We remain bearish on prices at current levels due to expected shale growth, global supply builds in ‘18, and the
removal of temporary supply supports
3. OPEC strategy must balance short and long term revenue maximization: to that end it wants relatively high and
stable prices not price fluctuations in a lower range
Inventory drawdown continued through end of year. Market looking for clarity on situations in
Venezuela and Iran, and OPEC policy
0
20
40
60
80
100
120
140
-0.2
-0.1
0.0
0.1
0.2
0.3
0.4
98 00 02 04 06 08 10 12 14 16 18
bill. barrels
OECD industry petroleum stock levels vs 5-yr avg (Jan
1998-Dec 2018)
surplus to 5-yr Price Source s: IEA, Bloomberg, Barclays Research

4
Source for all charts: IEA, Bloomberg, Barclays Research
Solid outlook for global growth Global growth being driven by developed
economies and EM is catching up …
26 March 2018
Synchronicity: global economic recovery across all regions…
-2.0
-1.5
-1.0
-0.5
0.0
0.5
1.0
0.0
1.0
2.0
3.0
4.0
5.0
6.0
7.0
Aug-11 Aug-12 Aug-13 Aug-14 Aug-15 Aug-16 Aug-17
Global industrial production, LHS
Global manufact. Conf. (Barclays), RHS
3m/3m change, saarnormalised
diffusion balance
-4
-2
0
2
07 08 09 10 11 12 13 14 15 16 17
normalised diffusion index
Manufacturing confidence
Advanced economies Emerging economies
… and some commodity intensive economies
still recovering

5 December 2017
…which is driving robust demand growth
Timeframes of synchronous global economic growth consistent with acceleration in demand
growth and rising oil prices (Jan 1998-Dec 2017)
-3.0%
-2.0%
-1.0%
0.0%
1.0%
2.0%
3.0%
4.0%
5.0%
0
20
40
60
80
100
120
140
160
98 99 00 01 02 03 04 05 06 07 08 09 10 11 12 13 14 15 16 17
Nom. oil price ($/b), LHS Oil Demand Growth (%, RHS)
syncrhonous global growth
Source: Haver Analytics, IEA, EIA (Imported nominal average acq. cost), Barclays Research
6
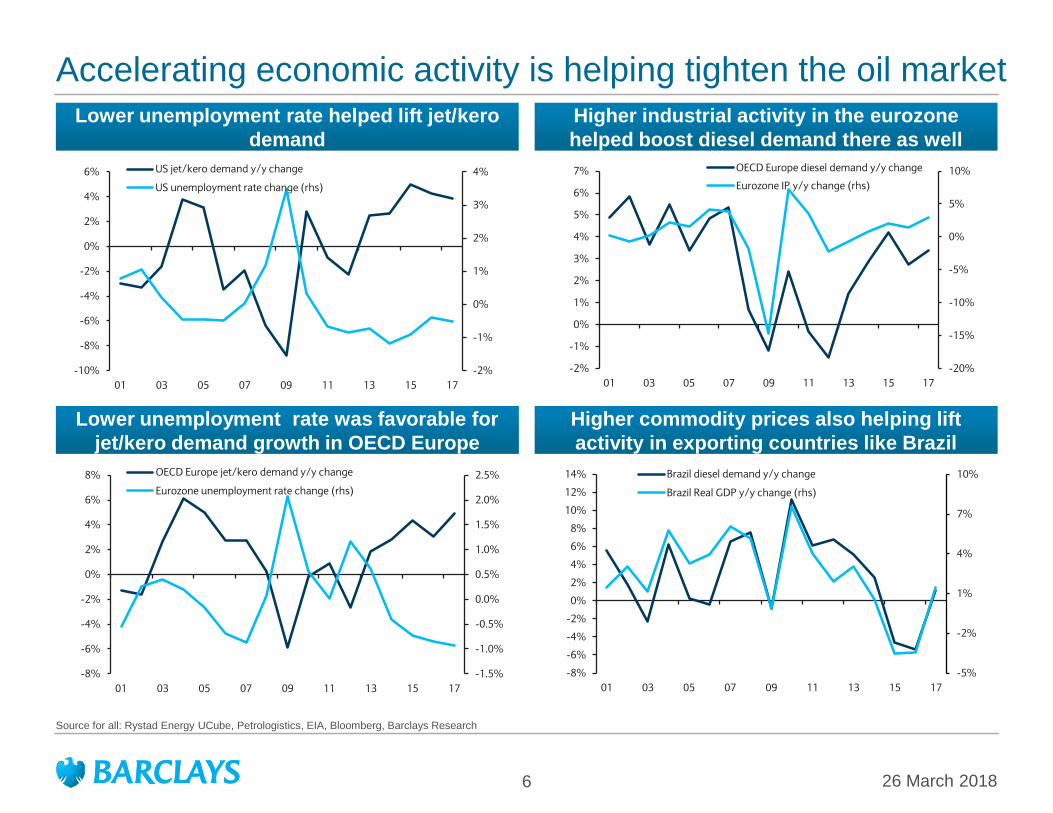
Accelerating economic activity is helping tighten the oil market
Source for all: Rystad Energy UCube, Petrologistics, EIA, Bloomberg, Barclays Research
Higher industrial activity in the eurozone
helped boost diesel demand there as well
Lower unemployment rate helped lift jet/kero
demand
Lower unemployment rate was favorable for
jet/kero demand growth in OECD Europe
Higher commodity prices also helping lift
activity in exporting countries like Brazil
26 March 2018
-2%
-1%
0%
1%
2%
3%
4%
-10%
-8%
-6%
-4%
-2%
0%
2%
4%
6%
01 03 05 07 09 11 13 15 17
US jet/kero demand y/y change
US unemployment rate change (rhs)
-20%
-15%
-10%
-5%
0%
5%
10%
-2%
-1%
0%
1%
2%
3%
4%
5%
6%
7%
01 03 05 07 09 11 13 15 17
OECD Europe diesel demand y/y change
Eurozone IP y/y change (rhs)
-1.5%
-1.0%
-0.5%
0.0%
0.5%
1.0%
1.5%
2.0%
2.5%
-8%
-6%
-4%
-2%
0%
2%
4%
6%
8%
01 03 05 07 09 11 13 15 17
OECD Europe jet/kero demand y/y change
Eurozone unemployment rate change (rhs)
-5%
-2%
1%
4%
7%
10%
-8%
-6%
-4%
-2%
0%
2%
4%
6%
8%
10%
12%
14%
01 03 05 07 09 11 13 15 17
Brazil diesel demand y/y change
Brazil Real GDP y/y change (rhs)

7 26 March 2018
But despite all this, surplus emerges later this year and next
Source: Bloomberg, Barclays Research
We assume robust demand growth and continued declines in Venezuela’s production, but strong
US supply growth this year and next will push the market into surplus
0
20
40
60
80
100
120
140
-1
0
1
2
3
4
1Q12 4Q12 3Q13 2Q14 1Q15 4Q15 3Q16 2Q17 1Q18 4Q18
$/bmb/d per
yearGlobal Supply and Demand Growth
Global Supply Growth (LHS)
Global Demand Growth (LHS)
Brent prices
62
5657 55
20
40
60
80
100
120
-2.0
-1.5
-1.0
-0.5
0.0
0.5
1.0
1.5
2.0
3Q13 2Q14 1Q15 4Q15 3Q16 2Q17 1Q18 4Q18 3Q19
Oil market balance and prices
Stock change + misc (LHS) Brent Price (RHS)

Oil outlook to 2019: Between scarcity and abundance

9
Source for all charts: IEA, EIA, Barclays Research
Non-OPEC supply growth centered entirely on
North America in 2018 and 2019
The Permian will drive production growth over
the coming years (mb/d)
26 March 2018
We forecast 1.9 & 1.2 mb/d of non-OPEC growth in 2018-19
0.4 0.10.1
1.2
0.0
0.5
1.6
2.4
1.5
-0.7
0.8
1.9
1.2
-1.5
-1.0
-0.5
0.0
0.5
1.0
1.5
2.0
2.5
3.0
2007 2009 2011 2013 2015 2017 2019
Non-OPEC Supply Growth
North America (NAM)
Non-OPEC ex-NAM
*Not including OPEC non-crude liquids
779624
127
95
50
75
75
92
204
78
307
248
0
200
400
600
800
1,000
1,200
1,400
1,600
1,800
2018 2019
PermianWilliston Basin -NDEagle FordUS Gulf of MexicoOther CrudeNGLsAlaska

10
Source: Barclays Equity Research Global 2018 E&P Spending Outlook
US output to grow to 11.8 mb/d on rising upstream spend
Most of NAM upstream expects to spend 30%
more in 2018 y/y
0%
10%
20%
30%
40%
50%
60%
70%
80%
US IOCs* US Large-Cap E&Ps US Smid-Cap E&Ps NAM Small-
Cap/Privates
2017 Growth
2018 Growth
0% 1%
9%
72%
15%
3%
0%
10%
20%
30%
40%
50%
60%
70%
80%
Down over
20%
Down 10-20% Down 0-10% Up 0-10% Up 10-20% Up over 20%
0%
10%
20%
30%
40%
50%
60%
0-25% structural 25-50% structural 50-75% structural
Dec 2016 survey
Dec 2017 survey
In 2017, more NAM producers viewed cost
reductions as structural than in 2016…
…Yet 90% of producers expect some degree
of cost inflation this year Ultimately, activity will be driven by oil prices
-100%
-80%
-60%
-40%
-20%
0%
20%
1/24/2014 1/24/2015 1/24/2016 1/24/2017 1/24/2018
Prices
Rigs (4 month ahead)
Frac Spreads (3 month ahead)
Source: Primary Vision Market Intelligence and Consulting, Baker Hughes, Bloomberg, Barclays Research
Note: *Includes Chevron, Exxon Mobil, Hess, ConocoPhillips Source: Barclays Equity Research
Source: Barclays Equity Research Global 2018 E&P Spending Outlook
26 March 2018

11
Source: Company Reports, EIA, DrillingInfo, Barclays Research
26 March 2018
Leading to capacity constraints in strong growth areas
Canadian takeaway capacity looks
constrained until 2019
Tight takeaway capacity in the Permian should
cause Midland-USGC weakness in late 2018
Note: Assumes dilbit volumes (70/30) Source: Company reports, AER, Barclays Research
Enbridge
Express
Keystone
Rangeland
Line 3?
0
500
1,000
1,500
2,000
2,500
3,000
3,500
4,000
Q1 2012 Q1 2014 Q1 2016 Q1 2018
Canadian Production vs Takeaway
AB and SK Heavy Oil
Trans Mountain
Refining
Pre-2017
Pipelines
0
1
2
3
4
5
6
Jan-16 Jan-17 Jan-18 Jan-19
mb/d Recent Announcements*
Midland-Sealy & PE 3
Permian Production

12
Saudi public expenditures have already been
sharply cut post-2014
December 2017
Pillars of OPEC strategy #1: Tradeoff between long/short term revenue maximization
Source: Haver Analytics, SAMA, Barclays Research
Focus on the flexible four: UAE, Kuwait, Saudi
Russia. Most others producing at status quo Saudi fiscal breakeven at around $74/b
Most MENA countries have fiscal BEs around
current price levels
-800
-400
0
400
800
1,200
Feb-16 Aug-16 Feb-17 Aug-17 Feb-18 Aug-18
OPEC/NOPEC Production Levels
(Jan 2016=0)
Flexible four: Russia, Saudi, UAE, Kuwait
Other participants
swing of 1.4 mb/d
0
20
40
60
80
100
120
1999 2001 2003 2005 2007 2009 2011 2013 2015 2017
Oil price fiscal breakeven, $bbl
Arab light
Fiscal
breakeven
Including
contractor
arrears
0
20
40
60
80
100
120
0
50
100
150
200
250
300
350
400
1969 1975 1981 1987 1993 1999 2005 2011 2017
Capital expenditure
Arab light
SAR Billion $bbl
Source: IMF, 2017, Barclays Research.
$63
$98
$59 $57 $50
$91$79
$55
$74$59
0
50
100
150
200
250
Algeria Bahrain Iran Iraq Kuwait Libya Oman Qatar Saudi
Arabia
UAE
2014 2015 2016 2017 2018

13 December 2017
Pillar #2: Fragile producers deliver high overall compliance
Source: EIA (map), IEA (production), Petrologistics (exports), Barclays Research
Trump’s Iran policy – death by a thousand cuts to the JCPOA. Working class protests pose a
more serious problem to the regime and some protests centered near energy infrastructure
6%
5% 5%
3%
3% 3%3%
4% 4%4%
5% 5%
2%
1% 1% 1%
3%4%
0%
1%
2%
3%
4%
5%
6%
7%
2009 2010 2011 2012 2013 2014 2015 2016 2017
Iran Market Share in Asia and Europe (2009-16)
Asia Europe
Top annual
exports2017 Ave Wiggle Room
China 602 584 18
France 127 127 -
Greece 86 86 -
India 467 446 22
Italy 196 196 -
Japan 348 119 229
Malaysia 17 1 15
Netherlands 117 31 86
Pakistan 35 0 35
South Africa 119 0 119
South Korea 237 104 133
Spain 110 93 17
Sri Lanka 39 0 39
Taiwan 65 39 25
Syria, Turkey, Phillippines 312 270 42
0.5
1.0
1.5
2.0
2.5
3.0
3.5
4.0
09 10 11 12 13 14 15 16 17 18
Iranian Crude Output and Exports

Energy security metric Unit Nov-02 Jun-17 Better/Worse*
Spare Capacity mb/d 3.68 2.01 Worse
Spare Capacity/Demand ratio 5% 2% Worse
OECD Inventory cover days 32.7 30.3 Worse
US crude throughput cover days 17.5 25.1 slightly better**
US crude and cond. output kb/d 7,975 13,294 Better
US Import share ratio 13% 8% Better
US oil imports from Venezuela kb/d 1,447 796 Better
Venezuela Production kb/d 2,745 2,000 Better
Venezuela output as share of global heavy output ratio 18% 14% Better
*in terms of being better/worse off in the case of a disruption. **though inventory levels are higher, some of
the increase is due to higher inventory needs for more pipeline and infrastructure capacity.
14 December 2017
Sanctions accelerating Venezuela’s production decline
Source: for all: Rystad Energy UCube, Petrologistics, EIA, Barclays Research,
Revenues remain depressed as production
declines have offset higher prices
Production is expected to decline 50-100 kb/d
m-o-m in 2018.
Markets likely better prepared for a Venezuela
disruption than it was in 2002
PDVSA controls the lion’s share of production
(kb/d)
0.0
0.5
1.0
1.5
2.0
2.5
3.0
3.5
2005 2007 2009 2011 2013 2015 2017
mb/d<20 20-30 >30 NGLs
0
5
10
15
20
25
30
35
0
500
1,000
1,500
2,000
2,500
3,000
3,500 Production (lhs, kb/d)
Consumption (lhs, kb/d)
Revenues (rhs, $bn)
Company 2010 2011 2012 2013 2014 2015 2016
Shell 10 20 20 20 20 20 20
Chevron 80 80 90 90 90 90 80
Repsol 20 30 30 30 20 30 30
CNPC 10 20 20 20 20 30 30
PetroChina 20 20 20 30 30 30 30
Total 40 40 40 40 40 40 30
Rosneft 40 40 50 60 60 60 70
Gazprom 100 90 90 80 90 60 50
Others 70 80 80 110 110 130 130
PDVSA 2,220 2,260 2,210 2,150 2,050 2,060 1,880
15
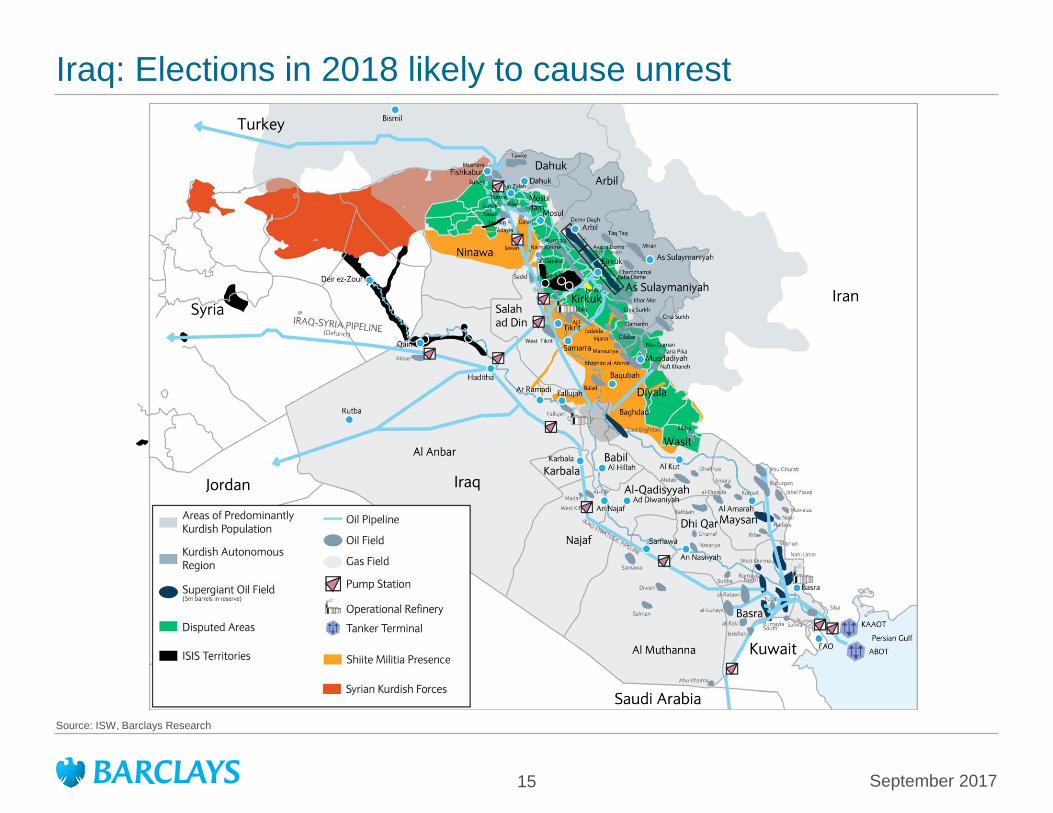
Source: ISW, Barclays Research
September 2017
Iraq: Elections in 2018 likely to cause unrest

16
Note: Military dispositions represent location of forces, not their relative strength which is variable. Source: Petroleum Economist, Barclays Research
Libya’s western exports are captive to the free flow of oil to Zawiyah, while the Sirte basin fields
have more alternatives
September 2017
Libya: Output likely to improve/decline in fits and starts
AG – Arabian Gulf Oil Co
Ak – Akakus Oil Co
AO – Agip Oil Co
HO – Harouge Oil
MO – Mabruk Oil
SO – Sirte Oil Co
WO – Waha Oil Co
Wi – Wintershall
ZO – Zueitina Oil
A – Amazigh
BDB – Benghazi Defence Brigades
LNA – Libya National Army
M – Misrata
SC – Shura council
SCM – Shura Council of Mujahideen (Allied to AQ)
T – Tebu Militia
Trp – Tripoli Militias
Za – Zawiyah
Zi – Zintan
Libya Dawn
Operation Dignity
Islamist
Petroleum
Facilities Guard
Libyan
National Guard
T
LNA
BDB PFG
LNA
PFG LNA
M
LNA
Zi
Zi
Zi
Za
A
Za Za
Trp LNG
PFG LNA
M
LNALNA LNA
LNA
SCM
LNA
LNA
LNA PFG
SC LNA ISIS
M
AO
Ak
ZO
HO
MO
ZOWO
WO
SO
SO
WO
HO
SOZO
WO
WOAG
Wi
MO
Ind
Zawara
Mellitah
Riyayna
Zintan
Zawiyah
Tripoli (Tarabulas)
Nalut
Ghadames
Ghat
Awbari
Murzuq
Sabha
Al Khums
Misrata
Sirte
Sidra
(Es-Sider)
Brak
Ras Lanuf
Marada
Ujala
Marsa el Brega
Ajdadiya
Zueitina
Benghazi
Al BaydaDerna
Tobruk
(Hariga)
What Jalu
Sarir RefineryGMMR Power
Station
Sharara
El Feel
(Elephant)
En Naga
Sabah
Zella
GhaniJofra
Al MabrukBahi
Dahra
Tibisti
Raguba
Nasser
SamahDefa
Waha S
Amal
Intisar
Gialo
Mesla
Sarir
Al Jurf
WafaWaddan
Libya
Tunisia
Murzuq Basin
Sirte Basin
Sarir/Mesla
Oilfield
Oil Pipeline
Oil Refinery
Oil Storage
Tanker Terminal
Active Front Line
Zawiyah
Max refining/export
capacity 200,000 b/d
NOC
Mellitah
Export capacity 30,000 b/d
NOC/ENI
Es-Sider
Export capacity 447,000 b/d
NOC
Ras Lanuf
Max refining/export
capacity 220,000 b/d
NOC
Zueitina
Export capacity 200,000 b/d
NOC/Occidental/OMV
Brega
Max refining/export
capacity 51,000 b/d
NOC
Hariga
Export capacity 120,000 b/d
AGOCO-NOC

17
Source for all charts: Bloomberg, CDU-TEK, IEA, CNH, ANP, WoodMackenzie, Barclays Research
December 2017
Pillar #3: Include as many non-OPEC countries as possible
Russia has substantial incremental output potential but subject to brownfield declines
Mexico’s production declining anyway
Field Operator 2017 2018 201918
Growth
19
Growth
Urengoy (Rospan), Cond. Rospan International 29 74 96 45 21
Novoportovskoye Gazpromneft-Yamal 90 120 128 30 8
Vladimir Filanovski LUKOIL Nizhnevolzhskneft 90 114 126 24 12
Odoptu-More (Sakhalin) ExxonMobil 43 66 71 22 5
East Urengoy Rospan International 4 26 38 22 12
Yurubcheno-Tokhomskoye Vostsibneftegaz 12 32 90 20 58
East Messoyakhskoye Messoyakhaneftegaz 40 60 85 20 25
Srednebotuobinskoye Cntl Taas-Yuryakh 27 47 78 20 31
Prirazlomnoye (TP) Gazprom neft shelf 50 65 75 15 10
Orenburg (East) Gazpromneft-Orenburg 37 52 67 15 15
Total* 423 657 853 233 196
-400
-300
-200
-100
0
100
200
300
400
500
9.8
10.0
10.2
10.4
10.6
10.8
11.0
11.2
11.4
Jan-14 Sep-14 May-15 Jan-16 Sep-16 May-17
Th
ou
san
ds
Russian Output
y/y growth (RHS, kb/d) Output C&C (mb/d), LHS
1800
2100
2400
2700
3000
3300
3600
0
20
40
60
80
100
120
140
160
05 06 07 08 09 10 11 12 13 14 15 16 17
New Dev. Drilling/m (LHS) Production
Canada and Brazil to pose challenges in 2018
1600
2000
2400
2800
3200
-400
-200
0
200
400
600
Jan-13 Oct-13 Jul-14 Apr-15 Jan-16 Oct-16 Jul-17 Apr-18
Brazil Production by Basin
Santos Campos Other Total (RHS)

18
Source : Bloomberg, EIA, Barclays Research
December 2017
2018 outlook: OPEC strategy for the shale age still evolving
Higher spare capacity in 2017. May decline in
2018 and induce contango
US supply is more elastic than assumed: 1+
mb/d of US tight liquids growth in 2018
1. Commentary should focus more on demand drivers
2. OPEC/Non-OPEC Dec. of Cooperation is signaling mechanism that won’t be scrapped
3. Just as during price decline, OPEC testing symmetry and degree of shale response.
4. OPEC strategy balancing short and long term revenue maximization, collectively.
Seeking relatively high and stable prices not price fluctuations.
0.0%
0.5%
1.0%
1.5%
2.0%
2.5%
3.0%
3.5%
-3
-2
-1
0
1
2
3
4
Jan-12 Jan-13 Jan-14 Jan-15 Jan-16 Jan-17 Jan-18
Spare Capacity and Brent Time Structure
Brent M1-M3 (LHS) Spare Capacity/Demand
$63
$52 $55
$-
$10
$20
$30
$40
$50
$60
$70
0
200
400
600
800
1,000
1,200
1,400
1,600
Jan-15 Jul-15 Jan-16 Jul-16 Jan-17 Jul-17
Completions Y+1 Calendar Avg Price
With prices above $50 ...
...the rate of completions
picked up

19
Source: IEA (history), Barclays Research
Oil fields naturally decline, but new additions mitigate the field/basin/country-level declines
Production outside the US comes from multiple locations
26 March 2018
-400
-200
0
200
400
600
800
Ca
na
da
Bra
zil
Ka
zak
hsta
n
Oth
er F
SU
Au
stralia
UK
Oth
er N
on
-OE
CD
Am
eric
as
Ind
ia
Ind
on
esia
Vie
tna
m
Eg
yp
t
Co
lom
bia
Ch
ina
Me
xic
o
kb/d
Production Growth/Decline outside US (2018 and 2019)
18 v 17 19 v 18
US production not shown
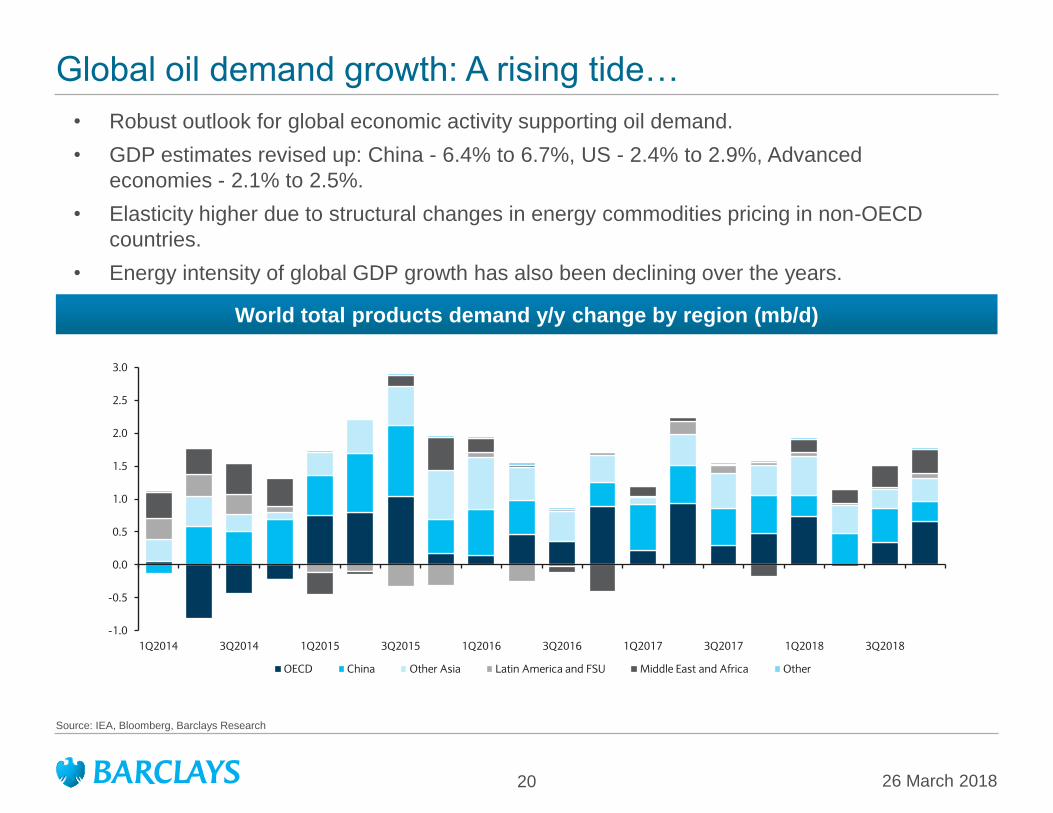
Global oil demand growth: A rising tide…
Source: IEA, Bloomberg, Barclays Research
World total products demand y/y change by region (mb/d)
20
• Robust outlook for global economic activity supporting oil demand.
• GDP estimates revised up: China - 6.4% to 6.7%, US - 2.4% to 2.9%, Advanced
economies - 2.1% to 2.5%.
• Elasticity higher due to structural changes in energy commodities pricing in non-OECD
countries.
• Energy intensity of global GDP growth has also been declining over the years.
26 March 2018
-1.0
-0.5
0.0
0.5
1.0
1.5
2.0
2.5
3.0
1Q2014 3Q2014 1Q2015 3Q2015 1Q2016 3Q2016 1Q2017 3Q2017 1Q2018 3Q2018
OECD China Other Asia Latin America and FSU Middle East and Africa Other

21
Accelerating economic activity is helping tighten the oil market
Source for all: Rystad Energy UCube, Petrologistics, EIA, Bloomberg, Barclays Research
Higher industrial activity in the eurozone
helped boost diesel demand there as well
Lower unemployment rate helped lift jet/kero
demand
Lower unemployment rate was favorable for
jet/kero demand growth in OECD Europe
Higher commodity prices also helping lift
activity in exporting countries like Brazil
26 March 2018
-2%
-1%
0%
1%
2%
3%
4%
-10%
-8%
-6%
-4%
-2%
0%
2%
4%
6%
01 03 05 07 09 11 13 15 17
US jet/kero demand y/y change
US unemployment rate change (rhs)
-20%
-15%
-10%
-5%
0%
5%
10%
-2%
-1%
0%
1%
2%
3%
4%
5%
6%
7%
01 03 05 07 09 11 13 15 17
OECD Europe diesel demand y/y change
Eurozone IP y/y change (rhs)
-1.5%
-1.0%
-0.5%
0.0%
0.5%
1.0%
1.5%
2.0%
2.5%
-8%
-6%
-4%
-2%
0%
2%
4%
6%
8%
01 03 05 07 09 11 13 15 17
OECD Europe jet/kero demand y/y change
Eurozone unemployment rate change (rhs)
-5%
-2%
1%
4%
7%
10%
-8%
-6%
-4%
-2%
0%
2%
4%
6%
8%
10%
12%
14%
01 03 05 07 09 11 13 15 17
Brazil diesel demand y/y change
Brazil Real GDP y/y change (rhs)

Natural Gas Outlook

23
Storage levels entered winter (end October) at 5%
above the five-year average and are now 16%
below the five-year average
Storage levels are on pace to end March at their lowest level since 2014
Source for both charts: EIA, Bloomberg, Barclays Research
Current March forecasts suggest a total winter
2017-18 that will come in 2% warmer than the 10-
year average but 12% colder than last winter
March 2018
0
500
1,000
1,500
2,000
2,500
3,000
3,500
4,000
Winter '17-'18
forecast
Winter '16-'17 10-year
HDDs
Nov Dec Jan Feb Mar Total
-25%
-20%
-15%
-10%
-5%
0%
5%
10%
15%
20%
25%
Jan
-17
Fe
b-1
7
Ma
r-1
7
Ap
r-1
7
Ma
y-1
7
Jun
-17
Jul-
17
Au
g-1
7
Se
p-1
7
Oct
-17
No
v-1
7
De
c-1
7
Jan
-18
Fe
b-1
8
Ma
r-1
8

24
…resulting in more gas in storage, which has, in
turn, weighed on prices
The eternal struggle for US gas: Too much gas not enough demand
Source for both charts: EIA, Bloomberg, Barclays Research
The shale revolution has increased the spread
between total supply and total demand…
March 2018
-50
-40
-30
-20
-10
0
10
20
Jan
Ap
r
Jul
Oct
Jan
Ap
r
Jul
Oct
Jan
Ap
r
Jul
Oct
Jan
Ap
r
Jul
Oct
Bcf/d
2005-2009 2010-20140.00
1.00
2.00
3.00
4.00
5.00
6.00
7.00
8.00
3,200
3,300
3,400
3,500
3,600
3,700
3,800
3,900
4,000End Octobber storage (RHS)
Henry Hub Avg
$/MMBtu Bcf
'05-'09 '10-'14 '15-'17

27
The build out in the US will make it a top three
global LNG exporter by 2020
The global LNG industry is in the middle of one of the larger build outs ever
Source for both charts: GIIGNL, Barclays Research
We forecast global LNG supply to grow from
295MMt in 2017 to around 354 MMt in 2020
0
50
100
150
200
250
300
350
400
20
00
20
01
20
02
20
03
20
04
20
05
20
06
20
07
20
08
20
09
20
10
20
11
20
12
20
13
20
14
20
15
20
16
20
17
20
18
20
19
20
20
MMt/y Forecast
2000-04
CAGR 5%
2005-09
CAGR 5.2%
2010-14
CAGR 1.6%
2015-20
CAGR 7%
Qatari build out
Aussie/ US buildoutCountry
2015
market
share
Country2020
market
share (F)Qatar 32% Australia 22%
Australia 12% Qatar 21%
Malaysia 10% US 14%Nigeria 8% Malaysia 8%
Indonesia 7% Nigeria 6%
Algeria 5% Russia 4%
Trinidad 5% Indonesia 4%
Russia 4% Trinidad 4%
Oman 3% Algeria 3%
Papua NG 3% Oman 2%
March 2018
Australia

26
Incremental demand growth will slow in 2018
relative to 2017. Price rebound in 2020 is highly
dependent on LNG export levels
Exports to Mexico and power burn have also offered incremental demand for gas
Source for both charts: EIA, Bloomberg, Barclays Research
Exports to Mexico have increased steadily but are
limited by downstream pipes and CCGTs in
Mexico
March 2018
0.0
0.5
1.0
1.5
2.0
2.5
3.0
3.5
4.0
4.5
20
05
20
06
20
07
20
08
20
09
20
10
20
11
20
12
20
13
20
14
20
15
20
16
20
17
Bcf/d
0.9
0.40.5
0.3 0.3
0.7
1.6
1.3
2.2
2.7
0.00
0.50
1.00
1.50
2.00
2.50
3.00
2016 2017 2018 2019 2020
Bcf/d
Mexico P/L LNG

27
Gas and renewables have gained as coal
generation has moved lower
Overall, electricity demand in the US has been relatively static
Source for both charts: EIA, Bloomberg, Barclays Research
Total generation in the US has showed limited
growth
March 2018
0
50,000
100,000
150,000
200,000
250,000
300,000
350,000
400,000
450,000
Jan
-08
Se
p-0
8
Ma
y-0
9
Jan
-10
Se
p-1
0
Ma
y-1
1
Jan
-12
Se
p-1
2
Ma
y-1
3
Jan
-14
Se
p-1
4
Ma
y-1
5
Jan
-16
Se
p-1
6
Ma
y-1
7
Gwh
0%
10%
20%
30%
40%
50%
60%
2008 2009 2010 2011 2012 2013 2014 2015 2016
Gas Coal Wind/Solar

28
Large y/y ramp up in pipeline capacity will
support higher production levels out of the
Northeast
Northeast production grows as increased levels of take away capacity come online
Source: Bloomberg, EIA, Platts, Barclays Research
After some 2017 delays, major northeast pipes
seem ready to ramp up in 2018
0
5
10
15
20
25
30
Jan-16 Jan-17 Jan-18
Bcf/d
-Rex Z3
-Tetco projects-Atlantic Sunrise 1-Leach Xpress- Rover phased in
-Atlantic Sunrise 2-Bayway Lateral-Nexus
-Mountaineer Xpress- WB Xpress
March 2018
2017 additionsCapacity
(MMcf/dStatus Date
Access South 320 Online
Adair Southwest 200 Online
Lebanon Extension 102 Online
Leach Xpress 1500 Online
Rover 1A & 1B 1625 Online
Total 3,747
2018
Rover 1625Full approvals for phase
two except TuscawarasQ2 '18
Nexus 1500 Under Construction 2H '18
Atlantic Sunrise 1700 Under Construction Summer '18
Bayway Lateral 300 Awaiting FERC 2H '18
Mountaineer
Xpress2700 Waiting on approvals Q4 '18
Mountain Valley 650Received FERC notice to
proceed in early JanQ4 '18
Total 8,475

29
Over 10 Bcf/d of takeaway capacity from the
Permian
Permian associated gas production continues to move higher as the oil directed rig count has grown
Source: Barclays Research
We expect that Permian production will cross
10 Bcf/d this year
Proposed PipelinesCapacity
(MMcf/d)Date Origin Destination
Pecos Trail 1850 2Q 19 Reeves County Agua Dulce
Gulf Coast Express 1700 2H19 Waha Agua Dulce
Enterprise Unnamed 1500 2H19 Waha Agua Dulce
0
2,000,000
4,000,000
6,000,000
8,000,000
10,000,000
12,000,000
14,000,000
2011 2012 2013 2014 2015 2016 2017 2018 2019 2020
MMcf/d
March 2018
North Outlet
Capacity
(MMcf/d
)
Utilization
NGPL 150
NNG 500
EPNG 300
Total North 950 ~30%
Mexico Outlet
Roadrunner 570
Comanche 1100
Trans-Pecos 1400
Total Mexico 3070 ~5%
West outlet
EPNG 2400
Transwester 500
Total West 2900 ~80%
East Outlet (Hou
ship/Katy)
Oasis 1200
KMTP 200
EDP/DCP 800
East-Dallas
Atmos-Texas 800
EDP Texas-ETP
Fuel800
Total East 3800 ~80%

30
We expect associated gas production growth
of almost 3.2 bcf/d this year
An average horizontal well in the Permian
yields about 140 kb of oil over 12 months…
March 2018
Associated gas production: How sensitive to oil?
…and about 300 MMcf of associated gas
production
Most of this growth will come from increased
activity in the Permian region
Source for all charts: DrillingInfo, EIA, Barclays Research
Pre-2013
20132014
20152016
2017
0
2
4
6
8
10
12
Q1 13 Q1 14 Q1 15 Q1 16 Q1 17 Q1 18
2018
0
50
100
150
200
250
300
2013 2014 2015 2016E 2017E
0
20
40
60
80
100
120
140
160
2013 2014 2015 2016 2017E
Region 2016 2017E 2018E 2017E 2018E
Permian 7.12 8.31 10.21 1.18 1.90
Rockies 8.12 7.96 8.29 (0.16) 0.33
Eagle Ford 7.01 6.15 6.39 (0.87) 0.24
Bakken 1.71 1.82 2.20 0.11 0.38
Scoop/Stack 2.78 3.05 3.36 0.27 0.31
Y/y changeAssociated gas production (bcf/d)

28
Lower oil prices have slowed LNG FIDs. Just one FID in 2017 (Coral LNG 3.4 MMt)
Source for both charts: GIIGNL, Barclays Research
Sabine Pass
Cove Point
Cameron
Corpus
0
20
40
60
80
100
120
140
160
2000–05 2006–10 2011–14 2015-16
MMt/y
Middle East Australia Other Pacific United States Other Atlantic Total
Brent $33.29 Brent $75.17 Brent $107.60 Brent $47.83
Qatari mega train build-out
March 2018

Natural gas balances
Source: Barclays Research
26 March 2018 37
2013 2014 2015 2016 2017 2018E 2013 2014 2015 2016 2017 2018E
Supply - total (Bcf/d) 69.0 73.2 75.8 73.8 72.3 76.7 0.1 4.2 2.6 (2.0) (1.5) 4.4
US L-48 production 65.4 70.0 73.2 71.9 72.6 79.1 0.7 4.6 3.2 (1.3) 0.7 6.4
Canadian Exports to US, net 5.1 5.1 5.3 5.9 5.6 5.6 (0.3) (0.0) 0.2 0.6 (0.3) (0.0)
US LNG imports, net 0.3 0.1 0.2 (0.3) (1.7) (3.2) (0.1) (0.1) 0.1 (0.4) (1.5) (1.5)
Exports to Mexico 1.8 (2.0) (2.9) (3.8) (4.2) (4.7) 0.1 (3.8) (0.9) (0.9) (0.5) (0.5)
Demand - total (Bcf/d) 71.7 73.0 74.8 75.1 74.2 76.6 4.6 1.2 1.8 0.3 (0.9) 2.4
Residential & Commercial 22.5 23.6 21.6 20.4 20.9 21.3 3.3 1.0 (2.0) (1.2) 0.5 0.4
Industrial 20.4 21.0 20.6 21.1 21.7 22.0 0.6 0.6 (0.3) 0.5 0.6 0.3
Power 22.4 22.3 26.3 27.3 25.3 26.3 (2.5) (0.1) 4.0 0.9 (2.0) 1.0
Other 6.4 6.2 6.3 6.4 6.4 7.0 0.5 (0.3) 0.1 0.1 0.0 0.6
Storage Inventories (Tcf)
End of March 1.7 0.9 1.5 2.5 2.1 1.4 (0.8) (0.9) 0.6 1.0 (0.4) (0.6)
End of October 3.8 3.6 3.9 4.0 3.8 3.9 (0.1) (0.2) 0.4 0.1 (0.2) 0.1
2013 2014 2015 2016 2017 2018E Q3 Q4 Q1 Q2 Q3 Q4
3.73 4.37 2.61 2.48 2.96 3.01 2.94 2.89 3.12 3.23 3.01 2.69
A nnual av erage y/y change
A nnual av erage
Natural gas price ($/MMBtu)
2017 2018E

Medium-term oil price outlook

34
Source: Barclays Research
Global supply is set to grow at an average pace of 1 mb/d through 2025
Most of the growth will come from US tight oil (+810 kb/d y/y); OPEC is expected to add 240 kb/d
y/y on average, while the rest of the supply stack is set to remain flat
26 March 2018
890
780
740
760
740840
$60
$57 $55
$70
$60
$73
$0
$10
$20
$30
$40
$50
$60
$70
$80
-1,000
-500
0
500
1,000
1,500
2,000
2,500
2018 2019 2020 2021 2022 2023 2024 2025
OPEC
US Tight Oil
Other Non-OPEC
Brent ($/bbl, rhs)
MEID

35
Source for all charts: IMF, IEA, Bloomberg, Barclays Research
Annual supply revisions continue to outpace
higher demand expectations
Non-OPEC supply (ex US tight oil and
Canadian Oil Sands) remains flat through 2021
Supply gap thesis is valid, but it is deferred and not as big
0.0
0.5
1.0
1.5
2.0
2.5
2015 2016 2017 2018 2019 2020
Revisions from July 2016 Medium Term
Global Supply Demand
~500 kb/d of the change
is due to change in
baseline expectations
~1 mb/d due to change
in near term forecast
expectations
26 March 2018
0
5
10
15
20
25
30
35
40
45
50
2010 2012 2014 2016 2018 2020 2022 2024
Non-OPEC non-tight oil or oil sands
production
by start time at $55 Brent
Pre-2010 2011-2017 2018-2021
mb/d
at $70/b

36
Note: WoodMackenzie assumes 15% cost of capital, WTI equivalent prices, half cycle breakeven. Source: WoodMackenzie, Barclays Research.
Nearly 85% of the cost base is below $60/bl at a 15% IRR; breakevens have fallen a further 15%
just in the last year
Woodmac resource base assessments keep growing y/y
$0
$20
$40
$60
$80
$100
$120
0 10,000 20,000 30,000 40,000 50,000 60,000 70,000 80,000
Q3 2014
Q3 2015
Q3 2016
Q3 2016
Q3 2017
WTI Breakeven at 15% IRR ($/bbl)
Cumulative commercial liquids resource (mmboe)
26 March 2018

37
• Our estimates are based on higher world GDP growth, coupled with lower unemployment
rates in developed countries and rising per capita income levels in the developing world.
• Transport remains the key growth driver, contributing more than three-fourths to the net
consumption increase, as increasing private vehicles density, trucking and air miles
travelled more than offset the effect of growing electric vehicle sales and fuel efficiency.
In our base case, we expect global liquids demand to grow to about 106.2 mb/d by 2025
Source: IEA, WIND , Bloomberg, Barclays Research
-1.0
-0.5
0.0
0.5
1.0
1.5
2.0
2.5
2013 2014 2015 2016 2017 2018 2019 2020 2021 2022 2023 2024 2025
U.S. Europe
China India
ROW World (Base Case)
World (Low GDP Growth) World (Mobility Revolution)
Liquids demand growth (mb/d)
26 March 2018

38
• Use of oil products to produce petrochemicals to grow at 2% CAGR over the medium
term
• Aviation: growing air passenger miles resulting from improved affordability around the
world due to declining unemployment in the developed world, rising per capita income
levels in developing countries and lower fuel costs
In our base case, we expect global liquids demand to grow to about 106.2 mb/d by 2025
Source: IEA, WIND , Bloomberg, Barclays Research
90
92
94
96
98
100
102
104
106
108
Cars
Other
Transport
Petchem
Power
Other
20
16
20
25
Process
Heating
Trucks
20
16
26 March 2018

39
Transport drives most of the demand growth in our base case, despite fuel efficiency gains and rapid growth in EVs
2016 Oil demand by end-use
Transport
56%
Petrochemical
12%
Power
5%
Process Heating
6%
Other
21%
Source for all charts: IMF, IEA, BP, Bloomberg, Barclays Research
Ownership increases as income rises
Higher ownership rates drive continued
increase in car stock
U.S.Germany
U.K.Russia
MexicoChina
BrazilSouth
Africa
Indonesia
India
6
8
10
12
3 4 5 6 7
Ln
(PP
P G
DP
pe
r c
ap
ita
-4
50
0 U
SD
)
Ln(Passenger cars per 1000 capita)
800
850
900
950
1,000
1,050
1,100
1,150
1,200
1,250
1,300
2016 2017 2018 2019 2020 2021 2022 2023 2024 2025
Global car stock (millions)
26%
18%
6%5%
1%
7%
12%
8%
6%
12%Road Passenger Vehicles
Road Freight
Aviation
Maritime
Other Transport
Steam/Proc. Heat
Petchem Feeds.
Buildings
Power Gen
Other
26 March 2018

40
Electric vehicle summary
26 March 2018
• Road passenger transport and road freight account for roughly 45% of oil demand.
• Electric vehicles are making inroads into passenger and freight fleets but have too little market
share today to move the needle on oil demand.
• Fuel efficiency improvements will likely play a much larger role than EV penetration in demand
destruction over the next 5-10 years.
• We estimate that oil demand from passenger transport should increase 2.7 mb/d from 2016-25
after accounting for EV penetration (-1 mb/d) and fuel efficiency gains (-2.6 mb/d).
• EV penetration (% of car fleet) should increase twenty-fold from 2016-25 to 4.3% despite
declining subsidy programs (Barclays estimate). There are several factors that will drive this
trend
• Government policies discourage ICE vehicle usage through restrictions and bans
• Battery technology should continue to improve, helping lower EV costs to levels competitive
with ICE counterparts
• The number of EV models will likely expand rapidly in the coming years as auto
manufacturers dedicate more resources to this growing market
• Transport-as-a-service, pooling, and autonomous driving technology should lower the overall
cost of EV usage and could significantly alter the current individual vehicle ownership model.
The authoring analysts would like to thank Amarpreet Singh for his assistance with the preparation of this presentation.

41
EV car sales have gone parabolic…
Source for both charts: Based on IEA data from Global EV Outlook 2017 © OECD/IEA 2017, www.iea.org/statistics. License: www.iea.org/t&c; as modified by Barclays Research, EV-Volumes.com,
Barclays Research
26 March 2018
BEVs have been gaining market share versus
PHEVs in recent years
China accounted for roughly half
of EV sales in 2017
150%
70%
60%
70%
40%
60%
0
200
400
600
800
1,000
1,200
1,400
2011 2012 2013 2014 2015 2016 2017E
China
Japan
Europe
USA
Others
0%
10%
20%
30%
40%
50%
60%
70%
80%
90%
0
200
400
600
800
1,000
1,200
1,400
2011 2012 2013 2014 2015 2016 2017E
BEV
PHEV
% BEV (rhs)

42
… and the EV car fleet is expanding at a rapid pace…
26 March 2018
The global EV fleet more
than doubled since 2015
China’s EV fleet surpassed
the US and Europe in 2016
280% 180%110%
80%
80%
60%
60%
0
500
1,000
1,500
2,000
2,500
3,000
3,500
2010 2011 2012 2013 2014 2015 2016 2017E
China
Japan
Europe
USA
Others
Source for both charts: Based on IEA data from Global EV Outlook 2017 © OECD/IEA 2017, www.iea.org/statistics. License: www.iea.org/t&c; as modified by Barclays Research, EV-Volumes.com,
Barclays Research
0%
20%
40%
60%
80%
100%
120%
0
500
1,000
1,500
2,000
2,500
3,000
3,500
2010 2011 2012 2013 2014 2015 2016 2017E
BEV
PHEV
% BEV (rhs)

99%
EV % of sales
ICE & Others
43
… but perspective is needed
26 March 2018
EVs have gained sizable market share
in some countries (% of sales)…
… but EVs represented only 1%
of the total car sales in 2016…
0%
5%
10%
15%
20%
25%
30%
35%
2011 2012 2013 2014 2015 2016
Norway
Netherlands
Sweden
France
United Kingdom
China
Source for both charts: Based on IEA data from Global EV Outlook 2017 © OECD/IEA 2017, www.iea.org/statistics. License: www.iea.org/t&c; as modified by Barclays Research, EV-Volumes.com,
Barclays Research
99.8%
Evs % of fleet
ICE & Others
… and represent a small fraction of the total
car fleet

Country Purchase Incentives* Other incentives*
Canada Provincial incentives of $6-13k Various provincial exemptions from fees
including on toll roads, parking, etc.
China Tax exemptions of up to ~$8k, with local tax exemptions as well. Certain programs provide
free license plates to EV purchasers (normally $15,000, allotted by lottery system)
Increased road access and free parking
Denmark Registration tax reductions
France Bonus of up to $11k for BEVs when diesel car retired. Up to $4k for PHEV when diesel car
retired.
Germany Up to $4.4k for BEV and $3.3k for PHEV. Subsidy funding split between government and
automaker
Increased road access and free parking
India Rebates or exemptions from VAT and registration tax exist but vary by state level
Japan Up to $7.7k subsidy, dependent on battery size Increased road access and fee waivers
Netherlands BEVs exempt from registration tax and ownership tax, PHEVs receive 50% reduction in
ownership tax
Norway Exempt from purchase tax, and BEVs exempt from VAT Toll- and ferry-fee waivers and free parking
South Korea National subsidies of $12.3k for BEVs and $4.4k for PHEVs. Local subsidies ranging from
$2.7k to $10.6k. Tax reductions of $3.5k for BEVs and $2.4k for PHEVs.
Sweden Rebates of $4.5k for BEVs and $2.3k for PHEVs. Circulation tax exemptions for low
emissions EVs of up to $340 per year
United Kingdom Subsidies of $5.8k for BEVs and $3.3k for PHEVs. Excise tax exemption for BEVs and
reduction for PHEVs
Increased road access, exemption from
congestion fees, and free parking
United States National tax credits of $2.5-7.5k. State level rebates and tax exemptions also offered
44
EV uptake has relied on government incentive programs
26 March 2018
Note. *May not include all incentives or recent changes to subsidy programs. Source: Based on IEA data from Global EV Outlook 2017 © OECD/IEA 2017, www.iea.org/statistics. License:
www.iea.org/t&c; as modified by Barclays Research, Government websites, Barclays Research

Continued cost reductions and rising utility
Source: Bloomberg New Energy Finance, Boston Consulting Group, Tesla, Ford, Barclays Equity Research The Battery Revolution September 2015
26 March 2018 45
• EV battery costs expected to fall further
• ‘Transport as a Service’ to cut cost per mile traveled, challenge traditional vehicle
ownership model
• Autonomous technology to increase utility
Forecasts call for battery costs to decline ~40% by 2020 and ~55% by 2025
as scale of production increases and technology improves
156 140
130 10690
120 80 70$0
$200
$400
$600
$800
$1,000
$1,200
2010 2012 2014 2016 2018 2020 2022 2024 2026 2028 2030
Observed prices ($/kWh)
BNEF
Barclays
BCG Base
BCG Low

Falling battery costs and expanding charging infrastructure
Source: Bloomberg New Energy Finance, Barclays Research
26 March 2018 46
Battery costs have fallen by 2/3 since 2012 Charging capacity continues to expand
0
1
2
3
4
5
6
7
8
9
0
50
100
150
200
250
300
350
2010 2011 2012 2013 2014 2015 2016
Thousands
Fast Charge
Slow Charge
EVs:Public Chargers
(rhs)
Source: Based on IEA data from Global EV Outlook 2017 © OECD/IEA 2017, www.iea.org/statistics. License: www.iea.org/t&c; as modified by Barclays Research, Barclays Research
$0
$200
$400
$600
$800
$1,000
$1,200
$1,400
$1,600
2012 2013 2014 2015 2016 2017
Battery prices ($/kWh)
Range Weighted Average

Fuel economy standards inflect post-2020
Note: China's target reflects gasoline fleet scenario. If including other fuel types, the target will be higher. Source: ICCT, Barclays Research
47
25
35
45
55
65
75
85
2000 2002 2004 2006 2008 2010 2012 2014 2016 2018 2020 2022 2024
MP
G, n
orm
alis
ed
to
US
CA
FE
te
st c
yc
le
EU enacted EU proposed US enacted China enacted China proposed Japan enacted
EU 2021: 60.6
US 2025: 56.2
China 2020: 50.1
Japan 2020: 55.1
EU 2025: 72.5-82.3
26 March 2018

48
Electronic vehicles should make inroads into oil demand over the medium term
Source: Barclays Commodities Research Disruptive Stability Report (July 2017)
33% EV penetration by 2040 could affect oil
demand by ~ 9 mb/d
In our analysis, EV uptake and increased fleet fuel
efficiency could cut oil demand by ~ 3.5 mb/d in
2025 (mb/d)
Source: Bloomberg, Barclays Commodities Research
20
21
22
23
24
25
26
27
28
2016 2017 2018 2019 2020 2021 2022 2023 2024 2025
Estimated global oil demand from cars (mb/d)
No Increase in FE or EV adoption
Only Fuel Efficiency Improvements
Only EV Benefits
Demand Inclusive of EV and FE Benefits
0%
5%
10%
15%
20%
25%
30%
35%
40%
45%
50%
0
200
400
600
800
1,000
1,200
1,400
1,600
1,800
2016 2019 2022 2025 2028 2031 2034 2037 2040
EVs (Bloomberg, LHS)
ICE Vehicles (Bloomberg, LHS)
EV Penetration (Bloomberg)
EV Penetration (Barclays)
26 March 2018

Appendix

50
Source: Based on IEA data from The Future of Trucks: Implications for energy and the environment © OECD/IEA 2017, www.iea.org/statistics. License: www.iea.org/t&c; as modified by Barclays Research.
December 2017
IMO 2020: Marine bunker fuel sulfur limits lowered to 0.5%
The maritime industry consumes ~5% of
global liquid fuels
The regulation has had a visible impact on fuel
oil cracks
26%
18%
6%5%
1%
7%
12%
8%
6%
12%Road Passenger Vehicles
Road Freight
Aviation
Maritime
Other Transport
Steam/Proc. Heat
Petchem Feeds.
Buildings
Power Gen
Other
The maritime industry has several options in order
to comply with this rule:
•Ultra low sulfur (.5%) fuel oil
•Ultra low sulfur (.5%) marine gasoil
•LNG conversion
•Scrubber installation
-25
-20
-15
-10
-5
0
0
2
4
6
8
10
12
14
16
18
Mar-18 Sep-18 Mar-19 Sep-19 Mar-20 Sep-20 Mar-21 Sep-21
Gasoil Crack Fuel Oil, 3.5% Rdam Crack (rhs)
IMO regulations reflected in the
HSFO crackcurve
Less so in gasoil cracks
This regulation will have several affects on the market:
•Wider light-heavy spreads (all else equal)
•Positive for ULSD/gasoil cracks
•Negative for HSFO cracks
•More expensive bunkers, and thus wider waterborne
crude and product differentials
•Positive for complex refiners that produce minimal HSFO
•Negative for coastal refineries producing HSFO
Source: Bloomberg, Barclays Research.

51
Offshore oil output accounts for one-third of global supplies; capex on the offshore cedes share to unconventionals
Capex on offshore exp & development to fall,
but then rebound with rising prices
Source for all charts: Rystad Energy Ucube, Barclays Research
Growth concentrated in certain countries
If prices stay close to $50/b, reduction in
offshore supplies by ~6 mb/d
0
100
200
300
400
500
600
700
800
0%
10%
20%
30%
40%
50%
60%
2000 2005 2010 2015 2020 2025 2030
Share of Capital Spending on Oil Assets
(by supply segment)
Offshore share
Unconv. Share
Other onshore share
Total ($B), RHS
-1,000 -500 0 500 1,000 1,500 2,000
Brazil
Iran
United States
Kazakhstan
Saudi Arabia
Russia
Australia
Guyana
Qatar
Senegal
Canada
United Kingdom
Venezuela
Malaysia
China
Angola
Selected sources of growth/decline in
offshore oil output from 2017-2030 (kb/d)
0
5,000
10,000
15,000
20,000
25,000
30,000
2013 2016 2019 2022 2025
Production forecast by status (kb/d)
Producing Under developmentPre-FID At $50/b
*Rystad assumes prices rise to $90/b by 2025
but if prices stay at $50 offshore oil production
would be roughly 6.5 mb/d lower
20%
2%
3%
53%
14%
Proven (P90) offshore oil reserves
Major Integrated Independent NOC INOC
26 March 2018
And the majority of the proven reserves
controlled by NOCs

52
Auto manufacturers planning big expansions to EV offerings
Note: List not all inclusive. Source: Company reports, BBC, Reuters, Bloomberg, Barclays Research
Company Electric vehicle sales targets
BMW 100,000 electric car sales in 2017 and 15-25% of BMW group sales by 2025
GM 30,000 annual electric car sales by 2017
Chinese OEMs 4.52 million electric car sales by 2020
Daimler 0.1 million annual electric car sales by 2020
Renault-Nissan 1.5 million cumulative sales of electric cars by 2020
Tesla 500,000 annual electric car sales by 2018. 1 million annual electric care sales by 2020
Volkswagen 2-3 million annual electric car sales by 2025
Volvo 1 million cumulative electric car sales by 2025
Company Planned electric vehicle offerings
BMW Provide 12 BEVs and 13 hybrids by 2025
GM Offer at least 20 electric vehicles by 2023
Daimler Offer 10 BEVs by 2022
Fiat Chrysler Incorporate electrification into half of its fleet by 2022
Ford Launch 13 new electrified vehicles over the next five years
Honda Launch two fully electric vehicles in 2018 and electrify two-thirds of its offerings by 2030
Jaguar Land Rover Every new Jaguar or Land Rover launched from 2020 will be electrified
Renault-Nissan Launch 12 new ZEVs by 2022
Toyota Provide solid state battery electric cars by 2022
Volkswagen Eighty new electric vehicles by 2025
Volvo Every model launched from 2019 onward will be electrified
Expect the electric vehicle offering to expand
significantly in the coming years
Sales targets are still a drop in the bucket
(IEA data)
Note: List not all inclusive. Source: IEA Global EV Outlook 2017
26 March 2018

53
Analyst Certifications and Important Disclosures Analyst Certification(s)
I, Michael Cohen hereby certify (1) that the views expressed in this research report accurately reflect my personal view about any or all of the subject securities or issuers referred to in this research report and (2) no part of our compensation was, is or will be directly or indirectly related to the specific recommendations or views expressed in this research report.
Important Disclosures:
Barclays Research is produced by the Investment Bank of Barclays Bank PLC and its affiliates (collectively and each individually, "Barclays")
All authors contributing to this research report are Research Analysts unless otherwise indicated. The publication date at the top of the report reflects the local time where the report was produced and
may differ from the release date provided in GMT.
Availability of Disclosures:
For current important disclosures regarding any issuers which are the subject of this research report please refer to https://publicresearch.barclays.com or alternatively send a written request to:
Barclays Research Compliance, 745 Seventh Avenue, 13th Floor, New York, NY 10019 or call +1-212-526-1072.
Barclays Capital Inc. and/or one of its affiliates does and seeks to do business with companies covered in its research reports. As a result, investors should be aware that Barclays may have a conflict
of interest that could affect the objectivity of this report. Barclays Capital Inc. and/or one of its affiliates regularly trades, generally deals as principal and generally provides liquidity (as market maker or
otherwise) in the debt securities that are the subject of this research report (and related derivatives thereof). Barclays trading desks may have either a long and / or short position in such securities,
other financial instruments and / or derivatives, which may pose a conflict with the interests of investing customers. Where permitted and subject to appropriate information barrier restrictions, Barclays
fixed income research analysts regularly interact with its trading desk personnel regarding current market conditions and prices. Barclays fixed income research analysts receive compensation based
on various factors including, but not limited to, the quality of their work, the overall performance of the firm (including the profitability of the Investment Banking Department), the profitability and
revenues of the Markets business and the potential interest of the firm's investing clients in research with respect to the asset class covered by the analyst. To the extent that any historical pricing
information was obtained from Barclays trading desks, the firm makes no representation that it is accurate or complete. All levels, prices and spreads are historical and do not represent current market
levels, prices or spreads, some or all of which may have changed since the publication of this document. Barclays Research Department produces various types of research including, but not limited to,
fundamental analysis, equity-linked analysis, quantitative analysis, and trade ideas. Recommendations and trade ideas contained in one type of Barclays Research may differ from those contained in
other types of Barclays Research, whether as a result of differing time horizons, methodologies, or otherwise.
The Barclays Research Department operates independently from the Absa Research Department. Absa Research is produced by Absa Bank Limited acting through its Corporate and Investment Bank
division, which is a part of Barclays Africa Group Limited and affiliated with the Investment Bank of Barclays Bank PLC. Eligible clients may receive research reports from both research departments,
which may reach different conclusions and may contain different and conflicting forecasts, recommendations, or trade ideas. In order to access Barclays Statement regarding Research Dissemination
Policies and Procedures, please refer to https://publicresearch.barcap.com/S/RD.htm. In order to access Barclays Research Conflict Management Policy Statement, please refer to:
https://publicresearch.barcap.com/S/CM.htm.
All pricing information is indicative only. Prices are sourced from Thomson Reuters as of the last available closing price at the time of production of the research report, unless another time and source
is indicated.
Explanation of other types of investment recommendations produced by Barclays FICC Research:
Trade ideas contained herein that have been produced by the Credit teams within Barclays Research are valid at current market conditions and may not be otherwise relied upon.
Trade ideas contained herein that have been produced by other research teams within Barclays FICC Research shall remain open until they are subsequently amended or closed in a future research
report.
Disclosure of previous investment recommendations produced by Barclays FICC Research:
Barclays FICC Research may have published other investment recommendations in respect of the same securities/instruments recommended in this research report during the preceding 12 months.
To view previous investment recommendations published by Barclays FICC Research in the preceding 12 months please refer to
https://live.barcap.com/go/research/ResearchInvestmentRecommendations.
Legal entities involved in producing Barclays Research:
Barclays Bank PLC (Barclays, UK)
Barclays Capital Inc. (BCI, US)
Barclays Securities Japan Limited (BSJL, Japan)
Barclays Bank PLC, Hong Kong branch (Barclays Bank, Hong Kong)
Barclays Capital Canada Inc. (BCCI, Canada)
Barclays Bank Mexico, S.A. (BBMX, Mexico)
Barclays Securities (India) Private Limited (BSIPL, India)
Barclays Bank PLC, India branch (Barclays Bank, India)
Barclays Bank PLC, Singapore branch (Barclays Bank, Singapore)
26 March 2018

54
Disclaimer This publication has been produced by Barclays Research Department in the Investment Bank of Barclays Bank PLC and/or one or more of its affiliates (collectively and each individually, "Barclays").
It has been distributed by one or more Barclays affiliated legal entities listed below. It is provided to our clients for information purposes only, and Barclays makes no express or implied warranties,
and expressly disclaims all warranties of merchantability or fitness for a particular purpose or use with respect to any data included in this publication. To the extent that this publication states on the
front page that it is intended for institutional investors and is not subject to all of the independence and disclosure standards applicable to debt research reports prepared for retail investors under U.S.
FINRA Rule 2242, it is an “institutional debt research report” and distribution to retail investors is strictly prohibited. Barclays also distributes such institutional debt research reports to various issuers,
regulatory and academic organisations for informational purposes and not for the purpose of making investment decisions regarding any debt securities. Any such recipients that do not want to
continue receiving Barclays institutional debt research reports should contact [email protected]. Barclays will not treat unauthorized recipients of this report as its clients and accepts no
liability for use by them of the contents which may not be suitable for their personal use. Prices shown are indicative and Barclays is not offering to buy or sell or soliciting offers to buy or sell any
financial instrument.
Without limiting any of the foregoing and to the extent permitted by law, in no event shall Barclays, nor any affiliate, nor any of their respective officers, directors, partners, or employees have any
liability for (a) any special, punitive, indirect, or consequential damages; or (b) any lost profits, lost revenue, loss of anticipated savings or loss of opportunity or other financial loss, even if notified of
the possibility of such damages, arising from any use of this publication or its contents.
Other than disclosures relating to Barclays, the information contained in this publication has been obtained from sources that Barclays Research believes to be reliable, but Barclays does not
represent or warrant that it is accurate or complete. Barclays is not responsible for, and makes no warranties whatsoever as to, the information or opinions contained in any written, electronic, audio or
video presentations of third parties that are accessible via a direct hyperlink in this publication or via a hyperlink to a third-party web site (‘Third-Party Content’). Any such Third-Party Content has not
been adopted or endorsed by Barclays, does not represent the views or opinions of Barclays, and is not incorporated by reference into this publication. Third-Party Content is provided for information
purposes only and Barclays has not independently verified its accuracy or completeness.
The views in this publication are solely and exclusively those of the authoring analyst(s) and are subject to change, and Barclays Research has no obligation to update its opinions or the information
in this publication. Unless otherwise disclosed herein, the analysts who authored this report have not received any compensation from the subject companies in the past 12 months. If this publication
contains recommendations, they are general recommendations that were prepared independently of any other interests, including those of Barclays and/or its affiliates, and/or the subject companies.
This publication does not contain personal investment recommendations or investment advice or take into account the individual financial circumstances or investment objectives of the clients who
receive it. The securities and other investments discussed herein may not be suitable for all investors. Barclays is not a fiduciary to any recipient of this publication. Investors must independently
evaluate the merits and risks of the investments discussed herein, consult any independent advisors they believe necessary, and exercise independent judgment with regard to any investment
decision. The value of and income from any investment may fluctuate from day to day as a result of changes in relevant economic markets (including changes in market liquidity). The information
herein is not intended to predict actual results, which may differ substantially from those reflected. Past performance is not necessarily indicative of future results.
This document is being distributed (1) only by or with the approval of an authorised person (Barclays Bank PLC) or (2) to, and is directed at (a) persons in the United Kingdom having professional
experience in matters relating to investments and who fall within the definition of "investment professionals" in Article 19(5) of the Financial Services and Markets Act 2000 (Financial Promotion) Order
2005 (the "Order"); or (b) high net worth companies, unincorporated associations and partnerships and trustees of high value trusts as described in Article 49(2) of the Order; or (c) other persons to
whom it may otherwise lawfully be communicated (all such persons being "Relevant Persons"). Any investment or investment activity to which this communication relates is only available to and will
only be engaged in with Relevant Persons. Any other persons who receive this communication should not rely on or act upon it. Barclays Bank PLC is authorised by the Prudential Regulation
Authority and regulated by the Financial Conduct Authority and the Prudential Regulation Authority and is a member of the London Stock Exchange.
The Investment Bank of Barclays Bank PLC undertakes U.S. securities business in the name of its wholly owned subsidiary Barclays Capital Inc., a FINRA and SIPC member. Barclays Capital Inc., a
U.S. registered broker/dealer, is distributing this material in the United States and, in connection therewith accepts responsibility for its contents. Any U.S. person wishing to effect a transaction in any
security discussed herein should do so only by contacting a representative of Barclays Capital Inc. in the U.S. at 745 Seventh Avenue, New York, New York 10019.
Non-U.S. persons should contact and execute transactions through a Barclays Bank PLC branch or affiliate in their home jurisdiction unless local regulations permit otherwise.
Barclays Bank PLC, Paris Branch (registered in France under Paris RCS number 381 066 281) is regulated by the Autorité des marchés financiers and the Autorité de contrôle prudentiel. Registered
office 34/36 Avenue de Friedland 75008 Paris.
This material is distributed in Canada by Barclays Capital Canada Inc., a registered investment dealer, a Dealer Member of IIROC (www.iiroc.ca), and a Member of the Canadian Investor Protection
Fund (CIPF).
Subject to the conditions of this publication as set out above, Absa Bank Limited, acting through its Corporate and Investment Bank division, which is a part of Barclays Africa Group Limited and
affiliated with the Investment Bank of Barclays Bank PLC, an authorised financial services provider (Registration No.: 1986/004794/06. Registered Credit Provider Reg No NCRCP7), is distributing
this material in South Africa. Absa Bank Limited is regulated by the South African Reserve Bank. This publication is not, nor is it intended to be, advice as defined and/or contemplated in the (South
African) Financial Advisory and Intermediary Services Act, 37 of 2002, or any other financial, investment, trading, tax, legal, accounting, retirement, actuarial or other professional advice or service
whatsoever. Any South African person or entity wishing to effect a transaction in any security discussed herein should do so only by contacting a representative of Absa Bank Limited acting through
its Corporate and Investment Bank division in South Africa, 7th Floor, Barclays Towers West, 15 Troye Street, Johannesburg. Absa Bank Limited is an affiliate of the Barclays group.
.
26 March 2018

55
Disclaimer (continued) All Barclays research reports are distributed to institutional investors in Japan by Barclays Securities Japan Limited. Barclays Securities Japan Limited is a joint-stock company incorporated in Japan
with registered office of 6-10-1 Roppongi, Minato-ku, Tokyo 106-6131, Japan. It is a subsidiary of Barclays Bank PLC and a registered financial instruments firm regulated by the Financial Services
Agency of Japan. Registered Number: Kanto Zaimukyokucho (kinsho) No. 143.
Barclays Bank PLC, Hong Kong Branch is distributing this material in Hong Kong as an authorised institution regulated by the Hong Kong Monetary Authority. Registered Office: 41/F, Cheung Kong
Center, 2 Queen's Road Central, Hong Kong.
All Indian securities-related research and other equity research produced by Barclays’ Investment Bank are distributed in India by Barclays Securities (India) Private Limited (BSIPL). BSIPL is a
company incorporated under the Companies Act, 1956 having CIN U67120MH2006PTC161063. BSIPL is registered and regulated by the Securities and Exchange Board of India (SEBI) as a
Research Analyst: INH000001519; Portfolio Manager INP000002585; Stock Broker/Trading and Clearing Member: National Stock Exchange of India Limited (NSE) Capital Market INB231292732,
NSE Futures & Options INF231292732, NSE Currency derivatives INE231450334, Bombay Stock Exchange Limited (BSE) Capital Market INB011292738, BSE Futures & Options INF011292738;
Depository Participant (DP) with the National Securities & Depositories Limited (NSDL): DP ID: IN-DP-NSDL-299-2008; Investment Adviser: INA000000391. The registered office of BSIPL is at 208,
Ceejay House, Shivsagar Estate, Dr. A. Besant Road, Worli, Mumbai – 400 018, India. Telephone No: +91 2267196000. Fax number: +91 22 67196100. Any other reports produced by Barclays’
Investment Bank are distributed in India by Barclays Bank PLC, India Branch, an associate of BSIPL in India that is registered with Reserve Bank of India (RBI) as a Banking Company under the
provisions of The Banking Regulation Act, 1949 (Regn No BOM43) and registered with SEBI as Merchant Banker (Regn No INM000002129) and also as Banker to the Issue (Regn No
INBI00000950). Barclays Investments and Loans (India) Limited, registered with RBI as Non Banking Financial Company (Regn No RBI CoR-07-00258), and Barclays Wealth Trustees (India) Private
Limited, registered with Registrar of Companies (CIN U93000MH2008PTC188438), are associates of BSIPL in India that are not authorised to distribute any reports produced by Barclays’ Investment
Bank.
Barclays Bank PLC Frankfurt Branch distributes this material in Germany under the supervision of Bundesanstalt für Finanzdienstleistungsaufsicht (BaFin).
This material is distributed in Mexico by Barclays Bank Mexico, S.A.
Nothing herein should be considered investment advice as defined in the Israeli Regulation of Investment Advisory, Investment Marketing and Portfolio Management Law, 1995 (“Advisory Law”). This
document is being made to eligible clients (as defined under the Advisory Law) only. Barclays Israeli branch previously held an investment marketing license with the Israel Securities Authority but it
cancelled such license on 30/11/2014 as it solely provides its services to eligible clients pursuant to available exemptions under the Advisory Law, therefore a license with the Israel Securities
Authority is not required. Accordingly, Barclays does not maintain an insurance coverage pursuant to the Advisory Law.
Barclays Bank PLC in the Dubai International Financial Centre (Registered No. 0060) is regulated by the Dubai Financial Services Authority (DFSA). Principal place of business in the Dubai
International Financial Centre: The Gate Village, Building 4, Level 4, PO Box 506504, Dubai, United Arab Emirates. Barclays Bank PLC-DIFC Branch, may only undertake the financial services
activities that fall within the scope of its existing DFSA licence. Related financial products or services are only available to Professional Clients, as defined by the Dubai Financial Services Authority.
Barclays Bank PLC in the UAE is regulated by the Central Bank of the UAE and is licensed to conduct business activities as a branch of a commercial bank incorporated outside the UAE in Dubai
(Licence No.: 13/1844/2008, Registered Office: Building No. 6, Burj Dubai Business Hub, Sheikh Zayed Road, Dubai City) and Abu Dhabi (Licence No.: 13/952/2008, Registered Office: Al Jazira
Towers, Hamdan Street, PO Box 2734, Abu Dhabi).
Barclays Bank PLC in the Qatar Financial Centre (Registered No. 00018) is authorised by the Qatar Financial Centre Regulatory Authority (QFCRA). Barclays Bank PLC-QFC Branch may only
undertake the regulated activities that fall within the scope of its existing QFCRA licence. Principal place of business in Qatar: Qatar Financial Centre, Office 1002, 10th Floor, QFC Tower, Diplomatic
Area, West Bay, PO Box 15891, Doha, Qatar. Related financial products or services are only available to Business Customers as defined by the Qatar Financial Centre Regulatory Authority.
This material is distributed in the UAE (including the Dubai International Financial Centre) and Qatar by Barclays Bank PLC.
This material is not intended for investors who are not Qualified Investors according to the laws of the Russian Federation as it might contain information about or description of the features of
financial instruments not admitted for public offering and/or circulation in the Russian Federation and thus not eligible for non-Qualified Investors. If you are not a Qualified Investor according to the
laws of the Russian Federation, please dispose of any copy of this material in your possession.
This material is distributed in Singapore by the Singapore branch of Barclays Bank PLC, a bank licensed in Singapore by the Monetary Authority of Singapore. For matters in connection with this
report, recipients in Singapore may contact the Singapore branch of Barclays Bank PLC, whose registered address is 10 Marina Boulevard, #23-01 Marina Bay Financial Centre Tower 2, Singapore
018983.
This material is distributed to persons in Australia by either Barclays Bank plc, Barclays Capital Inc., Barclays Capital Securities Limited or Barclays Capital Asia Limited. None of Barclays Bank plc,
nor any of the other referenced Barclays group entities, hold an Australian financial services licence and instead they each rely on an exemption from the requirement to hold such a licence. This
material is intended to only be distributed to “wholesale clients” as defined by the Australian Corporations Act 2001.
IRS Circular 230 Prepared Materials Disclaimer: Barclays does not provide tax advice and nothing contained herein should be construed to be tax advice. Please be advised that any discussion of
U.S. tax matters contained herein (including any attachments) (i) is not intended or written to be used, and cannot be used, by you for the purpose of avoiding U.S. tax-related penalties; and (ii) was
written to support the promotion or marketing of the transactions or other matters addressed herein. Accordingly, you should seek advice based on your particular circumstances from an independent
tax advisor.
© Copyright Barclays Bank PLC (2018). All rights reserved. No part of this publication may be reproduced or redistributed in any manner without the prior written permission of Barclays. Barclays
Bank PLC is registered in England No. 1026167. Registered office 1 Churchill Place, London, E14 5HP. Additional information regarding this publication will be furnished upon request. US33896
26 March 2018