committee meeting finance - mta
TRANSCRIPT

FinanceCommittee MeetingJune 2020 Committee Members L. Schwartz, Chair
N. Brown
R. Glucksman
R. Herman
D. Jones
L. Lacewell
K. Law
H. Mihaltses
R. Mujica
J. Samuelsen
V. Tessitore
N. Zuckerman
Finance Committee Meeting 2 Broadway, 20th Floor Board Room
New York, NY 10004 Wednesday, 6/24/2020 10:00 AM - 5:00 PM ET
1. SUMMARY OF ACTIONSSummary of Actions - Page 4
2. PUBLIC COMMENTS PERIOD
3. APPROVAL OF MINUTES – MAY 20, 2019Finance Minutes - Page 5
4. 2019 COMMITTEE WORK PLAN2020 Work Plan - Page 6
5. BUDGETS/CAPITAL CYCLE
BudgetWatch (Handout available in the Exhibit Book and MTA.Info)
Finance WatchFinance Watch - Page 14
6. MTA HEADQUARTERS & ALL-AGENCY ITEMS
Report and Information Items
Annual Pension Report Presentation (Available in the Exhibit Book)
ProcurementsMTAHQ Procurement Report - Page 24 MTAHQ Competitive Procurements - Page 27
7. METRO-NORTH RAILROAD & LONG ISLAND RAIL ROADMNR Procurements - Page 31 LIRR Procurement - Page 34
8. NEW YORK CITY TRANSIT, and MTA BUS OPERATIONS NYCT Procurement - Page 36
9. BRIDGES AND TUNNELS
B & T Procurement - Page 38
10. FIRST MUTUAL TRANSPORTATION ASSURANCE COMPANY (No Items)
11. MTA CONSOLIDATED REPORTSStatement of Operations - Page 40 Overtime - Page 47 Subsidy, Interagency Loan and Stabilization Fund Transactions - Page 50 Debt Service - Page 61 Positions - Page 63 Farebox Ratios - Page 66 MTA Ridership Report - Page 67 Fuel Hedge Program - Page 91
12. REAL ESTATE AGENDA
Action ItemsReal Estate Action Items - Page 94
Report and Information ItemsReal Estate Info Items - Page 107

1 of 1
FINANCE COMMITTEEJUNE 2020
Action Amount Short DescriptionNo ActionsAgency Vendor Name Total Amount Summary of Action
MTAHQCigna Health and Life Insurance
Company$14,049,000 Dental Benefits for certain NYCT represented employees, retirees and dependents
MTAHQCubic Transportation Systems, Inc. $6,915,964
Modification to extend a contract for two years to continue providing Bus CISHardware In-Depot Warranty and Maintenance Services
MNRAlbatros North America Inc. d/b/a
Sepsa/Medha North America$6,500,000
OEM Purchase Agreement of Auxillary Power Parts, Components and Assembliesfor MNR and LIRR
MNR
WDF, Inc. $2,740,000
Modification to a contract for the construction of the Grand Central Terminal B-Hall 7B Training Facility to install Heating Ventilation Air Conditioning equipmentfor cooling spaces critical to Metro-North's operations within Grand CentralTerminal
LIRR Myers Controlled Power, LLC $7,659,654 Construction, testing and delivery of a Mobile Substation
NYCTSiemens Industry Inc. $11,900,000
Ratification of a modification to a contract for Communications-Based TrainControl on the Queens Boulevard Line, Phase 1
B&TConduent State & Local Solutions $94,193,824
Modification to extend a contract for two years to continue providing EZ PassNew York Customer Service Center services
MTA Real Estate Vendor Name Amount Short Description
LIRR Alpahpointe Inc $15,000 Sale of real property
NYCT K & K Newsstand Inc. $571,306 (NPV) Retail lease for three units
MTA Compass Group USA, Inc. $4,398,895 NPV Retail license for vending machines throughout MTA system
MTA Various TBD
TBD per deal with a range notto exceed for Rest room
agreements: Not to exceed$500.00 per
month/$6,000.00 per annumand for Swing room
agreements: First year not toexceed $7,500.00 per
month/$90,000.00 perannum
Authorization to amend Board Policy #24 for rest room licenses and increase the value ofleases for swing rooms
Master Page # 4 of 108 - Finance Committee Meeting 6/24/2020________________________________________________________________________________

Minutes of the MTA Finance Committee Meeting May 2020
2 Broadway, 20th Floor Board Room New York, NY 10004
Because of the ongoing COVID-19 public health crisis, the MTA Chairman convened a one-day, virtual Board and Committee meeting session on May 20, 2020, which included the following committees: Long Island Rail Road and Metro-North Railroad New York City Transit MTA Bridges and Tunnels Finance Audit Diversity Capital Program Oversight Committee For Finance Committee actions taken, see the May 20, 2020 Board minutes in the June Board Book available here on the Board materials website: https://new.mta.info/transparency/board-and-committee-meetings/june-2020.
Master Page # 5 of 108 - Finance Committee Meeting 6/24/2020________________________________________________________________________________

2020 Finance Committee Work Plan
I. RECURRING AGENDA ITEMS Responsibility
BudgetWatch MTA Div. Mgmt/BudgetFinanceWatch MTA FinanceApproval of Minutes Board SecretaryProcurements (if any) ProcurementAction Items (if any) AgencyMTA Consolidated Reports MTA Div. Mgmt/Budget
II. SPECIFIC AGENDA ITEMS Responsibility
July 20202021 Preliminary Budget/July Financial Plan 2021-2024(Joint Session with MTA Board) MTA Div. Mgmt/Budget
Other: Agency Reports on Fare Evasion Agency Representatives
September 20202021 Preliminary Budget/July Financial Plan 2021-2024 MTA Div. Mgmt/Budget(materials previously distributed)
Action Item: Resolution to Authorize the Execution, Filing and Acceptance of Federal Funds MTA Grant Mgmt.
Other: DRAFT MTA Financial Statements 2nd Quarter for the Six-Months Ended June 2020 MTA Comptroller Agency Reports on Fare Evasion Agency Representatives
October 20202021 Preliminary Budget/July Financial Plan 2021-2024 MTA Div. Mgmt/Budget(materials previously distributed)
Other: Annual Review of MTA’s Derivative Portfolio - MTA Finance Including Fuel Hedge MTA 2020 Semi-Annual Investment Report MTA Treasury Agency Reports on Fare Evasion Agency Representatives
November 20202021 Final Proposed Budget/November Financial Plan 2021-2024 MTA Div. Mgmt/Budget(Joint Session with MTA Board)
Other: Station Maintenance Billing Update MTA Comptroller Review and Assessment of the Finance Committee Charter MTA CFO Agency Reports on Fare Evasion Agency Representatives
Master Page # 6 of 108 - Finance Committee Meeting 6/24/2020________________________________________________________________________________

December 2020Adoption of 2021 Budget and 2021-2024 Financial Plan MTA Div. Mgmt/Budget
Action Items: Authorization to issue New Money Bonds for planned active credits MTA Finance for Capital Program cashflow needs in 2021 Approval of Supplemental Resolutions Authorizing Refunding Bonds MTA Finance MTA and TBTA Reimbursement Resolutions for Federal Tax Purposes MTA Treasury
Other: Draft 2021 Finance Committee Work Plan MTA Div. Mgmt/Budget Agency Reports on Fare Evasion Agency Representatives
January 2021Other: Special Report: Finance Department 2019 Year-End Review MTA Finance DRAFT MTA Financial Statements 3rd Quarter for the Nine-Months Ended September 2020 MTA Comptroller Agency Reports on Fare Evasion Agency Representatives
February 2021Action Items: 2020 TBTA Operating Surplus B&T/MTA Mortgage Recording Tax – Escalation Payments to Dutchess, Orange and Rockland Counties MTA Treasury, MTA
Div. Mgmt/BudgetOther: February Financial Plan 2021-2024 MTA Div. Mgmt/Budget Agency Reports on Fare Evasion Agency Representatives
March 2021Action Items: All-Agency Real Property Disposition Guidelines and All-Agency Personal Property Disposition Guidelines MTA Real Estate/MTA
Corporate Compliance All-Agency Annual Procurement Report MTA Proc., Agencies
Other: MTA Prompt Payment Annual Report 2020 MTA BSC/MTA Finance Agency Reports on Fare Evasion Agency Representatives
April 2021
Other: Annual Report on Variable Rate Debt MTA Finance Agency Reports on Fare Evasion Agency Representatives
May 2021Other: MTA Annual Investment Report MTA Treasury DRAFT MTA Financial Statements Fiscal Year-End Twelve-Months Ended December 2021 MTA Comptroller Station Maintenance Billings MTA Comptroller Annual Pension Fund Report (Audit Committee Members to be invited) MTA Labor
Master Page # 7 of 108 - Finance Committee Meeting 6/24/2020________________________________________________________________________________

Annual FMTAC Meeting MTA RIM Annual FMTAC Investment Performance Report MTA RIM Agency Reports on Fare Evasion Agency Representatives
June 2021Action Item: PWEF Assessment MTA Capital Program Mgmt/
MTA Div. Mgmt/BudgetOther:
Update on IT Transformation MTA Information Technology Update on Procurement Consolidation MTA Procurement DRAFT MTA Financial Statements 1st Quarter for the Three-Months Ended March 2020 MTA Comptroller Agency Reports on Fare Evasion Agency Representatives
III. DETAILS
July 20202021 Preliminary Budget/July Financial Plan 2021-2024 (JOINT Session with MTA Board)The Chief Financial Officer and MTA Budget Division will present an updated forecast for 2020, a Preliminary Budget for 2021, and a Financial Plan for 2021-2024.
Other:Agency Reports on Fare Evasion Fare Evasion statistics to be reported by Agency Representatives.
September 20202021 Preliminary Budget/July Financial Plan 2021-2024Public comment will be accepted on the 2021 Preliminary Budget.
Action Item:
Resolution to Authorize the Execution, Filing and Acceptance of Federal FundsThe MTA Office of Grant Management will hold a public hearing in accordance with Federal law and then request the Board’s approval of a resolution that would authorize the Chairman or a designated officer to execute the applications and accept grants of financial assistance from the Federal government.
Other:
DRAFT MTA Financial Statements for the Six-Months Ended, June 2020Included for information is a copy of the Independent Accountant’s Review Report of MTA Financial Statements for the Six-Months ended, June 30, 2020.
Agency Reports on Fare Evasion Fare Evasion statistics to be reported by Agency Representatives.
Master Page # 8 of 108 - Finance Committee Meeting 6/24/2020________________________________________________________________________________

October 20202021 Preliminary Budget/July Financial Plan 2021-2024Public comment will be accepted on the 2020 Preliminary Budget.
Other:Update on Business Service Center
The Business Service Center will provide an update on its initiatives and upcoming project milestones. Operational performance metrics will also be shared.
Annual Review of MTA’s Derivative Portfolio – Including Fuel HedgeThe Finance Department will provide an update on MTA’s portfolio of derivative contracts.
MTA 2020 Semi-Annual Investment ReportThe MTA Treasury Division should be prepared to answer questions on this report.
Agency Reports on Fare Evasion Fare Evasion statistics to be reported by Agency Representatives.
November 20202021 Final Proposed Budget/November Financial Plan 2021-2024 (Joint Session with MTA Board)The Chief Financial Officer and MTA Budget Division will present an updated forecast for 2021, a Final Proposed Budget for 2021, and an updated Financial Plan for 2021-2024.
Other:Station Maintenance Billing UpdateThe MTA Comptroller Division will provide a report on the collection and audit status of station maintenance billings issued as of June 1, 2020.
Review and Assessment of the Finance Committee CharterMTA Chief Financial Officer will present the most updated Finance Committee Charter to the Finance Committee members for them to review and assess its adequacy. The annual assessment is required under the current Committee Charter.
Agency Reports on Fare Evasion Fare Evasion statistics to be reported by Agency Representatives.
December 2020Adoption of 2021 Budget and 2021-2024 Financial PlanThe Committee will recommend action to the Board on the Final Proposed Budget for 2021 and 2021-2024 Financial Plan.
Master Page # 9 of 108 - Finance Committee Meeting 6/24/2020________________________________________________________________________________

Action Items:
Approval of Supplemental Resolutions Authorizing New Money Bonds.Board approval to allow for the issuance of new money bonds to fund existing approved bond financed capital projects under the Transportation Revenue Bond Obligation Resolution, the Dedicated Tax Fund Obligation Resolution, and in the case of Bridge & Tunnel Capital Projects, the Triborough Bridge and Tunnel Authority Senior and Subordinate Obligation Resolutions.
Approval of Supplemental Resolutions Authorizing Refunding BondsBoard action required to allow for the refunding to fixed-rate bonds from time to time provided that such refundings comply with the Board approved refunding policy.
Approval of MTA and TBTA Reimbursement Resolutions for Federal Tax Purposes.Board approval required to allow for the reimbursement of capital expenditures at a later date from the proceeds of tax-exempt bond sales.
Other:Draft 2021 Finance Committee Work Plan
The MTA Chief Financial Officer will present a proposed 2021 Finance Committee Work Plan that will address major issues, SBP and budget process issues, and reports required by statute.
Agency Reports on Fare Evasion Fare Evasion statistics to be reported by Agency Representatives.
January 2021Other:
Special Report: Finance Department 2020 Year-End ReviewThe MTA Finance Department will present a report that summarizes financing activities for 2020.
DRAFT MTA Financial Statements for the Nine-Months Ended, September 2020Included for information is a copy of the Independent Accountant’s Review Report of MTA Financial Statements for the nine-months ended, September 30, 2020.
Agency Reports on Fare Evasion Fare Evasion statistics to be reported by Agency Representatives.
February 2021
Action Items:
2020 TBTA Operating SurplusMTA Bridges and Tunnels should be prepared to answer questions on a staff summary requesting (1) transfer of TBTA 2020 Operating Surplus and Investment Income, (2) advances of TBTA 2020 Operating Surplus, and (3) the deduction from 2020 TBTA Operating Revenue, funds which shall be paid into the Necessary Reconstruction Reserve.
Master Page # 10 of 108 - Finance Committee Meeting 6/24/2020________________________________________________________________________________

Mortgage Recording Tax – Escalation Payments to Dutchess, Orange and Rockland CountiesBy State statute, each of these counties is entitled to a share of MTA’s MRT-2 tax receipts. The amount may be no less than they received in 1987 (even if the taxes collected fall below the 1987 levels), but there are proportional upward adjustments if taxes collected in the particular county exceed the 1987 totals. Such upward adjustments are expected to be required this year, based on the 2009 experience thus far. The MTA Budget and Treasury Division will be prepared to answer questions on the related Staff Summary authorizing the payments.
Other:
February Financial Plan 2021-2024The MTA Division of Management and Budget will present for information purposes a revised 2021-2024 Financial Plan reflecting any technical adjustments from the Adopted Budget and the incorporation of certain “below-the-line” policy actions into the baseline.
Agency Reports on Fare Evasion Fare Evasion statistics to be reported by Agency Representatives.
March 2021Action Items:
All-Agency Real Property Disposition Guidelines and All-Agency Personal Property Disposition Guidelines Board approval of above guidelines as required annually by Public Authorities Law Sections 2895-2897. MTA Real Estate and MTA Corporate Compliance should be prepared to answer questions regarding these guidelines.
All-Agency Annual Procurement ReportThe Agencies and the MTA Procurement Division should be prepared to answer questions on this voluminous State-required report.
Other:
MTA Annual Prompt Payment Status ReportThe Senior Director of the MTA Business Service Center should be prepared to discuss a report, to be included in the Agenda materials, that reviews MTA-wide success in meeting mandated prompt-payment deadlines (including the interest penalties incurred as a result of late payment).
Agency Reports on Fare Evasion Fare Evasion statistics to be reported by Agency Representatives.
April 2021
Other:Annual Report on Variable Rate DebtThe MTA Finance Department will present a report that summarizes the performance of the MTA’s various variable-rate debt programs, including a discussion of the savings (compared to long-term
Master Page # 11 of 108 - Finance Committee Meeting 6/24/2020________________________________________________________________________________

rates) achieved through variable rate debt and a discussion on the current policy and limits on the use of variable rate debt.
Agency Reports on Fare Evasion Fare Evasion statistics to be reported by Agency Representatives.
May 2021Action Item:
MTA Annual Investment Report
The MTA Treasury Division should be prepared to answer questions on this State-required report.
Other:
DRAFT MTA Financial Statements for the Twelve-Months Ended, December 2020Included for information is a copy of the Independent Accountant’s Audit Report of MTA Financial Statements for the Twelve-Months ended, December 31, 2020.
Station Maintenance BillingsUnder the Public Authorities Law, the Board is required to certify to the City and the counties in the Metropolitan Transportation District the total costs to MTA for operating and maintaining Commuter Railroad passenger stations. The City and county assessments are both now determined through a formula.
Annual Pension Fund ReportThe MTA Labor Division, representatives of the various pension fund boards, and their pension consultants should be prepared to answer questions on a report, to be included in the Agenda materials, that reviews the 2020 investment performance and other experience of the various MTA pension funds. Among other matters, this report should (i) make recommendations on appropriate investment-earnings assumptions in light of the experience of the past three years; (ii) discuss the implications for asset allocations in light of such recommendations; (iii) discuss the effect on (under) funding of the systems in light of such performance and recommendation; (iv) provide appropriate comparisons with other public pension systems; and (v) solicit the opinions of the Board Operating Committees on these recommendations in light of their effects on Agency budgets.
Annual Meeting of the First Mutual Transportation Assurance CompanyThe MTA's Captive Insurance Company will hold its statutorily required annual meeting in which it will review the prior year’s operations as well as submit its financial statements and actuarial report for final approval. The MTA Risk and Insurance Management Divisions, along with the FMTAC’s outside investment managers, should be prepared to answer questions on reports.
Agency Reports on Fare Evasion Fare Evasion statistics to be reported by Agency Representatives.
Master Page # 12 of 108 - Finance Committee Meeting 6/24/2020________________________________________________________________________________

June 2021Action Item:
PWEF AssessmentThe MTA Division of Management and Budget, assisted by MTA Capital Program Management, should prepare the usual annual staff summary authorizing the payment of this assessment to the State. The State levies an assessment of the value of construction-contract awards to cover its cost of enforcing prevailing-wage legislation.
Other:
IT TransformationIT Management will present progress made to date to promote IT Transformation. A general organizational overview will be provided and an outline of key milestones and project deliverables will be shared. Initiatives that have made IT more resilient will also be discussed.
Update on Procurement ConsolidationProcurement Management will present progress made to date to promote Non-Core Procurement Consolidation. A general organizational overview will be provided and an outline of key milestones and project deliverables will be shared.
DRAFT MTA Financial Statements for the Three-Months Ended, March 2021Included for information is a copy of the Independent Accountant’s Review Report of MTA Financial Statements for the Three-Months ended, March 31, 2021.
Agency Reports on Fare Evasion Fare Evasion statistics to be reported by Agency Representatives.
Master Page # 13 of 108 - Finance Committee Meeting 6/24/2020________________________________________________________________________________

FinanceWatch June 24, 2020
Financing Activity
$525,000,000 Triborough Bridge and Tunnel Authority General Revenue Bonds, Series 2020A
On May 27, 2020, MTA issued $525 million of Triborough Bridge and Tunnel Authority General Revenue
Bonds, Series 2020A to finance bridge and tunnel capital projects. The Series 2020A bonds were issued as
tax-exempt fixed rate bonds with an all-in True Interest Cost of 3.643% and a final maturity of November 15,
2054.
This transaction was led by book-running senior manager BofA Securities. Orrick, Herrington & Sutcliffe
LLP and Bryant Rabbino LLP served as co-bond counsel and Public Resources Advisory Group and
Backstrom McCarley served as co-financial advisors.
Transaction Summary Statistics
Series 2020A
Par Amount: $525.000 million
Premium: $102.219 million
All-in TIC: 3.643%
Average Coupon: 4.67%
Average Life: 30.35 years
Final Maturity: 11/15/2054
State Bond Issuance Fee $0(1)
Underwriter’s Discount: $4.69 ($2,461,537)
Cost of Issuance: $1.72 ($900,500)
Ratings (Moodys/S&P/Fitch/Kroll): Aa3/AA-/AA-/AA
Senior Manager BofA Securities.
(1) MTA received a waiver from making this payment from the State Division of the Budget.
$950,000,000 MTA Taxable Revenue Anticipation Note, Series 2020
On May 22, 2020, MTA entered into a $950 million taxable term credit agreement with JPMorgan Chase
Bank National Association, as administrative agent, and Industrial and Commercial Bank of China Limited,
New York Branch, and Bank of China, New York Branch, collectively as lenders. Funds drawn from this credit
agreement may be used for operational or capital purposes. The credit agreement is active through May 22,
2022.
Fuel Hedging Program
$3,564,187 Diesel Fuel Hedge
On May 27, 2020, MTA executed a 2,819,768 gallon ultra-low sulfur diesel fuel hedge with Goldman,
Sachs & Co./J Aron at an all-in price of $1.264/gallon. Three of MTA’s existing approved commodity
counterparties participated in bidding on the transaction: Macquarie Group; Goldman, Sachs & Co./ J
Aron; and J.P. Morgan Ventures Energy Corporation. The hedge covers the period from May 2021 through
April 2022.
Master Page # 14 of 108 - Finance Committee Meeting 6/24/2020________________________________________________________________________________

Dedicated Tax Fund:
NYC Transit $14.6 $19.1 ($4.5) $0.0
Commuter Railroads 2.1 4.0 (1.8) $0.0
Dedicated Tax Fund Subtotal $16.8 $23.1 ($6.3) -37.7%
MTA Transportation Revenue:
NYC Transit $62.1 $62.9 ($0.8) $0.0
Commuter Railroads 53.3 44.5 8.8 $0.0
MTA Bus 2.2 0.0 2.2 $0.0
SIRTOA 0.9 0.2 0.8 $0.0
MTA Transportation Revenue Subtotal $118.5 $107.6 $11.0 9.3%
2 Broadway COPs:
NYC Transit $0.4 $0.4 $0.1 $0.0
Bridges & Tunnels 0.1 0.1 0.0 $0.0
MTA HQ 0.0 0.0 0.0 $0.0
Commuter Railroads 0.1 0.1 0.0 $0.2
2 Broadway COPs Subtotal $0.6 $0.5 $0.1 18.7%
TBTA General Resolution (2):
NYC Transit $16.7 $13.8 $2.9 $0.0
Commuter Railroads 7.5 6.2 1.3 $0.0
Bridges & Tunnels 22.6 18.0 4.6 20.5%
TBTA General Resolution Subtotal $46.8 $38.0 $8.8 18.8%
TBTA Subordinate (2):
NYC Transit $4.7 $3.8 $0.8 $0.0
Commuter Railroads 2.1 1.8 0.4 $0.0
Bridges & Tunnels 1.7 1.4 0.3 $0.0
TBTA Subordinate Subtotal $8.5 $7.0 $1.5 17.9%
Debt Service from Lockbox Revenues: NYC Transit $2.2 $0.0 $2.2 $0.0
Commuter Railroads 0.6 0.0 0.6 $0.0
MTA Bus 0.0 0.0 0.0 $0.0
SIRTOA 0.0 0.0 0.0 $0.0
Debt Service from Lockbox Subtotal $2.8 $0.0 $2.8 100.0%
Total Debt Service $194.0 $176.1 $17.9 9.2%
Debt Service by Agency:
NYC Transit $100.7 $100.0 $0.7 $0.0
Commuter Railroads 65.7 56.5 9.2 $0.0
MTA Bus 2.3 0.0 2.3 $0.0
SIRTOA 1.0 0.2 0.8 $0.0
Bridges & Tunnels 24.4 19.4 5.0 $0.0
MTAHQ 0.0 0.0 0.0 $0.0
Total Debt Service $194.0 $176.1 $17.9 9.2%
Notes:
Totals may not add due to rounding.
METROPOLITAN TRANSPORTATION AUTHORITYFEBRUARY FINANCIAL PLAN - Adopted Budget
Debt ServiceMay 2020($ in millions)
Adopted Budget Actual Variance % Var Explanation
Reversal of prior month's timing
variance offset by non‐receipt of May
BAB subsidy.
Reversal of prior period variance from
prefunding May 15th debt service, offset
by non‐receipt of May BAB subsidy.
Lower than budgeted variable rate.
Reversal of prior period variance from
prefunding May 15th debt service, offset
by non‐receipt of May BAB subsidy.
Reversal of prior period variance from
prefunding May 15th debt service.
Lower than budgeted debt service
related to the timing of Lockbox related
debt.
(1) Forecasted debt service is calculated based upon projected monthly deposits from available pledged revenues into debt service accounts. Actual payments to bondholders are made from the debt service accounts when due as required for each series of bonds and do not conform to this schedule.
(2) Generally, the calendarization of monthly debt service deposits is calculated by dividing projected annual debt service by 12. Month to month variations ("timing differences") on the existing debt portfolio can occur based upon, among other things, (a) for all bonds, the date when income from the securities in which the debt service accounts are invested becomes available varies, (b) for variable rate financings, differences between (i) the budgeted interest rate and the actual interest rate, (ii) projected interest payment dates to bondholders and actual interest payment dates to bondholders, and (iii) projected monthly funding dates for accrued debt service and actual funding dates, (c) for transactions with swaps, the difference between when MTA/TBTA funds debt service and the receipt of the corresponding swap payment by the counterparty, and difference between rates received and rates paid and (d) for commercial paper, the interest payment date is the date of the maturity of the commercial paper and the dealers set the term of the commercial paper from 1 to 270 days, which is not foreseeable at the time the annual debt service budgets are prepared.
(3) Debt service is allocated among Transit, Commuter, MTA Bus, and TBTA categories based on actual spending of bond proceeds for approved capital projects. Allocation of 2 Broadway COPs is based on occupancy.
Master Page # 15 of 108 - Finance Committee Meeting 6/24/2020________________________________________________________________________________

Dedicated Tax Fund:
NYC Transit $142.0 $151.7 ($9.7) $0.0
Commuter Railroads 29.3 31.6 (2.3) $0.0
Dedicated Tax Fund Subtotal $171.3 $183.3 ($12.0) -7.0%
MTA Transportation Revenue:
NYC Transit $387.5 $409.8 ($22.3) $0.0
Commuter Railroads 290.0 286.7 3.3 $0.0
MTA Bus 11.0 0.8 10.3 $0.0
SIRTOA 4.4 0.3 4.1 $0.0
MTA Transportation Revenue Subtotal $693.0 $697.6 ($4.6) -0.7%
2 Broadway COPs:
NYC Transit $2.2 $1.6 $0.6 $0.0
Bridges & Tunnels 0.3 0.2 0.1 $0.0
MTA HQ 0.0 0.0 0.0 $0.0
Commuter Railroads 0.7 0.5 0.2 $0.3
2 Broadway COPs Subtotal $3.2 $2.3 $0.9 28.4%
TBTA General Resolution (2):
NYC Transit $83.3 $81.4 $1.9 $0.0
Commuter Railroads 37.3 36.4 0.9 $0.0
Bridges & Tunnels 129.2 117.1 12.1 9.4%
TBTA General Resolution Subtotal $249.8 $234.9 $14.9 6.0%
TBTA Subordinate (2):
NYC Transit $23.4 $23.3 $0.1 $0.0
Commuter Railroads 10.7 10.7 0.0 $0.0
Bridges & Tunnels 8.5 8.5 0.0 $0.0
TBTA Subordinate Subtotal $42.6 $42.4 $0.2 0.4%
Debt Service from Lockbox Revenues:
NYC Transit $8.9 $0.0 $8.9 $0.0
Commuter Railroads 2.3 0.0 2.3 $0.0
MTA Bus 0.2 0.0 0.2 $0.0
SIRTOA 0.1 0.0 0.1 $0.0
Debt Service from Lockbox Subtotal $11.4 $0.0 $11.4 100.0%
Total Debt Service $1,171.4 $1,160.6 $10.8 0.9%
Debt Service by Agency:
NYC Transit $647.4 $667.9 ($20.5) $0.0
Commuter Railroads 370.2 365.8 4.4 $0.0
MTA Bus 11.2 0.8 10.4 $0.0
SIRTOA 4.5 0.3 4.2 $0.0
Bridges & Tunnels 138.0 125.8 12.2 $0.0
MTAHQ 0.0 0.0 0.0 $0.0
Total Debt Service $1,171.4 $1,160.6 $10.8 0.9%
Notes:
Totals may not add due to rounding.
Lower than budgeted debt service
related to the timing of Lockbox related
debt.
METROPOLITAN TRANSPORTATION AUTHORITYFEBRUARY FINANCIAL PLAN - Adopted Budget
Debt ServiceMay 2020 Year-to-Date
($ in millions)
Adopted Budget Actual Variance % Var Explanation
Non‐receipt of May BAB subsidy.
Lower than budgeted variable rates;
lower than budgeted debt service
related to timing and structure of
issuances; offset by non‐receipt of May
BAB subsidy.
Lower than budgeted variable rates;
lower than budgeted debt service
related to timing and structure of TBTA
issuances; offset by non‐receipt of May
BAB subsudy.
(1) Forecasted debt service is calculated based upon projected monthly deposits from available pledged revenues into debt service accounts. Actual payments to bondholders are made from the debt service accounts when due as required for each series of bonds and do not conform to this schedule.
(2) Generally, the calendarization of monthly debt service deposits is calculated by dividing projected annual debt service by 12. Month to month variations ("timing differences") on the existing debt portfolio can occur based upon, among other things, (a) for all bonds, the date when income from the securities in which the debt service accounts are invested becomes available varies, (b) for variable rate financings, differences between (i) the budgeted interest rate and the actual interest rate, (ii) projected interest payment dates to bondholders and actual interest payment dates to bondholders, and (iii) projected monthly funding dates for accrued debt service and actual funding dates, (c) for transactions with swaps, the difference between when MTA/TBTA funds debt service and the receipt of the corresponding swap payment by the counterparty, and difference between rates received and rates paid and (d) for commercial paper, the interest payment date is the date of the maturity of the commercial paper and the dealers set the term of the commercial paper from 1 to 270 days, which is not foreseeable at the time the annual debt service budgets are prepared.
(3) Debt service is allocated among Transit, Commuter, MTA Bus, and TBTA categories based on actual spending of bond proceeds for approved capital projects. Allocation of 2 Broadway COPs is based on occupancy.
Master Page # 16 of 108 - Finance Committee Meeting 6/24/2020________________________________________________________________________________

METROPOLITAN TRANSPORTATION AUTHORITYVARIABLE RATE: WEEKLY MODE
RATE RESETS REPORT (Trailing 6-Weeks)
Date SIFMA RateSpread to
SIFMA RateSpread to
SIFMA RateSpread to
SIFMA RateSpread to
SIFMA4/29/2020 0.22% 0.25% 0.03% 0.26% 0.04% 0.25% 0.03% 0.16% -0.06%5/6/2020 0.19% 0.21% 0.02% 0.22% 0.03% 0.21% 0.02% 0.15% -0.04%5/13/2020 0.17% 0.19% 0.02% 0.18% 0.01% 0.19% 0.02% 0.14% -0.03%5/20/2020 0.16% 0.17% 0.01% 0.16% 0.00% 0.17% 0.01% 0.13% -0.03%5/27/2020 0.14% 0.13% -0.01% 0.13% -0.01% 0.13% -0.01% 0.11% -0.03%6/3/2020 0.11% 0.11% 0.00% 0.11% 0.00% 0.11% 0.00% 0.08% -0.03%
Transportation Revenue Bonds Dedicated Tax Fund Bonds
Date SIFMA RateSpread to
SIFMA RateSpread to
SIFMA RateSpread to
SIFMA RateSpread to
SIFMA RateSpread to
SIFMA RateSpread to
SIFMA
4/29/2020 0.22% 0.32% 0.10% 0.20% -0.02% 0.25% 0.03% 0.21% -0.01% 0.21% -0.01% 0.21% -0.01%5/6/2020 0.19% 0.39% 0.20% 0.15% -0.04% 0.21% 0.02% 0.18% -0.01% 0.18% -0.01% 0.18% -0.01%5/13/2020 0.17% 0.25% 0.08% 0.15% -0.02% 0.19% 0.02% 0.16% -0.01% 0.16% -0.01% 0.16% -0.01%5/20/2020 0.16% 0.39% 0.23% 0.14% -0.02% 0.17% 0.01% 0.15% -0.01% 0.15% -0.01% 0.15% -0.01%5/27/2020 0.14% 0.20% 0.06% 0.12% -0.02% 0.13% -0.01% 0.12% -0.02% 0.12% -0.02% 0.12% -0.02%6/3/2020 0.11% 0.20% 0.09% 0.07% -0.04% 0.11% 0.00% 0.09% -0.02% 0.09% -0.02% 0.09% -0.02%
TBTA General Revenue Bonds
Outstanding ($m) SIFMA Rate
Spread to SIFMA Rate
Spread to SIFMA
4/28/2020 0.22% 0.25% 0.03% 0.55% 0.33%5/5/2020 0.19% 0.20% 0.01% 0.38% 0.19%5/12/2020 0.17% 0.18% 0.01% 0.25% 0.08%5/19/2020 0.16% 0.16% 0.00% 0.20% 0.04%5/26/2020 0.14% 0.14% 0.00% 0.18% 0.04%6/2/2020 0.11% 0.10% -0.01% 0.15% 0.04%
Report Date 6/4/2020
DTF 2008A-2bPNC CapitalPNC Bank
LoC84.8683.47
DTF 2008B-3cPNC CapitalPNC Bank
LoC44.74None
US BankTokyo Mitsubishi
LoC150.00None
TRB 2005E-1PNC Capital
PNC
87.6252.58
TRB 2005E-3PNC Capital
29.13
TRB 2012A-2
LoC
TRB 2002G-1gGoldmanTD Bank
33.78
DTF 2002B-1Clarity
TRB 2012G-2
PNCLoC
LoC
125.00
LoC70.35None
LoC
TBTA 2005AIssueRemarketing Agent
Par Outstanding ($m)
Liquidity ProviderTD Securities
Liquidity/Insurer
65.7239.43
Liquidity ProviderLoC LoC
Par Outstanding ($m) 65.72Liquidity/Insurer
BofA Merrill
TD Securities
39.43
TD BankPNC Capital
PNC
125.00
Issue TRB 2005E-2
Par Outstanding ($m) 50.00None
Liquidity/Insurer
Remarketing Agent
Issue
BofA Merrill
Bank of Montreal
Swap Notional ($m)
TRB 2015E-4
Liquidity ProviderRemarketing Agent
None
TBTA 2018EBofA MerrillBofA Merrill
LoC (Taxable)148.47
Swap Notional ($m)
Swap Notional ($m)
LoCTD Bank
102.0721.78
Master Page # 17 of 108 - Finance Committee Meeting 6/24/2020________________________________________________________________________________

METROPOLITAN TRANSPORTATION AUTHORITYVARIABLE RATE: FLOATING RATE NOTES (SIFMA)
RATE RESETS REPORT (Trailing 6-Weeks)
Transportation Revenue Bonds
Date SIFMA RateSpread
to SIFMA RateSpread
to SIFMA RateSpread
to SIFMA RateSpread
to SIFMA4/29/2020 0.22% 0.72% 0.50% 0.65% 0.43% 0.64% 0.42% 0.80% 0.58%5/6/2020 0.19% 0.69% 0.50% 0.62% 0.43% 0.61% 0.42% 0.77% 0.58%5/13/2020 0.17% 0.67% 0.50% 0.60% 0.43% 0.59% 0.42% 0.75% 0.58%5/20/2020 0.16% 0.66% 0.50% 0.59% 0.43% 0.58% 0.42% 0.74% 0.58%5/27/2020 0.14% 0.64% 0.50% 0.57% 0.43% 0.56% 0.42% 0.72% 0.58%6/3/2020 0.11% 0.61% 0.50% 0.54% 0.43% 0.53% 0.42% 0.69% 0.58%
Dedicated Tax Fund Bonds TBTA General Revenue Bonds
Date SIFMA RateSpread
to SIFMA RateSpread
to SIFMA RateSpread
to SIFMA4/29/2020 0.22% 1.22% 1.00% 0.67% 0.45% 0.47% 0.25%5/6/2020 0.19% 1.19% 1.00% 0.64% 0.45% 0.44% 0.25%5/13/2020 0.17% 1.17% 1.00% 0.62% 0.45% 0.42% 0.25%5/20/2020 0.16% 1.16% 1.00% 0.61% 0.45% 0.41% 0.25%5/27/2020 0.14% 1.14% 1.00% 0.59% 0.45% 0.39% 0.25%6/3/2020 0.11% 1.11% 1.00% 0.56% 0.45% 0.36% 0.25%
Report Date 6/4/2020
TRB 2012G-3
75.0075.00None
2/1/2025N/A
TRB 2015A-2N/A
6/1/2020None
250.00None
TRB 2014D-2N/A
11/15/2022None
165.00None
Par Outstanding ($m) 50.00Swap Notional ($m) None
Initial Purchase Date 03/01/22Liquidity/Insurer None
Issue TRB 2012A-3Remarketing Agent N/A
DTF 2008A-2a
Par Outstanding ($m) 15.90Swap Notional ($m) None
06/01/22
TBTA 2003B-2N/A
11/15/24N/A
Initial Purchase Date 11/01/20Liquidity/Insurer None
Issue DTF 2002B-3dRemarketing Agent N/A
69.63None None
36.2334.2168.53
Master Page # 18 of 108 - Finance Committee Meeting 6/24/2020________________________________________________________________________________

METROPOLITAN TRANSPORTATION AUTHORITYVARIABLE RATE: FLOATING RATE NOTES (LIBOR)
RATE RESETS REPORT (Trailing 6-Weeks)
Transportation Revenue Bonds
Date69% of 1M
LIBOR RateSpread to 1M LIBOR Rate
Spread to 1M LIBOR
4/29/2020 0.68% 1.36% 0.68% 0.98% 0.30%5/6/2020 0.26% 0.94% 0.68% 0.56% 0.30%5/13/2020 0.26% 0.94% 0.68% 0.56% 0.30%5/20/2020 0.26% 0.94% 0.68% 0.56% 0.30%5/27/2020 0.26% 0.94% 0.68% 0.56% 0.30%6/3/2020 0.12% 0.80% 0.68% 0.42% 0.30%
Date67% of 1M
LIBOR RateSpread to 1M LIBOR Rate
Spread to 1M LIBOR Rate
Spread to 1M LIBOR Rate
Spread to 1M LIBOR
4/29/2020 0.66% 1.31% 0.65% 1.48% 0.82% 1.31% 0.65% 1.21% 0.55%5/6/2020 0.25% 0.90% 0.65% 1.07% 0.82% 0.90% 0.65% 0.80% 0.55%5/13/2020 0.25% 0.90% 0.65% 1.07% 0.82% 0.90% 0.65% 0.80% 0.55%5/20/2020 0.25% 0.90% 0.65% 1.07% 0.82% 0.90% 0.65% 0.80% 0.55%5/27/2020 0.25% 0.90% 0.65% 1.07% 0.82% 0.90% 0.65% 0.80% 0.55%6/3/2020 0.12% 0.77% 0.65% 0.94% 0.82% 0.77% 0.65% 0.67% 0.55%
Date67% of 1M
LIBOR RateSpread to 1M LIBOR
4/29/2020 0.66% 1.21% 0.55%5/6/2020 0.25% 0.80% 0.55%5/13/2020 0.25% 0.80% 0.55%5/20/2020 0.25% 0.80% 0.55%5/27/2020 0.25% 0.80% 0.55%6/3/2020 0.12% 0.67% 0.55%
TBTA General Revenue Bonds
Date67% of 1M
LIBOR RateSpread to 1M LIBOR Rate
Spread to 1M LIBOR
4/29/2020 0.66% 1.36% 0.70% 1.16% 0.50%5/6/2020 0.25% 0.95% 0.70% 0.75% 0.50%5/13/2020 0.25% 0.95% 0.70% 0.75% 0.50%5/20/2020 0.25% 0.95% 0.70% 0.75% 0.50%5/27/2020 0.25% 0.95% 0.70% 0.75% 0.50%6/3/2020 0.12% 0.82% 0.70% 0.62% 0.50%
Report Date 6/4/2020
Par Outstanding ($m) 105.80105.80
TBTA 2008B-2NA
11/15/2021
Swap Notional ($m)
Initial Purchase Date 2/1/2021Remarketing Agent N/A
None
NoneLiquidity/Insurer None63.65
Issue TBTA 2005B-4a
Swap Notional ($m) 29.14 38.94
Initial Purchase Date 7/1/2021 2/1/2022Liquidity/Insurer None None
Par Outstanding ($m)92.46
N/AIssue
33.80
Liquidity/Insurer
TRB 2011BN/A
45.16
N/A11/1/2022
None99.56
N/ARemarketing AgentTRB 2005D-1
N/A7/1/2021
None131.38
TRB 2002G-1f TRB 2002G-1h
Issue TRB 2002D-2b
Liquidity/Insurer NoneInitial Purchase Date 4/1/2021
Remarketing Agent N/ATRB 2002D-2a-2
N/A4/6/2021
None
TRB 2012G-4
71.9371.93None
Initial Purchase DateRemarketing Agent
Swap Notional ($m) Par Outstanding ($m)
11/1/2022
131.38
Par Outstanding ($m) 100.00
Issue
Swap Notional ($m) 100.0050.0050.00
Master Page # 19 of 108 - Finance Committee Meeting 6/24/2020________________________________________________________________________________

METROPOLITAN TRANSPORTATION AUTHORITYVARIABLE RATE: DAILY MODE
RATE RESETS REPORT (Trailing 10 Days)
Transportation Revenue Bonds TBTA General Revenue Bonds
Date SIFMA RateSpread
to SIFMA RateSpread
to SIFMA RateSpread
to SIFMA RateSpread
to SIFMA RateSpread
to SIFMA RateSpread
to SIFMA
5/27/2020 0.14% 0.09% -0.05% 0.05% -0.09% 0.06% -0.08% 0.07% -0.07% 0.03% -0.11% 0.04% -0.10%
5/28/2020 0.14% 0.09% -0.05% 0.05% -0.09% 0.06% -0.08% 0.07% -0.07% 0.04% -0.10% 0.04% -0.10%
5/29/2020 0.14% 0.10% -0.04% 0.06% -0.08% 0.07% -0.07% 0.08% -0.06% 0.07% -0.07% 0.07% -0.07%5/30/2020 0.14% 0.10% -0.04% 0.06% -0.08% 0.07% -0.07% 0.08% -0.06% 0.07% -0.07% 0.07% -0.07%5/31/2020 0.14% 0.10% -0.04% 0.06% -0.08% 0.07% -0.07% 0.08% -0.06% 0.07% -0.07% 0.07% -0.07%6/1/2020 0.14% 0.08% -0.06% 0.04% -0.10% 0.03% -0.11% 0.06% -0.08% 0.03% -0.11% 0.04% -0.10%6/2/2020 0.14% 0.06% -0.08% 0.03% -0.11% 0.02% -0.12% 0.05% -0.09% 0.03% -0.11% 0.02% -0.12%6/3/2020 0.11% 0.05% -0.06% 0.02% -0.09% 0.02% -0.09% 0.04% -0.07% 0.02% -0.09% 0.02% -0.09%6/4/2020 0.11% 0.05% -0.06% 0.02% -0.09% 0.02% -0.09% 0.04% -0.07% 0.04% -0.07% 0.02% -0.09%6/5/2020 0.11% 0.08% -0.03% 0.04% -0.07% 0.03% -0.08% 0.04% -0.07% 0.03% -0.08% 0.04% -0.07%
TBTA General Revenue Bonds Dedicated Tax Fund Bonds
Date SIFMA RateSpread
to SIFMA RateSpread
to SIFMA RateSpread
to SIFMA RateSpread
to SIFMA RateSpread
to SIFMA5/27/2020 0.14% 0.06% -0.08% 0.04% -0.10% 0.04% -0.10% 0.06% -0.08% 0.04% -0.10%5/28/2020 0.14% 0.06% -0.08% 0.04% -0.10% 0.04% -0.10% 0.06% -0.08% 0.04% -0.10%5/29/2020 0.14% 0.07% -0.07% 0.07% -0.07% 0.08% -0.06% 0.07% -0.07% 0.06% -0.08%5/30/2020 0.14% 0.07% -0.07% 0.07% -0.07% 0.08% -0.06% 0.07% -0.07% 0.06% -0.08%5/31/2020 0.14% 0.07% -0.07% 0.07% -0.07% 0.08% -0.06% 0.07% -0.07% 0.06% -0.08%6/1/2020 0.14% 0.05% -0.09% 0.04% -0.10% 0.04% -0.10% 0.03% -0.11% 0.03% -0.11%6/2/2020 0.14% 0.04% -0.10% 0.02% -0.12% 0.04% -0.10% 0.02% -0.12% 0.02% -0.12%6/3/2020 0.11% 0.03% -0.08% 0.02% -0.09% 0.03% -0.08% 0.02% -0.09% 0.02% -0.09%6/4/2020 0.11% 0.03% -0.08% 0.02% -0.09% 0.04% -0.07% 0.02% -0.09% 0.02% -0.09%6/5/2020 0.11% 0.03% -0.08% 0.04% -0.07% 0.04% -0.07% 0.03% -0.08% 0.03% -0.08%
Report Date 6/5/2020
Liquidity Provider BofA Merrill Citibank US Bank
Swap Notional ($m) 0.00 188.30 82.50Par Outstanding ($m) 110.00 188.30 82.50
Type of Liquidity LoC LoC LoC
Dealer BofA Merrill CitigroupIssue TBTA 2003B-1 TBTA 2005B-2
Par Outstanding ($m) 87.60 77.43 154.85Swap Notional ($m) 87.60 77.43 None
84.4584.45
Liquidity Provider Helaba US Bank BofA MerrillType of Liquidity LoC LoC LoC
BarclaysLoC
Issue TRB 2005D-2 TRB 2015E-1 TRB 2015E-3Dealer Morgan Stanley US Bancorp BofA Merrill
TRB 2012G-1Barclays Capital
US BancorpTBTA 2005B-4c
154.10
LoC
TBTA 2001CGoldman
State StreetLoC
95.37
TBTA 2002FCitigroupCitibank
LoC154.10
154.49152.00
10.00
DTF 2008A-1TD Securities
TD BankLoC
TBTA 2005B-3Jefferies
State Street
188.30188.30
Master Page # 20 of 108 - Finance Committee Meeting 6/24/2020________________________________________________________________________________

METROPOLITAN TRANSPORTATION AUTHORITYVARIABLE RATE: TERM RATE MODE (SOFR)
RATE RESETS REPORT (Trailing 10 Days)
TBTA General Revenue Bonds
Date 67% of SOFR RateSpread to
SOFR5/27/2020 0.04% 0.54% 0.50%5/28/2020 0.04% 0.54% 0.50%5/29/2020 0.04% 0.54% 0.50%5/30/2020 0.04% 0.54% 0.50%5/31/2020 0.04% 0.54% 0.50%6/1/2020 0.04% 0.54% 0.50%6/2/2020 0.05% 0.55% 0.50%
6/3/2020 0.04% 0.54% 0.50%6/4/2020 0.05% 0.55% 0.50%6/5/2020 0.05% 0.55% 0.50%
Report Date 6/5/2020
Issue TBTA 2018D
Type of Liquidity FRNLiquidity Provider None
Swap Notional ($m) NonePar Outstanding ($m) 125.00
Dealer U.S. Bank
Master Page # 21 of 108 - Finance Committee Meeting 6/24/2020________________________________________________________________________________

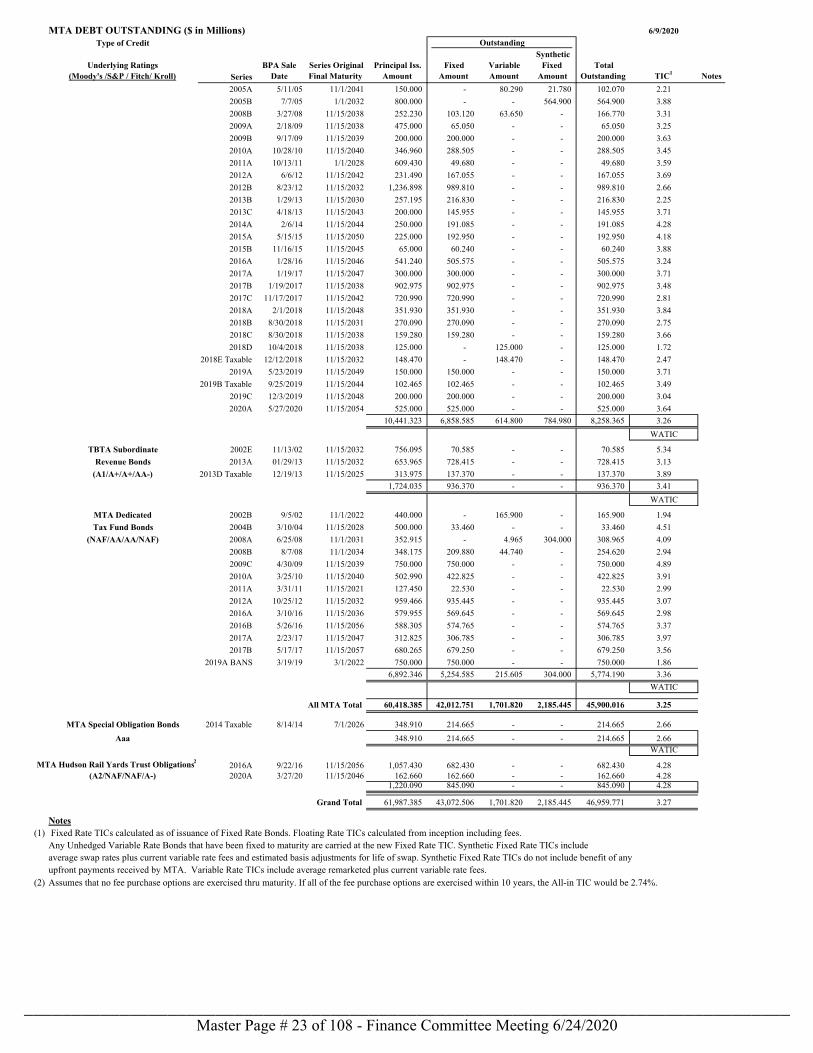
MTA DEBT OUTSTANDING ($ in Millions) 6/9/2020
Type of Credit
Underlying Ratings (Moody's /S&P / Fitch/ Kroll) Series
BPA Sale Date
Series Original Final Maturity
Principal Iss. Amount
Fixed Amount
Variable Amount
Synthetic Fixed
Amount Total
Outstanding TIC1 Notes
MTA Transportation 2002D 5/30/02 11/1/2032 400.000 174.725 - 200.000 374.725 4.55
Revenue Bonds 2002G 11/20/02 11/1/2026 400.000 - 15.515 97.215 112.730 3.91
(A2/A-/A+/AA+) 2003A 5/14/03 11/15/2032 475.340 69.695 - - 69.695 4.49
2003B 8/13/03 11/15/2032 751.765 47.590 - - 47.590 5.10
2005B 7/1/05 11/15/2035 750.000 122.735 - - 122.735 4.80
2005D 11/2/05 11/1/2035 250.000 - - 218.975 218.975 4.43
2005E 11/2/05 11/1/2035 250.000 - 87.605 131.445 219.050 3.44
2005G 12/7/05 11/1/2026 250.000 20.510 - - 20.510 4.34
2006B 12/20/06 11/15/2036 717.730 72.645 - - 72.645 4.52
2008B 2/21/08 11/15/2030 487.530 93.310 - - 93.310 2.48
2009A 10/15/09 11/15/2039 502.320 375.815 - - 375.815 3.79
2010A 1/13/10 11/15/2039 363.945 363.945 - - 363.945 4.44
2010B 2/11/10 11/15/2039 656.975 586.380 - - 586.380 4.29
2010C 7/7/10 11/15/2040 510.485 422.440 - - 422.440 4.27
2010D 12/7/10 11/15/2040 754.305 17.550 - - 17.550 5.15
2010E 12/29/10 11/15/2040 750.000 750.000 - - 750.000 4.57
2011A 7/20/11 11/15/2046 400.440 11.945 - - 11.945 4.95
2011B 9/14/11 11/1/2041 99.560 - 7.105 92.455 99.560 3.77
2011C 11/10/11 11/15/2028 197.950 105.580 - - 105.580 3.99
2011D 12/7/11 11/15/2046 480.165 31.970 - - 31.970 4.57
2012A 3/15/12 11/15/2042 150.000 50.000 100.000 - 150.000 2.13
2012B 3/15/12 11/15/2039 250.000 190.605 - - 190.605 3.85
2012C 5/3/12 11/15/2047 727.430 389.615 - - 389.615 4.22
2012D 8/20/12 11/15/2032 1,263.365 666.265 - - 666.265 3.51
2012E 7/20/12 11/15/2042 650.000 294.545 - - 294.545 3.91
2012F 9/28/12 11/15/2030 1,268.445 861.610 - - 861.610 3.17
2012G 11/13/12 11/1/2032 359.450 - - 356.375 356.375 4.25
2012H 11/15/12 11/15/2042 350.000 208.570 - - 208.570 3.70
2013A 1/24/13 11/15/2043 500.000 272.415 - - 272.415 3.79
2013B 4/2/13 11/15/2043 500.000 291.355 - - 291.355 4.08
2013C 6/11/13 11/15/2043 500.000 302.705 - - 302.705 4.25
2013D 7/11/13 11/15/2043 333.790 189.765 - - 189.765 4.63
2013E 11/15/13 11/15/2043 500.000 323.655 - - 323.655 4.64
2014A 2/28/14 11/15/2044 400.000 203.860 - - 203.860 4.31
2014B 4/17/14 11/15/2044 500.000 388.585 - - 388.585 4.38
2014C 6/26/14 11/15/2036 500.000 295.995 - - 295.995 3.32
2014D 11/4/14 11/15/2044 500.000 295.455 165.000 - 460.455 3.17
2015A 1/22/15 11/15/2045 850.000 774.175 - - 774.175 4.11
2015B 3/19/2015 11/15/2055 275.055 254.945 - - 254.945 4.29
2015C 8/18/2015 11/15/2035 550.000 550.000 - - 550.000 3.68
2015D 9/17/2015 11/15/2035 407.695 357.030 - - 357.030 3.67
2015E 9/10/2015 11/15/2050 650.000 - 496.190 - 496.190 1.60
2015F 12/17/2015 11/15/2036 330.430 298.690 - - 298.690 3.21
2016A 2/25/2016 11/15/2056 782.520 726.985 - - 726.985 3.54
2016B 6/30/2016 11/15/2037 673.990 634.840 - - 634.840 2.90
2016C 7/28/2016 11/15/2056 863.860 575.230 - - 575.230 3.52
2015X-1 (RRIF LOAN - PTC) 9/20/2016 11/15/2037 146.472 134.727 - - 134.727 2.38
2016D 10/26/2016 11/15/2035 645.655 565.940 - - 565.940 2.87
2017A 3/16/2017 11/15/2057 325.585 320.270 - - 320.270 3.77
2017B 9/28/2017 11/15/2028 662.025 662.025 - - 662.025 1.98
2017C 12/14/2017 11/15/2040 2,021.462 2,172.935 - - 2,172.935 3.12
2017D 12/21/2017 11/15/2047 643.095 643.095 - - 643.095 3.51
2018A 1/23/2018 11/15/2048 472.310 472.310 - - 472.310 1.91
2018B BANS 6/19/2018 5/15/2021 1,600.000 800.000 - - 800.000 1.95
2018B 8/23/2018 11/15/2028 207.220 191.800 - - 191.800 2.71
2018C BANS 10/10/2018 9/1/2021 900.000 900.000 - - 900.000 2.29
2019A 2/6/2019 11/15/2048 454.150 454.150 - - 454.150 4.16
2015X-2 (RRIF LOAN - PTC) 5/1/2019 11/15/2037 300.000 284.062 - - 284.062 2.38
2019B 5/14/2019 11/15/2052 177.185 177.185 - - 177.185 3.83
2019B BANS 5/22/2019 5/15/2022 1,200.000 1,000.000 - - 1,000.000 1.67
2019C BANS 7/12/2019 7/1/2020 300.000 300.000 - - 300.000 1.49
2019C 8/14/2019 11/15/2049 422.430 422.430 - - 422.430 3.39
2019D BANS 9/6/2019 9/1/2022 1,200.000 1,200.000 - - 1,200.000 1.33
2019E BANS 10/16/2019 9/1/2020 600.000 600.000 - - 600.000 1.45
2019D 11/7/2019 11/15/2048 241.745 241.745 - - 241.745 3.62
2019F BANS 12/10/2019 11/15/2022 200.000 200.000 - - 200.000 1.45
2020A BANS 1/8/2020 2/1/2023 1,500.000 1,500.000 - - 1,500.000 1.32
2020A 1/16/2020 11/15/2054 924.750 924.750 - - 924.750 3.46
2020B 3/27/2020 11/15/2046 162.660 162.660 - - 162.660 3.85
2015X-3 (RRIF LOAN - PTC) 4/20/2020 11/15/2037 244.398 244.398 - - 244.398 2.38
2020C 5/14/2020 11/15/2055 1,725.000 1,725.000 - - 1,725.000 5.17
Total 41,360.681 28,963.211 871.415 1,096.465 30,931.091 3.22
WATIC
TBTA General 2001C 12/19/01 1/1/2032 148.200 - 85.370 10.000 95.370 2.29
Revenue Bonds 2002F 11/13/02 11/1/2032 246.480 - - 154.095 154.095 3.59
(Aa3/AA-/AA-/AA) 2003B 12/10/03 1/1/2033 250.000 - 112.020 34.205 146.225 2.18
Outstanding
Master Page # 22 of 108 - Finance Committee Meeting 6/24/2020________________________________________________________________________________
MTA DEBT OUTSTANDING ($ in Millions) 6/9/2020
Type of Credit
Underlying Ratings (Moody's /S&P / Fitch/ Kroll) Series
BPA Sale Date
Series Original Final Maturity
Principal Iss. Amount
Fixed Amount
Variable Amount
Synthetic Fixed
Amount Total
Outstanding TIC1 Notes
Outstanding
2005A 5/11/05 11/1/2041 150.000 - 80.290 21.780 102.070 2.21
2005B 7/7/05 1/1/2032 800.000 - - 564.900 564.900 3.88
2008B 3/27/08 11/15/2038 252.230 103.120 63.650 - 166.770 3.31
2009A 2/18/09 11/15/2038 475.000 65.050 - - 65.050 3.25
2009B 9/17/09 11/15/2039 200.000 200.000 - - 200.000 3.63
2010A 10/28/10 11/15/2040 346.960 288.505 - - 288.505 3.45
2011A 10/13/11 1/1/2028 609.430 49.680 - - 49.680 3.59
2012A 6/6/12 11/15/2042 231.490 167.055 - - 167.055 3.69
2012B 8/23/12 11/15/2032 1,236.898 989.810 - - 989.810 2.66
2013B 1/29/13 11/15/2030 257.195 216.830 - - 216.830 2.25
2013C 4/18/13 11/15/2043 200.000 145.955 - - 145.955 3.71
2014A 2/6/14 11/15/2044 250.000 191.085 - - 191.085 4.28
2015A 5/15/15 11/15/2050 225.000 192.950 - - 192.950 4.18
2015B 11/16/15 11/15/2045 65.000 60.240 - - 60.240 3.88
2016A 1/28/16 11/15/2046 541.240 505.575 - - 505.575 3.24
2017A 1/19/17 11/15/2047 300.000 300.000 - - 300.000 3.71
2017B 1/19/2017 11/15/2038 902.975 902.975 - - 902.975 3.48
2017C 11/17/2017 11/15/2042 720.990 720.990 - - 720.990 2.81
2018A 2/1/2018 11/15/2048 351.930 351.930 - - 351.930 3.84
2018B 8/30/2018 11/15/2031 270.090 270.090 - - 270.090 2.75
2018C 8/30/2018 11/15/2038 159.280 159.280 - - 159.280 3.66
2018D 10/4/2018 11/15/2038 125.000 - 125.000 - 125.000 1.72
2018E Taxable 12/12/2018 11/15/2032 148.470 - 148.470 - 148.470 2.47
2019A 5/23/2019 11/15/2049 150.000 150.000 - - 150.000 3.71
2019B Taxable 9/25/2019 11/15/2044 102.465 102.465 - - 102.465 3.49
2019C 12/3/2019 11/15/2048 200.000 200.000 - - 200.000 3.04
2020A 5/27/2020 11/15/2054 525.000 525.000 - - 525.000 3.64
10,441.323 6,858.585 614.800 784.980 8,258.365 3.26
WATIC
TBTA Subordinate 2002E 11/13/02 11/15/2032 756.095 70.585 - - 70.585 5.34
Revenue Bonds 2013A 01/29/13 11/15/2032 653.965 728.415 - - 728.415 3.13
(A1/A+/A+/AA-) 2013D Taxable 12/19/13 11/15/2025 313.975 137.370 - - 137.370 3.89
1,724.035 936.370 - - 936.370 3.41
WATIC
MTA Dedicated 2002B 9/5/02 11/1/2022 440.000 - 165.900 - 165.900 1.94
Tax Fund Bonds 2004B 3/10/04 11/15/2028 500.000 33.460 - - 33.460 4.51
(NAF/AA/AA/NAF) 2008A 6/25/08 11/1/2031 352.915 - 4.965 304.000 308.965 4.09
2008B 8/7/08 11/1/2034 348.175 209.880 44.740 - 254.620 2.94
2009C 4/30/09 11/15/2039 750.000 750.000 - - 750.000 4.89
2010A 3/25/10 11/15/2040 502.990 422.825 - - 422.825 3.91
2011A 3/31/11 11/15/2021 127.450 22.530 - - 22.530 2.99
2012A 10/25/12 11/15/2032 959.466 935.445 - - 935.445 3.07
2016A 3/10/16 11/15/2036 579.955 569.645 - - 569.645 2.98
2016B 5/26/16 11/15/2056 588.305 574.765 - - 574.765 3.37
2017A 2/23/17 11/15/2047 312.825 306.785 - - 306.785 3.97
2017B 5/17/17 11/15/2057 680.265 679.250 - - 679.250 3.56
2019A BANS 3/19/19 3/1/2022 750.000 750.000 - - 750.000 1.86
6,892.346 5,254.585 215.605 304.000 5,774.190 3.36
WATIC
All MTA Total 60,418.385 42,012.751 1,701.820 2,185.445 45,900.016 3.25
MTA Special Obligation Bonds 2014 Taxable 8/14/14 7/1/2026 348.910 214.665 - - 214.665 2.66
Aaa 348.910 214.665 - - 214.665 2.66WATIC
MTA Hudson Rail Yards Trust Obligations22016A 9/22/16 11/15/2056 1,057.430 682.430 - - 682.430 4.28
(A2/NAF/NAF/A-) 2020A 3/27/20 11/15/2046 162.660 162.660 - - 162.660 4.281,220.090 845.090 - - 845.090 4.28
Grand Total 61,987.385 43,072.506 1,701.820 2,185.445 46,959.771 3.27
Notes(1) Fixed Rate TICs calculated as of issuance of Fixed Rate Bonds. Floating Rate TICs calculated from inception including fees.
Any Unhedged Variable Rate Bonds that have been fixed to maturity are carried at the new Fixed Rate TIC. Synthetic Fixed Rate TICs includeaverage swap rates plus current variable rate fees and estimated basis adjustments for life of swap. Synthetic Fixed Rate TICs do not include benefit of any upfront payments received by MTA. Variable Rate TICs include average remarketed plus current variable rate fees.
(2) Assumes that no fee purchase options are exercised thru maturity. If all of the fee purchase options are exercised within 10 years, the All-in TIC would be 2.74%.
Master Page # 23 of 108 - Finance Committee Meeting 6/24/2020________________________________________________________________________________

PROCUREMENTS The Procurement Agenda this month includes 2 actions for a proposed expenditure of $ 21M.
Master Page # 24 of 108 - Finance Committee Meeting 6/24/2020________________________________________________________________________________

Staff Summary
Page 1 of 1 Subject Date Request for Authorization to Award Various Procurements June 12, 2020
201
Department
Vendor Name MTA Procurement Various Department Head Name Contract Number Kuvershen Ayer Various Department Head Signature Contract Manager Name Various Div ision Head Name Table of Contents Ref # Board Action Internal Approvals Order To Date Approv al Info Other Order Approv al Order Approv al
1 Finance 06/24/20 X 1 Procurement 3 CFO
2 Board 06/24/20 X 2 Legal
PURPOSE: To obtain approval of the Board to award various contracts/contract modifications and purchase orders, as reviewed by the MTA Finance Committee. DISCUSSION:
# of Actions
$ Amount
MTAHQ proposes to award Competitive procurements in the following categories: Schedules Requiring Majority Vote: Schedule F: Personal Service Contracts 1 $ 14,049,000 Schedule H: Modifications to Personal Service & Miscellaneous Service Contracts 1 $ 6,915,964
SUBTOTAL 2 $ 20,964,964 TOTAL 2 $ 20,964,964
BUDGET IMPACT: The purchases/contracts will result in obligating MTAHQ operating and capital funds in the amount listed. Funds are available in the current MTAHQ operating/capital budgets for this purpose. RECOMMENDATION: That the purchases/contracts be approved as proposed. Items are included in the resolution of approval at the beginning of the Procurement Section.
MTA Form R0059 - 8/97
Master Page # 25 of 108 - Finance Committee Meeting 6/24/2020________________________________________________________________________________

BOARD RESOLUTION
METROPOLITAN TRANSPORTATION AUTHORITY
WHEREAS, in accordance with Section 1265-a and Section 120 of the Public Authorities Law and the All Agency Procurement Guidelines, the Board authorizes the award of certain non-competitive purchase and public work contracts, and the solicitation and award of request for proposals in regard to purchase and public work contracts; and
WHEREAS, in accordance with the All Agency Procurement Guidelines, the Board authorizes the award of certain non-competitive miscellaneous procurement contracts, and certain change orders to procurement, public work, and miscellaneous procurement contracts; and
WHEREAS, in accordance with Section 2879 of the Public Authorities Law and the All Agency Guidelines for Procurement of Services, the Board authorizes the award of certain service contracts and certain change orders to service contracts.
NOW, the Board resolves as follows:
1. As to each purchase and public work contract set forth in the annexed Schedule A, the Board declares competitive bidding to be impractical or inappropriate for the reasons specified therein and authorizes the execution of each such contract.
2. As to each request for proposals (for purchase and public work contracts) set forth in
Schedule B for which authorization to solicit proposals is requested, for the reasons specified therein the Board declares competitive bidding to be impractical or inappropriate, declares it is in the public interest to solicit competitive request for proposals and authorizes the solicitation of such proposals.
3. As to each request for proposals (for purchase and public work contracts) set forth in
Schedule C for which a recommendation is made to award the contract, the Board authorizes the execution of said contract.
4. The Board ratifies each action taken set forth in Schedule D for which ratification is
requested. 5. The Board authorizes the execution of each of the following for which Board authorization
is required: i) the miscellaneous procurement contracts set forth in Schedule E; ii) the personal service contracts set forth in Schedule F; iii) the miscellaneous service contracts set forth in Schedule G; iv) the modifications to personal/miscellaneous service contracts set forth in Schedule H; v) the contract modifications to purchase and public works contracts set forth in Schedule I; and vi) the modifications to miscellaneous procurement contracts set forth in Schedule J.
6. The Board ratifies each action taken set forth in Schedule K for which ratification is
requested. 7. The Board authorizes the budget adjustments to estimated quantity contracts set forth in
Schedule L.
Master Page # 26 of 108 - Finance Committee Meeting 6/24/2020________________________________________________________________________________

MAY 2020
LIST OF COMPETITIVE PROCUREMENTS FOR BOARD APPROVAL Procurements Requiring Majority Vote: F. Personal Service Contracts
(Staff Summaries required for all items greater than $1M: Sole Source; Other Non-Competitive; Competitive RFP.)
1. Cigna Health & Life Insurance Company $14,049,000 Staff Summary Attached
New York City Transit Authority’s Dental (not-to-exceed) Benefits Plan Contract No. 15430 Competitively negotiated – 7 proposals – 12 months plus 2 one-year options
Board approval is sought to award a competitively-negotiated personal services contract to Cigna Health and Life Insurance Company (Cigna) to provide dental benefits services to the Metropolitan Transportation Authority (MTA) on behalf of the New York City Transit Authority (NYCT) and the Manhattan and Bronx Surface Transit Operating Authority (MaBSTOA) for represented active employees, retirees and their dependents from various unions including SSSA and TSO Local 106.
H. Modifications to Personal Service and Miscellaneous Service Contracts
(Staff Summaries required for all items greater than $1M: Sole Source; Other Non-Competitive; Competitive RFP.) 2. Cubic Transportation Systems, Inc. $6,915,964 Staff Summary Attached
Bus CIS Hardware In-Depot Warranty (not-to-exceed) And Maintenance Services
Contract No. 11043-0200, Modification No. 3 Base Amount = $29,930,747 Current Contract Value = $42,274,446 Proposed New Contract Value = $49,190,410
Board approval is sought to extend a services agreement with Cubic Transportation Systems, Inc. for an additional 24 months to provide in depot warranty services for the BusCIS Hardware Subsystem (BHS) and to purchase spare hardware for maintenance for a total amount not-to-exceed $6,915,964.
Master Page # 27 of 108 - Finance Committee Meeting 6/24/2020________________________________________________________________________________

Staff Summary Schedule F: Personal Service Contracts
Page 1 of 2
Item Number: 1 SUMMARY INFORMATION Dept & Dept Head Name: Vendor Name: Contract Number: NYC Transit, Human Resources, Patricia Lodge
Cigna Health and Life Insurance Company 15430 Div ision & Div ision Head Name: Description: NYC Transit, HR - Employee Benefits, Patricia Lodge NYCTA Dental Benefits Plan
Total Amount: Board Rev iews $14,049,000
Order To Date Approv al Info Other Contract Term (including Options, if any): 1 Finance 06/24/20 X Thirty-Six (36) months 2 Board 06/24/20 X Option(s) included in Total Amount? Yes No
Renewal? Yes No Procurement Type:
Internal Approv als Competitive Non-competitive
Order Approv al Order Approv al Solicitation Type:
1 Procurement 4 CFO RFP Bid Other: 2 Legal 5 Funding Source: 3 DDCR 6 Operating Capital Federal Other:
Narrative
I. PURPOSE/RECOMMENDATION Board approval is sought to award a competitively-negotiated personal services contract to Cigna Health and Life Insurance Company (Cigna) to provide dental benefits services to the Metropolitan Transportation Authority (MTA) on behalf of the New York City Transit Authority (NYCT) and the Manhattan and Bronx Surface Transit Operating Authority (MaBSTOA) for represented active employees, retirees and their dependents from various unions including SSSA and TSO Local 106. The period of performance is 36 months from October 1, 2020 through September 30, 2023, which includes two one-year options to renew at the MTA’s sole discretion for a total not-to-exceed amount of $14,049,000 including options based on the projected enrollment.
II. DISCUSSION NYCT and MaBSTOA currently offer six (6) different plan design options across multiple carriers for a population of approximately 10,000 active and retired employees. MTA issued the Request For Proposal (RFP) with the goal to consolidate and reduce the number of plan options to two plans, a Preferred Provider Organization (PPO) and a Dental HMO (DHMO) with a best in class dental benefit service provider that would deliver optimal member experience, empower members to make optimal dental choices, and improve the overall health of the covered population of the MTA. The MTA subsidizes the full cost of the dental plans for the employees, retirees, and their eligible dependents. Participants are responsible only for the payment of applicable deductibles, co-payments, non-participating provider charges and the like, and for any services that are not covered by the insurance program.
A two-step RFP procurement process was utilized. The first step was the prequalification step to identify firms that met the MTA’s minimum requirements for a contract award of Dental Benefits in both or either fully insured and/or self-insured plans (Step 1). The prequalified firms then received the detailed RFP package (Step 2).
The Step 1 prequalification requirements for the plan providers included: a) certifications and licenses required to underwrite or administer the dental plans, b) currently offering dental PPO and/or DHMO plans similar to the plans sought in this RFP, i.e., with a minimum of three employer groups, each with 20,000 or more eligible employees and retirees, and overall current plan membership of over one million participants, and c) maintaining a network of providers meeting the minimum access standards in the Tri-state Area (NY, NJ & CT), Pennsylvania, Florida, and North and South Carolina. Ten firms submitted responses, of which eight firms met the prequalification requirements of Step 1: Cigna, Delta Dental, Emblem Health, Empire BlueCross BlueShield, HealthPlex, Solstice Health Insurance Company, Metropolitan Life Insurance Company (MetLife), and United HealthCare (UHC). These eight firms were then asked to submit proposals for Step 2 of the RFP. MTA received seven proposals as a response to Step 2 of the RFP; UHC did not submit a proposal in Step 2. The RFP allowed proposals for both fully insured and self-insured plan options. Empire proposed only a self-insured option, the other six proposers submitted proposals for both options. In addition, all firms were asked to provide proposals based on both national networks and narrower networks that met the MTA’s required geographic coverage needs. Master Page # 28 of 108 - Finance Committee Meeting 6/24/2020
________________________________________________________________________________

Staff Summary
MTA Form R0058 - 3/07
Contract No.15430 Page 2 of 2
MTA engaged Mercer Health & Benefits LLC (Mercer), a benefits consulting firm, to assist with the RFP process. Mercer assisted with the preparation of solicitation documents, and provided financial modeling and pricing analysis, as well as other support services.
The evaluation criteria were the following: i) cost to the MTA based on proposer’s submission and discount analysis; ii) proposer’s ability to replicate the requested plan designs; iii) network access and provider disruption minimization; iv) proposer’s available resources to administer the contract including portal capabilities, account team, call center and relevant experience; and v) responsiveness to the RFP and the Proposer's demonstration of a clear understanding of the objectives and constraints of the undertaking as described by the RFP documents; and vi) proposer’s diversity practices.
The Selection Committee consisted of representatives from Human Resources Administration, Collective Bargaining-Labor Relations, Finance, and the presidents of Transit Supervisors Organization of TWU Local 106 (TSO) and Subway Surface Supervisors Association (SSSA).
MTA chose to proceed with the fully insured option during the first year of the agreement as MTA may experience significant increase in utilization of these services during the first year of the contract because of members deferring care due to COVID-19 and/or as a result of the new benefit designs negotiated by collective bargaining. After the Selection Committee’s initial evaluation of proposals, all firms that provided fully insured proposals gave oral presentations and submitted their best and final offers. Cigna’s proposal with narrower network was the highest ranked proposal for both PPO and DHMO plans based on all evaluation criteria considered. The proposal met geographic coverage and matched plan designs as required by MTA.
Cigna’s original proposal for narrower network of $5,779,000 annually for insured PPO and DHMO plans was negotiated to a Best and Final Offer (BAFO) of $4,597,000 annually. The total contract cost is $14,049,000 (PPO $7,055,000/DHMO $7,044,000 net of a one-time credit of $50,000), and about $3.6M less than originally quoted. Cigna’s narrower network PPO proposal is $702,000 (11%) higher than the lowest PPO proposal received and Cigna’s DHMO narrower network proposal is the lowest priced proposal that matches the required plans coverages and designs. Although Cigna was not the lowest cost proposer, the Selection Committee determined that it provided the best value to the MTA and rated Cigna’s proposal the highest overall. The Selection Committee selected Cigna’s narrower network proposals, based on having offered the lowest price from among those with the ability to match the required plan designs with better access and less disruption. Based on the foregoing, Cigna’s BAFO pricing is found to be fair and reasonable.
A responsibility review of Cigna conducted pursuant to the All-Agency Responsibility Guidelines revealed no significant adverse information and Cigna has been found to be responsible.
III. D/M/WBE INFORMATION The MTA Department of Diversity and Civil Rights (DDCR) has established 0% MWBE/SDVOB goals on this contract because the participant data and benefit contract provisions are considered highly sensitive and confidential in nature. Subcontracting to third parties would increase the risk and exposure of confidential information. Cigna has not completed any MTA contracts with MWDBE goals; therefore, no assessment of the firm’s MWDBE performance can be determined at this time. IV. IMPACT ON FUNDING
The contract is funded by NYCTA’s operating budget. V. ALTERNATIVES
Do not approve award of the contract. This alternative is not recommended because these are benefits that NYCT must provide its employees.
Master Page # 29 of 108 - Finance Committee Meeting 6/24/2020________________________________________________________________________________

Staff Summary Schedule H: Modifications to Personal Service & Miscellaneous Service Contracts
MTA Form R0058G – 3/07
Item Number: 2 Page 1 of 1 Vendor Name (& Location): Contract Number: AWO/Modification # Cubic Transportation Systems, Inc. 11043-0200 3 Description: BusCIS Hardw are In-Depot Warranty & Maintenance Services Original Amount: $29,930,747.00
Contract Term (including Options, if any): Prior Modifications: $12,343,699 February 19, 2013 through July 31, 2020 Prior Budgetary Increases: $ 0 Option(s) included in Total Amount? Yes No Current Amount: $42,274,446 Procurement Type:
Competitive Non-competitive This Request: $6,915,964 Solicitation Type: RFP Bid Other:
Funding Source: Operating Capital Federal Other: % of This Request to Current Amount: 16%
Requesting Dept/Div & Dept/Div Head Name: % of Modifications (including This Request) to Original Amount: 64%
Donald Spero, Deputy Chief Financial Off icer
DISCUSSION: Approval is sought to extend a services agreement with Cubic Transportation Systems, Inc., for an additional 24 months to provide in depot warranty services for the BusCIS Hardware Subsystem (BHS) and to purchase spare hardware for maintenance for a total amount not-to-exceed $6,915,964. The BHS is the hardware portion of the MTA’s Bus Automatic Vehicle Location (Bus AVL) system that is located onboard the buses. AVL provides real time bus locations critical to several systems, including MTA Bus Time, Bus Trek, Fleetview, Transit Signal Priority, Digital Signs, and Automatic Passenger Counting. It also provides the data for post hoc performance analysis by Operations Planning. Thus, the MTA must maintain high BHS availability to support the many systems that rely on it. In July 2011, the MTA Board approved a competitively negotiated contract for system integration services to deploy the on-board BHS throughout the five boroughs. Two vendors, VeriFone and Cubic, were selected to provide this service and each designed, furnished and installed distinct BHS units for about 1/3rd and 2/3rd of the fleet, respectively. The combined total for all boroughs were approved as not-to exceed amount of $55 million. Each vendor then subsequently provided in-depot warranty service for their own hardware. In January 2019, the MTA decided not to renew its agreement with VeriFone, but instead extended its contract with Cubic through July 31, 2020. The extension was identical to the original agreement, except that Cubic started maintaining all BHS units, including VeriFone’s. Cubic also upgraded the VeriFone units’ modem component, which only supported the soon-to-be depreciated 3G wireless protocol, to support 4G. With a growing portfolio of technologies that began to come off warranty in 2019, and a desire for greater control over its maintenance, NYCT is evaluating alternate approaches to manage its fleet technology and systems, including possibly using in-house forces. This extension will afford NYCT and the MTA the time necessary to structure these efforts. Cubic has agreed to a net 1.5% reduction to the rates negotiated in the original agreement (comprised of a 2% escalation followed by a 3.5% reduction on all costs). Since BHS units are equipped on both NYCT and MTABC fleets, the cost for this modification will be proportionally allocated to each agency. A responsibility review of Cubic conducted pursuant to the All-Agency Responsibility Guidelines revealed no significant adverse information and Cubic has been found to be responsible.
Master Page # 30 of 108 - Finance Committee Meeting 6/24/2020________________________________________________________________________________

Master Page # 31 of 108 - Finance Committee Meeting 6/24/2020________________________________________________________________________________

Master Page # 32 of 108 - Finance Committee Meeting 6/24/2020________________________________________________________________________________

Master Page # 33 of 108 - Finance Committee Meeting 6/24/2020________________________________________________________________________________

Schedule C: Competitive Requests for Proposals (Award of Purchase and Public Work Contracts)
Staff Summary 8 Long Island Rail Road Page 1 of2
Item Number: 1 SUMMARY INFORMATION
Dept & Dept Head Name: Procurement & Logistics, Richard Mack
Department Head Signature & Date
Vendor Name I Contract Number
Myers Controlled Power, LLC 170452R
Division & Division Head Name: Department of Program Management, Description Paul Dietlin Construction, Testing and Delivery of a Mobile Substation
Division Head Signature & Date
Total Amount
Board Reviews $7,659,654.00 ($5,430,168.00 Base Work, $959,195.00 Option #1 Work and $1,270,291.00 Option #2 Work)
Order To Date Approval Info Other Contract Term (including Options, if any)
MTAJoint 1 Committee and June 24, 2020
Board 635 Days
Options(s) included in Total 181 Yes DNo Amount:
Renewal? I DYes 181 No
Procurement Type
Internal Approvals 181 Competitive D Non-Competitive
Order Approval - Order Approval Solicitation Type
4 President ~ 1 Acting Sr. VP/Operations 181 RFP 0Bid D Other:
3 VP, General Counsel & Sec'y Funding Source
2 VP &CFO D Operating D Capital 181 Federal D Other:
I. PURPOSE/RECOMMENDATION: LIRR requests MTA Board approval to award a contract to Myers Controlled Power, LLC in the amount of $7,659,654.00 ($5,430,168.00 Base Work, $959,195.00 Option #1 Work and $1,270,291.00 Option #2 Work) for the construction, testing and delivery of a mobile substation. The Mobile Substation shall consist of three separate trailers designed to interconnect to provide 34.5KV AC power to feed 750VDC traction power system. Each section shall be pre-configured as "plug and play" where the furnished cables interface with each section by modular plug connections to operate as a fully mobile substation on trailers.
The base work includes the construction, testing and delivery of an AC Switchgear trailer, Rectifier Transformer trailer and a Rectifier and DC Switchgear trailer. The option work includes an additional Rectifier Transformer trailer and an additional AC switchgear trailer.
II. DISCUSSION: On Monday October 29, 2012, The New York region suffered the devastating effects ofSuperstorm Sandy. While the most severe damage and impacts to MTA LIRR resulted from flooding of the East River Tunnels, West Side Storage Yard, Long Island City Yard, and the Long Beach Branch, portions of the Far Rockaway Branch and Shea Yard sustained damage from localized flooding, and a number of other LIRR facilities sustained damage from high winds and impacts from wind-borne debris.
The primary objective of this project is to purchase Emergency Management Equipment to improve LIRR preparedness and post-event recovery from future extreme weather events. This will allow LIRR to be better prepared for emergency situations and will help to minimize service disruptions due to power and communication failures along the right of way. This equipment will be utilized system wide, but especially in areas which are prone to flooding as well as at major yards and towers, which play a vital role in train operations.
Master Page # 34 of 108 - Finance Committee Meeting 6/24/2020________________________________________________________________________________

Schedule C: Competitive Requests for Proposals (Award of Purchase and Public Work Contracts)
Staff Summary long Island Rail Road Page 2 of 2
The November 2013 Board authorized LIRR to use the competitive Request for Proposal (RFP) process without obtaining pre-approval to use the RFP process, when utilizing Federal Superstorm Sandy relief funds. In December 2019, the RFP was advertised in the New York State Contract Reporter, New York Post and on MT A's website. In addition, the RFP package was sent directly to sixteen firms known to have experience with the type of work required for this project.
On February 21, 2020, LIRR received three proposals in response to the RFP from the following firms: Myers Controlled Power LLC (Myers), Power Resources International Inc. and Siemens Corporation. A Technical Evaluation Committee (TEC) assessed each firm's technical proposal against the technical evaluation criteria set forth in the RFP, which consisted of technical approach; demonstrated ability to meet schedule; and project team including key personnel. Evaluations were performed based on the TEC's final technical scoring, cost and diversity scores. Based upon these evaluations, Myers was identified as the top ranked proposer as its technical proposal met, and in a number of cases exceeded the RFP requirements. In addition, Myers' price was significantly less than the prices identified by the other two proposers in their cost proposals. Myers was invited to submit a Best And Final Offer (BAFO), which was received on May 4, 2020. LIRR Estimating reviewed the cost proposal and BAFO submitted by Myers and concluded that their price is fair and reasonable.
LIRR also conducted a responsibility review of Myers in April 2020 and no adverse information was found. Accordingly, Myers is considered a responsive and responsible vendor for the proposed contract.
III. D/M/WBE INFORMATION: The MTA Department of Diversity and Civil Rights (DDCR) has established 4% DBE goals for this project. The contract will not be awarded until Myers' DBE plan has been approved by DDCR.
IV. IMPACT ON FUNDING: This Contract will be funded with monies from Federal Superstorm Sandy relief funds, which includes certain funding from the Federal Transit Administration (FTA).
V. ALTERNATIVES: None recommended. A new solicitation is unlikely to result in better pricing and will prolong LIRR's ability to purchase this mobile substation.
VI. RECOMMENDATION: It is recommended that the MT A Board approve the award of Contract No. l 70452R to Myers Controlled Power, LLC. in the amount of $7,659,654.00 for the construction, testing and delivery of a mobile substation.
Master Page # 35 of 108 - Finance Committee Meeting 6/24/2020________________________________________________________________________________

Schedule K: Ratification of Completed Procurement Actions
Item Number: 1 Vendor Name (Location) Contract Number AWO/Mod. #s Siemens Industry (New York, New York) S-48004-1 20 Description
CBTC for Queens Boulevard Line West Phase 1 Original Amount: $ 156,172,932
Contract Term (including Options, if any) Prior Modifications: $ 14,063,345 August 24, 2015–March 24, 2021 Prior Budgetary Increases: $ 0 Option(s) included in Total Amt? Yes No n/a Current Amount: $ 170,236,277 Procurement Type Competitive Noncompetitive Solicitation Type RFP Bid Other: Modification This Request: $ 11,900,000 Funding Source
Operating Capital Federal Other: % of This Request to Current Amt.: 7.0% Requesting Dept./Div., Dept./Div. Head Name: % of Modifications (including This
Request) to Original Amount: 16.6% Capital Program Management, Alok Saha
Discussion:
This retroactive modification is to purchase 30 additional carborne Communication-Based Train Control (“CBTC”) equipment units to complete the carborne installation on the entire R160 fleet. Additionally, the contractor will design and install a remote download
system to allow future upgrades of the onboard CBTC software to be downloaded to the units while in service instead of sending
personnel to perform manual updates when the trains are out of service.
This (Siemens) contract is one of three interrelated contracts that together will provide a CBTC/Automatic Train Supervision system for the Queens Boulevard line (“QBL”) portion of Subways’ B division. Contract S-48005 was awarded to L.K. Comstock & Co.
Inc. for the wayside installation of the CBTC system. To demonstrate interoperability and integration between the two previously
approved CBTC systems on a revenue line, supplier contracts were awarded to both Siemens (S-48004-1) and Thales Transport
and Security, Inc. (S-48004-2) to provide carborne and wayside equipment. NYC Transit in-house labor installs the carborne
equipment on the R160 subway cars.
The base contract calls for the furnishing of 305 CBTC carborne equipment units (four additional units are provided under the
Thales contract) to provide service on the Queens Boulevard line, and of these, 16 units to add service on the Canarsie line. (A
subway train of eight or 10 cars is comprised of two units.) This left 13 subway trains (26 units), that were previously expected to
be assigned to other subway lines, unequipped for CBTC. NYC Transit determined that it would be more efficient to equip the
entire R160 fleet under this contract to standardize the fleet with one supplier’s equipment, providing full flexibility for deployment of R160 cars and uniformity to the maintenance of the car fleet and stock of spare parts. This modification will equip the balance
of the R160 fleet: 26 units with an additional four sets of equipment for spares. Installation will be performed by NYC Transit
forces under the direction of Siemens personnel, the same as the base contract installations.
Currently, all software upgrades require personnel to have physical access to the train cabs to install software updates using laptop computers connected to each unit’s onboard computer system. This work can only take place when the train is not in service. With
over 300 units (and more in the future), upgrading the entire fleet is a time-consuming process. Considering the time for each
software upgrade and total number of units, it would be significantly more efficient if updates could be downloaded to the units
remotely while trains were in service. This modification calls for the development of software and hardware (to be installed by
NYC Transit personnel) to enable remote software downloads when a unit is in proximity of an update base station (at a key point
on the line to maximize the number of units that pass). The system will be capable of downloading upgrades in parts so that the
train will not have to wait for the download to finish. This capability will be installed on future CBTC car upgrades including the
R179 and R211.
Master Page # 36 of 108 - Finance Committee Meeting 6/24/2020________________________________________________________________________________

Schedule K: Ratification of Completed Procurement Actions
Cont’d
In addition to future savings associated with software upgrades, the remote download capability also results in cost savings
associated with the contractor installing updates during the life of the contract. Accordingly, this modification also includes a credit
for this cost savings.
The SVP Capital Program Management (“CPM”) approved retroactive waivers for the procurement of long-lead items associated
with the additional carborne equipment to ensure timely completion of the additional work by October 31, 2021.
The contractor submitted its proposal in the amount of $12,715,839. The final in-house estimate is in the amount of $10,883,693. Negotiations resulted in an agreed-upon lump-sum price of $11,900,000. Savings of $815,839 were achieved. CPM and
Procurement found this price to be fair and reasonable.
In connection with a previous contract awarded to Siemens, Siemens was found to be responsible notwithstanding significant
adverse information (“SAI”) pursuant to the All-Agency Responsibility Guidelines and such responsibility finding was approved
by the MTA Chairman and Chief Executive Office in consultation with the MTA General Counsel in August 2016. No new SAI
has been found relating to Siemens and Siemens has been found to be responsible. A Contractor Compliance Program was put in
place for Siemens in April 2018.
Master Page # 37 of 108 - Finance Committee Meeting 6/24/2020________________________________________________________________________________

Schedule H: Modifications to Personal Service Contracts and Miscellaneous Service Contracts
Item Number: Vendor Name (& Location) Contract Number AWO/Modification Conduent State & Local Solutions PSC-05-2741 Description E-ZPass New York Customer Service Center Services Original Amount: $184,000,000
Prior Modifications: $325,575,167 Contract Term (including Options, if any) October 5, 2007– October 4, 2020 Prior Budgetary Increases: $0.00 Option(s) included in Total Amount? Yes No Current Amount: $509,575,167 Procurement Type Competitive Non-competitive
This Request: $94,193,824 Solicitation Type RFP Bid Other: Funding Source
Operating Capital Federal Other: % of This Request to Current Amount: 18.5%
Requesting Dept/Div & Dept/Div Head Name: % of Modifications (including This Request) to Original Amount:
228.1% Allison L. C. de Cerreño, Sr. Vice President DISCUSSION B&T is seeking Board approval under the All Agency Service Contract Procurement Guidelines to amend this personal service contract, Contract PSC-05-2741, E-ZPass New York Customer Service Center (NYCSC) Services with Conduent State & Local Solutions (Conduent) to increase funding in the amount of $94,193,824 and extend the duration an additional two (2) years.
In October 2007 pursuant to Board approval the Contract was awarded to Conduent in the negotiated amount of $184,000,000 for a duration of ten (10) years, with one three (3) year renewal option. Subsequently, in May 2016 the Board approved the three (3) year option to extend the Contract through October 2020.
This competitively solicited joint procurement included B&T, the New York State Thruway Authority and the Port Authority of New York and New Jersey (NYCSC Agencies). The NYCSC agencies individually executed contracts with Conduent to operate a single E-ZPass New York Customer Service Center (NYCSC) that would provide E-ZPass customer services for all NYCSC Agencies. Currently, the NYCSC manages: over 6.7 million active E-ZPass accounts with over 12 million active tags; processing in excess of 1.0 billion toll transactions; collecting over 60 million payments; handling approximately 15 million telephone inquiries; and processing over 1.0 million pieces of correspondence annually for the NYCSC Agencies. B&T accounts for approximately 60% of the volume of these categories. To date, 11 amendments have been issued, which include modifications for Open Road Cashless Tolling and services to support the implementation of the Central Business District Tolling Program (CBDTP).
This amendment is to extend the duration of the Contract for an additional two (2) years and provide required funding for ongoing NYCSC services until new procurements can be awarded and are implemented. In addition, this amendment will also provide required funding for the equipment and installation of the Vehicle Occupant Detection System (VODS) on the eastbound Verrazzano-Narrows Bridge (VNB) as part of the federally mandated implementation of split tolling on the VNB. The VODS system enables B&T to identify vehicles eligible for the Staten Island Resident carpool plan toll rate.
In anticipation of the expiration of the Contract in October of 2020, the NYCSC Agencies issued two (2) joint Requests for Proposals (RFPs) in June and September of 2017 for new regional customer service center contracts to replace the current contract. The solicitation was structured into two (2) separate RFPs: (i) the Systems RFP was intended to select a contractor to design, develop, implement and maintain the System for NYCSC operations and (ii) the Operations RFP was to select a contractor to provide customer service operations that would utilize the selected Systems. Due to limited competition (only two proposals for the System’s RFP were received) and the need to make material changes to the Scope of Work (added services to support the CBDTP), the NYCSC Agencies determined that it was in their best interests to reject all proposals under the RFPs, revise the contracting approach and re-solicit the services.
The re-solicitation is once again structured into two (2) separate RFPs, with two (2) sub-categories for selected services that can be separately proposed and awarded. The NYCSC agencies have received proposals for the Systems RFP and are in the evaluation process to select the contractor(s). The Operations RFP was issued in March 2020. It is anticipated that the new contracts will be awarded by the fourth quarter of this year and that it will take approximately two (2) years to transition to the new contract(s). The NYCSC Agencies’ current contract expires in October of 2020, so B&T is
Master Page # 38 of 108 - Finance Committee Meeting 6/24/2020________________________________________________________________________________
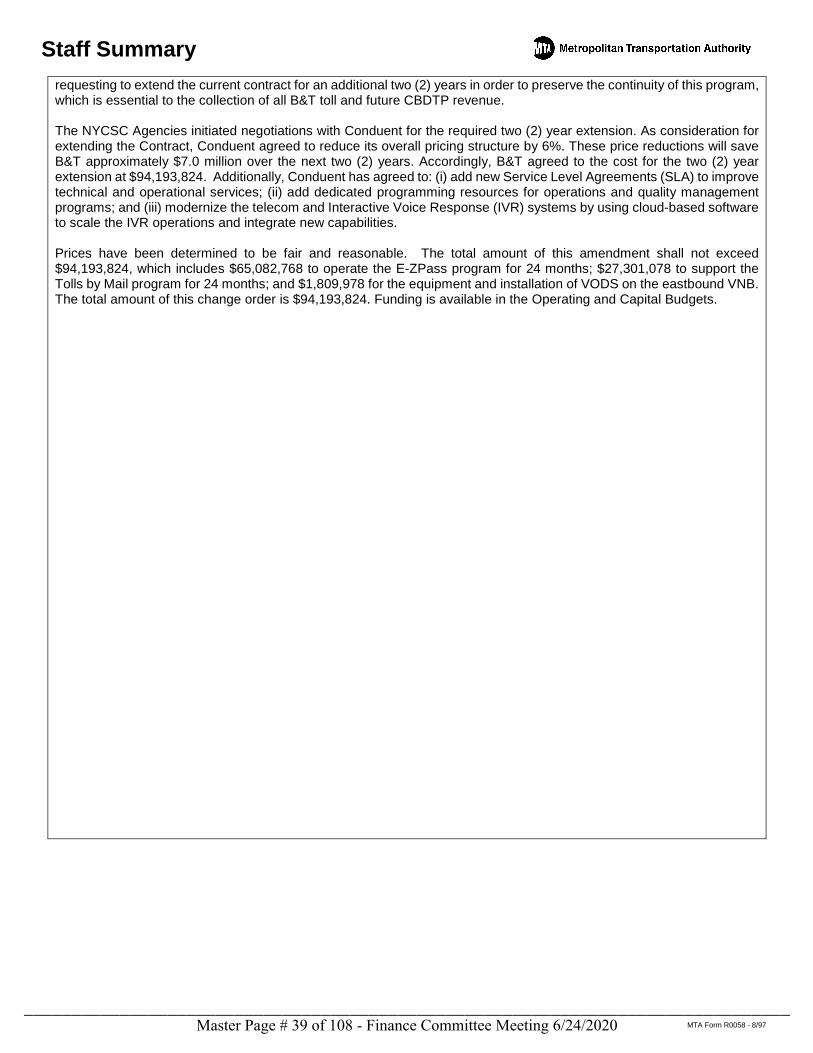
Staff Summary
MTA Form R0058 - 8/97
requesting to extend the current contract for an additional two (2) years in order to preserve the continuity of this program, which is essential to the collection of all B&T toll and future CBDTP revenue. The NYCSC Agencies initiated negotiations with Conduent for the required two (2) year extension. As consideration for extending the Contract, Conduent agreed to reduce its overall pricing structure by 6%. These price reductions will save B&T approximately $7.0 million over the next two (2) years. Accordingly, B&T agreed to the cost for the two (2) year extension at $94,193,824. Additionally, Conduent has agreed to: (i) add new Service Level Agreements (SLA) to improve technical and operational services; (ii) add dedicated programming resources for operations and quality management programs; and (iii) modernize the telecom and Interactive Voice Response (IVR) systems by using cloud-based software to scale the IVR operations and integrate new capabilities. Prices have been determined to be fair and reasonable. The total amount of this amendment shall not exceed $94,193,824, which includes $65,082,768 to operate the E-ZPass program for 24 months; $27,301,078 to support the Tolls by Mail program for 24 months; and $1,809,978 for the equipment and installation of VODS on the eastbound VNB. The total amount of this change order is $94,193,824. Funding is available in the Operating and Capital Budgets.
Master Page # 39 of 108 - Finance Committee Meeting 6/24/2020________________________________________________________________________________

METROPOLITAN TRANSPORTATION AUTHORITYFebruary Financial Plan - 2020 Adopted Budget
Accrual Statement of Operations by CategoryMay 2020 Monthly
($ in millions)
Non-Reimbursable Reimbursable TotalAdopted
Budget Actual -Variance:
DollarsFav/(Unfav)-
Percent Adopted
Budget Actual -Variance:
DollarsFav/(Unfav)-
Percent Adopted
Budget Actual -Variance:
DollarsFav/(Unfav)-
Percent Revenue
Farebox Revenue $547.9 $61.3 ($486.6) (88.8) $0.0 $0.0 $0.0 N/A $547.9 $61.3 ($486.6) (88.8)Toll Revenue 185.4 100.1 (85.3) (46.0) 0.0 0.0 0.0 N/A 185.4 100.1 (85.3) (46.0)Other Revenue 56.8 2,127.7 2,070.9 > 100.0 0.0 0.0 0.0 N/A 56.8 2,127.7 2,070.9 >100.0 Capital and Other Reimbursements 0.0 0.0 0.0 N/A 182.4 194.2 11.8 6.4 182.4 194.2 11.8 6.4
Total Revenues $790.1 $2,289.0 $1,499.0 > 100.0 $182.4 $194.2 $11.8 6.4 $972.5 $2,483.2 $1,510.7 >100.0
ExpensesLabor:
Payroll $454.6 $449.5 $5.1 1.1 $61.8 $63.2 ($1.3) (2.2) $516.4 $512.7 $3.8 0.7 Overtime 69.8 51.2 18.6 26.7 17.2 20.5 (3.3) (19.1) 87.0 71.7 15.3 17.6 Health and Welfare 116.3 129.6 (13.4) (11.5) 7.1 6.5 0.6 8.1 123.4 136.2 (12.8) (10.4)OPEB Current Payments 57.7 62.7 (5.0) (8.6) 1.0 0.8 0.2 22.0 58.8 63.5 (4.7) (8.0)Pension 110.2 124.7 (14.5) (13.2) 8.8 9.0 (0.2) (2.0) 119.0 133.7 (14.7) (12.3)Other Fringe Benefits 79.8 73.7 6.1 7.6 20.4 21.2 (0.9) (4.2) 100.2 95.0 5.2 5.2 Reimbursable Overhead (32.7) (36.0) 3.2 9.9 32.5 35.8 (3.3) (10.2) (0.2) (0.2) (0.1) (24.9)
Total Labor Expenses $855.6 $855.4 $0.2 0.0 $149.0 $157.1 ($8.2) (5.5) $1,004.6 $1,012.5 ($8.0) (0.8)
Non-Labor:Electric Power $36.6 $21.5 $15.0 41.2 $0.0 $0.0 $0.0 (9.3) $36.6 $21.6 $15.0 41.1 Fuel 14.7 6.3 8.4 57.0 0.0 0.0 0.0 <(100.0) 14.7 6.3 8.4 57.0 Insurance 0.4 0.2 0.2 46.6 1.3 0.9 0.4 31.0 1.7 1.1 0.6 34.9 Claims 34.1 43.0 (8.8) (25.9) 0.0 0.0 0.0 N/A 34.1 43.0 (8.8) (25.9)Paratransit Service Contracts 42.0 18.7 23.3 55.4 0.0 0.0 0.0 N/A 42.0 18.7 23.3 55.4 Maintenance and Other Operating Contracts 57.7 55.3 2.4 4.2 8.8 10.2 (1.4) (15.3) 66.5 65.4 1.0 1.6 Professional Services Contracts 54.8 49.3 5.5 10.1 9.7 9.1 0.6 6.4 64.5 58.4 6.2 9.5 Materials and Supplies 56.1 26.8 29.2 52.1 13.4 16.6 (3.3) (24.3) 69.4 43.5 26.0 37.4 Other Business Expenses 18.6 8.0 10.7 57.2 0.3 0.3 0.0 1.4 18.9 8.3 10.7 56.3
Total Non-Labor Expenses $314.9 $229.1 $85.9 27.3 $33.5 $37.1 ($3.6) (10.7) $348.4 $266.2 $82.3 23.6
Other Expense AdjustmentsOther $7.1 $4.8 $2.4 33.0 $0.0 $0.0 $0.0 N/A $7.1 $4.8 $2.4 33.0 General Reserve 0.0 0.0 0.0 N/A 0.0 0.0 0.0 N/A 0.0 0.0 0.0 N/A
Total Other Expense Adjustments $7.1 $4.8 $2.4 33.0 $0.0 $0.0 $0.0 N/A $7.1 $4.8 $2.4 33.0
Total Expenses Before Non-Cash Liability Adjs. $1,177.7 $1,089.3 $88.4 7.5 $182.4 $194.2 ($11.8) (6.4) $1,360.1 $1,283.5 $76.7 5.6
Depreciation $237.0 $247.1 ($10.1) (4.3) $0.0 $0.0 $0.0 N/A $237.0 $247.1 ($10.1) (4.3)OPEB Liability Adjustment 0.0 0.0 0.0 100.0 0.0 0.0 0.0 N/A 0.0 0.0 0.0 100.0 GASB 75 OPEB Expense Adjustment 8.2 0.0 8.2 100.0 0.0 0.0 0.0 N/A 8.2 0.0 8.2 100.0 GASB 68 Pension Expense Adjustment 3.8 0.0 3.8 100.0 0.0 0.0 0.0 N/A 3.8 0.0 3.8 100.0 Environmental Remediation 0.5 0.2 0.3 66.7 0.0 0.0 0.0 N/A 0.5 0.2 0.3 66.7
Total Expenses After Non-Cash Liability Adjs. $1,427.2 $1,336.5 $90.7 6.4 $182.4 $194.2 ($11.8) (6.4) $1,609.7 $1,530.7 $78.9 4.9
Less: B&T Depreciation & GASB Adjustments $13.4 $14.4 ($1.0) (7.1) $0.0 $0.0 $0.0 0.0 $13.4 $14.4 ($1.0) (7.1)
Adjusted Total Expenses $1,413.8 $1,322.1 $91.6 6.5 $182.4 $194.2 ($11.8) (6.4) $1,596.2 $1,516.3 $79.9 5.0
Net Surplus/(Deficit) ($623.7) $966.9 $1,590.6 255.0 $0.0 $0.0 $0.0 N/A ($623.7) $966.9 $1,590.6 255.0
Total Subsidies $337.2 $2,657.1 $2,319.9 > 100.0 $0.0 $0.0 $0.0 N/A $337.2 $2,657.1 $2,319.9 >100.0
Debt Service 194.0 176.1 17.9 9.2 0.0 0.0 0.0 N/A 194.0 176.1 17.9 9.2
Notes: Totals may not add due to rounding
Results are based on the preliminary close of the general ledger and are subject to review and adjustment. Please note that the current months' actuals do not include post-close adjustments, which will be captured in the YTD results.
Master Page # 40 of 108 - Finance C
omm
ittee Meeting 6/24/2020
________________________________________________________________________________

METROPOLITAN TRANSPORTATION AUTHORITYFebruary Financial Plan - 2020 Adopted Budget
Accrual Statement of Operations by CategoryMay 2020 Year-to-Date
($ in millions)
Non-Reimbursable Reimbursable TotalAdopted
Budget Actual -Variance:
DollarsFav/(Unfav)-
Percent Adopted
Budget Actual -Variance:
DollarsFav/(Unfav)-
Percent Adopted
Budget Actual -Variance:
DollarsFav/(Unfav)-
Percent Revenue
Farebox Revenue $2,641.8 $1,475.2 ($1,166.5) (44.2) $0.0 $0.0 $0.0 N/A $2,641.8 $1,475.2 ($1,166.5) (44.2)Toll Revenue 835.7 604.9 (230.9) (27.6) 0.0 0.0 0.0 N/A 835.7 604.9 (230.9) (27.6)Other Revenue 278.0 2,372.5 2,094.5 > 100.0 0.0 0.0 0.0 N/A 278.0 2,372.5 2,094.5 >100.0 Capital and Other Reimbursements 0.0 0.0 0.0 N/A 944.2 792.5 (151.7) (16.1) 944.2 792.5 (151.7) (16.1)
Total Revenues $3,755.5 $4,452.6 $697.1 18.6 $944.2 $792.5 ($151.7) (16.1) $4,699.7 $5,245.1 $545.4 11.6
ExpensesLabor:
Payroll $2,239.4 $2,213.9 $25.5 1.1 $323.7 $259.4 $64.3 19.9 $2,563.1 $2,473.3 $89.8 3.5 Overtime 359.3 319.1 40.2 11.2 88.1 85.2 2.9 3.3 447.3 404.3 43.1 9.6 Health and Welfare 588.6 596.7 (8.1) (1.4) 33.9 31.4 2.5 7.4 622.5 628.2 (5.6) (0.9)OPEB Current Payments 292.7 307.6 (14.8) (5.1) 5.2 4.7 0.6 10.6 297.9 312.2 (14.3) (4.8)Pension 562.4 608.7 (46.3) (8.2) 42.2 39.2 3.0 7.1 604.5 647.9 (43.3) (7.2)Other Fringe Benefits 395.4 394.1 1.3 0.3 109.3 88.1 21.2 19.4 504.7 482.2 22.5 4.5 Reimbursable Overhead (174.9) (150.0) (24.9) (14.2) 173.6 148.9 24.7 14.2 (1.3) (1.1) (0.2) (16.9)
Total Labor Expenses $4,262.8 $4,290.0 ($27.2) (0.6) $776.1 $657.0 $119.2 15.4 $5,038.9 $4,947.0 $91.9 1.8
Non-Labor:Electric Power $199.4 $161.7 $37.7 18.9 $0.2 $0.1 $0.1 36.4 $199.6 $161.8 $37.8 18.9 Fuel 76.0 53.5 22.5 29.6 0.0 0.0 0.0 95.9 76.1 53.5 22.5 29.6 Insurance 2.9 2.5 0.4 15.0 5.5 3.7 1.8 32.5 8.4 6.2 2.2 26.5 Claims 171.6 182.4 (10.8) (6.3) 0.0 0.0 0.0 N/A 171.6 182.4 (10.8) (6.3)Paratransit Service Contracts 199.7 142.9 56.8 28.4 0.0 0.0 0.0 N/A 199.7 142.9 56.8 28.4 Maintenance and Other Operating Contracts 275.6 265.4 10.2 3.7 45.4 32.0 13.4 29.6 321.0 297.4 23.6 7.4 Professional Services Contracts 276.4 187.3 89.1 32.2 49.7 45.8 3.9 7.9 326.1 233.1 93.1 28.5 Materials and Supplies 278.0 201.6 76.5 27.5 68.0 51.2 16.8 24.7 346.0 252.8 93.2 26.9 Other Business Expenses 105.6 61.4 44.2 41.8 (0.8) 2.7 (3.5) <(100.0) 104.8 64.1 40.7 38.8
Total Non-Labor Expenses $1,585.3 $1,258.6 $326.7 20.6 $168.1 $135.5 $32.5 19.4 $1,753.4 $1,394.2 $359.2 20.5
Other Expense AdjustmentsOther $35.7 $24.8 $10.9 30.7 $0.0 $0.0 $0.0 N/A $35.7 $24.8 $10.9 30.7 General Reserve 0.0 0.0 0.0 N/A 0.0 0.0 0.0 N/A 0.0 0.0 0.0 N/A
Total Other Expense Adjustments $35.7 $24.8 $10.9 30.7 $0.0 $0.0 $0.0 N/A $35.7 $24.8 $10.9 30.7
Total Expenses Before Non-Cash Liability Adjs. $5,883.8 $5,573.4 $310.4 5.3 $944.2 $792.5 $151.7 16.1 $6,828.0 $6,365.9 $462.1 6.8
Depreciation $1,184.4 $1,232.8 ($48.4) (4.1) $0.0 $0.0 $0.0 N/A $1,184.4 $1,232.8 ($48.4) (4.1)OPEB Liability Adjustment 0.0 0.0 0.0 100.0 0.0 0.0 0.0 N/A 0.0 0.0 0.0 100.0 GASB 75 OPEB Expense Adjustment 389.7 (12.5) 402.2 > 100.0 0.0 0.0 0.0 N/A 389.7 (12.5) 402.2 >100.0 GASB 68 Pension Expense Adjustment 16.9 (4.1) 20.9 > 100.0 0.0 0.0 0.0 N/A 16.9 (4.1) 20.9 >100.0 Environmental Remediation 2.5 1.3 1.2 47.0 0.0 0.0 0.0 N/A 2.5 1.3 1.2 47.0
Total Expenses After Non-Cash Liability Adjs. $7,477.3 $6,790.9 $686.3 9.2 $944.2 $792.5 $151.7 16.1 $8,421.5 $7,583.4 $838.0 10.0
Less: B&T Depreciation & GASB Adjustments $65.9 $71.6 ($5.6) (8.5) $0.0 $0.0 $0.0 0.0 $65.9 $71.6 ($5.6) (8.5)
Adjusted Total Expenses $7,411.3 $6,719.4 $692.0 9.3 $944.2 $792.5 $151.7 16.1 $8,355.5 $7,511.9 $843.7 10.1
Net Surplus/(Deficit) ($3,655.9) ($2,266.8) $1,389.1 38.0 $0.0 $0.0 $0.0 N/A ($3,655.9) ($2,266.8) $1,389.1 38.0
Total Subsidies $4,131.9 $3,943.6 ($188.3) (4.6) $0.0 $0.0 $0.0 N/A $4,131.9 $3,943.6 ($188.3) (4.6)
Debt Service 1,171.4 1,160.6 10.8 0.9 0.0 0.0 0.0 N/A 1,171.4 1,160.6 10.8 0.9
Notes: Totals may not add due to rounding
Results are based on the preliminary close of the general ledger and are subject to review and adjustment. Please note that the current months' actuals do not include post-close adjustments, which will be captured in the YTD results.
Master Page # 41 of 108 - Finance C
omm
ittee Meeting 6/24/2020
________________________________________________________________________________

MAY MAY 2020 YEAR-TO-DATE
Nonreimbor Reimb Reason for Variance Reason for Variance
$ % $ %Farebox Revenue NR (486.6) (88.8) Passenger revenue was lower at NYCT, MNR, the LIRR, MTA Bus and
SIR by ($343.0M), ($62.6M), ($61.9M), ($18.6M), and ($0.5M)respectively, and reflects ongoing impacts of Governor Cuomo's NYPAUSE Executive Order.
(1,166.5) (44.2) Reflects the ongoing impact of Governor Cuomo's NY PAUSE ExecutiveOrder, effective March 24th, which severely limits non-essentialactivities throughout the State, and other actions taken to preventspread and transmission of COVID-19. The resulting precipitous drop inthe utilization of MTA services at NYCT, MNR, the LIRR, MTA Bus, andSIR resulted in unfavorable variances of ($843.1M), ($140.1M),($137.9M), ($44.1M) and ($1.3M), respectively.
Vehicle Toll Revenue NR (85.3) (46.0) Toll revenue was significantly lower and indicative of ongoing impactsof Governor Cuomo's NY PAUSE Executive Order.
(230.9) (27.6) Reflects the ongoing impact of the NY PAUSE Executive Order, whichsignificantly reduced traffic volume and drastically lowered toll revenueas a result of COVID-19.
Other Operating Revenue NR 2,070.9 * The favorable variance reflects receipts from the Coronavirus Aid,Relief, and Economic Security (CARES) Act, which covered operatinglosses incurred through the end of April; and by Agency, causedvariances of $1,462.4M at NYCT (partially offset by lower Paratransitreimbursement); $262.6M at the LIRR (partially offset by loweradvertising revenue); $181.5M at MTA Bus (partially offset by lowerstudent reimbursement); $147.5M at MNR (partially offset by lower GCTretail income and advertising revenue); and $13.2M at SIR. FMTAC was$4.4M favorable due to a positive shift in the market value of theinvested asset portfolio and higher realized income from investments. AtMTAHQ, Transit Museum revenue fell short of the budget by $0.7M andwas COVID-related.
2,094.5 * CARES Act receipts drove the substantial favorable variances at NYCT,the LIRR, MTA Bus, MNR, FMTAC, SIR, and B&T of $1,463.8M,$261.2M, $178.8M, $146.8M, $29.6M, $13.2M, and $3.0M, respectively.At MTAHQ, lower Transit Museum revenue coupled with unfavorabletiming in the recovery of relocation costs and other income fell short ofthe budget by ($1.8M).
Payroll NR 5.1 1.1 Vacancies contributed to the favorable outcomes of $10.4M at the LIRRand $2.2M at B&T. These were partially offset by unfavorable results of($4.3M) at MTAHQ, which includes timing of agency billings; ($2.6M) atMTA Bus due to a prior period interagency payment and lower attrition;and ($1.2M) at NYCT, which mainly reflects the reassignment of areimbursable workforce to operating (non-reimbursable) due to lowercapital project activity.
25.5 1.1 The MTA-wide hiring freeze continues to generate substantial vacancysavings at the LIRR (including higher sick pay law claim credits),MTAHQ, and B&T–with variances of $25.9M, $8.4M, and $5.5M,respectively. Partially offsetting these results were impacts from thesame factors noted for the month, as well as higher cash pay-out of sickand personal time, and lower attrition at MTA Bus ($6.9M). Alsocontributing to the variance was lower capital project activity, whichresulted in the reassignment of the reimbursable workforce tooperations (non-reimbursable) at NYCT ($4.4M) and MNR ($3.0M).
Overtime NR 18.6 26.7 This favorable variance mainly reflects savings from reduced service(the impact of operating an essential service schedule in response tothe COVID-19 pandemic), as well as fewer weather-related coveragerequirements, timing, and revised assumptions for maintenance work.Lower costs for the month totaled: $9.1M at NYCT (including the timingof reimbursable expenses), $7.1M at the LIRR (including lower weather-related emergencies and maintenance), and $2.3M at MNR (includingstaggered shift coverage, improved availability, and fewer weather-related emergencies). B&T was $1.6M favorable due to timing andlower vacancy/absentee coverage requirements. Partially offsetting thefavorable outcomes were MTAPD overruns resulting from increasedvacancy/absentee and security coverage requirements, ($0.8M) atMTAHQ, and higher maintenance requirements to disinfect fleet,implement safety procedures, and provide vacancy/absentee coverage($0.7M) at MTA Bus. (See overtime variance analysis charts for moredetails.)
40.2 11.2 Savings result mainly from fewer weather-related events, reducedservice requirements, and improved management controls, $21.5M atNYCT. Other underruns include a continuation of the factors describedfor the month, but with favorable variances of $14.3M at the LIRR and$6.4M at MNR; as well as lower expenses resulting from rescheduledand deferred maintenance work as a result of the pandemic, $3.2M atB&T; and fewer weather-related events and vacancies, $0.5M at SIR.Partially offsetting these results were overruns from greater support forfare evasion mitigation, quality of life initiatives, COVID-19-relatedpatrols, and vacancy/absentee coverage requirements, ($4.5M) atMTAHQ for MTA PD; and higher maintenance requirements due toCOVID-19 bus disinfections, safety procedures, and aging fleetmaintenance/campaign work ($1.2M) at MTA Bus. (See overtimevariance analysis charts for more detail.)
METROPOLITAN TRANSPORTATION AUTHORITYCONSOLIDATED ACCRUAL STATEMENT OF OPERATIONS BY CATEGORY
EXPLANATION OF VARIANCES BETWEEN ADOPTED BUDGET AND ACTUAL - ACCRUAL BASISMAY 2020
Generic Revenue or Expense Category
Favorable Favorable(Unfavorable) (Unfavorable)
($ in millions)
Master Page # 42 of 108 - Finance C
omm
ittee Meeting 6/24/2020
________________________________________________________________________________

MAY MAY 2020 YEAR-TO-DATE
Nonreimbor Reimb Reason for Variance Reason for Variance
$ % $ %
METROPOLITAN TRANSPORTATION AUTHORITYCONSOLIDATED ACCRUAL STATEMENT OF OPERATIONS BY CATEGORY
EXPLANATION OF VARIANCES BETWEEN ADOPTED BUDGET AND ACTUAL - ACCRUAL BASISMAY 2020
Generic Revenue or Expense Category
Favorable Favorable(Unfavorable) (Unfavorable)
($ in millions)
Health and Welfare NR (13.4) (11.5) NYCT and MTAHQ were unfavorable by ($14.4M) and ($0.7M),respectively, due to timing. MTA Bus was ($1.8M) unfavorable due tohigher prescription coverage and hospitalization expenses. Partiallyoffsetting these results were favorable variances of $2.4M at the LIRRand $0.7M at MNR due to lower labor costs and rates.
(8.1) (1.4) The factors highlighted for the month continue at NYCT and MTA Buswith unfavorable variances of ($21.6M) and ($1.8M), respectively.Partially offsetting these results were the same factors highlighted forthe month at the LIRR, MNR, and MTAHQ of $8.3M, $2.2M and $2.1M,respectively. B&T was favorable by $1.7M due to vacancies. SIR wasfavorable by $0.8M.
OPEB - Current Payment NR (5.0) (8.6) Timing was responsible for an unfavorable variance of ($5.9M) atNYCT, partially offset by a favorable variance of $1.0M at the LIRR dueto fewer retirees.
(14.8) (5.1) Timing was responsible for unfavorable variances of ($15.7M) at NYCTand ($0.9M) at MTAHQ. MNR was ($2.0M) unfavorable due to higherretirees. MTA Bus was ($1.5M) unfavorable due to higher prescriptioncoverage and medical hospitalization expenses. These results werepartially offset by a favorable variance of $4.9M at the LIRR due tofewer retirees.
Pensions NR (14.5) (13.2) NYCT was ($9.2M) unfavorable due to an incorrect budget allocationwhich will be corrected in the July Plan. MNR was ($6.0M) unfavorableprimarily due to an adjustment for a higher-than-budgeted ActuariallyDefined Contribution (ADC) coupled with higher benefit costs caused byCOVID-19. Other Agency variances were minor.
(46.3) (8.2) NYCT was ($47.7M) unfavorable primarily due to an incorrect budgetallocation which will be corrected in the July Plan. MNR was ($6.2M)unfavorable primarily due to an adjustment for a higher-than-budgetedActuarially Defined Contribution (ADC) and an unbudgeted benefitprovision caused by COVID-19. The LIRR was ($2.8M) unfavorablebecause of an over-estimated allocation to the reimbursable budget.Partially offsetting these results were favorable variances of $9.1M atMTAHQ due to hiring restrictions and timing; and $0.6M at MTA Busreflects lower costs. Other agency variances were minor.
Other Fringe Benefits NR 6.1 7.6 The LIRR was $3.6M favorable mainly due to lower Railroad RetirementTaxes. MNR was $1.4M favorable due to lower employee claimprovision, labor costs and rates. NYCT was favorable by $0.6M mainlydue to higher Capital Track credits.
1.3 0.3 The factors highlighted for the month continue at the LIRR and MNR butwith favorable results of $4.8M and $4.7M, respectively. Timing wasresponsible for favorable variances of $3.8M at MTAHQ and $2.0M atMTA Bus. B&T was favorable by $1.2M mainly due to vacancies. These results were partially offset by an unfavorable variance of ($15.2M) atNYCT mostly due to a major reduction in capital project supportrequirements (reimbursable workforce assigned to the operating/non-reimbursable budget).
Reimbursable Overhead NR 3.2 9.9 The favorable outcome was due to a timing variance of $5.2M at theLIRR, and Capital Track credits, $2.6M at NYCT. These results werepartially offset by unfavorable variances of ($1.3M) at MNR and ($3.7M)at MTAHQ due to lower project activity.
(24.9) (14.2) YTD results primarily reflect lower capital project activity ($36.9M) atNYCT and ($0.7M) at MNR. Reimbursements were ($5.9M) lower atMTAHQ due to revised assumptions. These were partially offset byfavorable outcomes of $17.6M at the LIRR, mostly due to timing, and$0.6M at SIR, as a result of higher capital project activity.
Electric Power NR 15.0 41.2 This favorable variance primarily reflects lower consumption due toreduced service levels caused by operating an Essential Serviceschedule and lower rates, $9.0M at NYCT, $2.8M at the LIRR, and$2.2M at MNR. MTAHQ was $0.5M favorable due to lower usage andrates at 2 Broadway.)
37.7 18.9 Causes for the YTD variances are consistent with those reported for themonth, but with favorable results of $23.3M at NYCT, $6.5M at theLIRR, $5.8M at MNR, and $0.9M at MTAHQ. Favorable results alsoinclude $0.6M at B&T from the impact of timing.
Fuel NR 8.4 57.0 Reduced service levels caused by operating an Essential Serviceschedule generated savings across the Agencies. Lower consumptionand rates produced favorable variances of $5.0M at NYCT, $1.5M atMTA Bus, $1.0M at MNR and $0.7M at the LIRR. Other Agencyvariances were minor.
22.5 29.6 Lower consumption due to reduced service levels in response to COVIDand lower rates were largely responsible for favorable variances of$13.4M at NYCT, $4.6M at MTA Bus, $2.7M at MNR and $1.4M at theLIRR. Other Agency variances were minor.
Master Page # 43 of 108 - Finance C
omm
ittee Meeting 6/24/2020
________________________________________________________________________________

MAY MAY 2020 YEAR-TO-DATE
Nonreimbor Reimb Reason for Variance Reason for Variance
$ % $ %
METROPOLITAN TRANSPORTATION AUTHORITYCONSOLIDATED ACCRUAL STATEMENT OF OPERATIONS BY CATEGORY
EXPLANATION OF VARIANCES BETWEEN ADOPTED BUDGET AND ACTUAL - ACCRUAL BASISMAY 2020
Generic Revenue or Expense Category
Favorable Favorable(Unfavorable) (Unfavorable)
($ in millions)
Insurance NR 0.2 46.6 Agency variances were minor. 0.4 15.0 MTA Bus was $1.2M favorable due to timing. Lower liability insurancewas responsible for a $0.7M favorable variance at the LIRR; and MNRwas $0.7M favorable due to a reduction in Station Liability and Autopremiums. These results were partially offset by unfavorable variancesof ($1.5M) at NYCT and ($0.9M) at FMTAC due to timing.
Claims NR (8.8) (25.9) Timing was largely responsible for the unfavorable variance of ($8.2M)at FMTAC, and MTA Bus was ($0.8M) unfavorable. Other agencyvariances were minor.
(10.8) (6.3) Timing was largely responsible for the unfavorable variance of ($7.4M)at FMTAC. Expenses were ($0.8M) unfavorable at MTA Bus. Partiallyoffsetting these results was a favorable variance of $0.5M at MNR dueto a lower-than-budgeted claims provision. Other agency varianceswere minor.
Paratransit Service Contracts NR 23.3 55.4 Lower expenses reflect reduced trips. 56.8 28.4 Lower expenses reflect reduced trips.
Maintenance and Other Operating Contracts
NR 2.4 4.2 The overall favorable variance was mainly caused by timing: $2.4M atB&T for major maintenance and painting projects; $2.1M at MNR due tothe transfer of 2019 ferry expenses to the reimbursable budget inrecognition of the Federal Transit Administration grant for ferry serviceoperations, lower expenses for miscellaneous maintenance andoperating contracts, partially offset by COVID-19 costs to clean anddisinfect stations and rolling stock; and $1.2M at the LIRR due to lowerjoint facility maintenance and the timing of maintenance contracts,partially offset by COVID-19 third-party cleaning efforts. Partiallyoffsetting these results was an unfavorable variance of ($3.4M) atMTAHQ mainly due to revised assumptions for maintenance andrepairs, including the Gowanus HOV, janitorial services, and MTA ITtelephone service. Other Agency variances were minor.
10.2 3.7 The drivers of the YTD variances for the LIRR and MNR are mainly thesame as those noted for the month with YTD favorable variances of$6.9M and $3.0M, respectively. Additionally, B&T was $4.9M favorabledue to the timing of E-ZPass Customer Service Center costs, majormaintenance and painting projects, security and surveillance, androutine maintenance. MTA Bus was $4.7M favorable due to the timingof facility maintenance, security and new bus technology expenses.MTA HQ was $4.2M favorable mainly due to the timing of maintenanceand repairs, including Gowanus HOV, facility maintenance, andjanitorial services; and SIR was $0.6M favorable due to revised timingof maintenance work. Partially offsetting these results was anunfavorable variance of ($14.2M) at NYCT largely due to COVID-19efforts and timing of auto purchases.
Professional Service Contracts NR 5.5 10.1 Timing was the main factor for the overall favorable variance, resultingin lower costs of: $4.7M at MTAHQ for support of MTA Transformationand consolidated Enterprise Asset Management (EAM) activities, MTAIT hardware, software and related services, and MTA IT data centercharges; $1.5M at MNR due to lower consulting and engineeringservices; and $1.4M at MTA Bus for interagency charges and new bustechnology. Partially offsetting these results were unfavorablevariances of ($1.2M) at B&T for bond issuance costs and professionalservices; and ($0.9M) at NYCT due to timing.
89.1 32.2 The drivers of the YTD variances for MTAHQ, MTA Bus and MNR aremainly the same as those noted for the month with YTD favorablevariances of $49.0M, $8.0M and $3.5M, respectively. Additionally,NYCT was $14.0M favorable largely due to the favorable timing of IT-related expenses, and B&T was $3.7M favorable primarily forengineering services, outside services, advertising and marketing, bondissuance costs, and planning studies.
Materials & Supplies NR 29.2 52.1 Due to the pandemic, Agencies reassessed the timing of selectmaintenance work which generated savings. NYCT was $12.3Mfavorable due to reduced maintenance activity. The LIRR was $10.8Mfavorable, mostly due to the retiming of fleet modifications andReliability Centered Maintenance (RCM) activity, and right-of-waymaterial requirements. MNR was $4.1M favorable due to the timing ofrolling stock maintenance and infrastructure repairs, as well as lowerrolling stock material usage due to reduced service. MTA Bus was$1.8M favorable from lower general maintenance requirements due tothe pandemic and the timing of radio equipment expenses.
76.5 27.5 The principal factors highlighted for the month mostly continue, withfavorable variances of $39.3M at the LIRR, $19.1M at NYCT, $10.6M atMNR (including lower inventory adjustments), $6.6M at MTA Bus, and$0.8M at B&T (timing.)
Master Page # 44 of 108 - Finance C
omm
ittee Meeting 6/24/2020
________________________________________________________________________________

MAY MAY 2020 YEAR-TO-DATE
Nonreimbor Reimb Reason for Variance Reason for Variance
$ % $ %
METROPOLITAN TRANSPORTATION AUTHORITYCONSOLIDATED ACCRUAL STATEMENT OF OPERATIONS BY CATEGORY
EXPLANATION OF VARIANCES BETWEEN ADOPTED BUDGET AND ACTUAL - ACCRUAL BASISMAY 2020
Generic Revenue or Expense Category
Favorable Favorable(Unfavorable) (Unfavorable)
($ in millions)
Other Business Expenses NR 10.7 57.2 NYCT was $5.2M favorable due to lower MetroCard transaction fees.B&T was $2.1M favorable due to timing. MTAHQ was $1.7M favorablemostly due to reduced spending and timing. The LIRR and MNR wereboth favorable by $0.9M due to lower credit/debit card fees andmiscellaneous expenses.
44.2 41.8 MTAHQ was $20.3M favorable mostly due to the timing of theVerrazzano Bridge Toll Program and Cross Bay Bridge subsidy. Also,the factors highlighted for the month continue at NYCT, B&T, the LIRRand MNR, with variances of $11.4M, $6.0M, $3.5M, and $2.0M,respectively. MTA Bus was favorable by $0.8M mostly due to the timingof Automatic fare Collection (AFC) fees.
Other Expense Adjustments NR 2.4 33.0 Reflects favorable timing difference. 10.9 30.7 Reflects favorable timing difference.
Depreciation NR (10.1) (4.3) Timing differences in project completions and assets reaching beneficialuse resulted in unfavorable variances of ($10.2M) at NYCT, ($1.2M) atthe LIRR, and ($1.0M) at B&T, and a favorable variance of $2.2M atMTAHQ.
(48.4) (4.1) Timing differences in project completions and assets reaching beneficialuse resulted in unfavorable variances of ($51.3M) at NYCT, ($6.2M) atthe LIRR, ($5.6M) at B&T, and ($0.5M) at MNR, and favorablevariances of $11.9M at MTAHQ, $2.9M at MTA Bus and $0.5M at SIR.
OPEB Liability Adjustment NR 0.0 * The GASB adjustment reflects the value associated with the unfundedaccrued liability for post-employment health benefits.
0.0 * The GASB adjustment reflects the value associated with the unfundedaccrued liability for post-employment health benefits.
GASB 75 Pension Adjustment NR 8.2 * Reflects the impact of a Generally Accepted Accounting Principles(GAAP) change in OPEB liability (GASB 75). MTA Bus was favorable by$8.2M.
402.2 * Reflects the impact of a Generally Accepted Accounting Principles(GAAP) change in OPEB liability (GASB 75). NYCT, MTA Bus, MNR,and SIR were favorable by $347.7M, $41.4M, $11.2M, and $1.9M,respectively.
GASB 68 Pension Adjustment NR 3.8 * Reflects Agencies' adjustments to account for net pension liability. MTABus was favorable by $3.8M.
20.9 * Reflects Agencies' adjustments to account for net pension liability. MTABus and MNR were favorable by $19.1M and $1.8M, respectively.
Environmental Remediation NR 0.3 66.7 Agency variances were minor. 1.2 47.0 MNR was $1.3M favorable. Other Agency variances were minor.
Capital & Other Reimbursements R 11.8 6.4 Favorable variances: $18.8M at the LIRR, $7.6M at NYCT, and $0.5Mat MTA Bus. Unfavorable variances: ($10.4M) at MTAHQ, ($2.9M) atMNR, and ($1.3M) at MTA C&D.
(151.7) (16.1) Unfavorable variances: ($118.5M) at NYCT, ($27.1M) at MNR, ($22.8M)at MTAHQ, ($8.7M) at MTAC&D, ($0.9M) at B&T and ($0.7M) at SIR.Favorable variance: $27.1M at the LIRR.
Payroll R (1.3) (2.2) Unfavorable variance: ($4.9M) at the LIRR. Favorable variances:$1.7M at MNR, $1.2M at NYCT, and $0.5M at MTAC&D. Other Agencyvariances are minor.
64.3 19.9 Favorable variances: $55.0M at NYCT, $5.6M at MNR, $2.9M atMTAC&D, $1.3M at SIR, $1.0M at MTAHQ, and $0.7M at B&T.Unfavorable variance: ($1.7M) at the LIRR.
Overtime R (3.3) (19.1) Unfavorable variances: ($2.1M) at the LIRR, ($1.1M) at NYCT, and($0.8M) at MTAHQ. Favorable variance: $0.6M at MNR. (See overtimevariance analysis charts for more detail)
2.9 3.3 Favorable variance: $11.6M at NYCT. Unfavorable variances: ($7.6M)at the LIRR and ($1.4M) at MTAHQ. (See overtime variance analysischarts for more detail.)
Health and Welfare R 0.6 8.1 Favorable variance: $1.0M at NYCT and $0.6M at MNR. Unfavorablevariance: ($1.4M) at the LIRR.
2.5 7.4 Favorable variance: $1.7M at NYCT, $1.6M at MNR and $0.5M at MTA Bus. Unfavorable variance: ($2.5M) at the LIRR.
OPEB Current Payment R 0.2 22.0 Agency variances were minor. 0.6 10.6 Favorable variance: $0.6M at NYCT. Other agency variances wereminor.
Reimbursable revenue and expense activity are primarily influenced by the nature and timing of project activity. Accordingly, variances reflect the impact of the aforementioned influences as well as changes in reimbursement and vacancy assumptions, refinements to project scheduling, as well as project delays/accelerations. At MTAHQ, impacts reflect reimbursable directed patrol (police coverage) requirements. The following lists the major contributors of the variance by Agency.
Master Page # 45 of 108 - Finance C
omm
ittee Meeting 6/24/2020
________________________________________________________________________________

MAY MAY 2020 YEAR-TO-DATE
Nonreimbor Reimb Reason for Variance Reason for Variance
$ % $ %
METROPOLITAN TRANSPORTATION AUTHORITYCONSOLIDATED ACCRUAL STATEMENT OF OPERATIONS BY CATEGORY
EXPLANATION OF VARIANCES BETWEEN ADOPTED BUDGET AND ACTUAL - ACCRUAL BASISMAY 2020
Generic Revenue or Expense Category
Favorable Favorable(Unfavorable) (Unfavorable)
($ in millions)
Pensions R (0.2) 20.4 Unfavorable variance: ($0.5M) at NYCT. Other Agency variances wereminor.
3.0 7.1 Favorable variances: $2.8M at the LIRR, and $1.1M at both MTA C&Dand MNR. Unfavorable variance: ($2.3M) at NYCT. Other Agencyvariances were minor.
Other Fringe Benefits R (0.9) (4.2) Unfavorable variance: ($1.6M) at the LIRR. Other agency varianceswere minor.
21.2 19.4 Favorable variance: $21.8M at NYCT, $1.3M at MNR and $0.5M at SIR. Unfavorable variance: ($3.1M) at the LIRR.
Reimbursable Overhead R (3.3) (10.2) Unfavorable variances: ($5.2M) at the LIRR and ($2.6M) at NYCT.Favorable variances: $3.7M at MTAHQ and $1.1M at MNR.
24.7 14.2 Favorable variances: $36.9M at NYCT, $5.9M at MTAHQ, and $0.8M atMNR. Unfavorable variances: ($17.6M) at the LIRR and ($0.6M) at SIR.
Electric Power R (0.0) (9.3) Agency variances were minor. 0.1 36.4 Agency variances were minor.
Fuel R 0.0 * No variance. 0.0 95.9 No variance.
Insurance R 0.4 31.0 Agency variances were minor. 1.8 32.5 Favorable variance: $1.1M at the LIRR and $0.7M at MNR.
Claims R 0.0 0.0 No variance. 0.0 0.0 No variance.
Paratransit Service Contracts R 0.0 - No variance. 0.0 - No variance.
Maintenance and Other Operating Contracts
R (1.4) (15.3) Unfavorable variance: ($1.3M) at the LIRR. Other Agency varianceswere minor.
13.4 29.6 Favorable variances: $11.4M at MNR, $2.6M at MTA C&D and $2.3M atNYCT. Unfavorable variance: ($3.0M) at the LIRR. Other Agencyvariances were minor.
Professional Service Contracts R 0.6 6.4 Favorable variance: $7.2M at MTAHQ. Unfavorable variances: ($3.4M)at NYCT and ($3.3M) at MNR. Other Agency variances were minor.
3.9 7.9 Favorable variances: $16.4M at MTAHQ and $0.9M at MTA C&D.Unfavorable variances: ($6.1M) at MNR, ($5.9M) at NYCT and ($1.4M)at the LIRR.
Materials & Supplies R (3.3) (24.3) Unfavorable variances: ($2.9M) at NYCT and ($1.9M) at the LIRR.Favorable variance: $1.6M at MNR.
16.8 24.7 Favorable variances: $9.9M at MNR, $6.2M at the LIRR, and $0.5M atNYCT.
Other Business Expenses R 0.0 1.4 Agency variances were minor. (3.5) * Unfavorable variance: ($3.6M) at NYCT.
Subsidies NR 2,319.9 >100 The $2,319.9M favorable variance mainly reflected favorable results for MMTOA of ($2,143.5M), State Operating Assistance of $187.9M, and Local Operating Assistance of $29.3M, due to timing of accrual by MTA Accounting. Also contributing to the overall favorable variance were timing-related variances for PBT of $56.1M, City Subsidy for MTA Bus of $19.0M and PMT of $10.4M. This was offset by unfavorable variances for PMT Replacement of ($48.9M) due to timing, Urban Tax of ($41.8M) due to weak real estate activity in New York City, FHV of ($23.3M) due to lower for-hire-vehicle transactions, and MRT of ($9.5M) due to weak mortgage activity in the MCTD.
(188.3) (4.6) The unfavorable $188.3M variance mainly reflected unfavorable results for Urban Taxes of ($94.4M) due to weak real estate activity in New York City, and unfavorable timing-related variances for PMT Replacement of ($48.9M), MTA Aid of ($37.5M) and PBT of ($19.4M). Also contributing to the overall unfavorable variance were lower transactions for FHV Surcharge of ($30.3M) and MRT-1 of ($5.2M). This was offset by a favorable PMT variance of $213.1M due to timing, and MRT-2 of $5.4M due to strong MRT-2 activity in the MCTD.
Debt Service NR 17.9 9.2 Debt Service for the month of May was $176.1 million, which was $17.9 million or approximately 9.2% favorable primarily due to the reversal of the prior month’s prefunding of interest to May 15, 2020, partially offset by the timing (non-receipt) of scheduled May 2020 BAB subsidies.
10.8 0.9 Year-to-Date Debt Service expenses were $1,160.6 million, which were $10.8 million or 0.9% favorable primarily due to lower-than-budgeted variable rates and lower-than-budgeted debt service related to the timing and structures of financing activities, which were partially offset by the timing (non-receipt) of scheduled May 2020 BAB subsidies.
Master Page # 46 of 108 - Finance C
omm
ittee Meeting 6/24/2020
________________________________________________________________________________

1
All agencies – Non-Reimbursable Overtime Variance
Source: Adopted (restated) budget. GL actuals for actual overtime spending.
May 2020 and YTD budget vs. variance$M
YTD variance by division$M
B&T lower expenses due to rescheduled and deferred maintenance in response to COVID-19.
LIRR lower expenses due to mild winter weather and lower maintenance requirements as a result of the implementation of the Essential Service Plan caused by COVID-19.
MNR lower expenses in MoW due to fewer-than-expected weather-related events and re-prioritization of personnel to COVID-19-related cleaning.
NYCT fewer weather-related events and the implementation of the Essential Service Plan in response to COVID-19.
• For the month, costs were less than budget by $19M, or 27% due to the implementation of the Essential Service Plan in response to COVID-19 at NYCT, the LIRR, and MNR and the reversal of Capital Track costs at NYCT.
• The favorable YTD variance mainly reflects fewer weather-related events, and the impact of the pandemic on MTA service and maintenance assumptions at NYCT, the LIRR, MNR, and B&T, partially offset by higher Enhanced Security and Quality of Life costs at MTAHQ, as well as COVID-related cleaning, including sanitizing, and maintenance work on fleet at MTA Bus.
Overview
$67 $70
$346 $359
May ’20
$84
-$40(-11%)
$18(26%)
May ’19
-$19(-27%)
$72(21%)
YTD May ’19
YTD May ’20
$51
$418
$319
-39%
-24%
Budget
Favorable
Unfavorable
$4.5$1.2
-$3.2
-$14.3
-$6.4
-$21.5
MNR
B&T
YTD May ’20
LIRR
MTA Bus
MTA HQ
NYCT
Annual budget: $852M
MTA HQ higher expenses mostly due to coverage for Enhanced Security, Quality of Life, and COVID-19.
MTA Bus higher expenses due to COVID-19-related cleaning and maintenance work on aging fleet.
Master Page # 47 of 108 - Finance C
omm
ittee Meeting 6/24/2020
________________________________________________________________________________

2
All agencies – Reimbursable Overtime Variance
Source: Adopted (restated) budget. GL actuals for actual overtime spending.
May 2020 and YTD budget vs. variance$M
YTD variance by division$M
LIRR higher expenses for the Concrete Tie Program, 3rd Track Expansion, Jamaica Capacity Improvements, the Annual Track Program, and Flagging requirements.
MTAHQ higher expenses due to higher coverage requirements and the use of the Transit Security Grant Program at the MTA PD.
NYCT lower mainly due to reduced capital program support as a result of COVID-19.
• For the month, costs exceeded the budget by $3M or 19%, due mainly to higher Concrete Tie Program costs at the LIRR.
• YTD overtime costs were $3M or 3% below budget.• The main driver of the YTD favorable variance was due to revised capital
project activity and support caused by the pandemic at NYCT. This was partially offset by higher requirements for concrete ties, 3rd Track Expansion, Jamaica Capacity Improvements and the Annual Track Program at the LIRR, and higher coverage requirements for the MTA PD at MTAHQ.
Overview
$16 $17
$77$88
May ’20
$6(41%)
$22
May ’19
YTD May ’19
$49(63%)
-$3(-3%)
YTD May ’20
$21
$126
$85
$3(19%)
-8%
-32%
Favorable
Unfavorable
Budget
$1.4
$7.6
-$11.6
YTD May ’20
MTA HQ
LIRR
NYCT
Annual budget: $215M
Master Page # 48 of 108 - Finance C
omm
ittee Meeting 6/24/2020
________________________________________________________________________________
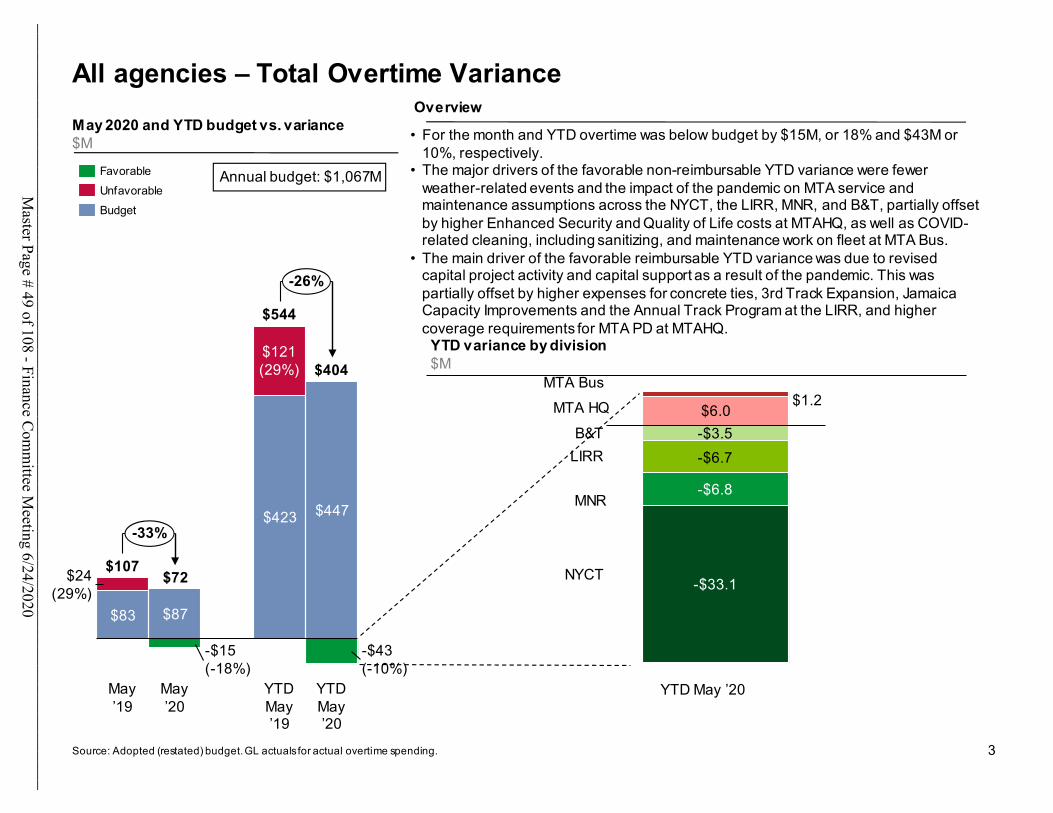
3
All agencies – Total Overtime Variance
Source: Adopted (restated) budget. GL actuals for actual overtime spending.
May 2020 and YTD budget vs. variance$M
YTD variance by division$M
• For the month and YTD overtime was below budget by $15M, or 18% and $43M or 10%, respectively.
• The major drivers of the favorable non-reimbursable YTD variance were fewer weather-related events and the impact of the pandemic on MTA service and maintenance assumptions across the NYCT, the LIRR, MNR, and B&T, partially offset by higher Enhanced Security and Quality of Life costs at MTAHQ, as well as COVID-related cleaning, including sanitizing, and maintenance work on fleet at MTA Bus.
• The main driver of the favorable reimbursable YTD variance was due to revised capital project activity and capital support as a result of the pandemic. This was partially offset by higher expenses for concrete ties, 3rd Track Expansion, Jamaica Capacity Improvements and the Annual Track Program at the LIRR, and higher coverage requirements for MTA PD at MTAHQ.
YTD variance by division$M
Overview
$83 $87
$423 $447
$404
May ’19
YTD May ’19
May ’20
$24(29%)
-$15(-18%)
$121(29%)
-$43(-10%)
YTD May ’20
$107$72
$544
-33%
-26%
Budget
Favorable
Unfavorable
$6.0$1.2
-$3.5
-$6.7
-$6.8
-$33.1
YTD May ’20
LIRR
MTA HQ
B&T
MNR
MTA Bus
NYCT
Annual budget: $1,067M
Master Page # 49 of 108 - Finance C
omm
ittee Meeting 6/24/2020
________________________________________________________________________________

Adopted Adopted Budget Budget
MMTOA, PBT, Real Estate Taxes and OtherMetropolitan Mass Transportation Operating Assistance (MMTOA) - 2,143.5 2,143.5 2,143.5 2,143.5 (0.0) Petroleum Business Tax (PBT) (14.4) 41.7 56.1 207.6 188.2 (19.4) MRT(b)-1 (Gross) 23.2 15.6 (7.6) 123.3 118.1 (5.2) MRT(b)-2 (Gross) 10.6 8.7 (1.9) 50.4 55.7 5.4 Other MRT(b) Adjustments - - - - - - Urban Tax 53.1 11.3 (41.8) 265.5 171.1 (94.4) Investment Income - 0.0 0.0 0.6 2.8 2.2
$72.5 $2,220.8 $2,148.4 $2,790.8 $2,679.4 ($111.4)
PMT and MTA AidPayroll Mobility Tax (PMT) 106.4 116.9 10.4 413.2 626.4 213.1 Payroll Mobility Tax Replacement Funds 48.9 - (48.9) 48.9 - (48.9) MTA Aid - - - 79.5 42.0 (37.5)
$155.3 $116.9 ($38.4) $541.6 $668.4 $126.8
New Funding SourcesSAP Support and For-Hire Vehicle Surcharge:
For-Hire Vehicle (FHV) Surcharge 37.6 14.3 (23.3) 188.1 157.8 (30.3) Subway Action Plan Account 37.6 14.3 (23.3) 188.1 157.8 (30.3) Outerborough Transportation Account - - - - - - Less: Assumed Capital or Member Project - - - - - - General Transportation Account - - - - - - Less: Transfer to Committed to Capital - - - - - -
Capital Program Funding Sources: 2.8 2.7 (0.1) 11.4 11.2 (0.3) Central Business District Tolling Program (CBDTP) - - - - - - Real Property Transfer Tax Surcharge (Mansion) 31.1 14.0 (17.1) 155.6 82.5 (73.2) Internet Marketplace Tax 23.5 14.2 (9.4) 117.7 70.8 (46.9) Less: Transfer to CBDTP Capital Lockbox (51.9) (25.4) 26.4 (261.9) (142.1) 119.8
$40.4 $17.1 ($23.4) $199.6 $169.0 ($30.6)
State and Local SubsidiesState Operating Assistance - 187.9 187.9 187.9 187.9 - NYC and Local 18b:
New York City - 1.9 1.9 1.9 1.9 - Nassau County - 11.6 11.6 11.6 11.6 - Suffolk County - 7.5 7.5 7.5 7.5 - Westchester County - 7.3 7.3 7.3 7.3 - Putnam County - 0.4 0.4 0.4 0.4 - Dutchess County - 0.4 0.4 0.4 0.4 - Orange County - 0.1 0.1 0.1 0.1 - Rockland County - 0.0 0.0 0.0 0.0 -
Station Maintenance 14.6 14.3 (0.3) 72.2 71.6 (0.6) $14.6 $231.5 $216.9 $289.3 $288.8 ($0.6)
Subtotal: Taxes & State and Local Subsidies $282.8 $2,586.2 $2,303.5 $3,821.4 $3,805.5 ($15.9)
Other Funding AgreementsCity Subsidy for MTA Bus Company 39.0 58.0 19.0 228.7 72.6 (156.0) City Subsidy for Staten Island Railway 6.6 3.4 (3.2) 21.1 5.1 (16.0) CDOT Subsidy for Metro-North Railroad 8.8 9.4 0.7 60.7 60.4 (0.4)
$54.4 $70.9 $16.5 $310.5 $138.1 ($172.4)
Subtotal, including Other Funding Agreements $337.2 $2,657.1 $2,319.9 $4,131.9 $3,943.6 ($188.3)
Inter-agency Subsidy TransactionsB&T Operating Surplus Transfer 82.5 44.1 (38.4) 305.0 140.0 (165.0)
$82.5 $44.1 ($38.4) $305.0 $140.0 ($165.0)
GROSS SUBSIDIES $419.7 $2,701.2 $2,281.5 $4,436.9 $4,083.7 ($353.3)
Actual Variance Actual Variance
METROPOLITAN TRANSPORTATION AUTHORITY
Consolidated Subsidies - Accrual BasisMay 2020
($ in millions)
Current Month Year-to-Date
February Financial Plan - 2020 Adopted Budget
Master Page # 50 of 108 - Finance Committee Meeting 6/24/2020________________________________________________________________________________

Metropolitan Mass Transportation Operating Assistance (MMTOA) 2,143.5 > (100%) The favorable variances for the month was due to timing of booking accrual by MTA Accounting. YTD MMTOA accrual was on target
with the budget.
Petroleum Business Tax (PBT) 56.1 > (100%) The favorable accrual variance for the month was primarily due to the timing of booking accruals by MTA Accounting. YTD PBT accrual
was unfavorable to the budget.
MRT(b)-1 (Gross) (7.6) -32.8% MRT-1 transactions were below budget for the month and year-to-date due to unfavorable MRT-1 activity.
MRT(b)-2 (Gross) (1.9) -18.0% MRT-2 transactions were below budget for the month due to unfavorable MRT-2 activity; YTD transactions were favorable due to
stronger-than-budgeted MRT-2 activity.
Urban Tax (41.8) -78.7% The unfavorable variances for the month and year-to-date were primarily due to lower-than-budgeted real estate transactions in New
York City.
Payroll Mobility Tax (PMT) 10.4 9.8% The favorable accrual variances for the month and year-to-date were due to the timing of booking accruals by MTA Accounting.
Payroll Mobility Tax Replacement Funds (48.9) -100.0% The unfavorable variances for the month and year-to-date were primarily due to timing of booking accruals by MTA Accounting.
Subway Action Plan Account (23.3) -61.9% Subway Action Plan transactions were unfavorable for the month and year-to-date.
Real Property Transfer Tax Surcharge (Mansion) (17.1) -55.1% Revenues from the Real Property Transfer Tax Surcharge (the Mansion Tax) and the Internet Marketplace Tax, which are received by
B&T, are directed to fund the 2020-2024 Capital Program. The 2020 Adopted Budget earmarks a portion of these revenues to be set
aside in the operating budget to cover debt service expenses for borrowing for the 2020-2024 Capital Program, with the remainder set
aside as PAYGO for the 2020-2024 Capital Program.
Real Property Transfer Tax Surchage revenues were unfavorable for the month and YTD due to lower-than-expected transaction value,
reflecting the economic slowdown due to the Covid-19 pandemic.
Internet Marketplace Tax (9.4) -39.8% The unfavorable Internet Marketplace Tax variances for the month and YTD were due to timing of transactions. There was a delay in the
timing of transactions for NYS portion of the Internet Marketplace Tax.
State Operating Assistance 187.9 > (100%) The favorable variances for the month was due to timing of booking accrual by MTA Accounting. YTD accrual was on target with the
budget.
New York City 1.9 > (100%) The favorable variances for the month was due to timing of booking accrual by MTA Accounting. YTD accrual was on target with the
budget.
Nassau County 11.6 > (100%) The favorable variances for the month was due to timing of booking accrual by MTA Accounting. YTD accrual was on target with the
budget.
Suffolk County 7.5 > (100%) The favorable variances for the month was due to timing of booking accrual by MTA Accounting. YTD accrual was on target with the
budget.
Westchester County 7.3 > (100%) The favorable variances for the month was due to timing of booking accrual by MTA Accounting. YTD accrual was on target with the
budget.
Putnam County 0.4 > (100%) The favorable variances for the month was due to timing of booking accrual by MTA Accounting. YTD accrual was on target with the
budget.
Dutchess County 0.4 > (100%) The favorable variances for the month was due to timing of booking accrual by MTA Accounting. YTD accrual was on target with the
budget.
Orange County 0.1 > (100%) The favorable variances for the month was due to timing of booking accrual by MTA Accounting. YTD accrual was on target with the
budget.
Rockland County 0.0 > (100%) The favorable variances for the month was due to timing of booking accrual by MTA Accounting. YTD accrual was on target with the
budget.
City Subsidy for MTA Bus Company 19.0 48.7% Variance was mostly timing related. Drawdowns are related to the timing of cash obligations for MTA Bus.
City Subsidy for Staten Island Railway (3.2) -48.6% Variance was mostly timing related. Drawdowns are related to the timing of cash obligations for Staten Island Railway.
CDOT Subsidy for Metro-North Railroad 0.7 7.5% The favorable variance for the month was due primarily to timing. Year-to-date variance was close to the budget.
B&T Operating Surplus Transfer (38.4) -46.6% The unfavorable variances for the month and YTD were primarily attributable to the precipitous drop in the use of MTA services and toll
facilities, reflecting the impact of Governor Cuomo’s PAUSE Executive Order, effective March 22nd, which severely limited non-essential
activities, and personal actions taken to socially distance in response to the COVID-19 pandemic.
Month of May 2020
Accrued Subsidies Variance
$
Variance
%Explanations
METROPOLITAN TRANSPORTATION AUTHORITY
Variance Explanations
February Financial Plan - 2020 Adopted BudgetConsolidated Subsidies - Accrual Basis
($ in millions)
Master Page # 51 of 108 - Finance C
omm
ittee Meeting 6/24/2020
________________________________________________________________________________

METROPOLITAN TRANSPORTATION AUTHORITY
Variance Explanations
February Financial Plan - 2020 Adopted BudgetConsolidated Subsidies - Accrual Basis
($ in millions)
Metropolitan Mass Transportation Operating Assistance (MMTOA) (0.0) 0.0% See explanation for the month.
Petroleum Business Tax (PBT) (19.4) -9.4% See explanation for the month.
MRT(b)-1 (Gross) (5.2) -4.2% See explanation for the month.
MRT(b)-2 (Gross) 5.4 10.6% See explanation for the month.
Urban Tax (94.4) -35.6% See explanation for the month.
Payroll Mobility Tax (PMT) 213.1 51.6% See explanation for the month.
Payroll Mobility Tax Replacement Funds (48.9) -100.0% See explanation for the month.
MTA Aid (37.5) -47.2% The unfavorable accrual YTD variance was primarily due to timing.
Subway Action Plan Account (30.3) -16.1% See explanation for the month.
Real Property Transfer Tax Surcharge (Mansion) (73.2) -47.0% See explanation for the month.
Internet Marketplace Tax (46.9) -39.8% See explanation for the month.
State Operating Assistance 0.0 0.0% See explanation for the month.
New York City 0.0 0.0% See explanation for the month.
Nassau County 0.0 0.0% See explanation for the month.
Suffolk County 0.0 0.0% See explanation for the month.
Westchester County 0.0 0.0% See explanation for the month.
Putnam County 0.0 0.0% See explanation for the month.
Dutchess County 0.0 0.0% See explanation for the month.
Orange County 0.0 0.0% See explanation for the month.
Rockland County 0.0 0.0% See explanation for the month.
City Subsidy for MTA Bus Company (156.0) -68.2% See explanation for the month.
City Subsidy for Staten Island Railway (16.0) -75.8% See explanation for the month.
CDOT Subsidy for Metro-North Railroad (0.4) -0.6% See explanation for the month.
B&T Operating Surplus Transfer (165.0) -54.1% See explanation for the month.
Year-to-Date May 2020
Accrued Subsidies Variance
$
Variance
%Explanations
Master Page # 52 of 108 - Finance C
omm
ittee Meeting 6/24/2020
________________________________________________________________________________

Adopted Adopted Adopted Adopted Adopted Adopted Budget Budget Budget Budget Budget Budget
MMTOA, PBT, Real Estate Taxes and OtherMetropolitan Mass Transportation Operating Assistance (MMTOA) 140.3 - (140.3) 65.3 - (65.3) 0.5 - (0.5) - - - - - - 206.0 - (206.0)
Petroleum Business Tax (PBT) 41.7 35.5 (6.2) 7.4 6.2 (1.2) - - - - - - - - - 49.1 41.7 (7.4)
MRT(b)-1 (Gross) - - - - - - - - - - - - 26.7 16.6 (10.2) 26.7 16.6 (10.2)
MRT(b)-2 (Gross) - - - - - - - - - - - - 10.5 9.5 (1.0) 10.5 9.5 (1.0)
Other MRT(b) Adjustments - - - - - - - - - - - - - - - - - - Urban Tax 43.4 13.5 (29.8) - - - - - - - - - - - - 43.4 13.5 (29.8)
Investment Income - - - - - - - - - - - - - - - - - -
$225.3 $49.0 ($176.3) $72.6 $6.2 ($66.4) $0.5 - ($0.5) - - - $37.2 $26.1 ($11.1) $335.7 $81.3 ($254.4)
PMT and MTA Aid
Payroll Mobility Tax (PMT) 83.5 63.3 (20.2) 90.1 53.6 (36.5) - - - - - - - - - 173.6 116.9 (56.7)
Payroll Mobility Tax Replacement Funds 34.2 - (34.2) 14.7 - (14.7) - - - - - - - - - 48.9 - (48.9)
MTA Aid - - - - - - - - - - - - - - - - - - $117.7 $63.3 ($54.4) $104.7 $53.6 ($51.2) - - - - - - - - - $222.5 $116.9 ($105.6)
New Funding SourcesSAP Support and For-Hire Vehicle Surcharge:
For-Hire Vehicle (FHV) Surcharge 37.6 14.3 (23.3) - - - - - - - - - - - - 37.6 14.3 (23.3)
Subway Action Plan Account 37.6 14.3 (23.3) - - - - - - - - - - - - 37.6 14.3 (23.3)
Outerborough Transportation Account - - - - - - - - - - - - - - - - - -
Less: Assumed Capital or Member Project - - - - - - - - - - - - - - - - - - General Transportation Account - - - - - - - - - - - - - - - - - -
Less: Transfer to Committed to Capital - - - - - - - - - - - - - - - - - -
Capital Program Uunding Sources: 2.2 2.2 (0.1) 0.6 0.6 (0.0) - - - - - - - - - 2.8 2.7 (0.1)
Central Business District Tolling Program (CBDTP) - - - - - - - - - - - - - - - - - -
Real Property Transfer Tax Surcharge (Mansion) 24.9 11.2 (13.7) 6.2 2.8 (3.4) - - - - - - - - - 31.1 14.0 (17.1) Internet Marketplace Tax 18.8 11.3 (7.5) 4.7 2.8 (1.9) - - - - - - - - - 23.5 14.2 (9.4)
Less: Transfer to CBDTP Capital Lockbox (41.5) (20.3) 21.1 (10.4) (5.1) 5.3 - - - - - - - - - (51.9) (25.4) 26.4
$39.9 $16.5 ($23.4) $0.6 $0.6 ($0.0) - - - - - - - - - $40.4 $17.1 ($23.4)
State and Local Subsidies
State Operating Assistance 39.5 - (39.5) 7.3 - (7.3) 0.1 - (0.1) - - - - - - 47.0 - (47.0)
NYC and Local 18b:
New York City - - - - - - - - - - - - - - - - - - Nassau County - - - - - - - - - - - - - - - - - -
Suffolk County - - - 1.9 - (1.9) - - - - - - - - - 1.9 - (1.9) Westchester County - - - - - - - - - - - - - - - - - -
Putnam County - - - - - - - - - - - - - - - - - -
Dutchess County - - - 0.1 - (0.1) - - - - - - - - - 0.1 - (0.1) Orange County - - - - - - - - - - - - - - - - - -
Rockland County - - - - - - - - - - - - - - - - - - Station Maintenance - - - - - - - - - - - - - - - - - -
$39.5 - ($39.5) $9.3 - ($9.3) $0.1 - ($0.1) - - - - - - $49.0 - ($49.0)
Subsidy Adjustments - - - - - - - - - - - - - - - - - -
Subtotal: Taxes & State and Local Subsidies $422.5 $128.9 ($293.6) $187.2 $60.3 ($126.9) $0.6 - ($0.6) - - - $37.2 $26.1 ($11.1) $647.5 $215.2 ($432.3)
Other Funding Agreements
City Subsidy for MTA Bus Company - - - - - - - - - 43.0 43.0 - - - - 43.0 43.0 - City Subsidy for Staten Island Railway - - - - - - - - - - - - - - - - - -
CDOT Subsidy for Metro-North Railroad - - - 8.8 10.4 1.6 - - - - - - - - - 8.8 10.4 1.6
- - - $8.8 $10.4 $1.6 - - - $43.0 $43.0 - - - - $51.8 $53.4 $1.6
Subtotal, including Other Funding Agreements $422.5 $128.9 ($293.6) $196.0 $70.7 ($125.3) $0.6 - ($0.6) $43.0 $43.0 - $37.2 $26.1 ($11.1) $699.3 $268.7 ($430.7)
Inter-agency Subsidy TransactionsB&T Operating Surplus TransUer 26.3 - (26.3) 35.0 - (35.0) - - - - - - - - - 61.3 - (61.3)
$26.3 - ($26.3) $35.0 - ($35.0) - - - - - - - - - $61.3 - ($61.3)
GROSS SUBSIDIES $448.7 $128.9 ($319.9) $231.1 $70.7 ($160.3) $0.6 - ($0.6) $43.0 $43.0 - $37.2 $26.1 ($11.1) $760.6 $268.7 ($492.0)
Variance Actual Variance Actual Variance Actual Variance Actual Variance Actual Variance Actual
METROPOLITAN TRANSPORTATION AUTHORITY
Consolidated Subsidies - Cash BasisMay 2020 Monthly
($ in millions)
New York City Transit Commuter Railroads Staten Island Railway MTA Bus Company MTA Headquarters TOTAL
February Financial Plan - 2020 Adopted Budget
Master Page # 53 of 108 - Finance C
omm
ittee Meeting 6/24/2020
________________________________________________________________________________

Adopted Adopted Adopted Adopted Adopted Adopted Budget Budget Budget Budget Budget Budget
MMTOA, PBT, Real Estate Taxes and Other
Metropolitan Mass Transportation Operating Assistance (MMTOA) 140.3 - (140.3) 65.3 - (65.3) 0.5 - (0.5) - - - - - - 206.0 - (206.0) Petroleum Business Tax (PBT) 223.0 212.5 (10.5) 39.4 37.4 (1.9) - - - - - - - - - 262.4 249.9 (12.5)
MRT(b)-1 (Gross) - - - - - - - - - - - - 130.7 139.0 8.3 130.7 139.0 8.3
MRT(b)-2 (Gross) - - - - - - - - - - - - 50.9 59.8 8.9 50.9 59.8 8.9
Other MRT(b) Adjustments - - - - - - - - - - - - - - - - - -
Urban Tax 295.9 220.3 (75.6) - - - - - - - - - - - - 295.9 220.3 (75.6) Investment Income 0.3 0.3 0.0 0.2 (0.2) (0.4) - - - - - - - - - 0.6 0.2 (0.4)
$659.5 $433.1 ($226.4) $104.9 $37.3 ($67.6) $0.5 - ($0.5) - - - $181.5 $198.8 $17.3 $946.4 $669.2 ($277.2)
PMT and MTA Aid
Payroll Mobility Tax (PMT) 343.2 357.9 14.7 364.7 302.8 (61.9) - - - - - - - - - 707.9 660.7 (47.2)
Payroll Mobility Tax Replacement Funds 34.2 - (34.2) 14.7 - (14.7) - - - - - - - - - 48.9 - (48.9)
MTA Aid 55.7 50.4 (5.3) 23.9 21.6 (2.3) - - - - - - - - - 79.5 72.0 (7.5)
$433.1 $408.3 ($24.8) $403.2 $324.4 ($78.8) - - - - - - - - - $836.3 $732.7 ($103.6)
New Funding Sources
SAP Support and For-Hire Vehicle Surcharge:For-Hire Vehicle (FHV) SFrcharge 188.1 157.8 (30.3) - - - - - - - - - - - - 188.1 157.8 (30.3)
Subway Action Plan Account 188.1 157.8 (30.3) - - - - - - - - - - - - 188.1 157.8 (30.3)
Outerborough Transportation Account - - - - - - - - - - - - - - - - - -
Less: Assumed Capital or Member Project - - - - - - - - - - - - - - - - - -
General Transportation Account - - - - - - - - - - - - - - - - - - Less: Transfer to Committed to Capital - - - - - - - - - - - - - - - - - -
Capital Program Uunding Sources: 9.2 8.9 (0.3) 2.3 2.3 (0.0) - - - - - - - - - 11.4 11.2 (0.3)
Central Business District Tolling Program (CBDTP) - - - - - - - - - - - - - - - - - -
Real Property Transfer Tax Surcharge (Mansion) 124.5 78.6 (45.9) 31.1 19.6 (11.5) - - - - - - - - - 155.6 98.2 (57.4)
Internet Marketplace Tax 94.2 56.7 (37.5) 23.5 14.2 (9.4) - - - - - - - - - 117.7 70.8 (46.9)
Less: Transfer to CBDTP Capital Lockbox (209.5) (126.4) 83.1 (52.4) (31.5) 20.9 - - - - - - - - - (261.9) (157.9) 104.0 $197.3 $166.7 ($30.6) $2.3 $2.3 ($0.0) - - - - - - - - - $199.6 $169.0 ($30.6)
State and Local SubsidiesState Operating Assistance 39.5 - (39.5) 7.3 - (7.3) 0.1 - (0.1) - - - - - - 47.0 - (47.0)
NYC and Local 18b:
New York City - 35.0 35.0 - - - - - - - - - - - - - 35.0 35.0
Nassau County - - - 2.9 2.9 - - - - - - - - - - 2.9 2.9 - Suffolk County - - - 3.8 1.9 (1.9) - - - - - - - - - 3.8 1.9 (1.9)
Westchester County - - - 3.7 3.7 - - - - - - - - - - 3.7 3.7 - Putnam County - - - 0.2 0.1 (0.1) - - - - - - - - - 0.2 0.1 (0.1)
Dutchess County - - - 0.2 0.1 (0.1) - - - - - - - - - 0.2 0.1 (0.1)
Orange County - - - 0.1 0.0 (0.0) - - - - - - - - - 0.1 0.0 (0.0) Rockland County - - - 0.0 0.0 (0.0) - - - - - - - - - 0.0 0.0 (0.0)
Station Maintenance - - - 0.0 - (0.0) - - - - - - - - - 0.0 - (0.0) $39.5 $35.0 ($4.5) $18.1 $8.7 ($9.4) $0.1 - ($0.1) - - - - - - $57.8 $43.7 ($14.1)
Subsidy Adjustments - - - - - - - - - - - - - - - - - -
Subtotal: Taxes & State and Local Subsidies $1,329.4 $1,043.1 ($286.3) $528.5 $372.6 ($155.9) $0.6 - ($0.6) - - - $181.5 $198.8 $17.3 $2,040.1 $1,614.6 ($425.5)
Other Funding AgreementsCity Subsidy for MTA Bus Company - - - - - - - - - 240.2 215.0 (25.2) - - - 240.2 215.0 (25.2)
City Subsidy for Staten Island Railway - - - - - - - - - - - - - - - - - - CDOT Subsidy for Metro-North Railroad - - - 60.7 55.1 (5.6) - - - - - - - - - 60.7 55.1 (5.6)
- - - $60.7 $55.1 ($5.6) - - - $240.2 $215.0 ($25.2) - - - $300.9 $270.1 ($30.8)
Subtotal, including Other Funding Agreements $1,329.4 $1,043.1 ($286.3) $589.2 $427.8 ($161.4) $0.6 - ($0.6) $240.2 $215.0 ($25.2) $181.5 $198.8 $17.3 $2,340.9 $1,884.7 ($456.3)
Inter-agency Subsidy TransactionsB&T Operating Surplus TransUer 114.0 80.4 (33.6) 160.6 120.8 (39.8) - - - - - - - - - 274.6 201.2 (73.4)
$114.0 $80.4 ($33.6) $160.6 $120.8 ($39.8) - - - - - - - - - $274.6 $201.2 ($73.4)
GROSS SUBSIDIES $1,443.3 $1,123.5 ($319.8) $749.8 $548.5 ($201.3) $0.6 - ($0.6) $240.2 $215.0 ($25.2) $181.5 $198.8 $17.3 $2,615.5 $2,085.8 ($529.7)
Variance Actual Variance Actual Variance Actual Variance Actual Variance Actual Variance Actual
MTA Bus Company MTA Headquarters TOTAL
METROPOLITAN TRANSPORTATION AUTHORITY
Consolidated Subsidies - Cash BasisMay 2020 Year-to-Date
February Financial Plan - 2020 Adopted Budget
($ in millions)
New York City Transit Commuter Railroads Staten Island Railway
Master Page # 54 of 108 - Finance C
omm
ittee Meeting 6/24/2020
________________________________________________________________________________

Metropolitan Mass Transportation Operating Assistance (MMTOA) (206.0) -100.0% The unfavorable cash variances for the month and YTD were due to timing of payments from the State.
Petroleum Business Tax (PBT) (7.4) -15.0% The unfavorable cash variances for the month and YTD were primarily due to lower-than-budgeted receipts.
MRT(b)-1 (Gross) (10.2) -38.0% The variance was unfavorable to the budget for the month due to lower-than-expected MRT-1 cash receipts. YTD receipts were above
the budget.
MRT(b)-2 (Gross) (1.0) -9.2% The variance was unfavorable to the budget for the month due to lower-than-expected MRT-2 cash receipts. YTD receipts were above
the budget.
Urban Tax (29.8) -68.8% Urban Tax receipts for the month and YTD were unfavorable due to weaker-than-expected real estate activity in NYC.
Payroll Mobility Tax (PMT) (56.7) -32.7% Payroll Mobility Tax receipts were unfavorable for the month and YTD due to lower-than-budgeted tax receipts.
Payroll Mobility Tax Replacement Funds (48.9) -100.0% Payroll Mobility Tax Replacement Funds receipts were unfavorable for the month and YTD due to timing of payments from the State.
Subway Action Plan Account (23.3) -61.9% Subway Action Plan receipts were unfavorable for the month and YTD due to lower receipts than forecasted.
Real Property Transfer Tax Surcharge (Mansion) (17.1) -55.1% Revenues from the Real Property Transfer Tax Surcharge (the Mansion Tax) and the Internet Marketplace Tax, which are received by
B&T, are directed to fund the 2020-2024 Capital Program. The 2020 Adopted Budget earmarks a portion of these revenues to be set
aside in the operating budget to cover debt service expenses for borrowing for the 2020-2024 Capital Program, with the remainder set
aside as PAYGO for the 2020-2024 Capital Program.
Real Property Transfer Tax Surchage revenues were unfavorable for the month and YTD due to lower-than-expected transaction value,
reflecting the economic slowdown due to the Covid-19 pandemic.
Internet Marketplace Tax (9.4) -39.8% The unfavorable Internet Marketplace Tax variances for the month and YTD were due to timing of receipts of funds. There was a timing
delay in receiving the NYS portion of the Internet Marketplace Tax.
State Operating Assistance (47.0) -100.0% The unfavorable variance for the month and YTD were due to the timing of receipt of payment from the State.
Suffolk County (1.9) -100.0% The unfavorable variance for the month and YTD were due to the timing of receipt of payment.
Dutchess County (0.1) -100.0% The unfavorable variance for the month and YTD were due to the timing of receipt of payment.
CDOT Subsidy for Metro-North Railroad 1.6 18.5% The unfavorable variances for the month and YTD were primarily due to timing.
B&T Operating Surplus TransUer (61.3) -100.0% The unfavorable variances for the month and YTD were primarily attributable to the precipitous drop in the use of MTA services and toll
facilities, reflecting the impact of Governor Cuomo’s PAUSE Executive Order, effective March 22nd, which severely limited non-essential
activities, and personal actions taken to socially distance in response to the COVID-19 pandemic.
METROPOLITAN TRANSPORTATION AUTHORITY
Cash Subsidies Variance
$
Variance
%Explanations
February Financial Plan - 2020 Adopted BudgetConsolidated Subsidies - Cash Basis
Variance Explanations($ in millions)
Month of May 2020Master Page # 55 of 108 - Finance C
omm
ittee Meeting 6/24/2020
________________________________________________________________________________

METROPOLITAN TRANSPORTATION AUTHORITYFebruary Financial Plan - 2020 Adopted Budget
Consolidated Subsidies - Cash BasisVariance Explanations
($ in millions)
Metropolitan Mass Transportation Operating Assistance (MMTOA) (206.0) -100.0% See explanation for the month.
Petroleum Business Tax (PBT) (12.5) -4.8% See explanation for the month.
MRT(b)-1 (Gross) 8.3 6.4% See explanation for the month.
MRT(b)-2 (Gross) 8.9 17.6% See explanation for the month.
Urban Tax (75.6) -25.5% See explanation for the month.
Payroll Mobility Tax (PMT) (47.2) -6.7% See explanation for the month.
Payroll Mobility Tax Replacement Funds (48.9) -100.0% See explanation for the month.
MTA Aid (7.5) -9.5% MTA Aid YTD receipts, received on quarterly basis, were unfavorable primarily due to timing.
Subway Action Plan Account (30.3) -16.1% See explanation for the month.
Real Property Transfer Tax Surcharge (Mansion) (57.4) -36.9% See explanation for the month.
Internet Marketplace Tax (46.9) -39.8% See explanation for the month.
State Operating Assistance (47.0) -100.0% See explanation for the month.
New York City 35.0 > (100%) New York City 18-b YTD receipts were favorable due to timing of receipts of funds from NYC. This was a delayed payment that should
have been received in December 2019.
Suffolk County (1.9) -50.0% See explanation for the month.
Putnam County (0.1) -50.0% The unfavorable YTD variance was due to the timing of receipt of payment.
Dutchess County (0.1) -50.0% See explanation for the month.
Orange County (0.0) -50.0% The unfavorable YTD variance was due to the timing of receipt of payment.
Rockland County (0.0) -50.0% The unfavorable YTD variance was due to the timing of receipt of payment.
City Subsidy for MTA Bus Company (25.2) -10.5% Variance was mostly timing related. Drawdowns are related to the timing of cash obligations for MTA Bus.
CDOT Subsidy for Metro-North Railroad (5.6) -9.2% See explanation for the month.
B&T Operating Surplus TransUer (73.4) -26.7% See explanation for the month.
Year-to-Date May 2020
Cash SubsidiesVariance
$
Variance
%Explanations
Master Page # 56 of 108 - Finance C
omm
ittee Meeting 6/24/2020
________________________________________________________________________________

6/1/2020 MTA Subsidy, Interagency Loan and Stabilization Fund Transactions - Cash Basis(millions)
Page 1 of 4
Current Month Stabilization Fund Year to Date Stabilization FundCommuter Transit Commuter Transit
(General Fd) (TA Stab) Total (General Fd) (TA Stab) TotalFrom Date: 05/01/20 05/01/20 05/01/20 01/01/20 01/01/20 01/01/20
To Date: 05/31/20 05/31/20 05/31/20 05/31/20 05/31/20 05/31/20
Opening Balance -$365.546 $132.059 -$233.486 $71.557 $116.264 $187.821
RECEIPTSInterest Earnings -0.083 0.110 0.027 -0.540 1.981 1.442NYCT Employee Health Contribution GASB Account - Fd # 0.000 0.000 0.000 0.000 0.000 0.000NYCT NYCERS Savings GASB Account - Fund #1116 0.000 0.000 0.000 0.000 0.000 0.000MTA BC GASB Employee Health Contribution Account - F 0.000 0.000 0.000 0.000 0.000 0.000Fuel Hedge Reserve 0.000 0.000 0.000 0.000 0.000 0.000Real Estate Advertising Revenue 0.000 8.984 8.984 0.000 45.000 45.000
New York StateState and regional mass transit taxes - MMTOA 0.000 0.000 0.000 0.000 0.000 0.000MTTF New York State 6.255 35.445 41.700 31.485 178.415 209.900Total Dedicated Taxes Received 6.255 35.445 41.700 31.485 178.415 209.900Less DTF Debt Service 3.939 19.017 22.956 24.377 117.041 141.418Net Dedicated Taxes for Operations 2.316 16.428 18.744 7.108 61.374 68.482Payroll Mobility Tax 0.000 0.000 0.000 138.000 162.000 300.000MTA Aid Trust Taxes 0.000 0.000 0.000 0.000 0.000 0.000New York City Operating Assistance 0.000 0.000 0.000 0.000 35.000 35.000Operating Assistance - 18b 0.000 0.000 0.000 0.000 0.000 0.000NYC School Fares 0.000 0.000 0.000 0.000 0.000 0.000NYC Subway Action Plan 0.000 0.000 0.000 0.000 35.706 35.706NYS Subway Action Plan 0.000 14.337 14.337 0.000 162.516 162.516NYS School Fares 0.000 0.000 0.000 0.000 0.000 0.000Additional Mass Transp Operating Assistance 0.000 n/a 0.000 0.000 n/a 0.000Total - New York State $2.316 $30.765 $33.081 $145.108 $456.597 $601.705
LocalDutchess County
Operating Assistance - 18b $0.000 n/a $0.000 $0.095 n/a $0.095Station Maintenance 0.000 n/a 0.000 0.000 n/a 0.000
Nassau CountyOperating Assistance - 18b 0.000 n/a 0.000 2.896 n/a 2.896
Station Maintenance 0.000 n/a 0.000 0.000 n/a 0.000New York City
Operating Assistance - 18b 0.000 0.000 0.000 0.000 0.000 0.000Urban - Real Property & Mortage Recording Tax n/a 13.534 13.534 n/a 220.298 220.298
Additional Assistance New York City n/a 0.000 0.000 n/a 0.000 0.000Station Maintenance 0.000 n/a 0.000 0.000 n/a 0.000
Orange CountyOperating Assistance - 18b 0.000 n/a 0.000 0.037 n/a 0.037
Station Maintenance 0.000 n/a 0.000 0.000 n/a 0.000Putnam County
Operating Assistance - 18b 0.000 n/a 0.000 0.095 n/a 0.095Station Maintenance 0.000 n/a 0.000 0.000 n/a 0.000
Rockland CountyOperating Assistance - 18b 0.000 n/a 0.000 0.007 n/a 0.007
Station Maintenance 0.000 n/a 0.000 0.000 n/a 0.000Sulfolk County
Operating Assistance - 18b 0.000 n/a 0.000 1.879 n/a 1.879
Master Page # 57 of 108 - Finance C
omm
ittee Meeting 6/24/2020
________________________________________________________________________________

6/1/2020 MTA Subsidy, Interagency Loan and Stabilization Fund Transactions - Cash Basis(millions)
Page 2 of 4
Current Month Stabilization Fund Year to Date Stabilization FundCommuter Transit Commuter Transit
(General Fd) (TA Stab) Total (General Fd) (TA Stab) TotalFrom Date: 05/01/20 05/01/20 05/01/20 01/01/20 01/01/20 01/01/20
To Date: 05/31/20 05/31/20 05/31/20 05/31/20 05/31/20 05/31/20
Station Maintenance 0.000 n/a 0.000 0.000 n/a 0.000Westchester County
Operating Assistance - 18b 0.000 n/a 0.000 3.671 n/a 3.671Station Maintenance 0.000 n/a 0.000 0.000 n/a 0.000
Total - Local $0.000 $13.534 $13.534 $8.681 $220.298 $228.978
Master Page # 58 of 108 - Finance C
omm
ittee Meeting 6/24/2020
________________________________________________________________________________

6/1/2020 MTA Subsidy, Interagency Loan and Stabilization Fund Transactions - Cash Basis(millions)
Page 3 of 4
Current Month Stabilization Fund Year to Date Stabilization FundCommuter Transit Commuter Transit
(General Fd) (TA Stab) Total (General Fd) (TA Stab) TotalFrom Date: 05/01/20 05/01/20 05/01/20 01/01/20 01/01/20 01/01/20
To Date: 05/31/20 05/31/20 05/31/20 05/31/20 05/31/20 05/31/20
MTA Bridges and Tunnels- Surplus Transfers 0.000 0.000 0.000 120.766 80.408 201.174
Total Subsidy and Other Receipts $2.316 $44.300 $46.615 $274.554 $757.302 $1,031.856
MTA Sources for Interagency LoansRetro Payment Reserve - Fund#1302 $0.000 $0.000 $0.000 $0.000 $0.000 $0.000Inter Agency Loan 0.000 0.000 0.000 0.000 800.000 800.000MTA Capital Program - Non-Resolution Funds 0.000 0.000 0.000 0.000 0.000 0.000MRT-2 Corporate Account 0.000 0.000 0.000 0.000 0.000 0.000Transfer from fund 1030 (NYCTA Op Fund) 0.000 0.000 0.000 0.000 0.000 0.000Total Loans $0.000 $0.000 $0.000 $0.000 $800.000 $800.000
Total Receipts and Loans Received $2.232 $53.394 $55.627 $274.014 $1,604.283 $1,878.298
Continued on Next Page Continued on Next Page
Master Page # 59 of 108 - Finance C
omm
ittee Meeting 6/24/2020
________________________________________________________________________________

6/1/2020 MTA Subsidy, Interagency Loan and Stabilization Fund Transactions - Cash Basis(millions)
Page 4 of 4
Current Month Stabilization Fund Year to Date Stabilization FundCommuter Transit Commuter Transit
(General Fd) (TA Stab) Total (General Fd) (TA Stab) TotalFrom Date: 05/01/20 05/01/20 05/01/20 01/01/20 01/01/20 01/01/20
To Date: 05/31/20 05/31/20 05/31/20 05/31/20 05/31/20 05/31/20
Brought forward from prior pageOpening Balance -$365.546 $132.059 -$233.486 $71.557 $116.264 $187.821Total Receipts and Loans Received 2.232 53.394 55.627 274.014 1,604.283 1,878.298Total Cash and Receipts Available -$363.313 $185.454 -$177.860 $345.572 $1,720.547 $2,066.119
DISBURSEMENTS
Revenue Supported Debt Service 44.329 62.852 107.181 285.978 409.762 695.740
Agency OperationsMTA Long Island Railroad 48.700 0.000 48.700 341.978 0.000 341.978MTA Metro-North Rail Road 44.496 0.000 44.496 217.143 0.000 217.143MTA New York City Transit 0.000 8.984 8.984 0.000 1,195.000 1,195.000MTA NYCT for SIRTOA 0.000 0.000 0.000 0.000 0.000 0.000MTA Bond Admin Cost 0.000 0.000 0.000 1.311 2.168 3.479MNR Repayment of 525 North Broadway loan 0.000 0.000 0.000 0.000 0.000 0.000MTA NYS Subway Action Plan 0.000 0.000 0.000 0.000 0.000 0.000Retro Payment Reserve - Fund#1300 0.000 0.000 0.000 0.000 0.000 0.000Committed to Capital - PAYGO 0.000 0.000 0.000 0.000 0.000 0.000
Total Debt Service and Operations $137.525 $71.836 $209.361 $846.410 $1,606.930 $2,453.340
Repayment of Interagency LoansPayback - Trans Non-bond - Fd#1028 0.000 0.000 0.000 0.000 0.000 0.000Transfer to Fund 1030 (NYCTA Op Fund) 0.000 0.000 0.000 0.000 0.000 0.000Transfer to Fund 1052 (MTA Bus Co Stab Fund) 0.000 0.000 0.000 0.000 0.000 0.000NYCT Employee Health Contribution GASB Account - Fd # 0.000 0.000 0.000 0.000 0.000 0.000MTA BC GASB Employee Health Contribution Account - F 0.000 0.000 0.000 0.000 0.000 0.000MRT-2 Corporate Account 0.000 0.000 0.000 0.000 0.000 0.0002012 OPEB Loan 0.000 0.000 0.000 0.000 0.000 0.000Total Loans Payback $0.000 $0.000 $0.000 $0.000 $0.000 $0.000
Total Disbursements $137.525 $71.836 $209.361 $846.410 $1,606.930 $2,453.340
STABILIZATION FUND BALANCE -$500.838 $113.618 -$387.221 -$500.838 $113.618 -$387.221
Ending Loan BalancesB&T Necessary Reconstruction Reserve 0.000 0.000 0.000 0.000 0.000 0.000MTA Capital Program - Non-Resolution Funds 0.000 0.000 0.000 0.000 0.000 0.000MRT-2 Corporate Account 0.000 0.000 0.000 0.000 0.000 0.0002012 OPEB Loan 0.000 0.000 0.000 0.000 0.000 0.000
$0.000 $0.000 $0.000 $0.000 $0.000 $0.000
n/a $526.344 $526.344 n/a $526.344 $526.344
Total Loan Balances (including negative Operating and negative Stabilization Fund Balances) $500.838 $412.726 $913.565
End of Month NYCT Operating Fund borrowing from MTA Invest Pool not included in Ending Loan Balances above
Master Page # 60 of 108 - Finance C
omm
ittee Meeting 6/24/2020
________________________________________________________________________________

Dedicated Tax Fund:
NYC Transit $14.6 $19.1 ($4.5) $0.0
Commuter Railroads 2.1 4.0 (1.8) $0.0
Dedicated Tax Fund Subtotal $16.8 $23.1 ($6.3) -37.7%
MTA Transportation Revenue:
NYC Transit $62.1 $62.9 ($0.8) $0.0
Commuter Railroads 53.3 44.5 8.8 $0.0
MTA Bus 2.2 0.0 2.2 $0.0
SIRTOA 0.9 0.2 0.8 $0.0
MTA Transportation Revenue Subtotal $118.5 $107.6 $11.0 9.3%
2 Broadway COPs:
NYC Transit $0.4 $0.4 $0.1 $0.0
Bridges & Tunnels 0.1 0.1 0.0 $0.0
MTA HQ 0.0 0.0 0.0 $0.0
Commuter Railroads 0.1 0.1 0.0 $0.2
2 Broadway COPs Subtotal $0.6 $0.5 $0.1 18.7%
TBTA General Resolution (2):
NYC Transit $16.7 $13.8 $2.9 $0.0
Commuter Railroads 7.5 6.2 1.3 $0.0
Bridges & Tunnels 22.6 18.0 4.6 20.5%
TBTA General Resolution Subtotal $46.8 $38.0 $8.8 18.8%
TBTA Subordinate (2):
NYC Transit $4.7 $3.8 $0.8 $0.0
Commuter Railroads 2.1 1.8 0.4 $0.0
Bridges & Tunnels 1.7 1.4 0.3 $0.0
TBTA Subordinate Subtotal $8.5 $7.0 $1.5 17.9%
Debt Service from Lockbox Revenues: NYC Transit $2.2 $0.0 $2.2 $0.0
Commuter Railroads 0.6 0.0 0.6 $0.0
MTA Bus 0.0 0.0 0.0 $0.0
SIRTOA 0.0 0.0 0.0 $0.0
Debt Service from Lockbox Subtotal $2.8 $0.0 $2.8 100.0%
Total Debt Service $194.0 $176.1 $17.9 9.2%
Debt Service by Agency:
NYC Transit $100.7 $100.0 $0.7 $0.0
Commuter Railroads 65.7 56.5 9.2 $0.0
MTA Bus 2.3 0.0 2.3 $0.0
SIRTOA 1.0 0.2 0.8 $0.0
Bridges & Tunnels 24.4 19.4 5.0 $0.0
MTAHQ 0.0 0.0 0.0 $0.0
Total Debt Service $194.0 $176.1 $17.9 9.2%
Notes:
Totals may not add due to rounding.
METROPOLITAN TRANSPORTATION AUTHORITYFEBRUARY FINANCIAL PLAN - Adopted Budget
Debt ServiceMay 2020($ in millions)
Adopted Budget Actual Variance % Var Explanation
Reversal of prior month's timing
variance offset by non‐receipt of May
BAB subsidy.
Reversal of prior period variance from
prefunding May 15th debt service, offset
by non‐receipt of May BAB subsidy.
Lower than budgeted variable rate.
Reversal of prior period variance from
prefunding May 15th debt service, offset
by non‐receipt of May BAB subsidy.
Reversal of prior period variance from
prefunding May 15th debt service.
Lower than budgeted debt service
related to the timing of Lockbox related
debt.
(1) Forecasted debt service is calculated based upon projected monthly deposits from available pledged revenues into debt service accounts. Actual payments to bondholders are made from the debt service accounts when due as required for each series of bonds and do not conform to this schedule.
(2) Generally, the calendarization of monthly debt service deposits is calculated by dividing projected annual debt service by 12. Month to month variations ("timing differences") on the existing debt portfolio can occur based upon, among other things, (a) for all bonds, the date when income from the securities in which the debt service accounts are invested becomes available varies, (b) for variable rate financings, differences between (i) the budgeted interest rate and the actual interest rate, (ii) projected interest payment dates to bondholders and actual interest payment dates to bondholders, and (iii) projected monthly funding dates for accrued debt service and actual funding dates, (c) for transactions with swaps, the difference between when MTA/TBTA funds debt service and the receipt of the corresponding swap payment by the counterparty, and difference between rates received and rates paid and (d) for commercial paper, the interest payment date is the date of the maturity of the commercial paper and the dealers set the term of the commercial paper from 1 to 270 days, which is not foreseeable at the time the annual debt service budgets are prepared.
(3) Debt service is allocated among Transit, Commuter, MTA Bus, and TBTA categories based on actual spending of bond proceeds for approved capital projects. Allocation of 2 Broadway COPs is based on occupancy.
Master Page # 61 of 108 - Finance Committee Meeting 6/24/2020________________________________________________________________________________

Dedicated Tax Fund:
NYC Transit $142.0 $151.7 ($9.7) $0.0
Commuter Railroads 29.3 31.6 (2.3) $0.0
Dedicated Tax Fund Subtotal $171.3 $183.3 ($12.0) -7.0%
MTA Transportation Revenue:
NYC Transit $387.5 $409.8 ($22.3) $0.0
Commuter Railroads 290.0 286.7 3.3 $0.0
MTA Bus 11.0 0.8 10.3 $0.0
SIRTOA 4.4 0.3 4.1 $0.0
MTA Transportation Revenue Subtotal $693.0 $697.6 ($4.6) -0.7%
2 Broadway COPs:
NYC Transit $2.2 $1.6 $0.6 $0.0
Bridges & Tunnels 0.3 0.2 0.1 $0.0
MTA HQ 0.0 0.0 0.0 $0.0
Commuter Railroads 0.7 0.5 0.2 $0.3
2 Broadway COPs Subtotal $3.2 $2.3 $0.9 28.4%
TBTA General Resolution (2):
NYC Transit $83.3 $81.4 $1.9 $0.0
Commuter Railroads 37.3 36.4 0.9 $0.0
Bridges & Tunnels 129.2 117.1 12.1 9.4%
TBTA General Resolution Subtotal $249.8 $234.9 $14.9 6.0%
TBTA Subordinate (2):
NYC Transit $23.4 $23.3 $0.1 $0.0
Commuter Railroads 10.7 10.7 0.0 $0.0
Bridges & Tunnels 8.5 8.5 0.0 $0.0
TBTA Subordinate Subtotal $42.6 $42.4 $0.2 0.4%
Debt Service from Lockbox Revenues:
NYC Transit $8.9 $0.0 $8.9 $0.0
Commuter Railroads 2.3 0.0 2.3 $0.0
MTA Bus 0.2 0.0 0.2 $0.0
SIRTOA 0.1 0.0 0.1 $0.0
Debt Service from Lockbox Subtotal $11.4 $0.0 $11.4 100.0%
Total Debt Service $1,171.4 $1,160.6 $10.8 0.9%
Debt Service by Agency:
NYC Transit $647.4 $667.9 ($20.5) $0.0
Commuter Railroads 370.2 365.8 4.4 $0.0
MTA Bus 11.2 0.8 10.4 $0.0
SIRTOA 4.5 0.3 4.2 $0.0
Bridges & Tunnels 138.0 125.8 12.2 $0.0
MTAHQ 0.0 0.0 0.0 $0.0
Total Debt Service $1,171.4 $1,160.6 $10.8 0.9%
Notes:
Totals may not add due to rounding.
Lower than budgeted debt service
related to the timing of Lockbox related
debt.
METROPOLITAN TRANSPORTATION AUTHORITYFEBRUARY FINANCIAL PLAN - Adopted Budget
Debt ServiceMay 2020 Year-to-Date
($ in millions)
Adopted Budget Actual Variance % Var Explanation
Non‐receipt of May BAB subsidy.
Lower than budgeted variable rates;
lower than budgeted debt service
related to timing and structure of
issuances; offset by non‐receipt of May
BAB subsidy.
Lower than budgeted variable rates;
lower than budgeted debt service
related to timing and structure of TBTA
issuances; offset by non‐receipt of May
BAB subsudy.
(1) Forecasted debt service is calculated based upon projected monthly deposits from available pledged revenues into debt service accounts. Actual payments to bondholders are made from the debt service accounts when due as required for each series of bonds and do not conform to this schedule.
(2) Generally, the calendarization of monthly debt service deposits is calculated by dividing projected annual debt service by 12. Month to month variations ("timing differences") on the existing debt portfolio can occur based upon, among other things, (a) for all bonds, the date when income from the securities in which the debt service accounts are invested becomes available varies, (b) for variable rate financings, differences between (i) the budgeted interest rate and the actual interest rate, (ii) projected interest payment dates to bondholders and actual interest payment dates to bondholders, and (iii) projected monthly funding dates for accrued debt service and actual funding dates, (c) for transactions with swaps, the difference between when MTA/TBTA funds debt service and the receipt of the corresponding swap payment by the counterparty, and difference between rates received and rates paid and (d) for commercial paper, the interest payment date is the date of the maturity of the commercial paper and the dealers set the term of the commercial paper from 1 to 270 days, which is not foreseeable at the time the annual debt service budgets are prepared.
(3) Debt service is allocated among Transit, Commuter, MTA Bus, and TBTA categories based on actual spending of bond proceeds for approved capital projects. Allocation of 2 Broadway COPs is based on occupancy.
Master Page # 62 of 108 - Finance Committee Meeting 6/24/2020________________________________________________________________________________

c Function/AgencyAdopted Budget Actual
Variance Favorable/
(Unfavorable)
Administration 4,394 4,012 382 NYC Transit 1,264 1,126 138 Long Island Rail Road 509 451 58 Metro-North Railroad 472 428 44 Bridges & Tunnels 78 69 9 Headquarters 1,908 1,797 111 Staten Island Railway 28 20 8 Capital & Development 19 17 2 Bus Company 116 104 12
Operations 31,430 30,736 694 NYC Transit 23,703 23,125 578 Long Island Rail Road 2,691 2,666 25 Metro-North Railroad 2,198 2,152 46 Bridges & Tunnels 102 80 22 Headquarters - - - Staten Island Railway 131 118 13 Capital & Development - - - Bus Company 2,605 2,595 10
Maintenance 32,675 31,668 1,007 NYC Transit 22,525 21,964 561 Long Island Rail Road 4,407 4,203 204 Metro-North Railroad 3,991 3,791 200 Bridges & Tunnels 395 373 22 Headquarters - - - Staten Island Railway 209 204 5 Capital & Development - - - Bus Company 1,148 1,133 15
Engineering/Capital 2,251 1,781 470 NYC Transit 1,450 1,179 271 Long Island Rail Road 227 188 39 Metro-North Railroad 127 108 19 Bridges & Tunnels 253 174 79 Headquarters - - - Staten Island Railway 16 9 7 Capital & Development 143 99 44 Bus Company 35 24 11 .
Public Safety 2,474 2,168 306 NYC Transit 657 632 25 Long Island Rail Road - - - Metro-North Railroad - - - Bridges & Tunnels 650 562 88 Headquarters 1,154 962 192 Staten Island Railway - - - Capital & Development - - - Bus Company 13 12 1
Total Positions 73,224 70,365 2,859
Note: Totals may differ due to rounding
METROPOLITAN TRANSPORTATION AUTHORITYFebruary Financial Plan - 2020 Adopted Budget
Total Positions by Function and AgencyMay 2020
Master Page # 63 of 108 - Finance Committee Meeting 6/24/2020________________________________________________________________________________

METROPOLITAN TRANSPORTATION AUTHORITYFebruary Financial Plan - 2020 Adopted Budget
Total Positions by Function and AgencyMay 2020
CategoryAdopted Budget Actual
Variance Favorable/
(Unfavorable)
Total Positions 73,224 70,365 2,859 NYC Transit 49,599 48,026 1,573 Long Island Rail Road 7,834 7,508 326 Metro-North Railroad 6,788 6,479 309 Bridges & Tunnels 1,478 1,258 220 Headquarters 3,062 2,759 303 Staten Island Railway 384 351 33 Capital & Development 162 116 46 Bus Company 3,917 3,868 49
Non-reimbursable 65,255 64,827 427 NYC Transit 44,259 44,511 (252) Long Island Rail Road 6,468 6,351 117 Metro-North Railroad 5,961 5,982 (21) Bridges & Tunnels 1,391 1,171 220 Headquarters 2,963 2,668 295 Staten Island Railway 334 311 23 Capital Construction Company - - - Bus Company 3,879 3,833 46
Reimbursable 7,969 5,538 2,431 NYC Transit 5,340 3,515 1,825 Long Island Rail Road 1,366 1,157 209 Metro-North Railroad 827 497 330 Bridges & Tunnels 87 87 - Headquarters 99 91 8 Staten Island Railway 50 40 10 Capital & Development 162 116 46 Bus Company 38 35 3
Total Full Time 73,014 70,215 2,799 NYC Transit 49,408 47,888 1,520 Long Island Rail Road 7,834 7,508 326 Metro-North Railroad 6,787 6,478 309 Bridges & Tunnels 1,478 1,258 220 Headquarters 3,062 2,759 303 Staten Island Railway 384 351 33 Capital & Development 162 116 46 Bus Company 3,899 3,857 42
Total Full-Time Equivalents 210 150 60 NYC Transit 191 138 53 Long Island Rail Road - - - Metro-North Railroad 1 1 - Bridges & Tunnels - - - Headquarters - - - Staten Island Railway - - - Capital & Development - - - Bus Company 18 11 7
Note: Totals may differ due to rounding
Master Page # 64 of 108 - Finance Committee Meeting 6/24/2020________________________________________________________________________________

FUNCTION/OCCUPATIONAL GROUPAdopted Budget Actual
Variance Favorable/
(Unfavorable)
Administration 4,394 4,012 382 Managers/Supervisors 1,515 1,339 177 Professional, Technical, Clerical 2,740 2,534 206 Operational Hourlies 139 139 -
Operations 31,430 30,736 694 Managers/Supervisors 3,811 3,546 265 Professional, Technical, Clerical 996 903 93 Operational Hourlies 26,623 26,287 336
Maintenance 32,675 31,668 1,007 Managers/Supervisors 5,799 5,562 237 Professional, Technical, Clerical 1,907 1,625 282 Operational Hourlies 24,969 24,481 488
Engineering/Capital 2,251 1,781 470 Managers/Supervisors 648 527 121 Professional, Technical, Clerical 1,592 1,246 346 Operational Hourlies 11 8 3
Public Safety 2,474 2,168 306 Managers/Supervisors 703 575 128 Professional, Technical, Clerical 141 116 25 Operational Hourlies 1,630 1,477 153
Total Positions 73,224 70,365 2,859 Managers/Supervisors 12,476 11,549 928 Professional, Technical, Clerical 7,376 6,425 951 Operational Hourlies 53,372 52,392 980
Note: Totals may differ due to rounding
METROPOLITAN TRANSPORTATION AUTHORITYFebruary Financial Plan - 2020 Adopted Budget
Total Positions by Function and Occupational GroupMay 2020
Note: SIR’s actual headcount by occupational group was not available at the time of this report. Consequently, actuals by occupational group were estimated based on the most recent data available (August, 2011).
Master Page # 65 of 108 - Finance Committee Meeting 6/24/2020________________________________________________________________________________

METROPOLITAN TRANSPORTATION AUTHORITYFarebox Recovery and Operating Ratios
2020 Adopted Budget and Actuals
FAREBOX RECOVERY RATIOS
2020 2020Adopted Budget Actual
Full Year May YTD
New York City Transit 36.2% 23.0%Staten Island Railway 8.0% 5.8%Long Island Rail Road 27.9% 17.3%Metro-North Railroad 41.6% 23.2%MTA Bus Company 22.0% 14.4%
MTA Total Agency Average 34.5% 21.7%
FAREBOX OPERATING RATIOS
2020 2020Adopted Budget Actual
Full Year May YTD
New York City Transit 53.4% 31.3%Staten Island Railway 13.4% 8.9%Long Island Rail Road 43.7% 28.5%Metro-North Railroad 56.3% 31.9%MTA Bus Company 29.0% 16.0%
MTA Total Agency Average 50.6% 30.0%
Farebox recovery ratio has a long-term focus. It includes costs that are not funded in the current year, except in an accounting-ledger sense, but are, in effect, passed on to future years. Those costs include depreciation and interest on long-term debt. Approximately 20% (and sometimes more) of MTA costs are not recovered in the current year from farebox revenues, other operating revenues or subsidies. That is why MTA operating statements generally show deficits. In addition, the recovery ratio allocates centralized MTA services to the Agencies, such as Security, the costs of the Inspector General, Civil Rights, Audit, Risk Management, Legal and Shared Services.
Farebox operating ratio focuses on Agency operating financial performance. It reflects the way MTA meets its statutory and bond-covenant budget-balancing requirements, and it excludes certain costs that are not subject to Agency control, but are provided centrally by the MTA.
In the agenda materials for the Meeting of the Metro-North and Long Island Committees, thecalculations of the farebox operating and recovery ratios for the LIRR and MNR use a revised methodology to put the railroads on a more comparable basis. Those statistics, which are included in the respective financial and ridership reports of both Agencies, differ from the statistics presented in this table.
Master Page # 66 of 108 - Finance Committee Meeting 6/24/2020________________________________________________________________________________

New York City TransitLong Island Rail RoadMetro-North RailroadBridges and TunnelsBus Company
Report on Revenue Passengers and VehiclesRidership Data Through April, 2020
NOTE: Ridership data are preliminary and subject to revision as well asadjustments warranted by annual audit review.
Prepared by:MTA Division of Management & Budget
Wednesday, June 3, 2020
Master Page # 67 of 108 - Finance C
omm
ittee Meeting 6/24/2020
________________________________________________________________________________
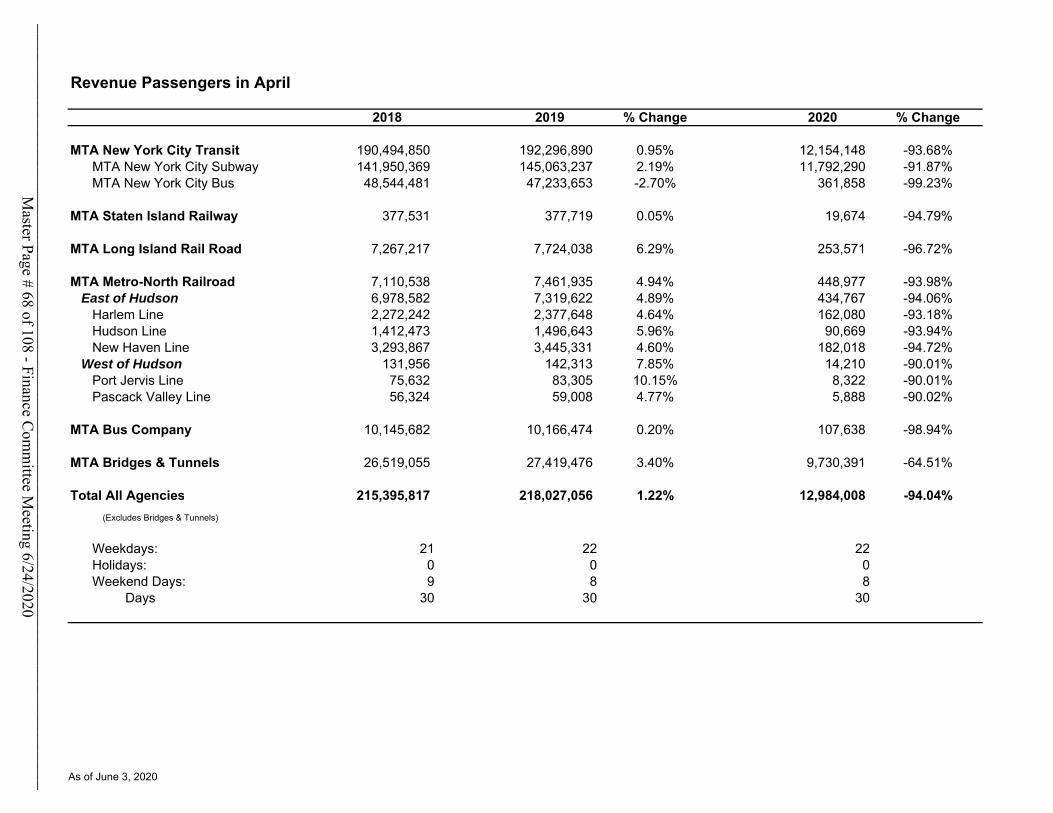
Revenue Passengers in April
2018 2019 % Change 2020 % Change
MTA New York City Transit 190,494,850 192,296,890 0.95% 12,154,148 -93.68%MTA New York City Subway 141,950,369 145,063,237 2.19% 11,792,290 -91.87%MTA New York City Bus 48,544,481 47,233,653 -2.70% 361,858 -99.23%
MTA Staten Island Railway 377,531 377,719 0.05% 19,674 -94.79%
MTA Long Island Rail Road 7,267,217 7,724,038 6.29% 253,571 -96.72%
MTA Metro-North Railroad 7,110,538 7,461,935 4.94% 448,977 -93.98%East of Hudson 6,978,582 7,319,622 4.89% 434,767 -94.06%
Harlem Line 2,272,242 2,377,648 4.64% 162,080 -93.18%Hudson Line 1,412,473 1,496,643 5.96% 90,669 -93.94%New Haven Line 3,293,867 3,445,331 4.60% 182,018 -94.72%
West of Hudson 131,956 142,313 7.85% 14,210 -90.01%Port Jervis Line 75,632 83,305 10.15% 8,322 -90.01%Pascack Valley Line 56,324 59,008 4.77% 5,888 -90.02%
MTA Bus Company 10,145,682 10,166,474 0.20% 107,638 -98.94%
MTA Bridges & Tunnels 26,519,055 27,419,476 3.40% 9,730,391 -64.51%
Total All Agencies 215,395,817 218,027,056 1.22% 12,984,008 -94.04%
(Excludes Bridges & Tunnels)
Weekdays: 21 22 22Holidays: 0 0 0Weekend Days: 9 8 8
Days 30 30 30
As of June 3, 2020
Master Page # 68 of 108 - Finance C
omm
ittee Meeting 6/24/2020
________________________________________________________________________________
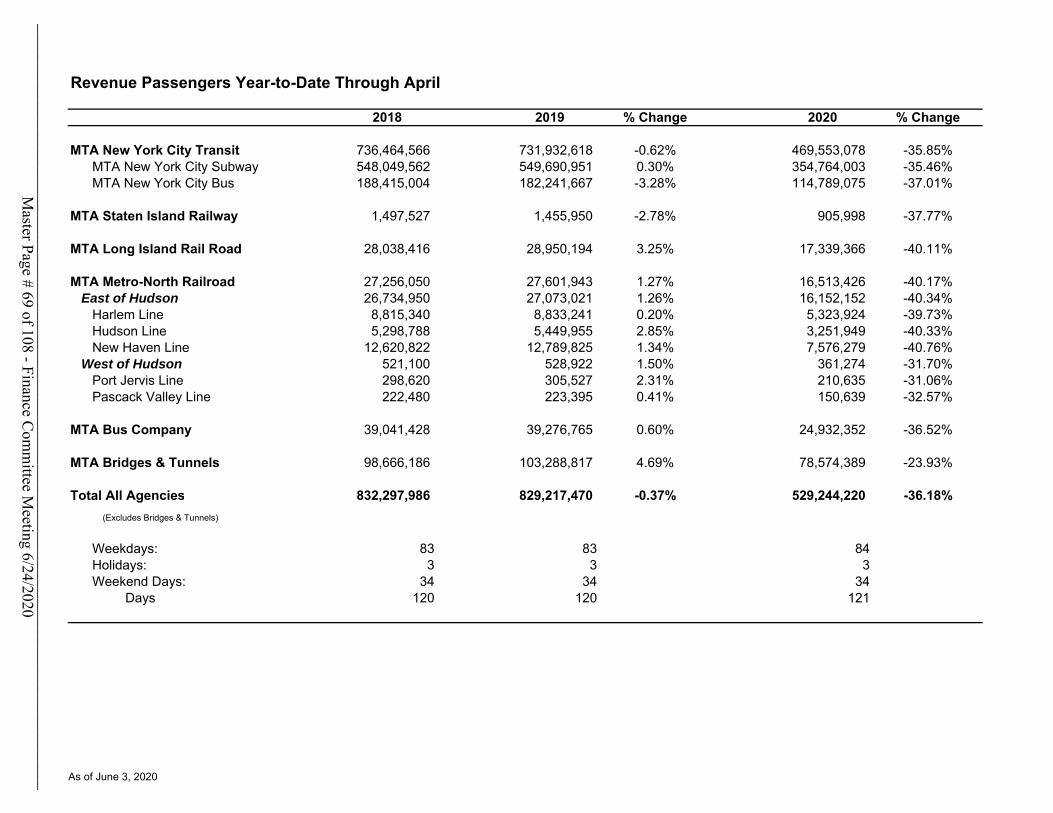
Revenue Passengers Year-to-Date Through April
2018 2019 % Change 2020 % Change
MTA New York City Transit 736,464,566 731,932,618 -0.62% 469,553,078 -35.85%MTA New York City Subway 548,049,562 549,690,951 0.30% 354,764,003 -35.46%MTA New York City Bus 188,415,004 182,241,667 -3.28% 114,789,075 -37.01%
MTA Staten Island Railway 1,497,527 1,455,950 -2.78% 905,998 -37.77%
MTA Long Island Rail Road 28,038,416 28,950,194 3.25% 17,339,366 -40.11%
MTA Metro-North Railroad 27,256,050 27,601,943 1.27% 16,513,426 -40.17%East of Hudson 26,734,950 27,073,021 1.26% 16,152,152 -40.34%
Harlem Line 8,815,340 8,833,241 0.20% 5,323,924 -39.73%Hudson Line 5,298,788 5,449,955 2.85% 3,251,949 -40.33%New Haven Line 12,620,822 12,789,825 1.34% 7,576,279 -40.76%
West of Hudson 521,100 528,922 1.50% 361,274 -31.70%Port Jervis Line 298,620 305,527 2.31% 210,635 -31.06%Pascack Valley Line 222,480 223,395 0.41% 150,639 -32.57%
MTA Bus Company 39,041,428 39,276,765 0.60% 24,932,352 -36.52%
MTA Bridges & Tunnels 98,666,186 103,288,817 4.69% 78,574,389 -23.93%
Total All Agencies 832,297,986 829,217,470 -0.37% 529,244,220 -36.18%
(Excludes Bridges & Tunnels)
Weekdays: 83 83 84Holidays: 3 3 3Weekend Days: 34 34 34
Days 120 120 121
As of June 3, 2020
Master Page # 69 of 108 - Finance C
omm
ittee Meeting 6/24/2020
________________________________________________________________________________
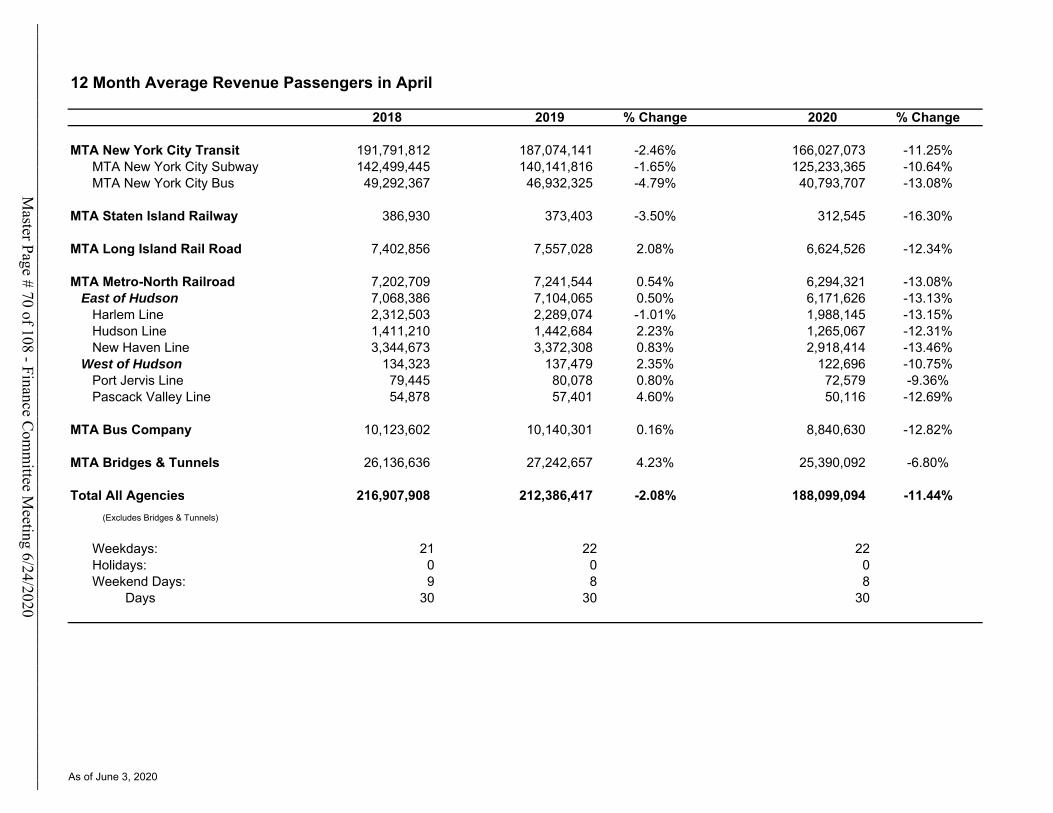
12 Month Average Revenue Passengers in April
2018 2019 % Change 2020 % Change
MTA New York City Transit 191,791,812 187,074,141 -2.46% 166,027,073 -11.25%MTA New York City Subway 142,499,445 140,141,816 -1.65% 125,233,365 -10.64%MTA New York City Bus 49,292,367 46,932,325 -4.79% 40,793,707 -13.08%
MTA Staten Island Railway 386,930 373,403 -3.50% 312,545 -16.30%
MTA Long Island Rail Road 7,402,856 7,557,028 2.08% 6,624,526 -12.34%
MTA Metro-North Railroad 7,202,709 7,241,544 0.54% 6,294,321 -13.08%East of Hudson 7,068,386 7,104,065 0.50% 6,171,626 -13.13%
Harlem Line 2,312,503 2,289,074 -1.01% 1,988,145 -13.15%Hudson Line 1,411,210 1,442,684 2.23% 1,265,067 -12.31%New Haven Line 3,344,673 3,372,308 0.83% 2,918,414 -13.46%
West of Hudson 134,323 137,479 2.35% 122,696 -10.75%Port Jervis Line 79,445 80,078 0.80% 72,579 -9.36%Pascack Valley Line 54,878 57,401 4.60% 50,116 -12.69%
MTA Bus Company 10,123,602 10,140,301 0.16% 8,840,630 -12.82%
MTA Bridges & Tunnels 26,136,636 27,242,657 4.23% 25,390,092 -6.80%
Total All Agencies 216,907,908 212,386,417 -2.08% 188,099,094 -11.44%
(Excludes Bridges & Tunnels)
Weekdays: 21 22 22Holidays: 0 0 0Weekend Days: 9 8 8
Days 30 30 30
As of June 3, 2020
Master Page # 70 of 108 - Finance C
omm
ittee Meeting 6/24/2020
________________________________________________________________________________

Average Weekday Revenue Passengers in April
2018 2019 % Change 2020 % Change
MTA New York City Transit 7,437,683 7,371,887 -0.88% 460,503 -93.75%MTA New York City Subway 5,564,686 5,576,744 0.22% 446,606 -91.99%MTA New York City Bus 1,872,997 1,795,143 -4.16% 13,897 -99.23%
MTA Staten Island Railway 16,226 15,726 -3.08% 764 -95.14%
MTA Long Island Rail Road 303,688 310,439 2.22% 10,320 -96.68%
MTA Metro-North Railroad 289,923 294,868 1.71% 17,880 -93.94%East of Hudson 283,647 288,396 1.67% 17,234 -94.02%
Harlem Line 93,309 94,550 1.33% 6,469 -93.16%Hudson Line 57,126 58,707 2.77% 3,578 -93.90%New Haven Line 133,213 135,139 1.45% 7,187 -94.68%
West of Hudson 6,276 6,472 3.12% 646 -90.02%Port Jervis Line 3,596 3,789 5.37% 378 -90.02%Pascack Valley Line 2,680 2,683 0.11% 268 -90.01%
MTA Bus Company 399,312 390,950 -2.09% 4,311 -98.90%
MTA Bridges & Tunnels 900,145 926,113 2.88% 356,124 -61.55%
Total All Agencies 8,446,832 8,383,870 -0.75% 493,778 -94.11%
(Excludes Bridges & Tunnels)
Weekdays: 21 22 22Holidays: 0 0 0Weekend Days: 9 8 8
Days 30 30 30
As of June 3, 2020
Master Page # 71 of 108 - Finance C
omm
ittee Meeting 6/24/2020
________________________________________________________________________________

As of June 3, 2020
0
50,000,000
100,000,000
150,000,000
200,000,000
250,000,000
May Jun Jul Aug Sep Oct Nov Dec Jan Feb Mar Apr
Metropolitan Transportation AuthorityRevenue Passengers
2017‐2018 2018‐2019 2019‐2020
Master Page # 72 of 108 - Finance C
omm
ittee Meeting 6/24/2020
________________________________________________________________________________

As of June 3, 2020
180
185
190
195
200
205
210
215
220
225
230
May Jun Jul Aug Sep Oct Nov Dec Jan Feb Mar Apr
Millions
Metropolitan Transportation AuthorityRevenue Passengers ‐ 12 Month Averages
2017‐2018 2018‐2019 2019‐2020
Master Page # 73 of 108 - Finance C
omm
ittee Meeting 6/24/2020
________________________________________________________________________________

As of June 3, 2020
0.0
1.0
2.0
3.0
4.0
5.0
6.0
7.0
8.0
9.0
10.0
May Jun Jul Aug Sep Oct Nov Dec Jan Feb Mar Apr
Millions
Metropolitan Transportation AuthorityAverage Weekday Passengers
2017‐2018 2018‐2019 2019‐2020
Master Page # 74 of 108 - Finance C
omm
ittee Meeting 6/24/2020
________________________________________________________________________________

Metropolitan Transportation Authority
Revenue Passengers 2017-2018 2018-2019 % Change 2019-2020 % ChangeMay 234,464,126 228,848,542 -2.40% 227,364,753 -0.65%June 227,061,370 216,408,417 -4.69% 212,300,561 -1.90%July 210,140,452 207,692,129 -1.17% 211,804,095 1.98%August 216,298,894 209,534,089 -3.13% 208,448,482 -0.52%September 218,609,547 206,414,792 -5.58% 216,825,176 5.04%October 234,499,549 233,935,642 -0.24% 233,100,272 -0.36%November 219,487,402 211,577,176 -3.60% 210,390,296 -0.56%December 210,035,572 205,008,747 -2.39% 207,711,277 1.32%January 203,484,027 203,198,087 -0.14% 207,809,756 2.27%February 194,360,061 190,604,530 -1.93% 196,597,761 3.14%March 219,058,081 217,387,798 -0.76% 111,852,694 -48.55%April 215,395,817 218,027,056 1.22% 12,984,008 -94.04%Year-to-Date 832,297,986 829,217,470 -0.37% 529,244,220 -36.18%
12 Month Averages 2017-2018 2018-2019 % Change 2019-2020 % ChangeMay 222,961,931 216,439,943 -2.93% 212,262,768 -1.93%June 222,545,846 215,552,197 -3.14% 211,920,447 -1.68%July 222,099,593 215,348,170 -3.04% 212,263,110 -1.43%August 221,625,899 214,784,436 -3.09% 212,172,643 -1.22%September 220,719,879 213,768,207 -3.15% 213,040,175 -0.34%October 220,975,821 213,721,214 -3.28% 212,970,561 -0.35%November 220,529,159 213,062,029 -3.39% 212,871,654 -0.09%December 219,371,613 212,643,127 -3.07% 213,096,865 0.21%January 218,506,588 212,619,298 -2.69% 213,481,171 0.41%February 218,070,850 212,306,337 -2.64% 213,980,607 0.79%March 217,068,795 212,167,147 -2.26% 205,186,015 -3.29%April 216,907,908 212,386,417 -2.08% 188,099,094 -11.44%
Average Weekday Passengers 2017-2018 2018-2019 % Change 2019-2020 % ChangeMay 8,917,853 8,735,756 -2.04% 8,622,466 -1.30%June 8,666,226 8,432,101 -2.70% 8,412,193 -0.24%July 8,134,147 7,954,086 -2.21% 7,970,300 0.20%August 7,908,074 7,725,838 -2.30% 7,761,197 0.46%September 8,748,522 8,447,398 -3.44% 8,734,905 3.40%October 8,889,258 8,709,735 -2.02% 8,631,718 -0.90%November 8,696,449 8,372,431 -3.73% 8,464,327 1.10%December 8,298,078 7,989,712 -3.72% 7,955,513 -0.43%January 7,777,663 7,786,364 0.11% 7,945,230 2.04%February 8,357,451 8,170,633 -2.24% 8,234,000 0.78%March 8,207,563 8,422,686 2.62% 4,308,937 -48.84%April 8,446,832 8,383,870 -0.75% 493,778 -94.11%
As of June 3, 2020
Master Page # 75 of 108 - Finance C
omm
ittee Meeting 6/24/2020
________________________________________________________________________________

MTA New York City Transit
Revenue Passengers 2017-2018 2018-2019 % Change 2019-2020 % ChangeMay 207,994,572 202,154,565 -2.81% 200,610,929 -0.76%June 200,591,083 190,346,850 -5.11% 187,197,319 -1.65%July 185,271,335 182,215,116 -1.65% 185,786,569 1.96%August 190,438,818 183,617,094 -3.58% 182,893,941 -0.39%September 193,418,747 181,832,606 -5.99% 191,382,235 5.25%October 207,541,739 206,105,827 -0.69% 205,768,638 -0.16%November 194,193,319 186,463,618 -3.98% 186,074,116 -0.21%December 185,587,561 180,221,398 -2.89% 183,058,046 1.57%January 180,082,272 179,078,762 -0.56% 183,591,692 2.52%February 172,152,646 168,500,761 -2.12% 174,031,352 3.28%March 193,734,798 192,056,205 -0.87% 99,775,885 -48.05%April 190,494,850 192,296,890 0.95% 12,154,148 -93.68%Year-to-Date 736,464,566 731,932,618 -0.62% 469,553,078 -35.85%
12 Month Averages 2017-2018 2018-2019 % Change 2019-2020 % ChangeMay 197,542,735 191,305,144 -3.16% 186,945,505 -2.28%June 197,156,568 190,451,458 -3.40% 186,683,044 -1.98%July 196,737,555 190,196,773 -3.32% 186,980,665 -1.69%August 196,294,149 189,628,296 -3.40% 186,920,402 -1.43%September 195,468,940 188,662,785 -3.48% 187,716,204 -0.50%October 195,664,154 188,543,125 -3.64% 187,688,105 -0.45%November 195,228,888 187,898,984 -3.75% 187,655,647 -0.13%December 194,165,580 187,451,803 -3.46% 187,892,034 0.23%January 193,343,531 187,368,177 -3.09% 188,268,112 0.48%February 192,923,435 187,063,854 -3.04% 188,728,994 0.89%March 191,994,789 186,923,971 -2.64% 181,038,968 -3.15%April 191,791,812 187,074,141 -2.46% 166,027,073 -11.25%
Average Weekday Passengers 2017-2018 2018-2019 % Change 2019-2020 % ChangeMay 7,884,233 7,693,437 -2.42% 7,583,647 -1.43%June 7,630,605 7,387,753 -3.18% 7,385,681 -0.03%July 7,129,419 6,948,786 -2.53% 6,971,875 0.33%August 6,941,224 6,754,630 -2.69% 6,787,585 0.49%September 7,701,788 7,396,837 -3.96% 7,676,091 3.78%October 7,838,635 7,651,409 -2.39% 7,595,551 -0.73%November 7,647,522 7,333,470 -4.11% 7,431,166 1.33%December 7,291,265 6,980,243 -4.27% 6,977,537 -0.04%January 6,837,308 6,819,989 -0.25% 6,975,412 2.28%February 7,368,302 7,190,656 -2.41% 7,250,063 0.83%March 7,221,603 7,407,083 2.57% 3,804,485 -48.64%April 7,437,683 7,371,887 -0.88% 460,503 -93.75%
As of June 3, 2020
Master Page # 76 of 108 - Finance C
omm
ittee Meeting 6/24/2020
________________________________________________________________________________

MTA New York City Subway
Revenue Passengers 2017-2018 2018-2019 % Change 2019-2020 % ChangeMay 153,470,353 150,320,833 -2.05% 150,789,403 0.31%June 149,360,780 142,709,768 -4.45% 141,384,305 -0.93%July 137,447,659 136,167,499 -0.93% 139,505,934 2.45%August 141,721,056 136,806,572 -3.47% 137,210,300 0.30%September 143,012,669 134,989,959 -5.61% 143,268,789 6.13%October 153,378,108 154,116,408 0.48% 155,315,738 0.78%November 144,404,634 140,711,661 -2.56% 140,724,722 0.01%December 139,148,517 136,188,140 -2.13% 139,837,187 2.68%January 134,683,435 134,544,724 -0.10% 138,446,295 2.90%February 127,432,835 126,359,734 -0.84% 130,902,123 3.59%March 143,982,923 143,723,256 -0.18% 73,623,295 -48.77%April 141,950,369 145,063,237 2.19% 11,792,290 -91.87%Year-to-Date 548,049,562 549,690,951 0.30% 354,764,003 -35.46%
12 Month Averages 2017-2018 2018-2019 % Change 2019-2020 % ChangeMay 145,592,004 142,236,985 -2.30% 140,180,863 -1.45%June 145,454,816 141,682,734 -2.59% 140,070,408 -1.14%July 145,254,502 141,576,054 -2.53% 140,348,611 -0.87%August 145,089,337 141,166,514 -2.70% 140,382,255 -0.56%September 144,634,777 140,497,954 -2.86% 141,072,158 0.41%October 144,863,069 140,559,479 -2.97% 141,172,102 0.44%November 144,643,960 140,251,732 -3.04% 141,173,190 0.66%December 143,947,217 140,005,034 -2.74% 141,477,277 1.05%January 143,480,146 139,993,474 -2.43% 141,802,408 1.29%February 143,227,460 139,904,049 -2.32% 142,180,941 1.63%March 142,610,627 139,882,410 -1.91% 136,339,277 -2.53%April 142,499,445 140,141,816 -1.65% 125,233,365 -10.64%
Average Weekday Passengers 2017-2018 2018-2019 % Change 2019-2020 % ChangeMay 5,836,342 5,743,481 -1.59% 5,717,721 -0.45%June 5,698,402 5,569,036 -2.27% 5,609,231 0.72%July 5,330,092 5,232,455 -1.83% 5,278,407 0.88%August 5,197,367 5,068,468 -2.48% 5,136,088 1.33%September 5,713,700 5,524,451 -3.31% 5,771,557 4.47%October 5,808,527 5,734,634 -1.27% 5,747,781 0.23%November 5,698,053 5,556,889 -2.48% 5,636,153 1.43%December 5,468,971 5,280,965 -3.44% 5,339,212 1.10%January 5,122,325 5,144,107 0.43% 5,270,001 2.45%February 5,479,225 5,423,877 -1.01% 5,484,495 1.12%March 5,388,832 5,567,422 3.31% 2,819,708 -49.35%April 5,564,686 5,576,744 0.22% 446,606 -91.99%
As of June 3, 2020
Master Page # 77 of 108 - Finance C
omm
ittee Meeting 6/24/2020
________________________________________________________________________________

MTA New York City Bus
Revenue Passengers 2017-2018 2018-2019 % Change 2019-2020 % ChangeMay 54,524,219 51,833,732 -4.93% 49,821,526 -3.88%June 51,230,303 47,637,082 -7.01% 45,813,014 -3.83%July 47,823,676 46,047,617 -3.71% 46,280,635 0.51%August 48,717,762 46,810,522 -3.91% 45,683,641 -2.41%September 50,406,078 46,842,647 -7.07% 48,113,446 2.71%October 54,163,631 51,989,419 -4.01% 50,452,900 -2.96%November 49,788,685 45,751,957 -8.11% 45,349,394 -0.88%December 46,439,044 44,033,258 -5.18% 43,220,859 -1.84%January 45,398,837 44,534,038 -1.90% 45,145,397 1.37%February 44,719,811 42,141,027 -5.77% 43,129,229 2.34%March 49,751,875 48,332,949 -2.85% 26,152,590 -45.89%April 48,544,481 47,233,653 -2.70% 361,858 -99.23%Year-to-Date 188,415,004 182,241,667 -3.28% 114,789,075 -37.01%
12 Month Averages 2017-2018 2018-2019 % Change 2019-2020 % ChangeMay 51,950,730 49,068,160 -5.55% 46,764,641 -4.69%June 51,701,752 48,768,724 -5.67% 46,612,636 -4.42%July 51,483,053 48,620,720 -5.56% 46,632,054 -4.09%August 51,204,812 48,461,783 -5.36% 46,538,147 -3.97%September 50,834,163 48,164,830 -5.25% 46,644,047 -3.16%October 50,801,085 47,983,646 -5.55% 46,516,004 -3.06%November 50,584,928 47,647,252 -5.81% 46,482,457 -2.44%December 50,218,363 47,446,770 -5.52% 46,414,757 -2.18%January 49,863,385 47,374,703 -4.99% 46,465,703 -1.92%February 49,695,974 47,159,805 -5.10% 46,548,054 -1.30%March 49,384,163 47,041,561 -4.74% 44,699,690 -4.98%April 49,292,367 46,932,325 -4.79% 40,793,707 -13.08%
Average Weekday Passengers 2017-2018 2018-2019 % Change 2019-2020 % ChangeMay 2,047,891 1,949,956 -4.78% 1,865,926 -4.31%June 1,932,203 1,818,717 -5.87% 1,776,450 -2.32%July 1,799,327 1,716,331 -4.61% 1,693,468 -1.33%August 1,743,857 1,686,163 -3.31% 1,651,497 -2.06%September 1,988,088 1,872,386 -5.82% 1,904,534 1.72%October 2,030,108 1,916,775 -5.58% 1,847,770 -3.60%November 1,949,469 1,776,581 -8.87% 1,795,013 1.04%December 1,822,294 1,699,278 -6.75% 1,638,325 -3.59%January 1,714,982 1,675,882 -2.28% 1,705,411 1.76%February 1,889,077 1,766,779 -6.47% 1,765,568 -0.07%March 1,832,772 1,839,661 0.38% 984,777 -46.47%April 1,872,997 1,795,143 -4.16% 13,897 -99.23%
As of June 3, 2020
Master Page # 78 of 108 - Finance C
omm
ittee Meeting 6/24/2020
________________________________________________________________________________

MTA Bus
Revenue Passengers 2017-2018 2018-2019 % Change 2019-2020 % ChangeMay 10,948,782 11,008,565 0.55% 10,805,557 -1.84%June 10,415,892 10,147,168 -2.58% 9,625,988 -5.14%July 9,835,319 9,978,075 1.45% 10,170,305 1.93%August 10,182,683 10,270,251 0.86% 10,005,056 -2.58%September 10,293,093 10,049,613 -2.37% 10,394,220 3.43%October 10,942,815 11,325,167 3.49% 10,952,595 -3.29%November 10,230,691 10,030,732 -1.95% 9,814,745 -2.15%December 9,592,517 9,597,279 0.05% 9,386,745 -2.19%January 9,359,616 9,726,639 3.92% 9,814,828 0.91%February 9,153,050 9,024,999 -1.40% 9,290,692 2.94%March 10,383,080 10,358,653 -0.24% 5,719,195 -44.79%April 10,145,682 10,166,474 0.20% 107,638 -98.94%Year-to-Date 39,041,428 39,276,765 0.60% 24,932,352 -36.52%
12 Month Averages 2017-2018 2018-2019 % Change 2019-2020 % ChangeMay 10,353,387 10,128,584 -2.17% 10,123,384 -0.05%June 10,323,175 10,106,190 -2.10% 10,079,952 -0.26%July 10,309,237 10,118,086 -1.85% 10,095,971 -0.22%August 10,283,542 10,125,383 -1.54% 10,073,872 -0.51%September 10,233,133 10,105,093 -1.25% 10,102,589 -0.02%October 10,242,389 10,136,956 -1.03% 10,071,541 -0.65%November 10,227,050 10,120,293 -1.04% 10,053,542 -0.66%December 10,184,527 10,120,690 -0.63% 10,035,998 -0.84%January 10,144,487 10,151,275 0.07% 10,043,347 -1.06%February 10,133,135 10,140,604 0.07% 10,065,488 -0.74%March 10,100,521 10,138,569 0.38% 9,678,867 -4.53%April 10,123,602 10,140,301 0.16% 8,840,630 -12.82%
Average Weekday Passengers 2017-2018 2018-2019 % Change 2019-2020 % ChangeMay 417,065 419,462 0.57% 408,562 -2.60%June 396,805 393,029 -0.95% 373,241 -5.03%July 377,376 377,060 -0.08% 376,848 -0.06%August 369,341 374,172 1.31% 366,361 -2.09%September 412,007 409,993 -0.49% 417,340 1.79%October 416,050 422,384 1.52% 405,778 -3.93%November 405,862 395,161 -2.64% 393,555 -0.41%December 383,636 376,372 -1.89% 360,593 -4.19%January 359,321 371,720 3.45% 375,796 1.10%February 394,753 384,844 -2.51% 388,497 0.95%March 390,793 401,957 2.86% 217,801 -45.81%April 399,312 390,950 -2.09% 4,311 -98.90%
As of June 3, 2020
Master Page # 79 of 108 - Finance C
omm
ittee Meeting 6/24/2020
________________________________________________________________________________

MTA Staten Island Railway
Revenue Passengers 2017-2018 2018-2019 % Change 2019-2020 % ChangeMay 414,213 420,153 1.43% 408,805 -2.70%June 403,043 381,443 -5.36% 347,928 -8.79%July 333,078 331,968 -0.33% 332,218 0.08%August 353,616 340,994 -3.57% 312,876 -8.25%September 401,445 363,488 -9.46% 364,231 0.20%October 449,023 443,826 -1.16% 403,075 -9.18%November 419,045 386,701 -7.72% 339,080 -12.31%December 372,172 356,308 -4.26% 336,326 -5.61%January 390,355 381,600 -2.24% 364,444 -4.50%February 340,527 318,372 -6.51% 321,294 0.92%March 389,114 378,259 -2.79% 200,586 -46.97%April 377,531 377,719 0.05% 19,674 -94.79%Year-to-Date 1,497,527 1,455,950 -2.78% 905,998 -37.77%
12 Month Averages 2017-2018 2018-2019 % Change 2019-2020 % ChangeMay 377,268 387,425 2.69% 372,457 -3.86%June 377,343 385,625 2.19% 369,664 -4.14%July 377,816 385,533 2.04% 369,685 -4.11%August 378,268 384,481 1.64% 367,342 -4.46%September 377,995 381,318 0.88% 367,404 -3.65%October 382,057 380,885 -0.31% 364,008 -4.43%November 384,056 378,189 -1.53% 360,039 -4.80%December 383,706 376,867 -1.78% 358,374 -4.91%January 384,626 376,138 -2.21% 356,944 -5.10%February 385,655 374,292 -2.95% 357,188 -4.57%March 384,911 373,387 -2.99% 342,382 -8.30%April 386,930 373,403 -3.50% 312,545 -16.30%
Average Weekday Passengers 2017-2018 2018-2019 % Change 2019-2020 % ChangeMay 17,185 17,399 1.24% 16,779 -3.56%June 16,675 16,213 -2.77% 15,914 -1.84%July 14,161 13,786 -2.64% 13,757 -0.21%August 13,787 13,382 -2.94% 13,226 -1.17%September 17,744 17,089 -3.69% 17,810 4.22%October 18,590 17,847 -4.00% 17,309 -3.01%November 18,097 17,020 -5.95% 16,582 -2.57%December 16,611 15,600 -6.09% 15,119 -3.08%January 16,387 16,270 -0.71% 16,360 0.55%February 16,166 15,575 -3.66% 16,298 4.64%March 15,963 16,281 1.99% 8,574 -47.34%April 16,226 15,726 -3.08% 764 -95.14%
As of June 3, 2020
Master Page # 80 of 108 - Finance C
omm
ittee Meeting 6/24/2020
________________________________________________________________________________

MTA Long Island Rail Road
Revenue Passengers 2017-2018 2018-2019 % Change 2019-2020 % ChangeMay 7,642,164 7,716,073 0.97% 7,974,945 3.35%June 7,943,275 7,940,642 -0.03% 7,736,345 -2.57%July 7,455,744 7,752,358 3.98% 7,990,885 3.08%August 7,816,201 7,858,108 0.54% 7,921,403 0.81%September 7,413,822 7,227,262 -2.52% 7,540,043 4.33%October 7,818,376 8,172,734 4.53% 8,108,240 -0.79%November 7,376,934 7,477,649 1.37% 7,215,882 -3.50%December 7,329,341 7,589,318 3.55% 7,667,200 1.03%January 6,882,948 7,166,693 4.12% 7,171,719 0.07%February 6,476,251 6,544,351 1.05% 6,640,007 1.46%March 7,412,001 7,515,113 1.39% 3,274,069 -56.43%April 7,267,217 7,724,038 6.29% 253,571 -96.72%Year-to-Date 28,038,416 28,950,194 3.25% 17,339,366 -40.11%
12 Month Averages 2017-2018 2018-2019 % Change 2019-2020 % ChangeMay 7,478,916 7,409,015 -0.93% 7,578,601 2.29%June 7,476,758 7,408,796 -0.91% 7,561,576 2.06%July 7,462,987 7,433,514 -0.39% 7,581,453 1.99%August 7,452,666 7,437,006 -0.21% 7,586,728 2.01%September 7,438,060 7,421,459 -0.22% 7,612,793 2.58%October 7,460,138 7,450,989 -0.12% 7,607,418 2.10%November 7,459,420 7,459,382 -0.00% 7,585,605 1.69%December 7,429,903 7,481,047 0.69% 7,592,095 1.48%January 7,423,616 7,504,692 1.09% 7,592,514 1.17%February 7,419,771 7,510,367 1.22% 7,600,485 1.20%March 7,393,810 7,518,960 1.69% 7,247,065 -3.62%April 7,402,856 7,557,028 2.08% 6,624,526 -12.34%
Average Weekday Passengers 2017-2018 2018-2019 % Change 2019-2020 % ChangeMay 307,067 310,397 1.08% 319,369 2.89%June 317,303 328,561 3.55% 332,647 1.24%July 318,758 319,177 0.13% 316,692 -0.78%August 299,106 301,170 0.69% 312,767 3.85%September 322,174 327,002 1.50% 327,418 0.13%October 313,326 316,919 1.15% 314,314 -0.82%November 322,271 326,138 1.20% 328,359 0.68%December 315,487 324,193 2.76% 315,927 -2.55%January 289,965 302,167 4.21% 302,533 0.12%February 299,493 302,804 1.11% 305,557 0.91%March 298,352 313,393 5.04% 131,992 -57.88%April 303,688 310,439 2.22% 10,320 -96.68%
As of June 3, 2020
Master Page # 81 of 108 - Finance C
omm
ittee Meeting 6/24/2020
________________________________________________________________________________

MTA Metro-North Rail Road
Revenue Passengers 2017-2018 2018-2019 % Change 2019-2020 % ChangeMay 7,464,395 7,549,186 1.14% 7,564,517 0.20%June 7,708,077 7,592,314 -1.50% 7,392,981 -2.63%July 7,244,976 7,414,612 2.34% 7,524,118 1.48%August 7,507,575 7,447,642 -0.80% 7,315,206 -1.78%September 7,082,441 6,941,823 -1.99% 7,144,447 2.92%October 7,747,597 7,888,088 1.81% 7,867,724 -0.26%November 7,267,413 7,218,476 -0.67% 6,946,473 -3.77%December 7,153,981 7,244,445 1.26% 7,262,961 0.26%January 6,768,836 6,844,393 1.12% 6,867,074 0.33%February 6,237,588 6,216,047 -0.35% 6,314,416 1.58%March 7,139,088 7,079,568 -0.83% 2,882,959 -59.28%April 7,110,538 7,461,935 4.94% 448,977 -93.98%Year-to-Date 27,256,050 27,601,943 1.27% 16,513,426 -40.17%
12 Month Averages 2017-2018 2018-2019 % Change 2019-2020 % ChangeMay 7,209,626 7,209,775 0.00% 7,242,822 0.46%June 7,212,001 7,200,128 -0.16% 7,226,211 0.36%July 7,211,998 7,214,264 0.03% 7,235,336 0.29%August 7,217,274 7,209,270 -0.11% 7,224,300 0.21%September 7,201,751 7,197,552 -0.06% 7,241,185 0.61%October 7,227,083 7,209,259 -0.25% 7,239,488 0.42%November 7,229,745 7,205,181 -0.34% 7,216,821 0.16%December 7,207,896 7,212,720 0.07% 7,218,364 0.08%January 7,210,329 7,219,016 0.12% 7,220,254 0.02%February 7,208,854 7,217,221 0.12% 7,228,452 0.16%March 7,194,763 7,212,261 0.24% 6,878,734 -4.62%April 7,202,709 7,241,544 0.54% 6,294,321 -13.08%
Average Weekday Passengers 2017-2018 2018-2019 % Change 2019-2020 % ChangeMay 292,303 295,061 0.94% 294,109 -0.32%June 304,839 306,545 0.56% 304,710 -0.60%July 294,434 295,276 0.29% 291,128 -1.40%August 284,615 282,483 -0.75% 281,258 -0.43%September 294,809 296,476 0.57% 296,246 -0.08%October 302,657 301,176 -0.49% 298,766 -0.80%November 302,697 300,641 -0.68% 294,665 -1.99%December 291,078 293,304 0.76% 286,336 -2.38%January 274,683 276,218 0.56% 275,129 -0.39%February 278,737 276,754 -0.71% 273,584 -1.15%March 280,851 283,972 1.11% 146,085 -48.56%April 289,923 294,868 1.71% 17,880 -93.94%
As of June 3, 2020
Master Page # 82 of 108 - Finance C
omm
ittee Meeting 6/24/2020
________________________________________________________________________________
MTA Metro-North East-of-Hudson
Revenue Passengers 2017-2018 2018-2019 % Change 2019-2020 % ChangeMay 7,323,535 7,406,943 1.14% 7,419,623 0.17%June 7,563,718 7,449,782 -1.51% 7,251,906 -2.66%July 7,111,253 7,271,157 2.25% 7,378,992 1.48%August 7,363,555 7,298,723 -0.88% 7,177,390 -1.66%September 6,953,276 6,812,970 -2.02% 7,010,975 2.91%October 7,610,678 7,737,800 1.67% 7,720,112 -0.23%November 7,134,492 7,083,292 -0.72% 6,817,377 -3.75%December 7,025,175 7,115,092 1.28% 7,130,980 0.22%January 6,638,414 6,714,444 1.15% 6,736,774 0.33%February 6,120,024 6,097,880 -0.36% 6,197,254 1.63%March 6,997,930 6,941,075 -0.81% 2,783,357 -59.90%April 6,978,582 7,319,622 4.89% 434,767 -94.06%Year-to-Date 26,734,950 27,073,021 1.26% 16,152,152 -40.34%
12 Month Averages 2017-2018 2018-2019 % Change 2019-2020 % ChangeMay 7,071,562 7,075,337 0.05% 7,105,122 0.42%June 7,074,674 7,065,842 -0.12% 7,088,632 0.32%July 7,075,828 7,079,167 0.05% 7,097,618 0.26%August 7,082,044 7,073,765 -0.12% 7,087,507 0.19%September 7,067,855 7,062,073 -0.08% 7,104,008 0.59%October 7,091,979 7,072,666 -0.27% 7,102,534 0.42%November 7,094,513 7,068,399 -0.37% 7,080,374 0.17%December 7,073,245 7,075,892 0.04% 7,081,698 0.08%January 7,075,583 7,082,228 0.09% 7,083,559 0.02%February 7,074,353 7,080,383 0.09% 7,091,840 0.16%March 7,060,637 7,075,645 0.21% 6,745,364 -4.67%April 7,068,386 7,104,065 0.50% 6,171,626 -13.13%
Average Weekday Passengers 2017-2018 2018-2019 % Change 2019-2020 % ChangeMay 285,889 288,585 0.94% 287,513 -0.37%June 298,274 299,766 0.50% 297,676 -0.70%July 287,756 288,441 0.24% 284,517 -1.36%August 278,338 275,994 -0.84% 274,990 -0.36%September 288,358 289,713 0.47% 289,580 -0.05%October 296,430 294,628 -0.61% 292,337 -0.78%November 296,048 293,879 -0.73% 287,876 -2.04%December 284,646 286,846 0.77% 280,048 -2.37%January 268,461 270,017 0.58% 268,914 -0.41%February 272,565 270,550 -0.74% 267,433 -1.15%March 274,432 277,384 1.08% 141,556 -48.97%April 283,647 288,396 1.67% 17,234 -94.02%
As of June 3, 2020
Master Page # 83 of 108 - Finance C
omm
ittee Meeting 6/24/2020
________________________________________________________________________________
MTA Metro-North Harlem Line
Revenue Passengers 2017-2018 2018-2019 % Change 2019-2020 % ChangeMay 2,406,553 2,385,749 -0.86% 2,384,975 -0.03%June 2,470,479 2,389,946 -3.26% 2,306,822 -3.48%July 2,288,211 2,304,551 0.71% 2,341,310 1.60%August 2,373,087 2,313,467 -2.51% 2,259,549 -2.33%September 2,277,688 2,178,843 -4.34% 2,251,014 3.31%October 2,493,758 2,499,505 0.23% 2,497,758 -0.07%November 2,329,438 2,283,471 -1.97% 2,201,824 -3.58%December 2,295,482 2,280,113 -0.67% 2,290,563 0.46%January 2,206,702 2,193,301 -0.61% 2,209,020 0.72%February 2,030,072 1,993,046 -1.82% 2,031,200 1.91%March 2,306,324 2,269,246 -1.61% 921,624 -59.39%April 2,272,242 2,377,648 4.64% 162,080 -93.18%Year-to-Date 8,815,340 8,833,241 0.20% 5,323,924 -39.73%
12 Month Averages 2017-2018 2018-2019 % Change 2019-2020 % ChangeMay 2,315,601 2,310,769 -0.21% 2,289,009 -0.94%June 2,318,188 2,304,058 -0.61% 2,282,082 -0.95%July 2,319,093 2,305,420 -0.59% 2,285,146 -0.88%August 2,321,166 2,300,452 -0.89% 2,280,652 -0.86%September 2,316,482 2,292,215 -1.05% 2,286,667 -0.24%October 2,323,996 2,292,693 -1.35% 2,286,521 -0.27%November 2,324,588 2,288,863 -1.54% 2,279,717 -0.40%December 2,317,677 2,287,582 -1.30% 2,280,588 -0.31%January 2,319,150 2,286,465 -1.41% 2,281,898 -0.20%February 2,318,582 2,283,380 -1.52% 2,285,077 0.07%March 2,310,860 2,280,290 -1.32% 2,172,776 -4.71%April 2,312,503 2,289,074 -1.01% 1,988,145 -13.15%
Average Weekday Passengers 2017-2018 2018-2019 % Change 2019-2020 % ChangeMay 94,721 93,972 -0.79% 93,426 -0.58%June 98,262 97,358 -0.92% 96,166 -1.22%July 93,957 92,748 -1.29% 91,477 -1.37%August 90,521 88,413 -2.33% 87,791 -0.70%September 95,366 94,010 -1.42% 94,214 0.22%October 97,945 96,017 -1.97% 95,502 -0.54%November 97,707 95,921 -1.83% 94,355 -1.63%December 94,202 93,368 -0.89% 91,213 -2.31%January 89,982 89,065 -1.02% 89,107 0.05%February 91,261 89,304 -2.14% 88,741 -0.63%March 91,275 91,674 0.44% 46,417 -49.37%April 93,309 94,550 1.33% 6,469 -93.16%
As of June 3, 2020
Master Page # 84 of 108 - Finance C
omm
ittee Meeting 6/24/2020
________________________________________________________________________________

MTA Metro-North Hudson Line
Revenue Passengers 2017-2018 2018-2019 % Change 2019-2020 % ChangeMay 1,459,859 1,505,105 3.10% 1,520,684 1.04%June 1,500,113 1,502,130 0.13% 1,477,997 -1.61%July 1,441,958 1,488,856 3.25% 1,532,186 2.91%August 1,491,491 1,497,490 0.40% 1,503,699 0.41%September 1,405,569 1,406,474 0.06% 1,459,394 3.76%October 1,552,398 1,596,154 2.82% 1,618,125 1.38%November 1,406,098 1,438,493 2.30% 1,385,835 -3.66%December 1,378,250 1,427,547 3.58% 1,430,933 0.24%January 1,297,102 1,333,515 2.81% 1,346,677 0.99%February 1,201,364 1,223,780 1.87% 1,250,484 2.18%March 1,387,849 1,396,017 0.59% 564,119 -59.59%April 1,412,473 1,496,643 5.96% 90,669 -93.94%Year-to-Date 5,298,788 5,449,955 2.85% 3,251,949 -40.33%
12 Month Averages 2017-2018 2018-2019 % Change 2019-2020 % ChangeMay 1,391,298 1,414,981 1.70% 1,443,982 2.05%June 1,394,568 1,415,149 1.48% 1,441,971 1.90%July 1,397,861 1,419,057 1.52% 1,445,582 1.87%August 1,401,964 1,419,557 1.25% 1,446,099 1.87%September 1,402,071 1,419,632 1.25% 1,450,509 2.17%October 1,410,307 1,423,279 0.92% 1,452,340 2.04%November 1,411,262 1,425,978 1.04% 1,447,952 1.54%December 1,408,124 1,430,086 1.56% 1,448,234 1.27%January 1,408,989 1,433,121 1.71% 1,449,331 1.13%February 1,408,563 1,434,989 1.88% 1,451,556 1.15%March 1,407,881 1,435,670 1.97% 1,382,231 -3.72%April 1,411,210 1,442,684 2.23% 1,265,067 -12.31%
Average Weekday Passengers 2017-2018 2018-2019 % Change 2019-2020 % ChangeMay 56,735 58,284 2.73% 58,598 0.54%June 58,857 60,030 1.99% 60,208 0.30%July 57,741 58,534 1.37% 58,597 0.11%August 56,083 56,351 0.48% 57,157 1.43%September 57,773 59,169 2.42% 59,743 0.97%October 59,944 60,349 0.68% 60,759 0.68%November 58,142 59,367 2.11% 58,187 -1.99%December 55,793 57,447 2.96% 56,118 -2.31%January 52,360 53,603 2.37% 53,669 0.12%February 53,458 54,239 1.46% 53,841 -0.73%March 54,318 55,656 2.46% 28,717 -48.40%April 57,126 58,707 2.77% 3,578 -93.90%
As of June 3, 2020
Master Page # 85 of 108 - Finance C
omm
ittee Meeting 6/24/2020
________________________________________________________________________________

MTA Metro-North New Haven Line
Revenue Passengers 2017-2018 2018-2019 % Change 2019-2020 % ChangeMay 3,457,123 3,516,089 1.71% 3,513,964 -0.06%June 3,593,126 3,557,706 -0.99% 3,467,087 -2.55%July 3,381,084 3,477,750 2.86% 3,505,496 0.80%August 3,498,977 3,487,766 -0.32% 3,414,142 -2.11%September 3,270,019 3,227,653 -1.30% 3,300,567 2.26%October 3,564,522 3,642,141 2.18% 3,604,229 -1.04%November 3,398,956 3,361,328 -1.11% 3,229,718 -3.92%December 3,351,443 3,407,432 1.67% 3,409,484 0.06%January 3,134,610 3,187,628 1.69% 3,181,077 -0.21%February 2,888,588 2,881,054 -0.26% 2,915,570 1.20%March 3,303,757 3,275,812 -0.85% 1,297,614 -60.39%April 3,293,867 3,445,331 4.60% 182,018 -94.72%Year-to-Date 12,620,822 12,789,825 1.34% 7,576,279 -40.76%
12 Month Averages 2017-2018 2018-2019 % Change 2019-2020 % ChangeMay 3,364,662 3,349,587 -0.45% 3,372,130 0.67%June 3,361,917 3,346,635 -0.45% 3,364,579 0.54%July 3,358,874 3,354,690 -0.12% 3,366,891 0.36%August 3,358,915 3,353,756 -0.15% 3,360,756 0.21%September 3,349,301 3,350,226 0.03% 3,366,832 0.50%October 3,357,677 3,356,694 -0.03% 3,363,673 0.21%November 3,358,663 3,353,558 -0.15% 3,352,705 -0.03%December 3,347,444 3,358,224 0.32% 3,352,876 -0.16%January 3,347,444 3,362,642 0.45% 3,352,330 -0.31%February 3,347,207 3,362,014 0.44% 3,355,206 -0.20%March 3,341,896 3,359,686 0.53% 3,190,357 -5.04%April 3,344,673 3,372,308 0.83% 2,918,414 -13.46%
Average Weekday Passengers 2017-2018 2018-2019 % Change 2019-2020 % ChangeMay 134,432 136,329 1.41% 135,489 -0.62%June 141,155 142,379 0.87% 141,302 -0.76%July 136,059 137,159 0.81% 134,443 -1.98%August 131,734 131,230 -0.38% 130,041 -0.91%September 135,219 136,534 0.97% 135,623 -0.67%October 138,540 138,262 -0.20% 136,076 -1.58%November 140,199 138,592 -1.15% 135,334 -2.35%December 134,652 136,032 1.02% 132,717 -2.44%January 126,119 127,349 0.98% 126,138 -0.95%February 127,846 127,007 -0.66% 124,851 -1.70%March 128,839 130,054 0.94% 66,422 -48.93%April 133,213 135,139 1.45% 7,187 -94.68%
As of June 3, 2020
Master Page # 86 of 108 - Finance C
omm
ittee Meeting 6/24/2020
________________________________________________________________________________

MTA Metro-North West-of-Hudson
Revenue Passengers 2017-2018 2018-2019 % Change 2019-2020 % ChangeMay 140,860 142,243 0.98% 144,894 1.86%June 144,359 142,532 -1.27% 141,075 -1.02%July 133,723 143,455 7.28% 145,126 1.16%August 144,020 148,919 3.40% 137,816 -7.46%September 129,165 128,853 -0.24% 133,472 3.58%October 136,919 150,288 9.76% 147,612 -1.78%November 132,921 135,184 1.70% 129,096 -4.50%December 128,806 129,353 0.42% 131,981 2.03%January 130,422 129,949 -0.36% 130,300 0.27%February 117,564 118,167 0.51% 117,162 -0.85%March 141,158 138,493 -1.89% 99,602 -28.08%April 131,956 142,313 7.85% 14,210 -90.01%Year-to-Date 521,100 528,922 1.50% 361,274 -31.70%
12 Month Averages 2017-2018 2018-2019 % Change 2019-2020 % ChangeMay 138,064 134,438 -2.63% 137,700 2.43%June 137,327 134,286 -2.21% 137,579 2.45%July 136,170 135,097 -0.79% 137,718 1.94%August 135,230 135,505 0.20% 136,793 0.95%September 133,896 135,479 1.18% 137,178 1.25%October 135,104 136,593 1.10% 136,955 0.26%November 135,233 136,782 1.15% 136,447 -0.24%December 134,652 136,827 1.62% 136,666 -0.12%January 134,746 136,788 1.52% 136,695 -0.07%February 134,502 136,838 1.74% 136,612 -0.17%March 134,126 136,616 1.86% 133,371 -2.38%April 134,323 137,479 2.35% 122,696 -10.75%
Average Weekday Passengers 2017-2018 2018-2019 % Change 2019-2020 % ChangeMay 6,414 6,476 0.97% 6,596 1.85%June 6,565 6,779 3.26% 7,034 3.76%July 6,678 6,835 2.35% 6,611 -3.28%August 6,277 6,489 3.38% 6,268 -3.41%September 6,451 6,763 4.84% 6,666 -1.43%October 6,227 6,548 5.15% 6,429 -1.82%November 6,649 6,762 1.70% 6,789 0.40%December 6,432 6,458 0.40% 6,288 -2.63%January 6,222 6,201 -0.34% 6,215 0.23%February 6,172 6,204 0.52% 6,151 -0.85%March 6,419 6,588 2.63% 4,529 -31.25%April 6,276 6,472 3.12% 646 -90.02%
As of June 3, 2020
Master Page # 87 of 108 - Finance C
omm
ittee Meeting 6/24/2020
________________________________________________________________________________

MTA Metro-North Port Jervis Line
Revenue Passengers 2017-2018 2018-2019 % Change 2019-2020 % ChangeMay 84,459 82,221 -2.65% 85,297 3.74%June 85,413 81,196 -4.94% 82,228 1.27%July 80,558 84,014 4.29% 88,994 5.93%August 86,210 87,725 1.76% 86,334 -1.59%September 78,687 75,815 -3.65% 79,121 4.36%October 85,570 88,977 3.98% 86,807 -2.44%November 78,105 79,372 1.62% 74,909 -5.62%December 75,712 76,092 0.50% 76,628 0.70%January 75,689 75,588 -0.13% 75,406 -0.24%February 68,119 68,805 1.01% 68,166 -0.93%March 79,180 77,829 -1.71% 58,741 -24.53%April 75,632 83,305 10.15% 8,322 -90.01%Year-to-Date 298,620 305,527 2.31% 210,635 -31.06%
12 Month Averages 2017-2018 2018-2019 % Change 2019-2020 % ChangeMay 82,589 79,258 -4.03% 80,335 1.36%June 82,215 78,907 -4.02% 80,421 1.92%July 81,608 79,195 -2.96% 80,836 2.07%August 81,089 79,321 -2.18% 80,720 1.76%September 80,354 79,082 -1.58% 80,995 2.42%October 81,105 79,365 -2.15% 80,814 1.83%November 80,969 79,471 -1.85% 80,442 1.22%December 80,472 79,503 -1.20% 80,487 1.24%January 80,371 79,494 -1.09% 80,472 1.23%February 80,103 79,551 -0.69% 80,419 1.09%March 79,576 79,439 -0.17% 78,828 -0.77%April 79,445 80,078 0.80% 72,579 -9.36%
Average Weekday Passengers 2017-2018 2018-2019 % Change 2019-2020 % ChangeMay 3,847 3,744 -2.68% 3,884 3.74%June 3,885 3,861 -0.62% 4,098 6.14%July 4,022 4,003 -0.47% 4,055 1.30%August 3,758 3,824 1.76% 3,927 2.69%September 3,929 3,977 1.22% 3,951 -0.65%October 3,892 3,878 -0.36% 3,782 -2.48%November 3,907 3,971 1.64% 3,939 -0.81%December 3,780 3,798 0.48% 3,651 -3.87%January 3,613 3,608 -0.14% 3,598 -0.28%February 3,574 3,611 1.04% 3,577 -0.94%March 3,601 3,701 2.78% 2,671 -27.83%April 3,596 3,789 5.37% 378 -90.02%
As of June 3, 2020
Master Page # 88 of 108 - Finance C
omm
ittee Meeting 6/24/2020
________________________________________________________________________________

MTA Metro-North Pascack Valley Line
Revenue Passengers 2017-2018 2018-2019 % Change 2019-2020 % ChangeMay 56,401 60,022 6.42% 59,597 -0.71%June 58,946 61,336 4.05% 58,847 -4.06%July 53,165 59,441 11.80% 56,132 -5.57%August 57,810 61,194 5.85% 51,482 -15.87%September 50,478 53,038 5.07% 54,351 2.48%October 51,349 61,311 19.40% 60,805 -0.83%November 54,816 55,812 1.82% 54,187 -2.91%December 53,094 53,261 0.31% 55,353 3.93%January 54,733 54,361 -0.68% 54,894 0.98%February 49,445 49,362 -0.17% 48,996 -0.74%March 61,978 60,664 -2.12% 40,861 -32.64%April 56,324 59,008 4.77% 5,888 -90.02%Year-to-Date 222,480 223,395 0.41% 150,639 -32.57%
12 Month Averages 2017-2018 2018-2019 % Change 2019-2020 % ChangeMay 55,475 55,180 -0.53% 57,365 3.96%June 55,112 55,379 0.48% 57,158 3.21%July 54,562 55,902 2.46% 56,882 1.75%August 54,141 56,184 3.77% 56,073 -0.20%September 53,542 56,398 5.33% 56,182 -0.38%October 53,999 57,228 5.98% 56,140 -1.90%November 54,263 57,311 5.62% 56,005 -2.28%December 54,179 57,325 5.81% 56,179 -2.00%January 54,375 57,294 5.37% 56,224 -1.87%February 54,399 57,287 5.31% 56,193 -1.91%March 54,550 57,177 4.82% 54,543 -4.61%April 54,878 57,401 4.60% 50,116 -12.69%
Average Weekday Passengers 2017-2018 2018-2019 % Change 2019-2020 % ChangeMay 2,567 2,732 6.43% 2,712 -0.73%June 2,680 2,918 8.88% 2,936 0.62%July 2,656 2,832 6.63% 2,556 -9.75%August 2,519 2,665 5.80% 2,341 -12.16%September 2,522 2,786 10.47% 2,715 -2.55%October 2,335 2,670 14.35% 2,647 -0.86%November 2,742 2,791 1.79% 2,850 2.11%December 2,652 2,660 0.30% 2,637 -0.86%January 2,609 2,593 -0.61% 2,617 0.93%February 2,598 2,593 -0.19% 2,574 -0.73%March 2,818 2,887 2.45% 1,858 -35.64%April 2,680 2,683 0.11% 268 -90.01%
As of June 3, 2020
Master Page # 89 of 108 - Finance C
omm
ittee Meeting 6/24/2020
________________________________________________________________________________

MTA Bridges & Tunnels
Revenue Passengers 2017-2018 2018-2019 % Change 2019-2020 % ChangeMay 26,717,750 28,226,943 5.65% 29,249,471 3.62%June 27,133,265 28,546,822 5.21% 28,792,254 0.86%July 27,530,620 28,561,622 3.74% 28,857,383 1.04%August 28,271,494 29,280,095 3.57% 29,442,733 0.56%September 26,559,138 27,175,132 2.32% 27,785,633 2.25%October 27,068,258 28,301,034 4.55% 28,109,963 -0.68%November 25,955,869 26,584,637 2.42% 26,913,543 1.24%December 25,737,055 26,946,779 4.70% 26,955,736 0.03%January 23,731,837 25,004,686 5.36% 25,368,494 1.45%February 22,742,698 23,532,562 3.47% 24,540,667 4.28%March 25,672,596 27,332,093 6.46% 18,934,837 -30.72%April 26,519,055 27,419,476 3.40% 9,730,391 -64.51%Year-to-Date 98,666,186 103,288,817 4.69% 78,574,389 -23.93%
12 Month Averages 2017-2018 2018-2019 % Change 2019-2020 % ChangeMay 25,532,690 26,262,402 2.86% 27,327,867 4.06%June 25,520,339 26,380,199 3.37% 27,348,320 3.67%July 25,541,238 26,466,116 3.62% 27,372,967 3.43%August 25,595,492 26,550,166 3.73% 27,386,520 3.15%September 25,638,482 26,601,499 3.76% 27,437,395 3.14%October 25,725,634 26,704,230 3.80% 27,421,473 2.69%November 25,794,452 26,756,627 3.73% 27,448,881 2.59%December 25,833,110 26,857,438 3.97% 27,449,628 2.20%January 25,856,375 26,963,508 4.28% 27,479,945 1.92%February 25,949,869 27,029,330 4.16% 27,563,954 1.98%March 26,039,618 27,167,622 4.33% 26,864,183 -1.12%April 26,136,636 27,242,657 4.23% 25,390,092 -6.80%
Average Weekday Passengers 2017-2018 2018-2019 % Change 2019-2020 % ChangeMay 893,394 945,637 5.85% 966,452 2.20%June 922,040 966,001 4.77% 968,921 0.30%July 911,478 942,183 3.37% 947,365 0.55%August 921,318 959,355 4.13% 957,941 -0.15%September 911,981 926,287 1.57% 943,165 1.82%October 895,418 930,095 3.87% 923,527 -0.71%November 894,676 908,936 1.59% 925,033 1.77%December 888,990 913,378 2.74% 897,981 -1.69%January 798,165 855,261 7.15% 862,855 0.89%February 860,306 870,031 1.13% 879,793 1.12%March 833,828 907,709 8.86% 652,651 -28.10%April 900,145 926,113 2.88% 356,124 -61.55%
As of June 3, 2020
Master Page # 90 of 108 - Finance C
omm
ittee Meeting 6/24/2020
________________________________________________________________________________

Fuel Hedge Program
Master Page # 91 of 108 - Finance Committee Meeting 6/24/2020________________________________________________________________________________
Date Gallons Hedged
Percent of Expected Gallons
Purchased
Weighted Average Hedge Price for Each
Month
2019 Adopted Budget (February Plan)
Forecasted Commodity Price
2020 Adopted Budget (February Plan)
Forecasted Commodity Price
June-20 2,942,280 52 2.05 2.19 1.84July-20 2,986,096 48 2.02 2.19 1.84
August-20 3,090,973 51 1.99 2.19 1.84September-20 2,889,700 51 1.95 2.19 1.84
October-20 3,006,631 53 1.92 2.19 1.84November-20 2,718,540 51 1.91 2.19 1.84December-20 2,620,591 53 1.92 2.19 1.84
January-21 2,662,196 50 1.90 2.12 1.82February-21 2,703,685 50 1.87 2.12 1.82
March-21 2,851,182 50 1.81 2.12 1.82April-21 2,763,744 50 1.74 2.12 1.82May-21 2,995,075 50 1.68 2.12 1.82June-21 2,615,109 46 1.66 2.12 1.82July-21 2,617,858 42 1.63 2.12 1.82
August-21 2,257,262 37 1.62 2.12 1.82September-21 1,902,757 33 1.60 2.12 1.82
October-21 1,664,926 29 1.57 2.12 1.82November-21 1,329,597 25 1.51 2.12 1.82December-21 1,032,838 21 1.44 2.12 1.82
January-22 890,622 17 1.37 2.09 1.81February-22 675,759 12 1.26 2.09 1.81
March-22 475,006 8 1.22 2.09 1.81April-22 230,109 4 1.26 2.09 1.81
Current ULSD Hedges
Master Page # 92 of 108 - Finance Committee Meeting 6/24/2020________________________________________________________________________________

Annual Impact as of June 2, 2020
2020 2021 2022
Ultra Low Sulfur DieselCurrent Prices vs. 2020 Adopted Budget $46.013 $37.664 $28.988Impact of Hedge (29.805) (12.954) 0.118
Net Impact: Fav/(Unfav) $16.208 $24.710 $29.106
Compressed Natural GasCurrent Prices vs. 2020 Adopted Budget ($8.368) ($28.073) ($23.348)Impact of Hedge 0.000 0.000 0.000
Net Impact: Fav/(Unfav) ($8.368) ($28.073) ($23.348)
SummaryCurrent Prices vs. 2020 Adopted Budget $37.645 $9.591 $5.640Impact of Hedge (29.805) (12.954) 0.118
Net Impact: Fav/(Unfav) $7.840 ($3.363) $5.758
($ in millions)
Master Page # 93 of 108 - Finance Committee Meeting 6/24/2020________________________________________________________________________________

JUNE 2020 MTA REAL ESTATE
FINANCE COMMITTEE AGENDA ITEMS 1. ACTION ITEMS METROPOLITAN TRANSPORTATION AUTHORITY a. License agreement(s) with Compass Group USA, Inc. to install vending machines
throughout the MTA system
b. Policy governing MTA Real Estate’s leasing and licensing of employee swing room and rest facilities for NYCT employees
MTA NEW YORK CITY TRANSIT c. Lease with K & K Newsstands, Inc. for retail units at the Delancey/Essex St. Station
Complex
MTA LONG ISLAND RAIL ROAD d. Disposition of real property in Richmond Hill, Queens to Alphapointe, Inc. 2. INFORMATION ITEMS a. Emergency permit between National Park Service and NYCT for temporary bus
parking at Floyd Bennet Field in response to COVID-19
Master Page # 94 of 108 - Finance Committee Meeting 6/24/2020________________________________________________________________________________

Legal Name Popular Name Abbreviation New York City Transit Authority The Long Island Rail Road Company Metro-North Commuter Railroad Company Triborough Bridge and Tunnel Authority MTA Construction and Development Company MTA Bus Company
MTA New York City Transit MTA Long Island Rail Road MTA Metro-North Railroad MTA Bridges and Tunnels MTA Construction and Development MTA Bus Company
NYC Transit LIRR MNR MTA B&T MTA C&D MTA Bus
Staten Island Rapid Transit Operating Authority is a subsidiary of the Metropolitan Transportation Authority. Its popular name is MTA Staten Island Railway (abbreviated as SIR). Manhattan and Bronx Surface Transit Operating Authority is a subsidiary of the New York City Transit Authority (abbreviated as MaBSTOA).
Master Page # 95 of 108 - Finance Committee Meeting 6/24/2020________________________________________________________________________________

METROPOLITAN TRANSPORTATION
AUTHORITY
Master Page # 96 of 108 - Finance Committee Meeting 6/24/2020________________________________________________________________________________

Staff Summary
Page 1 of 2 Subject Date LICENSE AGREEMENT(S) WITH COMPASS GROUP USA, INC. TO INSTALL VENDING MACHINES THROUGHOUT MTA SYSTEM
JUNE 24, 2020
Department Vendor Name REAL ESTATE Department Head Name Contract Number JOHN N. LIEBER Department Head Signature Contract Manager Name Project Manager Name Table of Contents Ref. # ARTURO ESPINOZA
Board Action Internal Approvals Order To Date Approval Info Other Order Approval Order Approval
1 Finance Committee 6/24/20 X 1 Legal
2 Board 6/24/20 X 2 Chief Development Officer
3 Chief Financial Officer
AGENCIES: Metropolitan Transportation Authority (“MTA”) and its subsidiary and affiliate agencies
including MTA New York City Transit (“NYCT”), MTA Bus Company (“MTA Bus”), MTA Metro-North Railroad (“Metro-North”), MTA Long Island Rail Road (“LIRR”), and MTA Staten Island Railway (“SIR”).
LICENSEE: Compass Group USA, Inc. (“Compass”)
LOCATIONS: 141 locations (65 public, 74 employee, 2 part-public/part-employee) throughout the MTA system.
ACTIVITY: Installation, operation, repair, replacement and maintenance of vending machines/micro-market concepts.
ACTION REQUESTED: Authorization to enter into one or more related license agreement(s), for each group of Locations by Agency
TERM: Ten (10) years, with one (1) five (5) year option term
TERMINATION: Terminable at will by Licensor upon sixty (60) days’ prior written notice, at no cost
COMPENSATION: (i) The greater of Minimum Annual Guaranteed Rent (“MAG”) set forth in the Canteen (a subsidiary of Compass) table below and 25% of Gross Sales, plus (ii) a percentage of revenue from exclusive branding rights, if any
COMMENTS: A Request for Proposals (“RFP”) was publicly offered in November, 2019, seeking a single operator to provide vending machine services at 141 MTA and MTA agency locations, consisting of approximately 533 vending machines. The RFP required vendors to propose on all locations with each agency bundle containing its own suggested compensation in MAG rent plus a percentage of gross sales and a share of revenue from any negotiated exclusive branding agreements. Two responses were received: one from CC Vending, Inc. and another from Compass Group USA, Inc. The chart set forth below summarizes their proposals:
Master Page # 97 of 108 - Finance Committee Meeting 6/24/2020________________________________________________________________________________
Staff Summary FINANCE COMMITTEE MEETING LICENSE AGREEMENT(S) WITH COMPASS GROUP USA, INC. TO INSTALL VENDING MACHINES THROUGHOUT MTA SYSTEM (Cont’d.) Page 2 of 2
Compass’s financial offer is the highest overall. Over the initial ten (10) year term, Compass’s offer in MAG (plus exclusive branding payments) exceeds CC Vending’s offer by $3,619,506.05. Compass’s offer is an approximate 15-20% increase in MAG realized by the MTA over revenue it received during 2018 and 2019 and is in line with the suggested compensation set forth in the RFP pursuant to a broker’s opinion of value. For certain Metro-North and LIRR locations, a rent credit may be given to defray the cost of electrical installations/connections. If separate license agreements for each MTA agency are prepared, each license agreement will include cross-default provisions. In addition to a standard security deposit, a corporate guarantee will be obtained. Compass Group USA Inc. is a wholly owned subsidiary of Compass Group PLC (formed in 1987), a publicly traded company headquartered in Chertsey, UK comprising the largest food and support services company in the world with annual revenues of over $31 billion worldwide and $20.1 billion (2019) in the U.S. Compass made its entrance to the U.S. market through its acquisition of Canteen, the largest on-demand retail company with the highest concentration of vending machines in the country with over 50,000 accounts spanning across portfolios such as 16 colleges in the CUNY school system, Stony Brook University, St. John’s University, NYC Department of Corrections and NYCT and Metro-North. Compass disclosed in its proposal certain outstanding judgments and pending legal actions and further advised that Canteen is a party to these types of actions in the ordinary course of business. Canteen advised that such actions were neither material nor would preclude Canteen from performing its obligations under a contract with the MTA and its agencies. A due diligence investigation was completed by MTA Real Estate and determined that these outstanding judgments and pending legal actions will have no effect on Compass’s ability to perform its obligations under a contract with the MTA and its agencies. In light of the COVID-19 pandemic and the drastic drop in ridership and in-person workforces at many MTA agency locations, we are exploring with Canteen the possibility of temporarily postponing the payment of the MAG rent until full service has resumed and ridership has returned to more normal levels. Based on the foregoing, MTA Real Estate seeks authorization for MTA, MTA Bus, NYCT, Metro-North, LIRR and SIR to enter into one or more license agreement(s) with Compass Group USA, Inc., on the above-described terms and conditions.
Master Page # 98 of 108 - Finance Committee Meeting 6/24/2020________________________________________________________________________________

Staff Summary
Page 1 of 2
Subject Date POLICY GOVERNING LICENSING AND LEASING OF EMPLOYEE SWING ROOM AND RESTROOM FACILITIES FOR NYCT EMPLOYEES
JUNE 24, 2020
Department Vendor Name REAL ESTATE Department Head Name Contract Number JOHN N. LIEBER Department Head Signature Contract Manager Name Project Manager Name Table of Contents Ref. # MICHAEL DANIELS
Board Action Internal Approvals Order To Date Approval Info Other Order Approval Order Approval
1 Finance Committee 6/24/20 X 1 Legal
2 Board 6/24/20 X 2 Chief Development Officer
3 Chief Financial Officer
AGENCIES: MTA New York City Transit (“NYCT”), MTA Bus Company (“MTA Bus”) and Manhattan
and Bronx Surface Transit Operating Authority (“MaBSTOA”)
LESSORS: Various
LOCATIONS: Throughout the service areas of NYCT bus and subway operations and MTA Bus and MaBSTOA bus operations
ACTIVITY: Amending the policy governing the licensing of space for bus crew restroom facilities to, among other things, include leases and license agreements for swing rooms for bus and subway operators
ACTION REQUESTED: Authorization to amend Board Policy #24 to increase the maximum Compensation, as set forth below, without the need to get further board approval
TERM: Restroom agreements: One year, subject to automatic one year extensions Swing room agreements: Not to exceed 10 years
SPACES: Licensed or leased restrooms and swing rooms, not to exceed 1,500 sq. ft.
COMPENSATION: Restroom agreements: Not to exceed $500.00 per month/$6,000.00 per annum
Swing room agreements: First year not to exceed $7,500.00 per month/$90,000.00 per annum
ANNUAL RENT ESCALATION:
Annual fees/rents escalation not to exceed 5%, starting in the second year
REAL ESTATE TAXES: Proportionate share based on square footage, if applicable
UTILITIES: NYCT, MTA BUS or MaBSTOA responsible for monthly use charges only with no responsibility for installation costs
Master Page # 99 of 108 - Finance Committee Meeting 6/24/2020________________________________________________________________________________

Staff Summary FINANCE COMMITTEE MEETING POLICY GOVERNING LEASING AND LICENSING OF EMPLOYEE SWING ROOM AND REST FACILITIES FOR NYCT EMPLOYEES (Cont’d.) Page 2 of 2
COMMENTS: Swing rooms and restrooms are required, pursuant to collective bargaining agreements (CBA), for use by NYCT, MTA Bus and MaBSTOA bus and subway employees to serve as comfort/relief spaces. These spaces are utilized 7-days a week 365-days per year. This policy will authorize MTA Real Estate to enter into license and lease agreements with private businesses for the use of shared restrooms and swing rooms (retail stores and offices) by NYCT, MTA Bus and MaBSTOA bus and subway employees during work shifts throughout the five boroughs and, due to the increases in market rents since the last amendment to this policy in 2002, this amendment will authorize increases to the Compensation as set forth above. MTA Real Estate, for the benefit of NYCT, MTA Bus and MaBSTOA bus and subway employees, enters into license or lease agreements with private businesses for the use of restrooms and swing rooms throughout the five boroughs. This policy will authorize MTA Real Estate to enter into these agreements under the terms noted above without the need for Committee or Board approval. This policy also requires MTA Real Estate to notify the Board of the terms subsequent to the execution of the agreement. Based on the foregoing, MTA Real Estate requests authorization for NYCT, MTA Bus and MaBSTOA to enter into various agreements with third parties on the above-described terms and conditions.
Master Page # 100 of 108 - Finance Committee Meeting 6/24/2020________________________________________________________________________________

MTA NEW YORK CITY TRANSIT
Master Page # 101 of 108 - Finance Committee Meeting 6/24/2020________________________________________________________________________________

Staff Summary
Page 1 of 2 Subject Date LEASE WITH K & K NEWSSTAND INC FOR RETAIL UNITS AT THE DELANCEY/ESSEX ST. STATION COMPLEX
JUNE 24, 2020
Department Vendor Name REAL ESTATE Department Head Name Contract Number JOHN N. LIEBER Department Head Signature Contract Manager Name Project Manager Name Table of Contents Ref. # RAYMOND SMYTH
Board Action Internal Approvals Order To Date Approval Info Other Order Approval Order Approval
1 Finance Committee 6/24/20 X 1 Legal
2 Board 6/24/20 X 2 Chief Development Officer
3 Chief Financial Officer
AGENCY: MTA New York City Transit (“NYCT”)
LESSEE: K & K Newsstand, Inc.
LOCATION: Delancey/Essex Street Station, New York, New York
ACTIVITY: Operation of three travel/convenience retail units
ACTION REQUESTED: Authorization to enter into three (3) related lease agreements, one for each Space within the Location
TERM: Ten years
SPACES: Three (3) separate units: (1) downtown platform, Sixth Avenue Line: 120 SF; (2) uptown platform, Sixth Avenue Line, 190 SF; and (3) downtown platform, Nassau Loop, 93 SF
COMPENSATION: $66,000 in the aggregate for the first lease year allocated as follows: (1) $26,400 (40% of the aggregate) for the downtown Sixth Avenue platform; (2) $26,400 (40% of the aggregate) for the uptown Sixth Avenue platform; and (3) $13,200 (20% of the aggregate) for the downtown Nassau loop platform, with annual escalations as described below
COMMENTS: The Location was publicly offered pursuant to a Request for Proposals (“RFP”) in October 2019, seeking an operator for a 10 year lease term. The RFP called for demolition and renovation of the space. Two proposals were received which are summarized below:
Proposer Name Present Value at 7% K & K Newsstand, Inc $571,306
Sudhir Patel $251,713 K & K is the current operator of all three units. At a 7% discount, the net present value of the compensation proposed by them is $571,306. In addition, K & K proposes to make at least $200,000 of capital improvements to all Locations. A one-time rent credit will be given to defray the cost of demolition of each Space allocated as follows: (1) $3,500 for the downtown Sixth Avenue platform; (2) $3,500 for the uptown Sixth Avenue platform; and (3) $3,000 for the downtown Nassau Loop platform. In addition, a one-time rent credit will be given toward the Lessee’s cost of construction in an amount equal to the lesser of the actual documented amount of construction costs for all Spaces, or $189,000 (based on
Master Page # 102 of 108 - Finance Committee Meeting 6/24/2020________________________________________________________________________________

Staff Summary FINANCE COMMITTEE MEETING LEASE WITH K & K NEWSSTAND, INC. FOR RETAIL UNITS AT DELANCEY/ESSEX ST. STATION COMPLEX (Cont’d.) Page 2 of 2 a per square foot allowance). K&K’s compensation offer is within the range of the independent valuation received by MTA Real Estate. The compensation schedule is summarized in the table below:
Lease Year
Annual Compensation PSF
(1) Downtown Sixth Av Platform
(2) Uptown Sixth Av Platform
(3) Downtown
Nassau Loop
Platform 1 $66,000.00 $162.16 $26,400.00 $26,400.00 $13,200.00 2 $70,620.00 $173.51 $28,248.00 $28,248.00 $14,124.00 3 $75,563.00 $185.66 $30,225.20 $30,225.20 $15,112.60 4 $80,853.00 $198.66 $32,341.20 $32,341.20 $16,170.60 5 $83,278.00 $204.61 $33,311.20 $33,311.20 $16,655.60 6 $85,777.00 $210.75 $34,310.80 $34,310.80 $17,155.40 7 $88,350.00 $217.08 $35,340.00 $35,340.00 $17,670.00 8 $91,001.00 $223.59 $36,400.40 $36,400.40 $18,200.20 9 $93,731.00 $230.30 $37,492.40 $37,492.40 $18,746.20 10 $96,543.00 $237.21 $38,617.20 $38,617.20 $19,308.60
Background and credit investigations were performed on K & K’s principals who are equal partners. Both individuals have good credit and sufficient financial resources to pay the construction and compensation offered. Separate lease agreements will be prepared for each of the three Spaces. Each lease will include cross-default provisions and each will be prepared in a form approved by MTA Legal. In addition to the standard security deposit, both principals, Messrs. Khan and Huda will provide personal guarantees, with joint and several liability of K & K’s obligations under the lease agreements, prepared in a form approved by MTA Legal. Based on the foregoing, MTA Real Estate requests authorization for NYCT to enter into a lease agreement, prepared in a form approved by MTA Legal, on the above-described terms and conditions.
Master Page # 103 of 108 - Finance Committee Meeting 6/24/2020________________________________________________________________________________
MTA LONG ISLAND RAIL ROAD
Master Page # 104 of 108 - Finance Committee Meeting 6/24/2020________________________________________________________________________________

Staff Summary
Page 1 of 2 Subject Date DISPOSITION OF REAL PROPERTY AND BUILDING IN RICHMOND HILL, QUEENS TO ALPHAPOINTE, INC.
JUNE 24, 2020
Department Vendor Name REAL ESTATE Department Head Name Contract Number JOHN N. LIEBER Department Head Signature Contract Manager Name Project Manager Name Table of Contents Ref. # ANTHONY CAMPBELL
Board Action Internal Approvals Order To Date Approval Info Other Order Approval Order Approval
1 Finance Committee 6/24/20 X 1 Legal
2 Board 6/24/20 X 2 Chief Development Officer
3 Chief Financial Officer
AGENCY: MTA Long Island Rail Road (“LIRR”)
GRANTEE: Alphapointe, Inc (“Grantee”)
LOCATION: Segment of LIRR property along the main line in Queens, New York: Block 9331 Lot 50 (the “Property”)
ACTIVITY: Disposition of real property and a masonry building (the “Building”)
ACTION REQUESTED: Authorization to dispose of real property and the Building thereon
SIZE: ±500 square feet of land including a masonry brick building
COMPENSATION: $20,000.00
COMMENTS: The proposed Grantee currently leases the Property (Parcel 1) together with a nearby non-adjacent unimproved parcel (Parcel 2) from LIRR. The proposed Grantee also owns property located adjacent to the Property (“Grantee’s Adjacent Owned Property”). The lease was entered on November 2, 1967 and has been on an annual renewal basis, (the “Existing Lease”). The Building on the Property is an extension of, and is physically attached to, the Grantee’s main building on Grantee’s Adjacent Owned Property (“Grantee’s Adjacent Owned Building”) and was built by the predecessor-in-interest of Grantee; MTA Real Estate received a request from the Grantee to purchase the Property. Grantee is a 501(c)(3) non-profit organization that serves blind and visually impaired individuals and is the third largest employer of the visually impaired in the United States. MTA Legal has reviewed Grantee’s corporate status and has determined that it is a public entity for purposes of dispositions under the PAL given that (i) Grantee conducts business with the City and State of New York under the New York State Preferred Source Program and (ii) under Sections 396-F and 396-G of the New York General Business law, the protection of blind persons and organizations established to aid blind persons are declared to be a matter of state concern. Pursuant to MTA Real Estate Policies and Procedures, an appraisal was completed by an independent appraiser and the valuation of the Property was determined to be $38,000. After further negotiations, the MTA and Grantee agreed to the above Compensation and to the conveyance itself under the following conditions:
• Transaction will be an “as-is” purchase;
Master Page # 105 of 108 - Finance Committee Meeting 6/24/2020________________________________________________________________________________

Staff Summary FINANCE COMMITTEE MEETING DISPOSITION OF REAL PROPERTY IN RICHMOND HILL, QUEENS TO ALPHAPOINTE, INC. (Cont’d.) Page 2 of 2
• Grantee to complete all due diligence (title search, environmental due diligence) at its cost and assume any required environmental cleanup costs at the Property and will indemnify LIRR and its
affiliates for same; • Grantee will be responsible for repairing all building structural deficiencies subsequent to the sale; • Grantee shall be responsible for any necessary force account costs associated with due diligence work and
building repair; • Grantee must assume the existing scaffolding contract or obtain its own scaffolding upon closing to continue the
protection of the adjacent right of way; and • Ownership of the Property must remain with Grantee (or any public entity successor-in-interest or affiliate that
continues to be part of the above reference Preferred Source Program) or the Property will revert back to the LIRR.
The terms are fair and reasonable and will relieve the LIRR from spending funds to repair the building to prevent any damage to the main line tracks. In addition, due to the small size, the unique location of the Property and the physical attachment of the Building to Grantee’s Adjacent Owned Building, the Property has very little value to any entity other than to the proposed Grantee or the LIRR. Pursuant to PAL section 2897, an explanatory statement is required and will be prepared and filed at least 90 days prior to the disposition. This action is in compliance with SEQRA upon execution of the Environmental Assessment Form by MTA Real Estate. Based on the foregoing, MTA Real Estate requests (i) that the Board make a determination that there is no reasonable alternative to the proposed below market transfer and (ii) authorization for the LIRR to dispose of the Property and Building pursuant to the terms and conditions above.
Master Page # 106 of 108 - Finance Committee Meeting 6/24/2020________________________________________________________________________________

INFORMATION ITEMS
Master Page # 107 of 108 - Finance Committee Meeting 6/24/2020________________________________________________________________________________

Staff Summary
Page 1 of 1 Subject Date TEMPORARY BUS PARKING DURING COVID EMERGENCY-SPECIAL USE PERMIT
JUNE 24, 2020
Department Vendor Name REAL ESTATE Department Head Name Contract Number JOHN N. LIEBER Department Head Signature Contract Manager Name Project Manager Name Table of Contents Ref. # MICHAEL DANIELS
Board Action Internal Approvals Order To Date Approval Info Other Order Approval Order Approval
1 Finance Committee 6/24/20 X 1 Legal
2 Board 6/24/20 X 2 Chief Development Officer
3 Chief Financial Officer
AGENCY: MTA New York City Transit (“NYCT”)
PERMITOR: National Park Service (“NPS”)
LOCATION: Gateway National Recreation Area (“GATE”) portions of the Floyd Bennett Field
ACTIVITY: Parking of buses
TERM: Commencing April 24, 2020 until terminated by both parties
SPACE: Runway #6
COMPENSATION: Waived
COMMENTS: Due to the COVID-19 emergency and the required reduction in bus services, there is a need for a parking lot to stage 160 NYCT buses that are not in service. A pre-designated section at Floyd Bennett Field will be used for the parking of buses from East New York, Flatbush and Fresh Pond Depots. The sole purpose of this permit is for parking; no maintenance will be taking place. The MTA Board, under Real Estate Policy #34, gives MTA Real Estate authorization to acquire property rights, without prior Board approval, in support of MTA capital projects or ongoing operations when it is reasonably estimated that MTA's aggregate obligation to pay compensation or reimbursement to the grantor will be less than $15,000 over the term. MTA Legal approved the permit and all applicable requirements of the State Environmental Quality Review Act (SEQRA) were complied with. The policy also requires MTA Real Estate to notify the Board of the agreement terms subsequent to its execution.
Master Page # 108 of 108 - Finance Committee Meeting 6/24/2020________________________________________________________________________________