committed to growth
TRANSCRIPT

1 1
Committed to Growth
, 2013
Patterson Companies, Inc. June 2014
Cautionary Language Regarding Forward-looking Statements This presentation contains forward-looking statements as defined in the Private Securities Litigation Reform Act of 1995. Forward-looking statements are information of a non-historical nature and are subject to risks and uncertainties that are beyond the Company’s ability to control. The Company cautions shareholders and prospective investors that these risk factors, among others, may cause actual results to differ materially from those indicated by the forward-looking statements. For a detailed explanation of the risk factors, please see the Company’s filings with the Securities and Exchange Commission. Also, forward-looking statements are qualified in their entirety by the cautionary language set forth in the Company's filings with the Securities and Exchange Commission. Non-GAAP Financial Data Note that this presentation references adjusted performance results. Management believes that these adjustments provide enhanced comparability to the historical results or a better representation of the current quarter performance.
2

3 3
Key Investment Considerations • Innovative and industry-leading technology
• Best-in-class after-sales support
• Compelling underlying demographic trends
• Diversified, but complementary business mix
• Key strategic vendor partnerships • Strong cash generation capabilities
3
4 4
Connecting expertise to inspired ideas,
products and services
Creating a relevant, memorable difference in the
lives of our clients and their customers
4 4

5 5
Fiscal 2014 - Year in Review Consolidated sales exceed $4 billion, up nearly 12% from fiscal 2013 Acquired National Veterinary Services (NVS) in August 2013, expanding Veterinary footprint internationally Reinforced technology leadership position with Dental customers, ending the year with more than 15,000 North American CEREC users Strengthened Medical business by realigning unit around core assets Raised dividend and executed on share repurchase plan as part of multi-pronged capital allocation strategy Continued to invest in Information Technology platform, creating efficiencies and streamlining businesses
5

6 6
Our Competitive Advantage
Specialized sales force Decentralized structure Technology Full-service support Key strategic partnerships
6

7 7
Our Market: Fiscal 2014
12%
58%
30%
7
33% Dental market share
21% Veterinary market share
15% Medical market share

Shared Characteristics
Innovation Fragmentation Market breakthroughs Technology Low cost
of goods
8
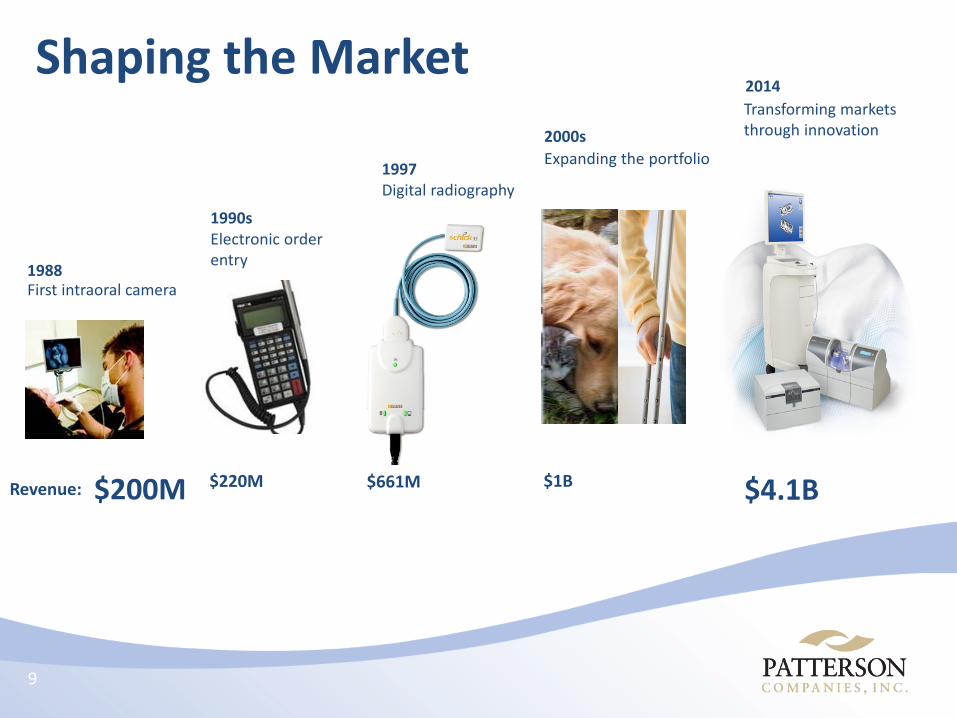
Shaping the Market
1988 First intraoral camera
1990s Electronic order entry
1997 Digital radiography
2000s Expanding the portfolio
2014 Transforming markets through innovation
Revenue: $4.1B $220M $1B $661M $200M
9

Worldwide Demographic Trends
2010
U.S. 40m EU 86m
World 528m
2020
U.S. 53m EU 101m
World 719m
2030
U.S. 70m EU 118m
World 976m
Population Growth: 65+ Age Group
10

11 11
Social Responsibility 11

12 12 Patterson Dental Overview
$2.4 billion annual revenue
12

13
“Number of dentists is not expected to keep up with the nation’s population.”
(National Journal)
65+ Increased need for
dental care
Dental Market Trends
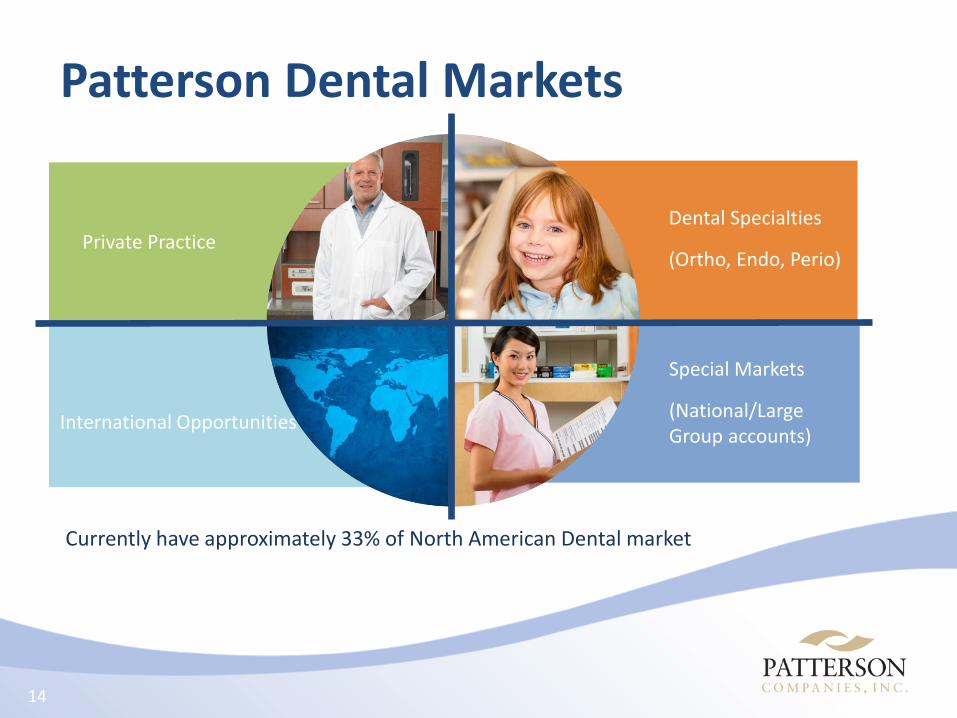
Patterson Dental Markets
Private Practice
International Opportunities
Special Markets
(National/Large Group accounts)
Dental Specialties
(Ortho, Endo, Perio)
Currently have approximately 33% of North American Dental market
14

15 15
World-Class Product Offering
15

16 16
Key Proprietary Products and Strategic Partners
16

17 17 Patterson Veterinary Overview
$1.2 billion annual revenue
17

6% Increase in pet
ownership since 1988 to 62 percent
of U.S. households
(APPA)
$55B Estimated expenditures
by pet owners in 2013, up from $41.2B in 2007
(5% CAGR)
(APPA)
Veterinary Market Trends
18

19 19
Patterson Veterinary Market Size
International Opportunities
Independent Practitioners
Special Markets
(National/Large Group accounts)
Specialties
(Emergency/Hospital)
Currently have approximately 21% of U.S. companion animal market - 42% of UK market
19
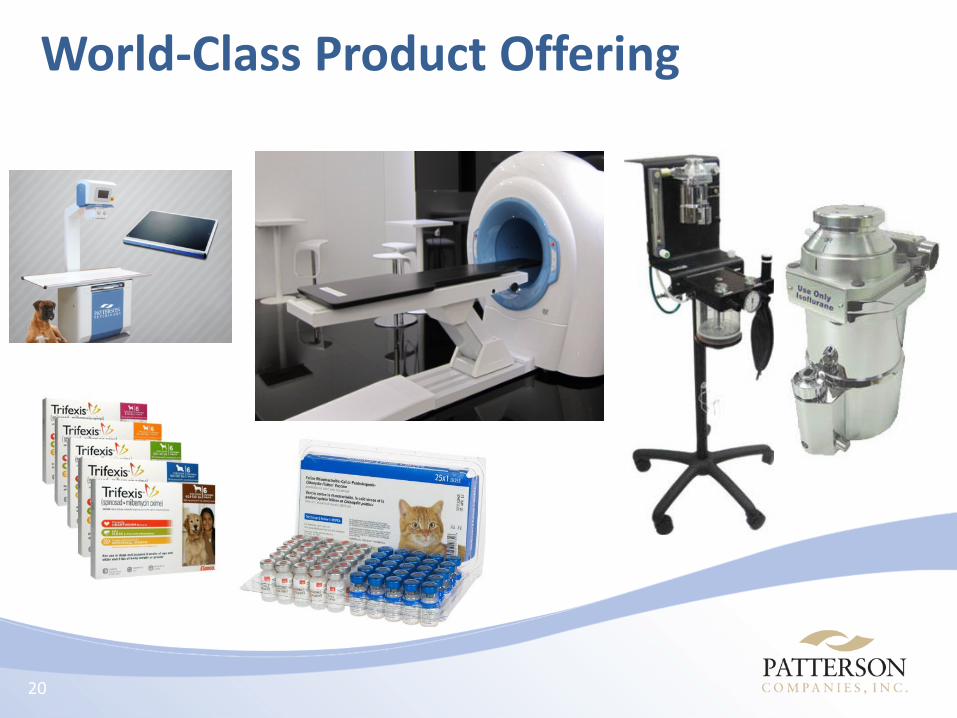
20 20
World-Class Product Offering
20

21 21
Key Strategic Partnerships
21

22 22
Increasing Shareholder Value Through Strategic Acquisitions Acquisition of National Veterinary Services (NVS) from Dechra Pharmaceuticals closed August, 2013 Fiscal 2014 contribution: $419.3 million in sales, $0.04 EPS In the short term:
• Run as stand-alone operation • Leverage value-added products and services
Longer term, opportunities to expand further into Western Europe \
22
23 23 Patterson Medical Overview
$479 million annual revenue
23

73% of seniors want to stay in home as long as possible
(AARP survey)
All demographics living
more active lifestyles
Medical Market Trends
24

25 25
Hospital, IDN Acute Care/Hospital
Rehabilitation products and services at nursing home facilities
Long-Term Care
Private and chain Outpatient Clinics
Schools and athletic teams at all levels Sports Medicine
International Opportunities
25
Patterson Medical Core Target Markets
25 Currently have approximately 15% of highly fragmented market

26 26
Clinic Supplies Orthopedic & Splinting
Equipment & Modalities
ADL & Mobility
Vertically integrated to assure quality and continuity of supply
World-Class Product Offering
26

27 27
Vertically integrated to assure quality and continuity of supply
Key Proprietary Products and Strategic Partnerships
27
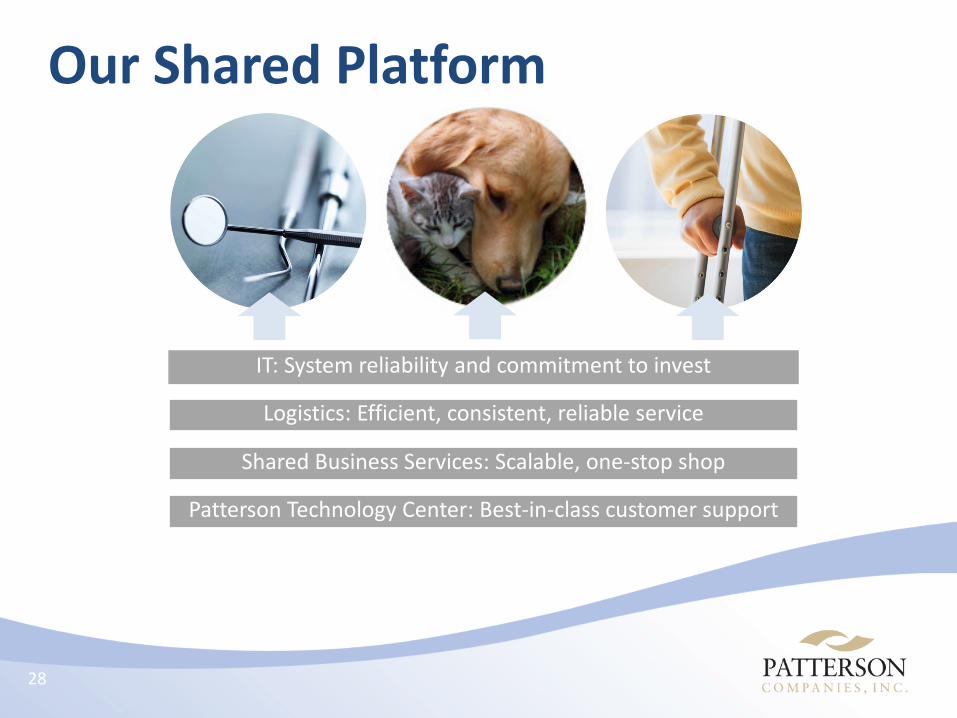
Our Shared Platform
IT: System reliability and commitment to invest
Logistics: Efficient, consistent, reliable service
Shared Business Services: Scalable, one-stop shop
Patterson Technology Center: Best-in-class customer support
28

29 29
How We’ll Grow • Broadened View of the
Markets • Best-in-Class Client Service • Operational Innovation and
Continuous Improvement
29

30 30 Financial Overview

31 31
Financial Platform Strengths • Strong cash flow enables key investments
• One of sector’s most profitable companies
• Multi-pronged capital allocation strategy
• Conservative, well capitalized balance sheet
• Financial flexibility
31

32 32
Cash Use Priorities
Investments to drive
organic growth
Opportunistic acquisitions/ investments
Continuous dividend growth
Share repurchases
32
33 33
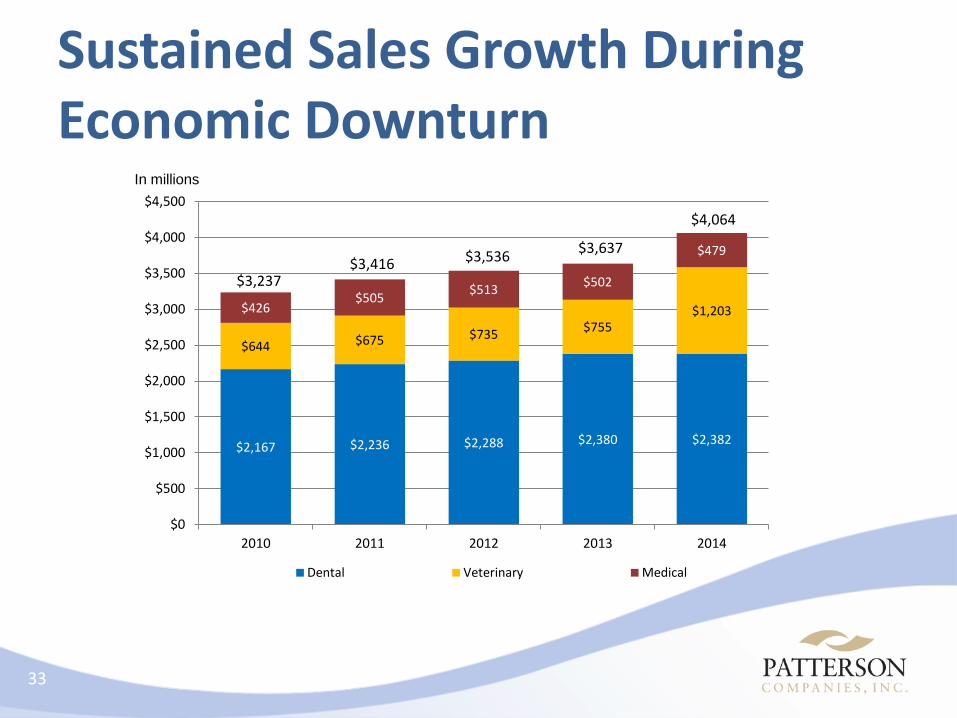
$2,167 $2,236 $2,288 $2,380 $2,382
$644 $675 $735 $755 $1,203 $426
$505 $513 $502
$479
$0
$500
$1,000
$1,500
$2,000
$2,500
$3,000
$3,500
$4,000
$4,500
2010 2011 2012 2013 2014
Dental Veterinary Medical
In millions
$3,237 $3,416 $3,536 $3,637
Sustained Sales Growth During Economic Downturn
33
$4,064
33

34 34
$1.78
$1.89 $1.92
$2.03
$2.10
$1.25
$1.35
$1.45
$1.55
$1.65
$1.75
$1.85
$1.95
$2.05
$2.15
2010 2011 2012 2013 2014
*Diluted EPS
Consistent EPS Growth
34
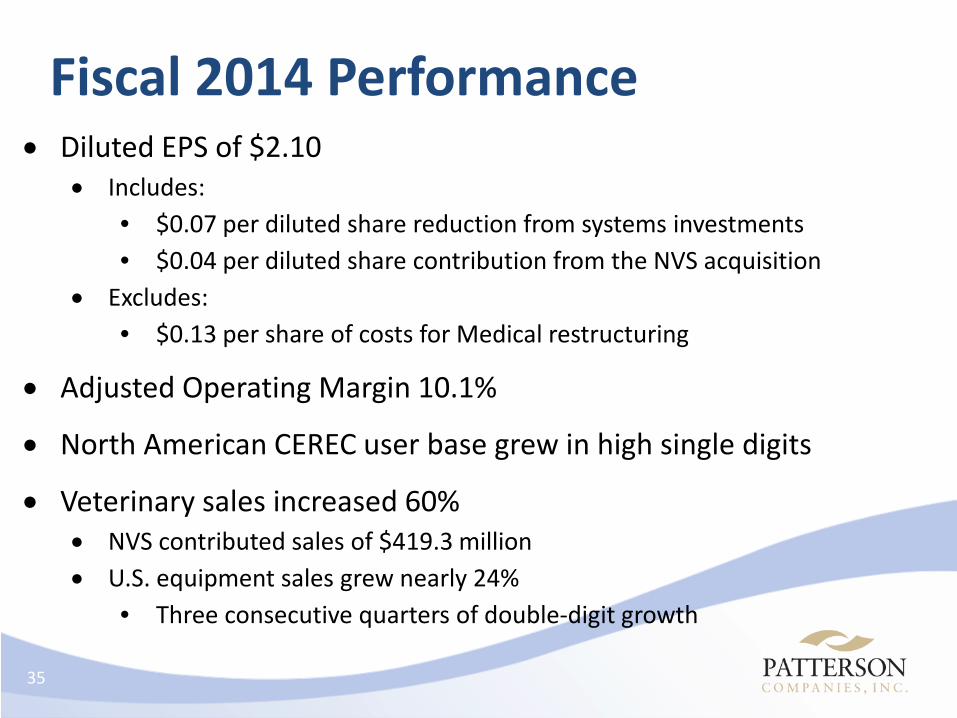
Fiscal 2014 Performance
35
• Diluted EPS of $2.10 • Includes:
• $0.07 per diluted share reduction from systems investments • $0.04 per diluted share contribution from the NVS acquisition
• Excludes: • $0.13 per share of costs for Medical restructuring
• Adjusted Operating Margin 10.1%
• North American CEREC user base grew in high single digits
• Veterinary sales increased 60% • NVS contributed sales of $419.3 million • U.S. equipment sales grew nearly 24%
• Three consecutive quarters of double-digit growth

Fiscal 2015 Guidance
36
EPS: $2.20-$2.30
Guidance assumptions
• Stable North American and international markets, with conditions similar to fiscal 2014
• No impact from share repurchases that may occur during the fiscal year
• The long-term extension of the $250 million of debt that is due in March
• No material acquisitions during the year

5 Year Financial Objectives
8-12% 4-6% 15%
100%
EPS Growth Organic RevenueGrowth
ROIC Free Cash FlowConversion
2015 - 2019
Aggressive, yet realistic targets
37

38 38
Key Investment Considerations • Innovative and industry-leading technology
• Best-in-class after-sales support
• Compelling underlying demographic trends
• Diversified, but complementary business mix
• Key strategic vendor partnerships • Strong cash generation capabilities
38

39 39
Committed to Growth
, 2013
Patterson Companies, Inc. June 2014