commissioning and investigations regarding a low- cost gps
TRANSCRIPT

M. Roman, I. Neuner Commissioning and Investigations regarding a Low-Cost GPS Monitoring System
COMMISSIONING AND INVESTIGATIONS REGARDING A LOW-
COST GPS MONITORING SYSTEM Maria Alexandra ROMAN, PhD Student – UTCB, [email protected] Iohan NEUNER, Prof.PhD.eng.– UTCB, [email protected]
Abstract: Monitoring can be defined as a complex area of activity that covers a wide variety of fields, including today’s different innovative technologies and sensors. An affordable, and yet reliable solution in this activity is the use of low-cost GPS receivers which can provide both code and phase measurements. The system presented in this article is a monitoring system developed on the basis of low-cost, high-sensitivity technology, using solar energy and wireless communications.
Keywords: Monitoring system, low-cost GPS, high-sensitivity antenna, solar panels
1. Introduction and motivation
In a continuously changing and developing world, the monitoring activity occupies a central place in engineering geodesy. Monitoring the kinematics of the Earth’s surface and engineering structures has been an important objective of geodesy. Given this matter, it is necessary to achieve a high temporal or even a continuous coverage of the deformation process.
The Global Positioning System (GPS) is ideally suited for this application: by using two-frequency GPS receivers the positioning accuracy reaches the millimeter level, and thus it represents a very useful tool regarding deformation monitoring. However, the problem in the case of high quality receivers is that there are very expensive.
In the past decade, a special interest has been pointed towards the development and use of low-cost GPS for monitoring or early warning systems, especially in case of landslides and volcanoes. Therefore, research and development projects have been carried out at different Universities or by different Companies, aiming the “improvement of scientific bases, development of new technologies and prototypical implementation of early warning systems” (Baehr 2004).
To achieve a high temporal or even a continuous coverage for the deformation process, a continuous deformation monitoring system has to be developed. At this moment two different types of continuous deformation monitoring systems can be distinguished:
• monitoring systems which are based on the RTK1 survey method; • monitoring systems which are based on a Central Station that is concentrating the raw
code and phase measurements; The monitoring system presented in this article is making use of a “master” station for
centralizing the raw phase data. This type of monitoring systems can be based on low-cost, low-power GPS, and thus the costs for building such systems can be substantial reduced. 1 Real-Time-Kinematic
129

2. Low-Cost GPS Monitoring System
The central idea of this system is that the code and phase raw measurements from the
sensor nodes are sent to the base station in real-time. The Central Station will be set at a known reference location and the rovers, around the area of interest; the communication link between the Central Station and the rovers will be set through a Wireless Ad Hoc Network. The system architecture is presented in the figure 1.
The sensor nodes are based on the use of a CabLynx Wireless Router that has an integrated low-cost U-BLOX GPS receiver. The U-BLOX GPS receiver is able to provide measurements of the L1 carrier phase, C/A code (C1), signal-to-noise (S1) and Doppler (D1) measurements on the L1 frequency. In order to be able to log this information the GPS receiver was configured to send the raw data using U-BLOX Protocol. These measurements are transmitted via radio link, from the rovers to the Central Station and logged in real time; for this purpose, each sensor node is equipped with omni-directional WLAN antennas.
To log the data from all receivers in real time, the central station is connected with a LAN cable to a computer which is running a LabVIEW program that collects the raw data depending on the IP address from which are transmitted. The collected data is then converted from binary format (U-BLOX proprietary format *.ubx) to RINEX format. The post-processing software uses the raw data for ambiguity resolution and baseline computation algorithms.
The power supply is provided through a charge controller that manages the energy from a solar panel and from a 12V back-up car battery; moreover, this smart charge controller is able to switch between the two power sources in case the solar panel does not provide enough energy.
Figure 1: System architecture
“1 Decembrie 1918” University of Alba Iulia RevCAD 14/2013
130
M. Roman, I. Neuner Commissioning and Investigations regarding a Low-Cost GPS Monitoring System
Future developments for this system aim to develop an automated near real time
processing software and implement real time transmission of raw data over the Internet to an analysis center.
2.1 Building and Testing the Wireless Ad Hoc Network (WAHN)
When talking about a WAHN, it can be stated that the network topology is influenced by the way the network is operated. By using three CabLynx Wireless Routers, a Mesh Network was built according to IEEE 802.11s Standard Specifications. This represents a significant advantage since, by making use of Mesh Networks, not all Clients need to have a direct link with the Central Station (master). This being said, the analysis and simulations will focus on static WAHN, using Mesh topology.
When building a WAHN, a special interest has to be pointed to some prior considerations such as cost, coverage, capacity, telecommunications regulations. A structured and well documented planning phase can increase the efficiency in building and using the WAHN.
WHAN hardware and software requirements will be determined according to the dominant factor that must be met: capacity or coverage. Since the WHAN presented in this article contains only three nodes, capacity does not represent a problem, and therefore the dominating factor for this WHAN is coverage.
Hardware components • Wireless routers: CabLynx is a high speed 3G router that contains a WLAN module IEEE
802.11b/g and a GPS receiver - UBLOX LEA-6T. • Omni-directional antennas: For this project, antennas from VIMCOM Company will be
used. • Antenna Cable: VIMCEL HF 50 Low Loss from VIMCOM Company • One PC or Laptop to log the data from the Central Station • One CAT5 RJ45 LAN cable • Mounting bracket from the VIMCOM Company, model number M-919 • Mounting mast tubes with a diameter between 38 and 75 mm • Lighting protectors. Electronics are susceptible to lightning damage, and therefore
lightning protection should be considered especially for outdoor equipment installation. Software requirements • Putty.exe is a Windows SSH client, required for PC/laptop running Windows. • WinSCP is an open source SFTP client and FTP client for Windows. The main function is
the secure file transfer between a local computer and a remote device. • Wireshark is a network protocol analyzer for Linux and Windows. • Tcpdump, a command-line packet analyzer for Windows, and libpcap library, a portable
C/C++ library for network traffic capture for Windows. • Mergecap is an open source program for Linux, which combines multiple capture files
from libpcap, tcpdump, Wireshark or other tools that write captures, into a single output file.
2.2 Configuring and testing the low-cost GPS receiver The next phase is to set up the GPS sensors. This step includes the configuration of the
GPS receiver and accuracy testing. Configuration of the GPS receiver involves setting the protocol and the output messages, in order to receive the GPS raw data. The goal of the field
131

tests that were driven was to test the positioning accuracy, for different distances and observation epochs. To estimate the baseline components, static relative positioning method was used. Hardware components
The CabLynx (shown in figure 2) is a high speed 3G router that contains a GPS sensor board from U-BLOX AG. The LEA-6T is a high-sensitivity GPS module. The default protocol used to send the data is NMEA and the default messages are GGA, GLL, GSA, GSV, RMC and VTG. Raw measurements are available in binary ubx format.
Figure 2: CabLynx router and U-BLOX ANN-MS antenna mounted with metal base plate adapter on pillar
The ANN-MS (shown in figure 2) is a compact, easy to use and high performance
Active Antenna that enables the full capabilities of U-BLOX GPS receivers. Active antennas have an integrated low-noise amplifier and are less sensitive to jamming compared to a passive antenna. However, the U-BLOX ANN-MS antenna is not designed for geodetic application. Giving this matter, the antenna cannot be centralized and fixed on a desired point. For this reason there were built adapters with metal base plate, which allow fixing the antenna on a tripod or on pillar by using forced centering devices. This type of adapter (with metal base plate) was built because it is able to reduce the multipath errors.
2.2.1. Data aggregation As mentioned before, the clients send their GPS data, through mesh network, to the
Central Station. The Central Station concentrates the three data sheets (its own and from the two clients) and sends them through UDP/IP, being connected with LAN to a computer. Using a single port to communicate with the router, the raw data cannot be stored directly in different files.
By programming a procedure that listens to the UDP port, the data from different routers can be separated into different files by questioning the IP address from witch there were sent. For completing this task was used LabVIEW software from National Instruments Company. The interface of the procedure is shown in the figure 3.
Figure 3: procedure programmed using LabVIEW
“1 Decembrie 1918” University of Alba Iulia RevCAD 14/2013
132

M. Roman, I. Neuner Commissioning and Investigations regarding a Low-Cost GPS Monitoring System
2.2.2. Data Handling
In order to process the GPS data with Wa1 software, the ubx format must be converted in
RINEX observation and navigation files. For this purpose was used TEQC software from UNAVCO. TEQC is a powerful and unified approach to solve pre-processing problems with GPS, GLONASS, Galileo and SBAS data and has three main functions, from which TEQC gets its name: translation, editing, and quality check.
2.2.3. Data computation Wa1 is a baseline processing engine developed by Prof. Dr.-Eng. Lambert Wanninger,
from Technical University of Dresden (WaSoft 2011). The software is designed for processing GNSS code and carrier phase observations given in RINEX format. The files may contain single frequency or dual-frequency observations.
After each baseline is processed, a solution file is written. Each coordinate solution is accompanied by its solution type (DGNSS, FloatDGNSS, FixedLW, FixedL1, FixedL2, FixedLN, FixedL0) and, for static solutions, is also given a quality indicator (low, medium, high). The output coordinates of the rover station are computed and given as Cartesian coordinates, as ellipsoidal coordinates and as UTM coordinates.
2.2.4. Testing the low-cost GPS receiver To test the performance and positioning accuracy of the GPS based monitoring
system, several field tests were carried out in the University campus. The tests were made using static positioning method.
The purpose of these tests was analyzing the positioning quality in dependence on observation period and baseline length. To investigate the dependence on the baseline length were measured baselines with length between 111 m (Stadtgarten) and 1129 m (Vaihingen). To investigate the dependence on the observation period, the baselines were observed more than one hour period and then the time period was subdivide into shorter intervals.
The observation files that were obtained from these tests were divided into shorter ones. In this way, there were analyzed files with 10 minutes, 15 minutes and 20 minutes observation period. The purpose of this analysis is to find out the minimum period in which the ambiguities are fixed and a FixedL1 solution is obtained. This information helps in automation of the processing phase. The LabVIEW procedure will be extended to record ubx files of a certain time period and automatically convert them in RINEX format, then process the baselines and provide the baselines components in near real time.
Another set of RINEX files (10 to 60 minutes, from 5 to 5 minutes) were analyzed to investigate the positioning accuracy depending on the observation time.
• Pre-analysis considerations The first step is to analyze the satellite signal and cycle-slip errors for the measurements
made in the sessions mentioned above. These tests were made using two softwares. To have a picture of the satellite signal was used the Leica Geo Office Combined software. Using the GPS-Processing Analysis Tool, graphics for the residuals on L1 frequency were obtained. The information about the number of cycle-slip errors that occurred in each session were obtained using TEQC in Quality Check mode.
Further in this section will be presented satellite signal analysis for the measurements made in the first session in Vaihingen area. It should be pointed out that for this session the location of the Central Station was partially obstructed. Because of this, the satellite signal was influenced, fact that can be seen in figure 4 (a, b and c) and also in the table 1.
133

a) b)
c)
Figure 4: Signal analysis for Session 1, Vaihingen Central Station; b) Client 1; c) Client 2;
Table 1: Cycle-slip errors for Vaihingen Session 1
Total number Total number of Percentage of Router of measurements Cycle-Slip Errors Cycle-Slip Errors
Central Station 33563 1144 3.41% Client 1 45026 429 0.95% Client 2 45147 112 0.25%
• Data processing
When processing the measurements, the Wa1 software “automatically selects appropriate algorithms and models based on the baseline length, observation period, and intermediate results of the data processing” (Wa1 Manual 2010).
The processing parameters that were used to obtain the results are shown below: • single-frequency observations, • elevation mask 10°, • broadcast ephemeris, • antenna phase center corrections applied, • estimation of tropospheric zenith delays, • cycle-slips fixing using triple-difference method for single-frequency observations, • robust least-squares coordinate estimation,
• Data analysis and interpretation The types of solutions that were obtained after processing the measured baselines, as well
as the percentage of fixed ambiguity are presented in the table below. Table 2: Types of Solutions obtained
Solution Type Solution Quality Percentage of Fixed Ambiguity FixedL1 high >95% FixedL1 medium 90% - 95%
FloatDGNSS low 0
“1 Decembrie 1918” University of Alba Iulia RevCAD 14/2013
134
M. Roman, I. Neuner Commissioning and Investigations regarding a Low-Cost GPS Monitoring System
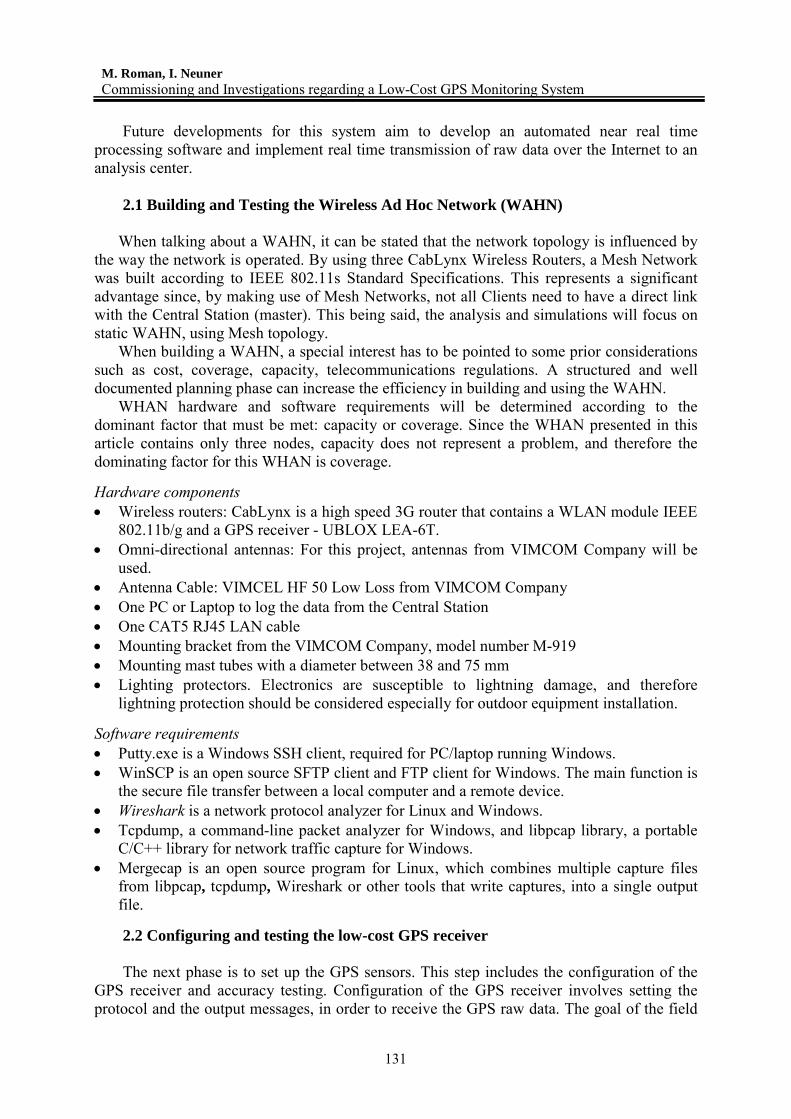
For the field tests that were carried out in Stadtgarten and in Vaihingen, the percentage
of observations with ambiguities fixed, for each baseline, is shown in the figure 5.
Figure 5: The percentage of observations with ambiguities fixed, Vaihingen session 1
As mentioned before in this chapter, the RINEX files have been divided into smaller
time intervals and afterward analyzed. The purpose of this analysis is intended for two directions:
a) On the one hand, we want to find out the minimum period in which the ambiguities are solved and a FixedL1 solution is obtained. b) On the other hand, we want to investigate the positioning accuracy depending on the observation time.
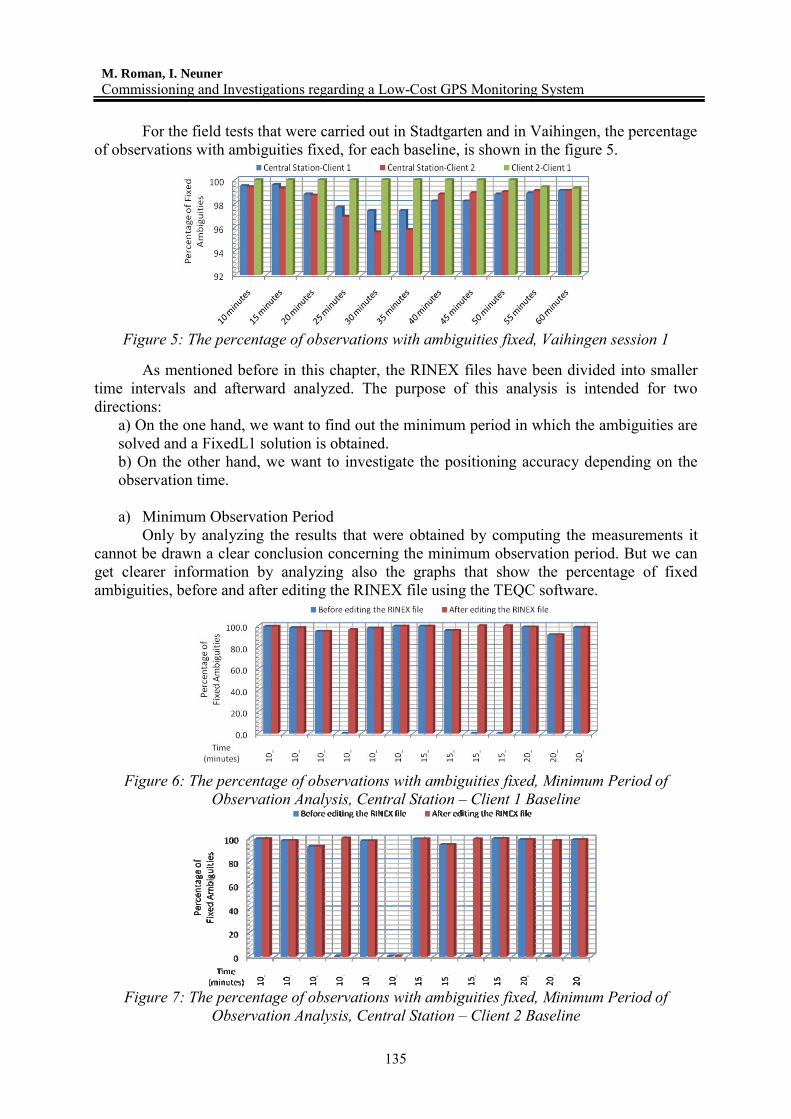
a) Minimum Observation Period
Only by analyzing the results that were obtained by computing the measurements it cannot be drawn a clear conclusion concerning the minimum observation period. But we can get clearer information by analyzing also the graphs that show the percentage of fixed ambiguities, before and after editing the RINEX file using the TEQC software.
Figure 6: The percentage of observations with ambiguities fixed, Minimum Period of
Observation Analysis, Central Station – Client 1 Baseline
Figure 7: The percentage of observations with ambiguities fixed, Minimum Period of
Observation Analysis, Central Station – Client 2 Baseline
135

By analyzing the results obtained by computing the data, together with these charts,
we concluded that the minimum observation period would be 20 minutes. For this observation period were fixed a greater number of ambiguities (more than 95%), without editing the RINEX file; thus this observation period provides more confidence in the obtained results.
b) Time dependent accuracy analysis The results presented in this section are obtained after processing the RINEX files
with the observation period between 10 minutes to 60 minutes (from 5 to 5 minutes). Therefore 10, 15, 20, 25, 30, 35, 40, 45, 50, 55 and 60 minutes data blocks were generated and processed. The graphs below show the standard deviations of each baseline component (northing, easting, height); the values are given in millimeters.
Figure 8: Accuracy in dependence on observation period, Vaihingen Session 1
Central Station – Client 1 Baseline
Figure 9: Accuracy in dependence on observation period, Vaihingen Session 1
Central Station – Client 2 Baseline
For a multipath and shadowing free environment (such as some pillar locations in Vaihingen area) a Fixed solution was obtained for each baseline. Therefore, for these measurements that do not contain multipath or cycle-slip errors, it can be clearly observed that the accuracy improves as the observation period increases.
Nevertheless, the results presented in this section can be further improved. A fact that needs to be remembered is that the U-BLOX ANN-MS antenna is not designed for geodetic application. With respect to this fact, Schwieger (2009) specifies that during the measurements all antennas should have the same orientation, so that the phase center corrections could be properly applied.
“1 Decembrie 1918” University of Alba Iulia RevCAD 14/2013
136

M. Roman, I. Neuner Commissioning and Investigations regarding a Low-Cost GPS Monitoring System
2.3. Power supply unit
The power supply is based on three components: the solar panel, the charge controller
and the back-up battery. The idea of this system (shown in figure 10) is to use a solar panel to generate electricity which will be used at its turn to recharge the back-up battery. However, in order to achieve this, a circuit between the solar panel and the battery has to be employed, to control the rate at which electricity flows from the solar panel into the battery.
Thus, a power supply unit that would enable a sensor network to run off solar and battery power consists of three pieces:
• solar panel to generate electricity; • charge controller to control the rate at which electricity from the solar panel flows into
the battery and the rate at which power flows from the battery to the load (CabLynx router);
• back-up battery to store electricity, so that it can be used by the equipment;
Figure 10: Power Supply Unit
2.3.1. Performance Test
The purpose of this test is to find the battery operating time for this system, which
ought to be known in case the solar panels do not provide enough energy, and the system is powered only by back-up battery.
To determine the operating time for the batteries, two tests were carried out. The first test was conducted indoors. The system was let running using only the
batteries and not the solar panels, and was monitored the operating time. Needless to say, the test was repeated a few times. The conclusion drawn was that one of the batteries may be damaged, because it’s operating time is much shorter, comparing with the operating time for the other battery. This fact is represented in table 3.
Table 3: Batteries operating time Battery No. 1 ≈ 60 – 65 hours Battery No. 2 ≈ 8 – 10 hours
For the second test, the system was let running with solar panels and batteries, and
was carried out on the terrace of the institute building. At the beginning of the test, the batteries were fully charged, and the test lasted approximately 8 hours, in full sunlight. After
137

the test was finished and the system was disconnected, we measured the energy level for the both batteries and we found that both batteries were still fully charged.
3. Conclusion
The objectives of this investigation are two-fold. On the one hand, a time dependent accuracy analysis had to be made, in order to have an
essential evaluation of this technology. For this purpose, RINEX files of 10 to 60 minutes observation time were analyzed. For the measured baselines it was found that the differences within the baseline components are between 1 and 2 cm.
The stability and robustness of this system can be highlighted by analyzing the standard deviation. As shown before, the standard deviation has a millimeter or even a sub-millimeter level, which indicates a high repeatability of the measurements.
On the other hand, considering that the system described is developed for near-real time applications, we have determined the minimum period of observation in which Fixed L1 solutions are obtained for all baselines. It was concluded that the optimal observation period, for data collected at 1 second epoch rate, should be at least 20 minutes. To get higher reliability and accuracy a 30 minutes period would be preferred.
Nevertheless, it must be specified that the result presented in this article can be improved. One way to achieve this would be to perform a new antenna calibration using new adaptors. What is more, during the measurements, the antennas should have the same orientation for these calibration corrections to be applied correctly.
As for the power supply unit, the tests have shown that the system is working perfectly using this energy option.
4. References
1. Faludi, R. (2010): Building Wireless Sensor Networks – A Practical Guide to the
ZigBee Mesh Networking Protocol, United States of America, First Edition, December 2010, ISBN 978 0 596 80773 3
2. Hartinger, H. (2001): Development of a Continuous Deformation Monitoring System using GPS, Dissertation Technical University Graz, June 2001, ISBN 3 8265 9484 3
3. Schwieger, V. (2009): High-Sensitivity GPS - an Availability, Reliability and Accuracy Test. INCT Bulletin des Sciences Geographiques, Institut National de Cartographie e de Teledetection (INCT), Algier, Algerien, No 23, September 2009.
4. U Blox Ag (2010 2): U BLOX 6 Receiver Description Including Protocol Specification, December 9, 2010, Document number GPS.G6 SW 10018,
5. Unavco (2011) A Non Profit Membership Governed Consortium ,Facilitates Geo Science Research and Education Using Geodesy http://www.unavco.org/ (last access May 2011)
6. Wa1 v2.3 (2010): User’s Guide, May 2010
“1 Decembrie 1918” University of Alba Iulia RevCAD 14/2013
138