commission staff working document europe's...
TRANSCRIPT
EN EN
EUROPEAN
COMMISSION
Brussels, 25.5.2016 SWD(2016) 187 final
PART 5/5
COMMISSION STAFF WORKING DOCUMENT
Europe's Digital Progress Report 2016
1
EN
Belgium
1. MEASURES FACILITATING DEPLOYMENT AND INVESTMENTS IN HIGH SPEED
NETWORKS
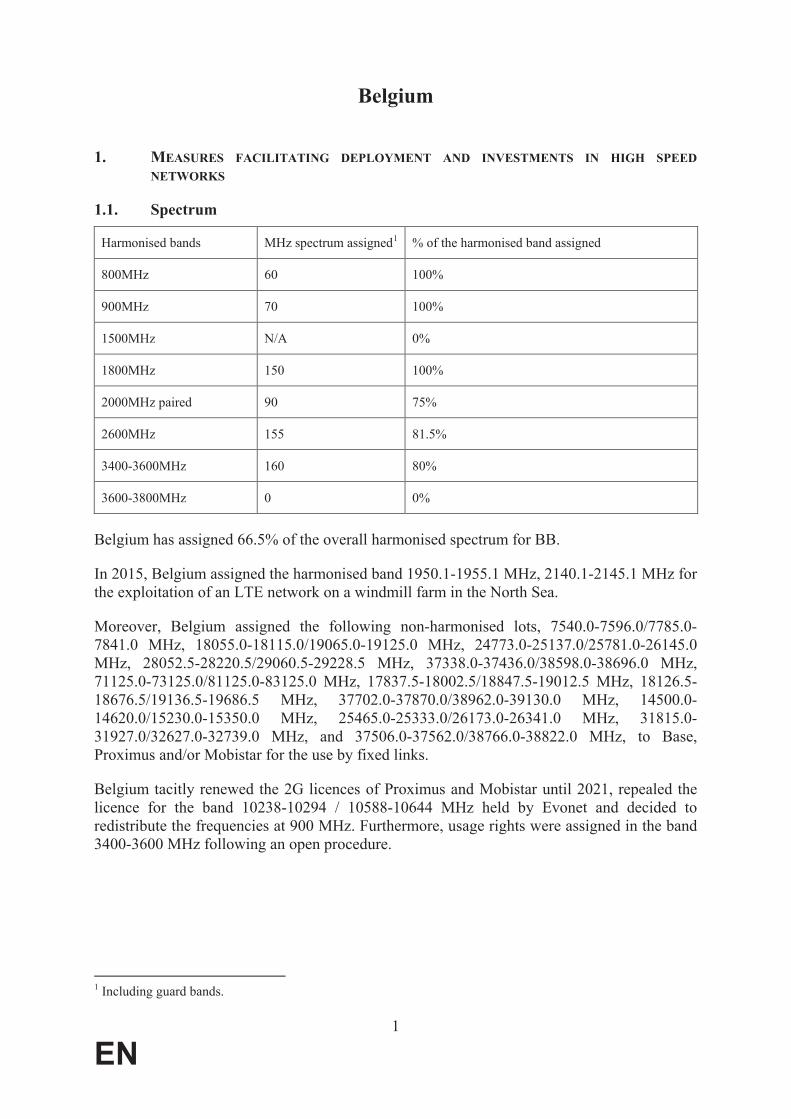
1.1. Spectrum
Harmonised bands MHz spectrum assigned1 % of the harmonised band assigned
800MHz 60 100%
900MHz 70 100%
1500MHz N/A 0%
1800MHz 150 100%
2000MHz paired 90 75%
2600MHz 155 81.5%
3400-3600MHz 160 80%
3600-3800MHz 0 0%
Belgium has assigned 66.5% of the overall harmonised spectrum for BB.
In 2015, Belgium assigned the harmonised band 1950.1-1955.1 MHz, 2140.1-2145.1 MHz for the exploitation of an LTE network on a windmill farm in the North Sea.
Moreover, Belgium assigned the following non-harmonised lots, 7540.0-7596.0/7785.0-7841.0 MHz, 18055.0-18115.0/19065.0-19125.0 MHz, 24773.0-25137.0/25781.0-26145.0 MHz, 28052.5-28220.5/29060.5-29228.5 MHz, 37338.0-37436.0/38598.0-38696.0 MHz, 71125.0-73125.0/81125.0-83125.0 MHz, 17837.5-18002.5/18847.5-19012.5 MHz, 18126.5-18676.5/19136.5-19686.5 MHz, 37702.0-37870.0/38962.0-39130.0 MHz, 14500.0-14620.0/15230.0-15350.0 MHz, 25465.0-25333.0/26173.0-26341.0 MHz, 31815.0-31927.0/32627.0-32739.0 MHz, and 37506.0-37562.0/38766.0-38822.0 MHz, to Base, Proximus and/or Mobistar for the use by fixed links.
Belgium tacitly renewed the 2G licences of Proximus and Mobistar until 2021, repealed the licence for the band 10238-10294 / 10588-10644 MHz held by Evonet and decided to redistribute the frequencies at 900 MHz. Furthermore, usage rights were assigned in the band 3400-3600 MHz following an open procedure.
1 Including guard bands.

2
EN
1.2. State of transposition of the BB CRD (Directive 2014/61/EU)
Even though the debate on the adoption of national legislation to transpose the Directive has been under way for some time, no measures have thus far been adopted or notified to the Commission.
1.3. EU and national investments in broadband
Fixed basic broadband coverage of rural areas is well above the EU average (99.4% vs 90.6%).
The National Broadband Plan of Belgium is a part of a broader policy strategy, namely "Digital Belgium - Plan for Ultrafast Internet in Belgium". This strategy runs from 2015 to 2020 and aims to ensure coverage of 50% with 1 Gbps by 2020 and thus surpassing the DEA targets. Belgium plans to achieve its goal by (1) a common strategic vision of the roll-out of ultrafast internet, (2) broadband for everyone, (3) lower costs of building networks, and (4)dynamic ecosystem.
Belgium intends to establish a 5G framework, which will complement fixed lines and foster IoT connectivity. Furthermore, even though there are no state aid plans available or planned for roll-out, the Belgian Government aims to reduce administrative burdens and costs of deployment of ICT infrastructures.
2. COMPETITIVE LANDSCAPE
Fixed broadband subscriptions - operator market shares2
Incumbent market share New entrants market share
July 2014 July 2015 (EU average) July 2014 July 2015 (EU average)
43.7% 45.6% (40.6%) 56.3% 54.4% (59.4%)
Fixed broadband subscriptions - technology market shares3
DSL (including VDSL) (EU) Cable Modem (EU) FTTH/B (EU) Other4 (EU)
48.8% (69.2%) 50.8% (18.6%) 0.2% (8.7%) 0.2% (3.5%)
There has been a slight increase of the market share of the incumbent from 43.7% in 2014 to 45.6% in 2015. Even though the share of cable has declined with 0.5% to 50.8% in 2015, it is still well over the EU average of 18.6%. The technology means, DSL, FTTH/B and others, remain significantly below the EU average.
Mobile sector5
2 Source: Communications Committee. Data as of July 2014 and July 2015.3 Source: Communications Committee. Data as of July 20154 Including fixed wireless.5 Source: Communications Committee. Data as of October 2015.

3
EN
Number of MNOs Market shares6 of the first 2 MNOs Number of MVNOs (overall share)
3 40% 27% 4 (12,8%)
During 2015 the merger between Liberty Global and Base was announced and subsequently cleared by the European Commission on 4 February 2016.7 One consequence of this clearance under conditions is the acquisition of Mobile Viking and the client base of Jim Mobile by Medialaan.
3. REGULATORY FUNCTION
New entrants` DSL subscriptions by type of access at EU level (VDSL and VULA excluded)8
Own network (EU) Full ULL (EU) Shared Access (EU) Bitstream (EU) Resale (EU)
N/A (0.6%) 11.8% (78.1%) 6.3% (2.3%) 29.1 % (12%) 52.8% (7%)
LLU price: 9.8EUR (EU Average; 9.5EUR)9
In 2015, the BIPT notified remedy amendments to the Commission (including markets 1, 2, 3a, 3b, and 4 of the 2014 Recommendation10).
That same year, the Commission services investigated the delays in renewing the market analyses of six regulated markets for which it had been more than three years since the last analysis had elapsed. These markets were market 1 of the 2014 Recommendation (call termination on public telephone networks at a fixed location), market 2 of the 2014 Recommendation (voice call termination on individual mobile networks), market 3a of the 2014 Recommendation (wholesale physical network infrastructure access at a fixed location), market 3b of the 2014 Recommendation (wholesale broadband access), market 6 of the 2007 Recommendation (call origination on fixed networks) and market 18 of the 2003 Recommendation (broadcasting transmission), all of which were still subject to previously imposed regulatory obligations. Most markets included in the 2003 Recommendation have been deregulated, while regulation remains in place for call origination on fixed networks and access to public telephone networks for residential and non-residential customers under the 2007 Recommendation.
For mobile termination rates, the BIPT has regulated the termination rates on the basis of a pure BU-LRIC cost model, in accordance with the 2009 Recommendation on Termination Rates. However, this is not the case yet for the fixed termination rates, which should be fixed on the basis of a pure BU-LRIC in a decision set for adoption in 2016.
4. CONSUMER ISSUES
The average retail Eurotariff price for roaming is 0.139EUR per minute of calls made and 0.049EUR per minute of calls received (with alternative tariffs more expensive for both calls 6 Excluding M2M.7 IP/16/241, 4.2.2016.8 Source: Communications Committee. Data as of July 2015.9 Full LLU monthly average total cost in EUR; source: Communications Committee. Data as of October 2015.10 Concerning cost of capital and amendments to reference offers.

4
EN
made and received), 0.054EUR per SMS and 0.142EUR per MB, generally close to the EU average, except for data, which is significantly more expensive (EU 0.059EUR per MB)11.
Number portability 2014 2015
Fixed Number of transactions12 219,912 239,441
% of total numbers13 3.7% 4.0%
Maximum wholesale price14 N/A N/A
Maximum time under regulation (number of working days) 15
1 1
Mobile Number of transactions16 820,096 729,073
% of total numbers17 8.2% 5.5%
Maximum wholesale price18 N/A N/A
Maximum time under regulation (number of working days) 19
1 1
With more complex products in the market (double and triple play as well as traffic bundles) becoming increasingly relevant in the market, the perception of transparency and clarity of contracts by consumers is increasingly important. The 2015 Eurobarometer survey shows that 60% of Belgian consumers, a decrease of 4% compared to January 2014, can easily compare bundle offers (EU average 69%). Furthermore, 79% of Belgian consumers think that monitoring and controlling consumption of mobile phones is very easy, which is 1% more than the EU average. This is a higher percentage compared to the 74% replying that monitoring and controlling consumption of fixed phones is very easy (EU average 71%). However, 20% of Belgian consumers are unsatisfied with the information in their communications contract (12% low satisfaction, and 8% no satisfaction). This is higher than the EU average, namely respectively 9% and 7%.
In Belgium, both access to a network at a fixed location and social tariffs20 fall within the scope of the universal service, while comprehensive directories, comprehensive directory enquiry services and public payphones have been excluded since 2013. As of 1 August 2013, no operator has been designated to offer access to a network at a fixed location.
A reform of the universal service provisions is currently being finalized by the Minister. This will take into account the coverage offered by the market on both fixed and mobile networks in Belgium. It will also reflect European jurisprudence determining with regard to social
11 International Roaming BEREC Benchmark Data Report October 2014 – March 2015 BoR(15)134.12 Source: Communications Committee. Data as of January to September 2014 and January to September 2015.13 Source: Communications Committee. Data as of January to September 2014 and January to September 2015.14 Source: Communications Committee. Data as of October 2014 and October 2015.15 Source: Communications Committee. Data as of October 2014 and October 2015.16 Source: Communications Committee. Data as of January to September 2014 and January to September 2015.17 Source: Communications Committee. Data as of January to September 2014 and January to September 2015.18 Source: Communications Committee. Data as of October 2014 and October 2015.19 Source: Communications Committee. Data as of October 2014 and October 2015.20 Mandatory discounts granted by operators with a turnover above EUR50m on the fixed or mobile telephony bill or the Internet bill of certain categories of vulnerable users.
5
EN
tariffs that mobile communication services are not part of the minimum set of universal services defined by the Universal Service Directive:21 While Member States are free to consider them as additional mandatory services, they cannot be financed via sectorial contributions.
21 C-1/14 Base Company NV and Mobistar NV v Ministerraad, judgment of 11.6.2016, ECLI:EU:C:2015:378.
6
EN
Bulgaria
1. MEASURES FACILITATING DEPLOYMENT AND INVESTMENTS IN HIGH SPEED
NETWORKS
1.1. Spectrum
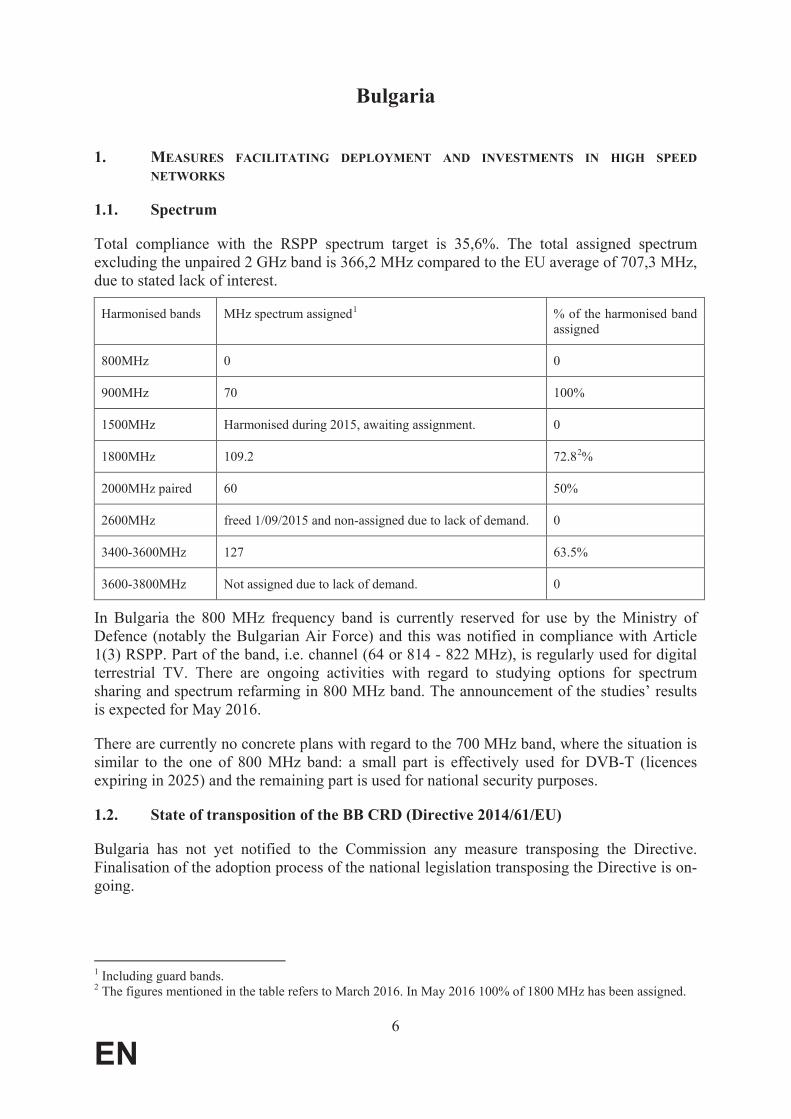
Total compliance with the RSPP spectrum target is 35,6%. The total assigned spectrum excluding the unpaired 2 GHz band is 366,2 MHz compared to the EU average of 707,3 MHz, due to stated lack of interest.
Harmonised bands MHz spectrum assigned1 % of the harmonised band assigned
800MHz 0 0
900MHz 70 100%
1500MHz Harmonised during 2015, awaiting assignment. 0
1800MHz 109.2 72.82%
2000MHz paired 60 50%
2600MHz freed 1/09/2015 and non-assigned due to lack of demand. 0
3400-3600MHz 127 63.5%
3600-3800MHz Not assigned due to lack of demand. 0
In Bulgaria the 800 MHz frequency band is currently reserved for use by the Ministry of Defence (notably the Bulgarian Air Force) and this was notified in compliance with Article 1(3) RSPP. Part of the band, i.e. channel (64 or 814 - 822 MHz), is regularly used for digital terrestrial TV. There are ongoing activities with regard to studying options for spectrum sharing and spectrum refarming in 800 MHz band. The announcement of the studies’ results is expected for May 2016.
There are currently no concrete plans with regard to the 700 MHz band, where the situation is similar to the one of 800 MHz band: a small part is effectively used for DVB-T (licences expiring in 2025) and the remaining part is used for national security purposes.
1.2. State of transposition of the BB CRD (Directive 2014/61/EU)
Bulgaria has not yet notified to the Commission any measure transposing the Directive. Finalisation of the adoption process of the national legislation transposing the Directive is on-going.
1 Including guard bands.2 The figures mentioned in the table refers to March 2016. In May 2016 100% of 1800 MHz has been assigned.

7
EN
1.3. EU and National investments in broadband
The total Fixed basic broadband coverage is 95,2% of housholds and in rural areas it is considerably below the EU average (60% of housholds vs 91%3). Bulgaria’s broadband strategy published in 2014 ("National Broadband Infrastructure Plan for Next Generation Access") sets broadband targets which are in line with the DAE: 100% coverage with 30 Mbps until 2020, and 50% take-up rate for 100 Mbps. Furthermore, Bulgaria aims at 80% take-up rate (100 Mbps) for businesses until 2020. There are no separate regional or municipal broadband plans.
Bulgaria’s broadband plan defines six investment priority areas which reflect its broadband target structure and envisage different measures for “white”, “grey“ and “black areas”. In terms of investments, the Bulgarian NBP states that approximately 234 million BGN will be necessary to invest in white areas, and about 54 million BGN for grey areas. These calculations are based on a certain set of assumptions and the NBP foresees that settlement areas will be treated differently with respect to network deployment technique depending on their population density. A roadmap has been developed in order to implement the NBP effectively. It includes measures and actions for the fulfilment of the "ex-ante conditionality NGN plan" for the use of funding allocated under the European Structural and Investment Funds RDP.
Bulgaria completed in December 2015 the first Next Generation Access broadband co-financed by the European Fund for Regional Development (2007-2013). Bulgaria has also allocated EUR 30 million for the roll-out of further NGA broadband under the European Agricultural Fund for Rural Development (2014-2020). This budget will be used entirely for building the passive NGA broadband infrastructure. It aims at further reducing of construction costs by combining them with the costs of road rehabilitation and other infrastructure projects which are a priority of the operational programs. Thus, the impact of the intended budget would be multiplied several times with the objective to cover most of the costs of connecting all municipalities.
Apart from funding from the European Structural and Investment Funds, small scale national state aid is available in cooperation with local authorities. Public-private partnerships is an integral part of the national strategy. At the end of June 2015, Bulgaria had an NGA broadband coverage (> 30Mbps) rate of 72% of households4, but it only reached 2.7% in rural areas according to the Digital Agenda Scoreboard – which is below the EU average rate of 27,8%. All in all, Bulgaria’s NBP highlights the importance of private investments for countrywide roll-out of high-end ICT infrastructures.
The Connected Communities Initiative5 (CCI), a joint partnership between the European Commission and the World Bank, has been launched to provide technical assistance to the European Broadband project promoters. It should be mentioned that participants from Bulgaria were particularly active and submitted some well advanced projects. While the best projects of Connected Communities are expected to be eligible for funding from Connecting Europe Facility, European Fund for Strategic Investments and possibly other sources of financing, it is very much likely that combining private financing and financial instruments with European, National and Municipal grants will also be necessary.
3 Source: DESI 2016.4 Source: statistics for 2015 as per DESI 2016. According to this source rural areas are not covered in 2015.5 https://ec.europa.eu/digital-single-market/news/connected-communities-initiative
8
EN
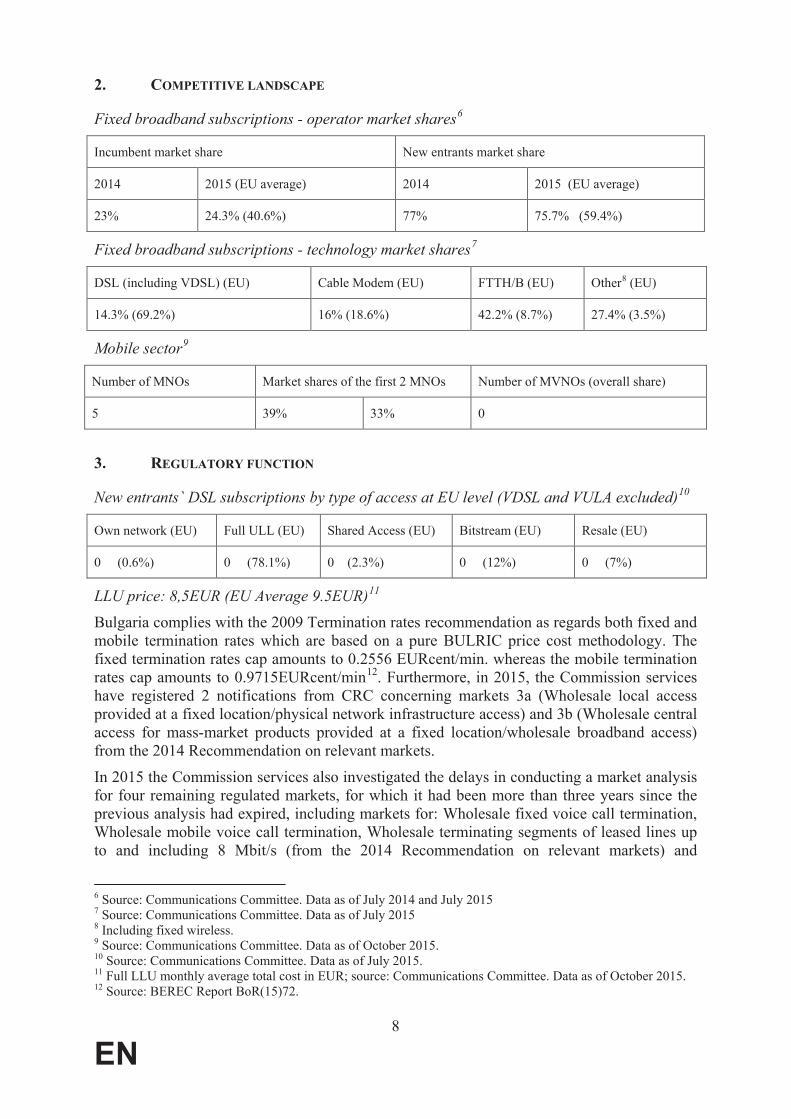
2. COMPETITIVE LANDSCAPE
Fixed broadband subscriptions - operator market shares6
Incumbent market share New entrants market share
2014 2015 (EU average) 2014 2015 (EU average)
23% 24.3% (40.6%) 77% 75.7% (59.4%)
Fixed broadband subscriptions - technology market shares7
DSL (including VDSL) (EU) Cable Modem (EU) FTTH/B (EU) Other8 (EU)
14.3% (69.2%) 16% (18.6%) 42.2% (8.7%) 27.4% (3.5%)
Mobile sector9
Number of MNOs Market shares of the first 2 MNOs Number of MVNOs (overall share)
5 39% 33% 0
3. REGULATORY FUNCTION
New entrants` DSL subscriptions by type of access at EU level (VDSL and VULA excluded)10
Own network (EU) Full ULL (EU) Shared Access (EU) Bitstream (EU) Resale (EU)
0 (0.6%) 0 (78.1%) 0 (2.3%) 0 (12%) 0 (7%)
LLU price: 8,5EUR (EU Average 9.5EUR)11
Bulgaria complies with the 2009 Termination rates recommendation as regards both fixed and mobile termination rates which are based on a pure BULRIC price cost methodology. The fixed termination rates cap amounts to 0.2556 EURcent/min. whereas the mobile termination rates cap amounts to 0.9715EURcent/min12. Furthermore, in 2015, the Commission services have registered 2 notifications from CRC concerning markets 3a (Wholesale local access provided at a fixed location/physical network infrastructure access) and 3b (Wholesale central access for mass-market products provided at a fixed location/wholesale broadband access) from the 2014 Recommendation on relevant markets.
In 2015 the Commission services also investigated the delays in conducting a market analysis for four remaining regulated markets, for which it had been more than three years since the previous analysis had expired, including markets for: Wholesale fixed voice call termination,Wholesale mobile voice call termination, Wholesale terminating segments of leased lines up to and including 8 Mbit/s (from the 2014 Recommendation on relevant markets) and
6 Source: Communications Committee. Data as of July 2014 and July 20157 Source: Communications Committee. Data as of July 20158 Including fixed wireless.9 Source: Communications Committee. Data as of October 2015.10 Source: Communications Committee. Data as of July 2015.11 Full LLU monthly average total cost in EUR; source: Communications Committee. Data as of October 2015. 12 Source: BEREC Report BoR(15)72.

9
EN
Wholesale fixed voice call origination (from the 2007 Recommendation on relevant markets)13. On 27/04/2016 the Bulgarian authorities have notified the Wholesale fixed voice call origination, the Wholesale fixed voice call termination and Wholesale mobile voice call termination markets.
4. CONSUMER ISSUES
The average retail Eurotariff price for roaming is 0,159EUR per minute of calls made and 0,045EUR per minute of calls received (with alternative tariffs respectively cheaper for calls made and more expensive for calls received), 0,055 per SMS and 0,089EUR per MB, generally close to the EU average. In particular for data the prices dropped significantly in the Q3 of 2015, closer to, albeit still above, the EU average (EU 0,059EUR per MB).14
Number portability 2014 2015
Fixed Number of transactions15 64.505 58.859
% of total numbers16 3% 3%
Maximum wholesale price17 9 9
Maximum time under regulation (number of working days)18
2 2
Mobile Number of transactions19 173.051 246.016
% of total numbers20 1.5% 2.2%
Maximum wholesale price21 9 9
Maximum time under regulation (number of working days)22
2 2
With more complex products in the market (double and triple play as well as traffic bundles) becoming increasingly relevant in the market, the perception of transparency and clarity of contracts by consumers is increasingly important. The 2015 Eurobarometer survey shows that Bulgarian consumers can easily compare bundle offers (82%, third in EU), it is easier to monitor consumption for mobile (64%, EU average 69%) than for fixed (57%, EU average 71%), while there is good satisfaction with regard to contract information (12% unsatisfied, EU average 16%)
13 CRC informed the European commission that it plans providing the 4 delayed market analysis by mid-2016.14 International Roaming BEREC Benchmark Data Report April 2015 – September 2015 BoR(16)28.15 Source: Communications Committee. Data as of January to September 2014 and January to September 2015.16 Source: Communications Committee. Data as of January to September 2014 and January to September 2015.17 Source: Communications Committee. Data as of October 2014 and October 2015.18 Source: Communications Committee. Data as of October 2014 and October 2015.19 Source: Communications Committee. Data as of January to September 2014 and January to September 2015.20 Source: Communications Committee. Data as of January to September 2014 and January to September 2015.21 Source: Communications Committee. Data as of October 2014 and October 2015.22 Source: Communications Committee. Data as of October 2014 and October 2015.

10
EN
The scope of the universal service is complete and includes access to a network at a fixed location ensuring dial-up functional internet connection, comprehensive directory services and public payphone. Functional internet is defined as requiring a download speed of 28.8 kbps.
11
EN
Czech Republic
1. MEASURES FACILITATING DEPLOYMENT AND INVESTMENTS IN HIGH SPEED
NETWORKS
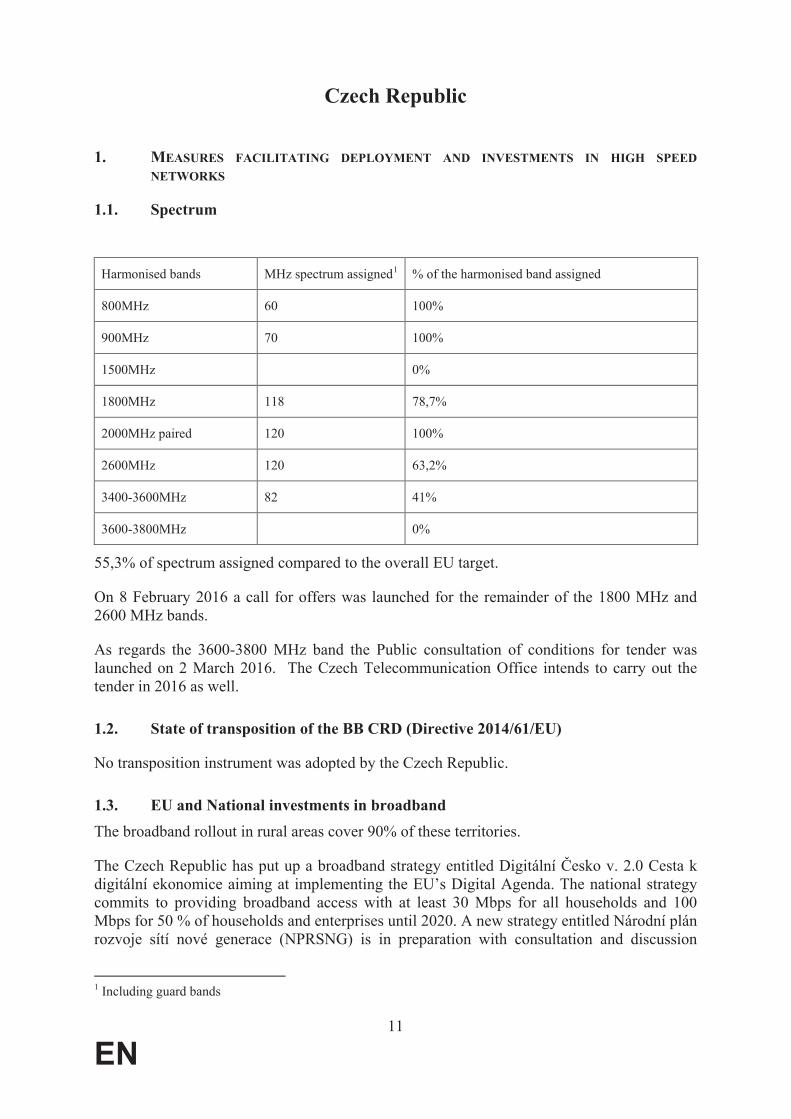
1.1. Spectrum
Harmonised bands MHz spectrum assigned1 % of the harmonised band assigned
800MHz 60 100%
900MHz 70 100%
1500MHz 0%
1800MHz 118 78,7%
2000MHz paired 120 100%
2600MHz 120 63,2%
3400-3600MHz 82 41%
3600-3800MHz 0%
55,3% of spectrum assigned compared to the overall EU target.
On 8 February 2016 a call for offers was launched for the remainder of the 1800 MHz and 2600 MHz bands.
As regards the 3600-3800 MHz band the Public consultation of conditions for tender was launched on 2 March 2016. The Czech Telecommunication Office intends to carry out the tender in 2016 as well.
1.2. State of transposition of the BB CRD (Directive 2014/61/EU)
No transposition instrument was adopted by the Czech Republic.
1.3. EU and National investments in broadband
The broadband rollout in rural areas cover 90% of these territories.
The Czech Republic has put up a brodigitální ekonomice aiming at implementing the EU’s Digital Agenda. The national strategy commits to providing broadband access with at least 30 Mbps for all households and 100 Mbps for 50 % of households and enterprises until 2020. A new strategy entitled Národní plán rozvoje sítí nové generace (NPRSNG) is in preparation with consultation and discussion
1 Including guard bands

12
EN
processes in the Government being in progress. The new strategy is expected to be finished by June 2016 including the addition of up-to-date information from an ongoing collection of geographic data (mapping of white, grey and black areas). The new strategy will also contain an action plan, a timetable and specific tasks for Government authorities.
In the Operational Programme for Enterprise and Innovation for Competitiveness, 521 380 364 EUR (14 billion CZK) was allocated to support NGA roll-out plan, which is in preparation, with call announcement being expected in autumn 2016. This initiative represents the operational programme for gaining financial resources from ESIF. Addressees of the programme are telecommunications providers and other subjects. The financing instrument is expected to allocate subsidies for about 50 % of the costs involved in deploying the passive part of the NGA and backhaul networks (typically optical cabling, splitters, cabinets and their installations). Importantly, financial support can only be directed to the white areas.
2. COMPETITIVE LANDSCAPE
Fixed broadband subscriptions - operator market shares2
Incumbent market share New entrants market share
2014 2015 (EU average) 2014 2015 (EU average)
30,5% 28% (40,6%) 69,5% 72% (59,4%)
Fixed broadband subscriptions - technology market shares3
DSL (including VDSL) (EU) Cable Modem (EU) FTTH/B (EU) Other4 (EU)
33,2% (69,2%) 18,3% (18,6%) 14% (8,7%) 34,5% (3,5%)
Mobile sector5
Number of MNOs Market shares of the first 2 MNOs Number of MVNOs (overall share)
4 41% 33% 3 (6,5%)
of O2 Czech Republic on 1 June 2015 through voluntary legal separation with a view of creating two independent companies providing respectively wholesale and retail electronic communications services.
3. REGULATORY FUNCTION
New entrants` DSL subscriptions by type of access at EU level (VDSL and VULA excluded)6
Own network (EU) Full ULL (EU) Shared Access (EU) Bitstream (EU) Resale (EU)
2 Source: Communications Committee. Data as of July 2014 and July 2015.3 Source: Communications Committee. Data as of July 20154 Including fixed wireless.5 Source: Communications Committee. Data as of October 2015.6 Source: Communications Committee. Data as of July 2015.
13
EN
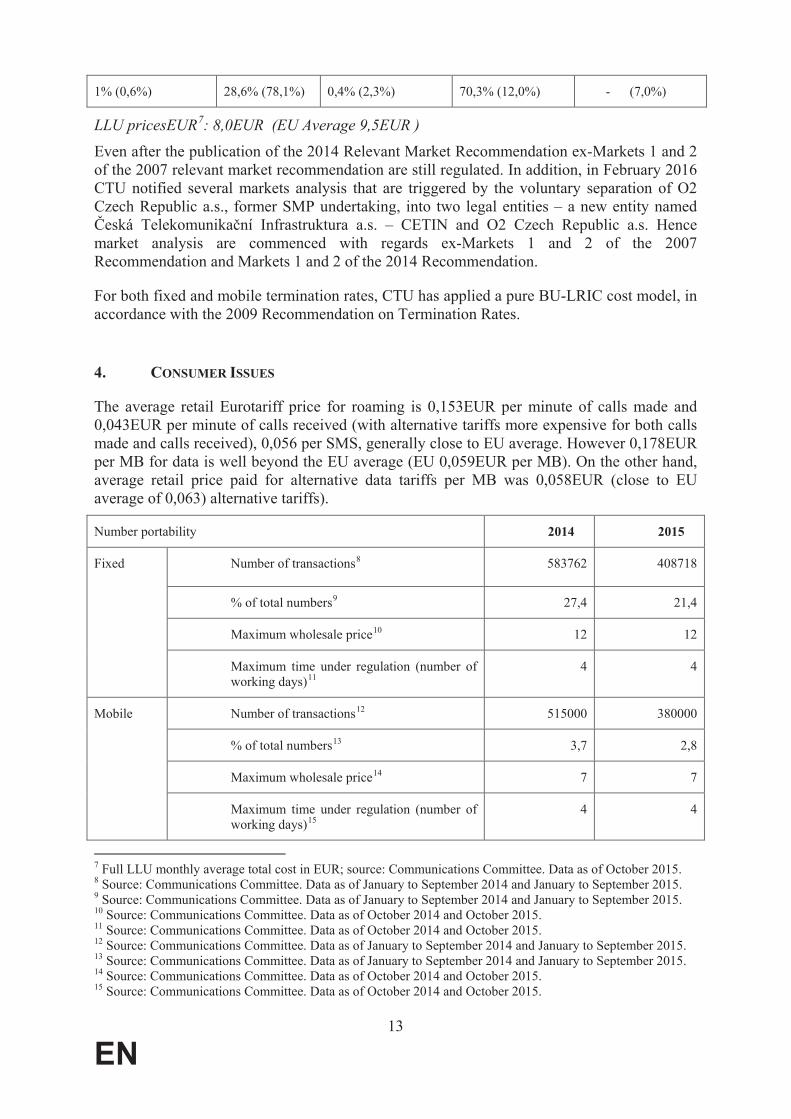
1% (0,6%) 28,6% (78,1%) 0,4% (2,3%) 70,3% (12,0%) - (7,0%)
LLU pricesEUR7: 8,0EUR (EU Average 9,5EUR )
Even after the publication of the 2014 Relevant Market Recommendation ex-Markets 1 and 2 of the 2007 relevant market recommendation are still regulated. In addition, in February 2016 CTU notified several markets analysis that are triggered by the voluntary separation of O2 Czech Republic a.s., former SMP undertaking, into two legal entities – a new entity named
– CETIN and O2 Czech Republic a.s. Hence market analysis are commenced with regards ex-Markets 1 and 2 of the 2007 Recommendation and Markets 1 and 2 of the 2014 Recommendation.
For both fixed and mobile termination rates, CTU has applied a pure BU-LRIC cost model, in accordance with the 2009 Recommendation on Termination Rates.
4. CONSUMER ISSUES
The average retail Eurotariff price for roaming is 0,153EUR per minute of calls made and 0,043EUR per minute of calls received (with alternative tariffs more expensive for both calls made and calls received), 0,056 per SMS, generally close to EU average. However 0,178EURper MB for data is well beyond the EU average (EU 0,059EUR per MB). On the other hand, average retail price paid for alternative data tariffs per MB was 0,058EUR (close to EU average of 0,063) alternative tariffs).
Number portability 2014 2015
Fixed Number of transactions8 583762 408718
% of total numbers9 27,4 21,4
Maximum wholesale price10 12 12
Maximum time under regulation (number of working days)11
4 4
Mobile Number of transactions12 515000 380000
% of total numbers13 3,7 2,8
Maximum wholesale price14 7 7
Maximum time under regulation (number of working days)15
4 4
7 Full LLU monthly average total cost in EUR; source: Communications Committee. Data as of October 2015.8 Source: Communications Committee. Data as of January to September 2014 and January to September 2015.9 Source: Communications Committee. Data as of January to September 2014 and January to September 2015.10 Source: Communications Committee. Data as of October 2014 and October 2015.11 Source: Communications Committee. Data as of October 2014 and October 2015.12 Source: Communications Committee. Data as of January to September 2014 and January to September 2015.13 Source: Communications Committee. Data as of January to September 2014 and January to September 2015.14 Source: Communications Committee. Data as of October 2014 and October 2015.15 Source: Communications Committee. Data as of October 2014 and October 2015.
14
EN
With more complex products in the market (double and triple play as well as traffic bundles) becoming increasingly relevant in the market, the perception of transparency and clarity of contracts by consumers is increasingly important. The 2015 Eurobarometer survey shows 72% of Czech consumers consider that they can easily compare bundle offers (down from 77% in previous 2014 survey), it is easier to monitor consumption for mobile (80%, EUaverage 69%) than for fixed (72%, EU average 71%), while the satisfaction with regard to contract information is equal with the EU average (85% declared high and medium satisfaction)
The following services are included in the scope of universal service in the Czech Republic: provision of public pay phones, access for disabled persons to the publicly available telephone services (PATS) and special tariff plans.

15
EN
Denmark
1. MEASURES FACILITATING DEPLOYMENT AND INVESTMENTS IN HIGH SPEED
NETWORKS
1.1. Spectrum
Harmonised bands MHz spectrum assigned1 % of the harmonised band assigned
800MHz 60 100%
900MHz 70 100%
1500MHz N/A 0%
1800MHz 150 100%
2000MHz paired 120 100%
2600MHz 190 100%
3400-3600MHz 0 0%
3600-3800MHz 56 28%
Denmark has assigned approximately 65% of the overall harmonised spectrum for wireless broadband.
No frequency auctions took place in 2015. In 2016, there will be an 1800 MHz auction regarding the frequency bands 1720.1-1784.9 MHz and 1815.1-1879.9 MHz, where the licences will expire in 2017. Furthermore, all parties in the Danish Parliament reached agreement in February 2015 on refarming the 700 MHz band for mobile use by April 2020.
1.2. State of transposition of the Broadband Cost Reduction Directive (Directive
2014/61/EU)
Denmark has imposed a legal obligation to coordinate civil works by revising the Act on Public Roads, which entered into force on 1 July 2015. An amendment to the Act on Digging Access and Expropriation etc. for Telecommunications Purposes adopted in June 2015 lays down rules on access to and transparency concerning existing physical infrastructure, on access to an access point and in-building physical infrastructure and on high-speed-readiness of buildings. The amendment will enter into force on 1 July 2016 together with a decree measure defining exemptions to the transparency obligations for existing physical infrastructure and to the high-speed-readiness of buildings.
1.3. EU and National investments in broadband
Fixed basic broadband coverage of rural areas is well above the EU average (97% vs 90.6%).
1 Including guard bands.

16
EN
In 2010, the Danish Government mentioned that it aimed for 100% coverage of 100 Mbps download speeds. Upon which the Danish Government introduced the action plan "better broadband and mobile coverage in Denmark". This plan contains 22 initiatives to promote broadband and mobile coverage throughout the country. Moreover, a new aim was added, namely there should be 100% coverage of 30 Mbps upload speeds. This plan surpasses the goals of the DAE.
It should be noted that under Denmark's Growth Plan 2013, the Danish Government has agreed upon a specific infrastructure development initiative for the island of Bornholm by allocating 30 million DKK annually in 2014 and 2015 with the aim to promote high speed broadband. In 2016, the Danish Government further allocated 200 million DKK until 2019 for broadband roll-out in areas across the country with poor coverage.
The focus on the roll-out of high-speed network infrastructure is based on private investment, regional and local actors should focus on coordination and the process with telecommunication operators. Public funding is only reserved for areas with poor broadband coverage.
2. COMPETITIVE LANDSCAPE
Fixed broadband subscriptions - operator market shares2
Incumbent market share New entrants market share
July 2014 July 2015 (EU average) July 2014 July 2015 (EU average)
59.2% 57.0% (40.6%) 40.8% 43.0% (59.4%)
Fixed broadband subscriptions - technology market shares3
DSL (including VDSL) (EU) Cable Modem (EU) FTTH/B (EU) Other4 (EU)
47.7% (69.2%) 28.3 (18.6%) 22.4% (8.7%) 1.7% (3.5%)
There has been a slight decrease of the market share of the incumbent from 59.2% in 2014 to 57.0% in 2015. The share of FTTH/B and the share of cable have increased with, respectively, 1.6% to 22.4% in 2015, and 0.1% to 22.4% in 2015, which is still well above the EU average of, respectively, 8.7% and 18.6%. Other technologies and DSL remain significantly below the EU average.
Mobile sector5
Number of MNOs Market shares of the first 2 MNOs Number of MVNOs (overall share)
5 38% 24% #2 Market share
2 Source: Communications Committee. Data as of July 2014 and July 2015.3 Source: Communications Committee. Data as of July 20154 Including fixed wireless.5 Source: Communications Committee. Data as of October 2015.
17
EN
In 2015, a merger between the second (Telenor) and third (Telia) mobile network operators was notified to the European Commission. The parties abandoned the concentration before the Commission adopted a decision.
3. REGULATORY FUNCTION
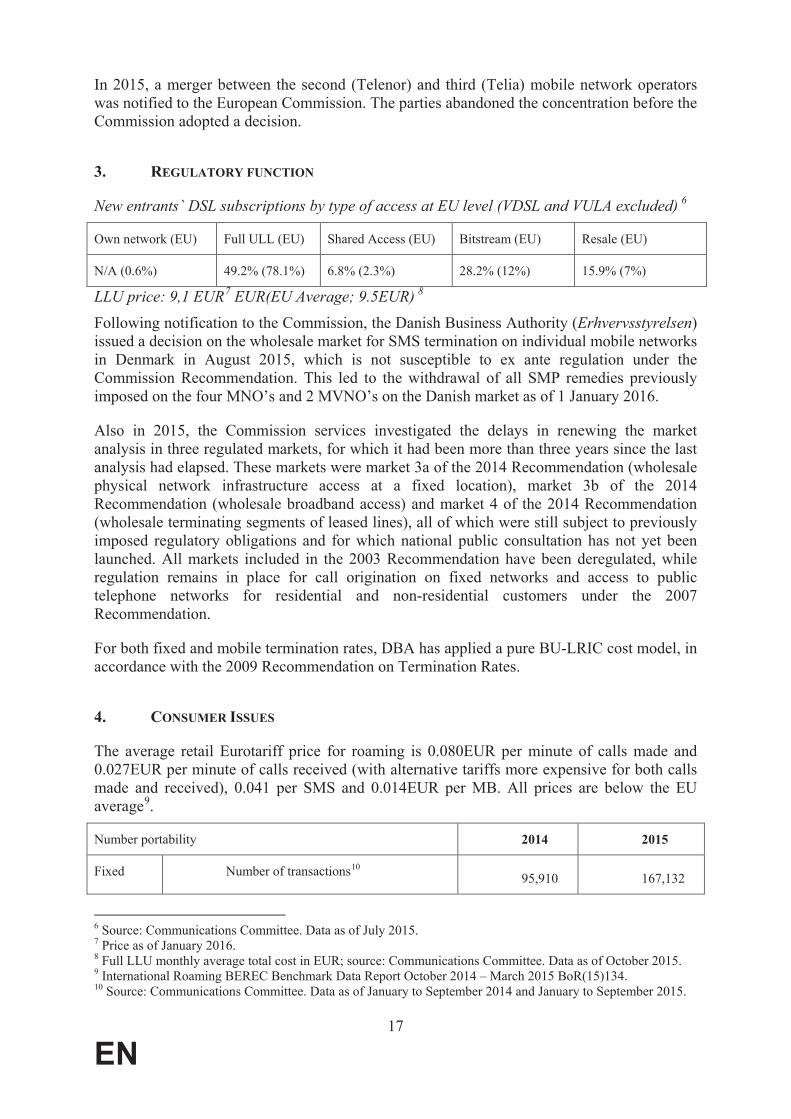
New entrants` DSL subscriptions by type of access at EU level (VDSL and VULA excluded)6
Own network (EU) Full ULL (EU) Shared Access (EU) Bitstream (EU) Resale (EU)
N/A (0.6%) 49.2% (78.1%) 6.8% (2.3%) 28.2% (12%) 15.9% (7%)
LLU price: 9,1 EUR7
EUR(EU Average; 9.5EUR)8
Following notification to the Commission, the Danish Business Authority (Erhvervsstyrelsen)issued a decision on the wholesale market for SMS termination on individual mobile networks in Denmark in August 2015, which is not susceptible to ex ante regulation under the Commission Recommendation. This led to the withdrawal of all SMP remedies previously imposed on the four MNO’s and 2 MVNO’s on the Danish market as of 1 January 2016.
Also in 2015, the Commission services investigated the delays in renewing the market analysis in three regulated markets, for which it had been more than three years since the last analysis had elapsed. These markets were market 3a of the 2014 Recommendation (wholesale physical network infrastructure access at a fixed location), market 3b of the 2014 Recommendation (wholesale broadband access) and market 4 of the 2014 Recommendation (wholesale terminating segments of leased lines), all of which were still subject to previously imposed regulatory obligations and for which national public consultation has not yet been launched. All markets included in the 2003 Recommendation have been deregulated, while regulation remains in place for call origination on fixed networks and access to public telephone networks for residential and non-residential customers under the 2007 Recommendation.
For both fixed and mobile termination rates, DBA has applied a pure BU-LRIC cost model, in accordance with the 2009 Recommendation on Termination Rates.
4. CONSUMER ISSUES
The average retail Eurotariff price for roaming is 0.080EUR per minute of calls made and 0.027EUR per minute of calls received (with alternative tariffs more expensive for both calls made and received), 0.041 per SMS and 0.014EUR per MB. All prices are below the EU average9.
Number portability 2014 2015
Fixed Number of transactions10
95,910 167,132
6 Source: Communications Committee. Data as of July 2015.7 Price as of January 2016.8 Full LLU monthly average total cost in EUR; source: Communications Committee. Data as of October 2015.9 International Roaming BEREC Benchmark Data Report October 2014 – March 2015 BoR(15)134.10 Source: Communications Committee. Data as of January to September 2014 and January to September 2015.

18
EN
% of total numbers11 5.3% 10.3%
Maximum wholesale price12 N/A N/A
Maximum time under regulation (number of working days) 13
1 day N/A
Mobile Number of transactions14 477,105 520,602
% of total numbers15 6.7% 7.2%
Maximum wholesale price16 N/A N/A
Maximum time under regulation (number of working days) 17
1 day N/A
With more complex products in the market (double and triple play as well as traffic bundles) becoming increasingly relevant in the market, the perception of transparency and clarity of contracts by consumers is increasingly important.
The 2015 Eurobarometer survey shows that 31% of Danish consumers, a decrease of 12% compared to January 2014, can easily compare bundle offers (EU average 69%). It should be noted that this is the lowest figure throughout the EU. Furthermore, 72% of Danish consumersthink that monitoring and controlling consumption of mobile phones is very easy, which is 6% less than the EU average. This is a higher percentage compared to the 51% replying that monitoring and controlling consumption of fixed phones is very easy (EU average 71%). Moreover, 24% of Danish consumers are unsatisfied with the information in their communications contract (13% low satisfaction, and 11% no satisfaction). This is higher than the EU average, namely respectively 9% and 7%.
In Denmark, comprehensive directory and related enquiry services are both provided as universal service, as is access to a network at a fixed location ensuring dial-up functional internet connection.
11 Source: Communications Committee. Data as of January to September 2014 and January to September 2015.12 Source: Communications Committee. Data as of October 2014 and October 2015.13 Source: Communications Committee. Data as of October 2014 and October 2015.14 Source: Communications Committee. Data as of January to September 2014 and January to September 2015.15 Source: Communications Committee. Data as of January to September 2014 and January to September 2015.16 Source: Communications Committee. Data as of October 2014 and October 2015.17 Source: Communications Committee. Data as of October 2014 and October 2015.

19
EN
Germany
1. MEASURES FACILITATING DEPLOYMENT AND INVESTMENTS IN HIGH SPEED
NETWORKS
1.1. Spectrum
Harmonised bands MHz spectrum assigned1 % of the harmonised band assigned
800MHz 60 100%
900MHz 70 100%
1500MHz 40 100%
1800MHz 150 100%
2000MHz paired 120 100%
2600MHz 190 100%
3400-3600MHz 200 100%
3600-3800MHz 200 100%
Germany is the only Member State in the EU that has assigned 100% of the overall harmonised spectrum for broadband.
In 2015 Germany assigned 270 MHz in a spectrum auction for mobile broadband for an overall amount of approx. 5,08bnEUR. All three mobile network operators, Telefónica Deutschland GmbH & Co. OHG, Telekom Deutschland GmbH and Vodafone GmbH were successful bidders. Spectrum from the 700 MHz, 900 MHz, 1500 MHz and 1800 MHz bands has been awarded. Target of the German Regulator (Bundesnetzagentur) is to achieve almost complete nationwide provision of the population with broadband internet access – as it is already the case with mobile telephony. For this reason the frequency usage rights include a coverage obligation of 98% of the population and a full coverage for the main transport routes (national motorways and high speed railway lines) as far as it is legally and practically possible2.
1.2. State of transposition of the BB CRD (Directive 2014/61/EU)
Germany has not yet notified to the Commission any measure transposing the Cost Reduction Directive (2014/61/CE). The German Government aims to implement it through different measures to ensure coordination and cooperation between different aspects of infrastructure development. It is planned to transpose the respective provisions to national law in a timely manner. For this purpose, the German Government has already contrived a draft law entitled DigiNetzG. 1 Including guard bands2
http://www.bundesnetzagentur.de/EN/Areas/Telecommunications/Companies/FrequencyManagement/ElectronicCommunicationsServices/MobileBroadbandProject2016/project2016_node.html

20
EN
1.3. EU and National investments in broadband
Fixed broadband coverage of rural areas is slightly above the EU average (93% vs 90,6%).
In 2014, the German Government adopted a Digital Agenda3 valid for the period from 2014 to 2017. The Digital Agenda sets out the guidelines of the Federal Government´s digital policy in many key fields of action, including Digital Infrastructure, with a further refinement and extension of an existing broadband strategy published in 2009 (Breitbandstrategie
4).
The Federal Government’s goal is to provide at least 50 Mbps in download speed country-wide – in both urban and rural areas – until 2018. With these ambitions, Germany exceeds the DAE targets5. Additional objectives pursued with the Digital Agenda are the promotion of mobility and the support of new services in this context and the digitalisation of the economy as well as the economic utilisation of new digital potentials for health care and medical services. In terms of technology, the German strategy aims to achieve an efficient mix of different technological solutions. The German Digital Agenda is meant as a Government stimulus to optimise the conditions for a market-driven network expansion. This also contains radio frequency regulation measures to make available additional spectrum for mobile internet coverage.
In 2015, the Federal Government initiated a national state aid programme (Bundesförderprogramm) to close the remaining white spots. It has a volume of about 2,1 billion EUR with an additional 600 million EUR assigned to the German Federal States for further support of infrastructure projects and digitalisation. In addition to the Federal Government’s Digital Agenda, there is also a plethora of regional broadband strategies on state-level (Länderstrategien).
Additionally four regional ERDF Operational Programs (OP) include funding of broadband investments, for overall 137,5 mil EUR for the period 2014-2020.
2. COMPETITIVE LANDSCAPE
Fixed broadband subscriptions - operator market shares6
Incumbent market share New entrants market share
2014 2015 (EU average) 2014 2015 (EU average)
42,5% 41,6% (40,6%) 57,5% 58,4% (59,4%)
Fixed broadband subscriptions - technology market shares7
3 Available online (German version): https://www.digitale-agenda.de/Content/DE/_Anlagen/2014/08/2014-08-
20-digitale-agenda.pdf;jsessionid=45ADB12CE6E02B57E51889B1B82839E2.s4t1?__blob=publicationFile&v=6
4 Available online (German version): http://www.bmwi.de/Dateien/BBA/PDF/breitbandstrategie-der-bundesregierung,property=pdf,bereich=bmwi,sprache=de,rwb=true.pdf
5 Among the Digital Agenda targets are the following: download rates of 30 Mbps for all of its citizens and at least 50% of European households subscribing to internet connections above 100 Mbps by 2020. Germany's goal of 50 Mbps nationwide exceeds the 30 Mbps target for all citizens. Additionally the German Government intends to reach its target earlier (2018 instead of 2020). (https://ec.europa.eu/digital-single-market/en/our-goals/pillar-iv-fast-and-ultra-fast-internet-access)
6 Source: Communications Committee. Data as of July 2014 and July 2015.7 Source: Communications Committee. Data as of July 2015
21
EN
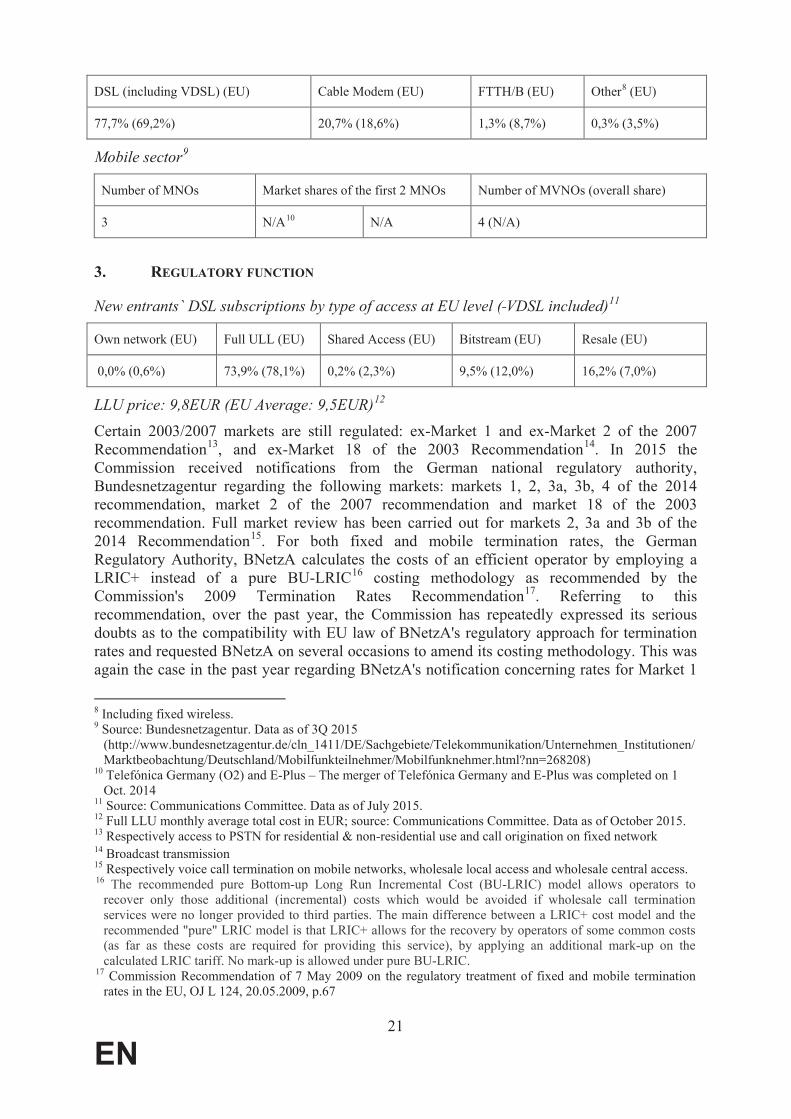
DSL (including VDSL) (EU) Cable Modem (EU) FTTH/B (EU) Other8 (EU)
77,7% (69,2%) 20,7% (18,6%) 1,3% (8,7%) 0,3% (3,5%)
Mobile sector9
Number of MNOs Market shares of the first 2 MNOs Number of MVNOs (overall share)
3 N/A10 N/A 4 (N/A)
3. REGULATORY FUNCTION
New entrants` DSL subscriptions by type of access at EU level ( VDSL included)11
Own network (EU) Full ULL (EU) Shared Access (EU) Bitstream (EU) Resale (EU)
0,0% (0,6%) 73,9% (78,1%) 0,2% (2,3%) 9,5% (12,0%) 16,2% (7,0%)
LLU price: 9,8EUR (EU Average: 9,5EUR)12
Certain 2003/2007 markets are still regulated: ex-Market 1 and ex-Market 2 of the 2007 Recommendation13, and ex-Market 18 of the 2003 Recommendation14. In 2015 the Commission received notifications from the German national regulatory authority, Bundesnetzagentur regarding the following markets: markets 1, 2, 3a, 3b, 4 of the 2014 recommendation, market 2 of the 2007 recommendation and market 18 of the 2003 recommendation. Full market review has been carried out for markets 2, 3a and 3b of the 2014 Recommendation15. For both fixed and mobile termination rates, the German Regulatory Authority, BNetzA calculates the costs of an efficient operator by employing a LRIC+ instead of a pure BU-LRIC16 costing methodology as recommended by the Commission's 2009 Termination Rates Recommendation17. Referring to this recommendation, over the past year, the Commission has repeatedly expressed its serious doubts as to the compatibility with EU law of BNetzA's regulatory approach for termination rates and requested BNetzA on several occasions to amend its costing methodology. This was again the case in the past year regarding BNetzA's notification concerning rates for Market 1
8 Including fixed wireless.9 Source: Bundesnetzagentur. Data as of 3Q 2015
(http://www.bundesnetzagentur.de/cln_1411/DE/Sachgebiete/Telekommunikation/Unternehmen_Institutionen/Marktbeobachtung/Deutschland/Mobilfunkteilnehmer/Mobilfunknehmer.html?nn=268208)
10 Telefónica Germany (O2) and E-Plus – The merger of Telefónica Germany and E-Plus was completed on 1 Oct. 2014
11 Source: Communications Committee. Data as of July 2015.12 Full LLU monthly average total cost in EUR; source: Communications Committee. Data as of October 2015. 13 Respectively access to PSTN for residential & non-residential use and call origination on fixed network14 Broadcast transmission15 Respectively voice call termination on mobile networks, wholesale local access and wholesale central access.16 The recommended pure Bottom-up Long Run Incremental Cost (BU-LRIC) model allows operators to
recover only those additional (incremental) costs which would be avoided if wholesale call termination services were no longer provided to third parties. The main difference between a LRIC+ cost model and the recommended "pure" LRIC model is that LRIC+ allows for the recovery by operators of some common costs (as far as these costs are required for providing this service), by applying an additional mark-up on thecalculated LRIC tariff. No mark-up is allowed under pure BU-LRIC.
17 Commission Recommendation of 7 May 2009 on the regulatory treatment of fixed and mobile termination rates in the EU, OJ L 124, 20.05.2009, p.67

22
EN
(call termination on fixed networks) and concerning Market 2 of the 2014 Recommendation (voice call termination on mobile networks).
4. CONSUMER ISSUES
In Germany, the average retail Eurotariff price for roaming is 0,131EUR per minute of calls made (equal to EU average) and 0,017EUR per minute of calls received (half of EU average 0,034EUR per minute), with alternative tariffs respectively more expensive both for calls made and for calls received, 0,053 per SMS (very close to EU average 0.052EUR per minute). In particular for data the prices dropped significantly from 0,083EUR per MB in Q2 of 2015 to 0,076EUR per MB in Q3 2015 (still above EU average 0,059EUR per minute).18
Number portability 2014 2015
Fixed Number of transactions19 461.534 -
% of total numbers20 0,2% -
Maximum wholesale price21 - -
Maximum time under regulation (number of working days)22
1 1
Mobile Number of transactions23 1.220.108 1.763.077
% of total numbers24 1,1% 1,6%
Maximum wholesale price25 - -
Maximum time under regulation (number of working days)26
1 1
With more complex products in the market (double and triple play as well as traffic bundles) becoming increasingly relevant in the market, the perception of transparency and clarity of contracts by consumers is increasingly important. The 2015 Eurobarometer survey shows that German consumers can easily compare bundle offers (65%, slightly below EU average 69%).
German respondents say that it is easy to monitor and control their mobile phone consumption (rank 5, 82%, EU average 78%). Germany ranks as third regarding the ease of monitoring and controlling their fixed telephone consumption (77%, EU average 71%), just after the UK and Ireland (both 80%). Germany ranks as fourth regarding the ease to monitor and control their mobile Internet consumption (74%, EU average 69%). German respondents are also likely to say that it is easy to monitor and control their fixed internet consumption (70%, EU average
18 International Roaming BEREC Benchmark Data Report April 2015 – September 2015 BoR(16)28.19 Source: Communications Committee. Data as of January to September 2014 and January to September 2015.20 Source: Communications Committee. Data as of January to September 2014 and January to September 2015.21 Source: Communications Committee. Data as of October 2014 and October 2015.22 Source: Communications Committee. Data as of October 2014 and October 2015.23 Source: Communications Committee. Data as of January to September 2014 and January to September 2015.24 Source: Communications Committee. Data as of January to September 2014 and January to September 2015.25 Source: Communications Committee. Data as of October 2014 and October 2015.26 Source: Communications Committee. Data as of October 2014 and October 2015.

23
EN
67%). German respondents are also satisfied with the contract information they receive (73%, EU average 68%).
Under the German Telecommunications Act, the scope of the universal service includes: (i) the connection to a public telecommunications network at a fixed location which allows voice calls, facsimile and data communications at data rates that are sufficient to enable functional internet access; (ii) access to public telephony services through the connection referred to above; (iii) availability of at least one subscriber directory; (iv) availability of at least one public telephone enquiry service; (v) nationwide allocation of public pay phones or other access points to public telephone services; (vi) the ability to perform calls to emergency call services 112 and 110 from public pay phones by simple handling and free of charge. No undertaking has been designated for the provision of universal service. The authorities have not intervened so far as they consider that the market provides the necessary services.

24
EN
ESTONIA
1. MEASURES FACILITATING DEPLOYMENT AND INVESTMENTS IN HIGH SPEED
NETWORKS
1.1. Spectrum
Harmonised bands MHz spectrum assigned1 % of the harmonised band assigned
800MHz 60 100%
900MHz 70 100%
1500MHz 0 0%
1800MHz 150 100%
2000MHz paired 120 100%
2600MHz 80 42,1%
3400-3600MHz 190 95%
3600-3800MHz 200 100%
Overall, Estonia has assigned 84,5% of the overall harmonised spectrum for BB. As far as spectrum usage is concerned, it appears that lower frequencies than the 3400-3600 MHz and 3600-3800 MHz bands are more attractive to some operators.
As far as the 700 MHz band is concerned, Estonia has decided to allocate the 700 MHz band to mobile broadband as from the 1st of July 2017. The public consultation will be prepared in 2016.
1.2. State of transposition of the BB CRD (Directive 2014/61/EU)
Estonia has not yet notified to the Commission implementing measures for Directive 2014/61/EU.
1.3. EU and National investments in broadband
In early 2014, Estonia updated its targets and measures for broadband development as part of its new Digital Agenda 2020 for Estonia. The country aims at providing all residents with internet access of > 30 Mbps, and achieving at least 60 % household subscription rates for speeds > 100 Mbps. More generally, Estonia’s Digital Agenda is meant to provide general guidance for creating a well-operating national information and communication technology environment. The development of country-wide NGA networks is deemed an essential component thereof.
1 Including guard bands

25
EN
A distinguishing feature of the Estonian strategy is that it also sets objectives with regard to mobile networks as well as the level of “internet freedom”. On the one hand, the target is to achieve mobile internet access levels greater than 80 % throughout the country. On the other hand, the country desires to rank among the top five countries in the world with respect to internet freedom (as measured by the Freedom House Survey’s indicator “Freedom on the Net”).
The Estonian national broadband plan is an integral part of the Estonian Digital Society Strategy 2020. One of the key measures to foster broadband deployment is the Estwin project.The overall layout of the network was designed in 2009 and encompasses a fibre middle-mile network aiming at ensuring that after completion 98 % of all households in Estonia will be located no further than 1.5 km from the nearest network access point. At the end of 2015,approximately 3900 km of network cables have been deployed and completion of the entire EstWin Network has been postponed to 2020 (compared with the original end date of 2018), in line with the new financing period. Indeed, approximately 15 % of network construction cost is self-financed by Estonia, while approximately 85 % of financing is covered by ERDF funds. It is also worth noting that 40 500 000 EUR from EU structural funds for the period 2014–2020 will be dedicated to fibre optic backbone network development.
2. COMPETITIVE LANDSCAPE
Fixed broadband subscriptions - operator market shares2
Incumbent market share New entrants market share
July 2014 July 2015 (EU average) July 2014 July 2015 (EU average)
60,2% 58,4% (40,6%) 39,8% 41,6% (59,4%)
Fixed broadband subscriptions - technology market shares3
DSL (including VDSL) (EU) Cable Modem (EU) FTTH/B (EU) Other4 (EU)
39% (69,2%) 21,6% (18,6%) 33% (8,7%) 6,4% (3,5%)
Mobile sector5
Number of MNOs Market shares of the first 2 MNOs Number of MVNOs (overall share)
3 39% 34% 1 (N/A)
For fixed broadband subscriptions, a slight decrease of the incumbent's market shares can be observed between July 2014 and July 2015. As far as technology market shares in July 2015 are concerned, DSL is predominant.
2 Source: Communications Committee. Data as of July 2014 and July 2015.3 Source: Communications Committee. Data as of July 20154 Including fixed wireless.5 Source: Communications Committee. Data as of October 2015.

26
EN
3. REGULATORY FUNCTION
New entrants` DSL subscriptions by type of access at EU level (VDSL and VULA excluded)6
Own network (EU) Full ULL (EU) Shared Access (EU) Bitstream (EU) Resale (EU)
84% (0,6%) - (78,1%) - (2,3%) 15,7% (12%) - (7%)
LLU price: 5,1 EUR (EU Average:9,5 EUR)7
In 2015, ETRA notified to the Commission a draft decision as regards market 18 of the 2003 Recommendation (Broadcasting transmission services, to deliver broadcast content to end users), a draft decision about remedies as regards market 2 of 2014 Recommendation (wholesale voice call termination on individual mobile networks) and a draft decision about remedies as regards the market 1 of the 2014 Recommendation (wholesale call termination on individual public telephone networks provided at a fixed location).
Fixed and Mobile Termination rates are calculated by benchmarking pure BU-LRIC rates of the Member States which have implemented the recommended cost methodology.
4. CONSUMER ISSUES
The average retail Eurotariff price for roaming is 0,188 euros per minute of calls made and 0,031 euros per minute of calls received. For data roaming services, the average retail data price per Mb slightly decreased from Q2 2015 to Q3 2015 from 0,084 to 0,082 euros thus above the EU average (0,059 euros)8
Number portability 2014 2015
Fixed Number of transactions9 6354 3882
% of total numbers10 0,7% 0,5%
Maximum wholesale price11 - -
Maximum time under regulation (number of working days)12
0 0
Mobile Number of transactions13 50731 51965
% of total numbers14 0,8% 0,9%
Maximum wholesale price15 - -
6 Source: Communications Committee. Data as of July 2015.7 Full LLU monthly average total cost in EUR; source: Communications Committee. Data as of October 2015. 8 International Roaming BEREC Benchmark Data Report April 2015 – September 2015 BoR(16)28.9 Source: Communications Committee. Data as of January to September 2014 and January to September 2015.10 Source: Communications Committee. Data as of January to September 2014 and January to September 2015.11 Source: Communications Committee. Data as of October 2014 and October 2015.12 Source: Communications Committee. Data as of October 2014 and October 2015.13 Source: Communications Committee. Data as of January to September 2014 and January to September 2015.14 Source: Communications Committee. Data as of January to September 2014 and January to September 2015.

27
EN
Maximum time under regulation (number of working days)16
0 0
According to the EU barometer survey of October 2015, it is easy to a majority of Estonians to compare their bundled offers to other bundled offers (to 64% of the respondents)
As far as the easiness of monitoring consumption of mobile and fixed Internet access is concerned, 63% and 62% of the respondents respectively answered in the affirmative.
The EU barometer survey also showed that it was easy to a majority of respondents to monitor their consumption of mobile and fixed telephony services (74% and 65% respectively)
As to clarity about communications contract information, the EU barometer survey indicates that 63% of the respondents were satisfied.
The following services are included in the scope of Universal Service in Estonia: telephony services, directory enquiry services and directories, public pay telephones and other public voice telephony access points. Functional access to the internet is defined as a narrowband (up to 56 Kbps) access. There have not been any discussions in Estonia regarding the extension of the scope of the Universal Service to include broadband connections, since the service is available to end-users throughout the country via wireless broadband with up to 3.1 Mbps download/1.8 Mbps upload speeds at an affordable price. Moreover, taking into account the EstWin project, a Universal Service obligation for broadband would not be of much relevance in the future.
15 Source: Communications Committee. Data as of October 2014 and October 2015.16 Source: Communications Committee. Data as of October 2014 and October 2015.

28
EN
Greece
1. MEASURES FACILITATING DEPLOYMENT AND INVESTMENTS IN HIGH SPEED
NETWORKS
1.1. Spectrum
Harmonised bands MHz spectrum assigned1 % of the harmonised band assigned
800MHz 60 100
900MHz 70 100
1500MHz 0 0
1800MHz 150 100
2000MHz paired 90 75
2600MHz 180 94.7
3400-3600MHz 186 93
3600-3800MHz 0 0
Overall, Greece has assigned 71.5% of the overall harmonised spectrum for broadband.
In 2015, EETT completed two public consultations regarding the limitation of the number of rights of use and the procedure for the assignment of rights of use of radio-frequency in the 24.5-26.5 GHz and the 1800 MHz bands. While all four rights of use of radio-frequency in the 24.5-26.5 GHz have expired in December 2015 – January 2016, the assignment procedure has not started yet. The same applies for the 1800 MHz band, where three of the six rights of use of frequency in the 1800 MHz band expire on 5 August 2016.
In 2015, the Commission services started an investigation of certain provisions of Law 4339/2015 related to digital terrestrial transmissions.
1.2. State of transposition of the BB CRD (Directive 2014/61/EU)
The transposition process of the national legislation transposing the Directive is still on-going under a working group within the Ministry of Infrastructure Transport & Networks. The working group deals not only with the preparation of the transposing legislation, but also with updating and simplifying the legislative framework for permit granting. The draft law is expected within April.
1.3. EU and National investments in broadband
Fixed basic broadband coverage of rural areas reached 96.5% mid 2015, above the EU average of 90.6%. In June 2015, Greece has devised a national broadband strategy entitled National Plan Next Generation Broadband Access 2014-2020. This NGA plan essentially
1 Including guard bands
29
EN
reiterates the DAE 2020 targets, aiming to achieve online access with speeds over 30 Mbps for all Greeks by 2020, and 50 % household penetration of internet speeds exceeding 100 Mbps. The approach is based on a combination of political, regulatory and financial interventions and progress monitoring. There are in essence two pillars, or action lines, where government efforts will be concentrated: Pillar A revolves around setting up a business environment favourable for private investments. Pillar B focuses on increasing next-generation broadband access in areas with little perspective for infrastructure and service development. In order to reduce overall infrastructure roll-out costs, Greece relies on the transposition of Directive 2014/61/EU.
In terms of investments, the broadband strategy expects the private sector to take on the vast majority of the weight of these investments, with public intervention focusing mostly on areas characterised by market failure. Required funding is expected to range between 1.36 billion to 4.53 billion EUR. Greece has no regional broadband plans. However, regional/transregional projects were put in place, according to the Greek NGA plan.
Some public financing sources are being planned for the deployment of NGA networks. A competitiveness, entrepreneurship & innovation OP includes and a European Agricultural Fund for Rural Development (EAFRD) include a total of EUR 369 271 559 funding for broadband2
The Connected Communities Initiative3 (CCI), a joint partnership between the European Commission and the World Bank, has been launched to provide technical assistance to the European Broadband project promoters. Greek project promoters have submitted some well advanced projects. While the best projects of Connected Communities are expected to be eligible for funding from Connecting Europe Facility, European Fund for Strategic Investments and possibly other sources of financing, it is very much likely that combining private financing and financial instruments with European, National and Municipal grants will be necessary.
2. COMPETITIVE LANDSCAPE
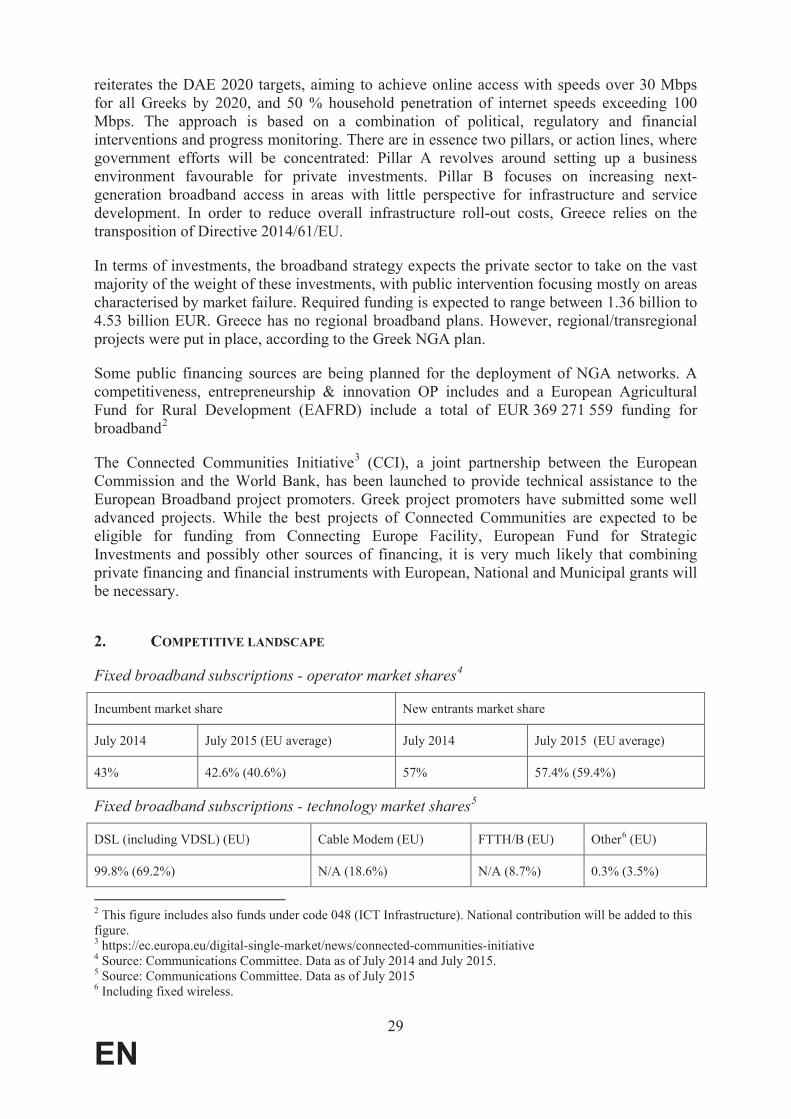
Fixed broadband subscriptions - operator market shares4
Incumbent market share New entrants market share
July 2014 July 2015 (EU average) July 2014 July 2015 (EU average)
43% 42.6% (40.6%) 57% 57.4% (59.4%)
Fixed broadband subscriptions - technology market shares5
DSL (including VDSL) (EU) Cable Modem (EU) FTTH/B (EU) Other6 (EU)
99.8% (69.2%) N/A (18.6%) N/A (8.7%) 0.3% (3.5%)
2 This figure includes also funds under code 048 (ICT Infrastructure). National contribution will be added to this figure.3 https://ec.europa.eu/digital-single-market/news/connected-communities-initiative4 Source: Communications Committee. Data as of July 2014 and July 2015.5 Source: Communications Committee. Data as of July 20156 Including fixed wireless.

30
EN
Mobile sector7
Number of MNOs Market shares of the first 2 MNOs Number of MVNOs (overall share)
3 N/A N/A 1 (N/A)
During 2015, Vodafone and Wind pursued with the implementation of their network sharing agreement.
3. REGULATORY FUNCTION
New entrants` DSL subscriptions by type of access at EU level (VDSL and VULA excluded)8
Own network (EU) Full ULL (EU) Shared Access (EU) Bitstream (EU) Resale (EU)
N/A (0.6%) 98.8% (78.1%) 0.3% (2.3%) 0.8% (12%) N/A. (7%)
LLU price: 8.2 EUR (EU Average: 9.5EUR)9
Being without a Head since the resignation of its previous Head on 23 January 2015, EETT has neither notified a new market analysis in 2015, nor adopted measures. Nevertheless, on 29 June 2015, EETT launched a public consultation on the review of the market for retail access to the public telephone network at a fixed location for residential and non-residential customers (Market 1 of the 2003 Recommendation), the market for wholesale (physical) network infrastructure access (including shared or fully unbundled access) at a fixed location (Market 4 of the 2007 Recommendation corresponding to Market 3a of the 2014 Recommendation), and the market for wholesale broadband access (Market 5 of the 2007 Recommendation, corresponding to Market 3b of the 2014 Recommendation). The public consultation was completed on 2 November 2015. In parallel it undertook consultations with the market players regarding the introduction of VDSL vectoring technology in the access network and the technical details of the migration towards IP interconnection.
In 2015, the Commission services investigated the delays in conducting market analysis regarding overall seven markets for which the three years deadline from the previous analysis had expired, or was expiring shortly. These include the market for wholesale mobile voice call termination on individual mobile networks (last final measures are in place since 19 July 2012), the market for wholesale high-quality access provided at a fixed location (last final measures are in place since 21 January 2013), the market for wholesale local access provided at a fixed location (last final measures are in place since 30 August 2011), the market for wholesale central access provided at a fixed location for mass-market products (last final measures are in place since 7 September 2011), the market for access to the public telephone network at a fixed location for residential and non-residential customers (last final measures are in place since 30 August 2011), the market for the minimum set of leased lines (last final measures are in place since 21 January 2013) and the market for wholesale trunk segments of leased lines (last final measures are in place since 21 January 2013).
7 Source: Communications Committee. Data as of October 2015.8 Source: Communications Committee. Data as of July 2015.9 Full LLU monthly average total cost in EUR; source: Communications Committee. Data as of October 2015.

31
EN
EETT is overall in compliance with the 2009 Recommendation on Termination Rates for both fixed and mobile termination rates.
In 2015, the Commission has started investigating amendments to the Greek legislation transposing the EU requirements regarding the independence and regulatory capacity of the telecoms National Regulatory Authorities in the electronic communications sector.
4. CONSUMER ISSUES
The average retail Eurotariff price for roaming is 0.166EUR per minute of calls made and 0.049EUR per minute of calls received (with alternative tariffs more expensive both for calls made and received), 0.056EUR per SMS and 0.177EUR per MB, almost three times the EEA average (0.059EUR)10.
Number portability 2014 2015
Fixed Number of transactions11 443.805 403.459
% of total numbers12 9.3% 8.5%
Maximum wholesale price13 1 1
Maximum time under regulation (number of working days)14
4 3
Mobile Number of transactions15 347.838 341.039
% of total numbers16 2.7% 2.6%
Maximum wholesale price17 1 1
Maximum time under regulation (number of working days)18
4 3
According to the latest Eurobarometer survey, the Greek consumers can easily compare bundles (84%, second only to Italy) and households in Greece are the most likely to have changed bundle at least once (80%). It is easier for them to monitor consumption for mobile (77%, average 69%), than for fixed (61%, average 71%), and they are highly satisfied with the clarity of their contract (78%, average 68%).
The scope of the Universal Service currently includes access to a network at a fixed location, comprehensive directory and directory enquiry services, access for people with special needs and public payphones.
10 International Roaming BEREC Benchmark Data Report October 2014 – March 2015 BoR(15)134.11 Source: Communications Committee. Data as of January to September 2014 and January to September 2015.12 Source: Communications Committee. Data as of January to September 2014 and January to September 2015.13 Source: Communications Committee. Data as of October 2014 and October 2015.14 Source: Communications Committee. Data as of October 2014 and October 2015.15 Source: Communications Committee. Data as of January to September 2014 and January to September 2015.16 Source: Communications Committee. Data as of January to September 2014 and January to September 2015.17 Source: Communications Committee. Data as of October 2014 and October 2015.18 Source: Communications Committee. Data as of October 2014 and October 2015.
32
EN
SPAIN
1. MEASURES FACILITATING DEPLOYMENT AND INVESTMENTS IN HIGH SPEED
NETWORKS
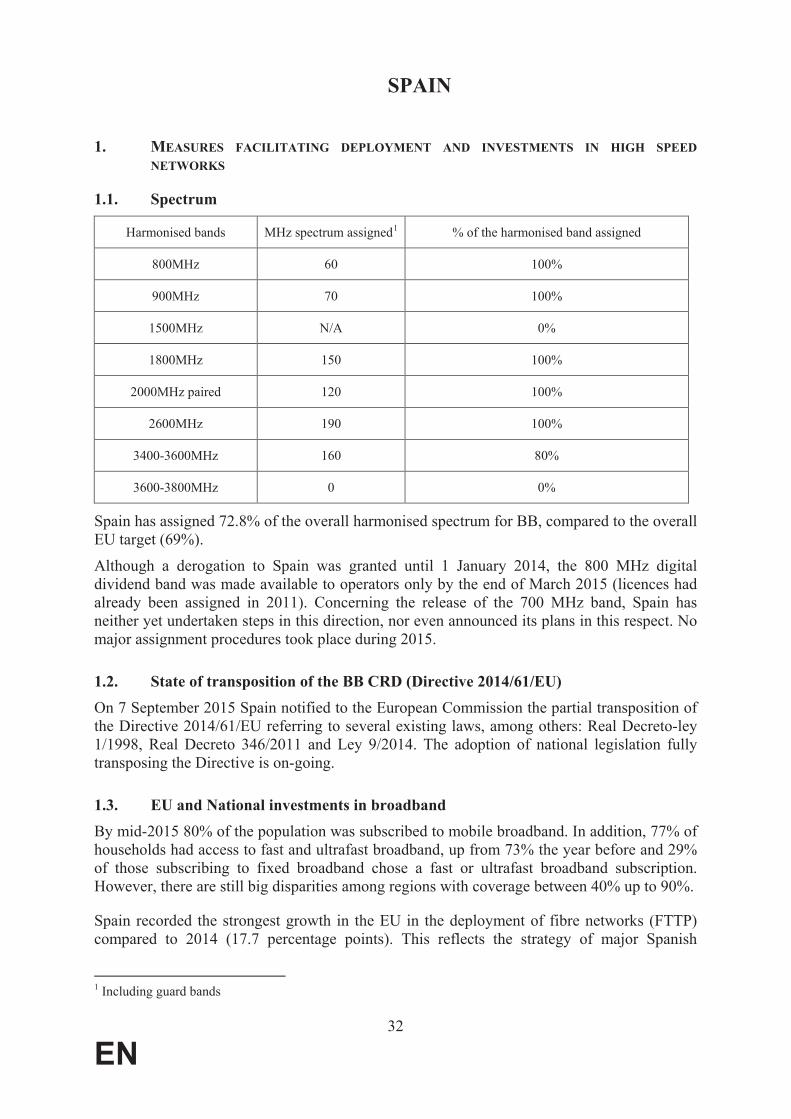
1.1. Spectrum
Harmonised bands MHz spectrum assigned1 % of the harmonised band assigned
800MHz 60 100%
900MHz 70 100%
1500MHz N/A 0%
1800MHz 150 100%
2000MHz paired 120 100%
2600MHz 190 100%
3400-3600MHz 160 80%
3600-3800MHz 0 0%
Spain has assigned 72.8% of the overall harmonised spectrum for BB, compared to the overall EU target (69%).
Although a derogation to Spain was granted until 1 January 2014, the 800 MHz digital dividend band was made available to operators only by the end of March 2015 (licences had already been assigned in 2011). Concerning the release of the 700 MHz band, Spain has neither yet undertaken steps in this direction, nor even announced its plans in this respect. No major assignment procedures took place during 2015.
1.2. State of transposition of the BB CRD (Directive 2014/61/EU)
On 7 September 2015 Spain notified to the European Commission the partial transposition of the Directive 2014/61/EU referring to several existing laws, among others: Real Decreto-ley 1/1998, Real Decreto 346/2011 and Ley 9/2014. The adoption of national legislation fully transposing the Directive is on-going.
1.3. EU and National investments in broadband
By mid-2015 80% of the population was subscribed to mobile broadband. In addition, 77% of households had access to fast and ultrafast broadband, up from 73% the year before and 29% of those subscribing to fixed broadband chose a fast or ultrafast broadband subscription. However, there are still big disparities among regions with coverage between 40% up to 90%.
Spain recorded the strongest growth in the EU in the deployment of fibre networks (FTTP) compared to 2014 (17.7 percentage points). This reflects the strategy of major Spanish
1 Including guard bands

33
EN
operators to prioritise the deployment of future proof networks over upgrades of their legacy networks. This strategy has been in part possible thanks to mandated access to Telefónica’s ducts and the symmetrical obligation for all operators of providing access to in-house fibre wiring. Both measures were imposed by CMT (CNMC’s predecessor), duct access in 2008 and symmetrical access to in-house fibre in 2009.
The Digital Agenda for Spain (ADpE) adopted in February 2013 revolves around six main objectives and nine implementation plans, including one for telecommunications and high-speed networks, which is fully in line with the DAE targets. The Plan for telecommunications and high-speed networks is managed by the Secretaría de Estado de Telecomunicaciones y
para la Sociedad de la Información (SETSI) (State Secretariat for Telecommunications and the Information Society) in the Ministry of Industry, Energy and Tourism (MINETUR). Its implementation also foresees coordination by the SETSI with regional and local administrations. The ADpE implementation plans are monitored and reviewed via annual reports.
The Spanish high-speed networks Plan recalls the fundamental role of the private sector in the deployment of broadband, but in areas where market-based deployment fails due to a lack of profitability, public-private cooperation mechanisms are foreseen. The Plan also contains a 200 mln EUR programme to extend next-generation broadband, which will provide financial support to bring at least 100 Mbps connectivity to small and medium-sized municipalities in white areas and improve backhaul and access networks providing at least 30 Mbps connectivity in other white areas.
The adoption in October 2014 of the partnership agreement setting out Spain’s strategy, priorities and arrangements for the use of European Structural and Investment Funds in 2014-2020 has been followed by the adoption of 11 Operational Programs (OP; 1 national and 10 regional) with more than 420 mln EUR of support foreseen from the European Regional Development Fund (ERDF) to broadband investments in Spain. In rural areas broadband deployment will be also supported in several regions by the European Agricultural Fund for Rural Development. Currently, fixed basic broadband coverage of rural areas is slightly above the EU average (91.1% vs. 90.6%). Spanish projects were among the most active participants in the European Commission and World Bank's Connected Community initiative that will help project promoters to prepare a sound business case to explore possibility for funding from the Connecting Europe Facility (CEF), the European Fund for Strategic Investments (EFSI) and other sources. Another Spanish project, Guifi.net, received the 2015 European Broadband Award for the best project in the category of innovative model of financing, business and investment.
2. COMPETITIVE LANDSCAPE
Fixed broadband subscriptions - operator market shares2
Incumbent market share New entrants market share
2014 2015 (EU average) 2014 2015 (EU average)
45.9% 44% (40.6%) 54.1% 56% (59.4%)
2 Source: Communications Committee. Data as of July 2014 and July 2015.

34
EN
Fixed broadband subscriptions - technology market shares3
DSL (including VDSL) (EU) Cable Modem (EU) FTTH/B (EU) Other4 (EU)
64.2% (69.2%) 18.1% (18.6%) 16.9% (8.7%) 0.8% (3.5%)
Mobile sector5
Number of MNOs Market shares of the first 2 MNOs Number of MVNOs (overall share)
4 32% 26% 23 (12.8 %)
3. REGULATORY FUNCTION
New entrants` DSL subscriptions by type of access at EU level (VDSL and VULA excluded)6
Own network (EU) Full ULL (EU) Shared Access (EU) Bitstream (EU) Resale (EU)
- (0.6%) 78% (78.1%) 2.1% (2.3%) 19.8% (12%) 0.1% (7%)
LLU price: 9.4 EUR (EU average: 9.5 EUR)7
At present, ex-ante regulation is needed in nine markets in Spain: the 5 markets from the 2014 Recommendation, and also (a) access to PSTN for residents and non-residents and (b) call origination on fixed network (from the 2007 Recommendation) and two regulated markets from the 2003 Recommendation (access and call origination on mobile network and broadcasting transmission services8).
In November 2015, the CNMC notified three markets' analysis to the Commission: 3a, 3b and 4 of the 2014 Recommendation. Final regulation on these markets was adopted in February 2016, replacing the one in force since 2009.
In 2015 the Commission services investigated the delays in conducting a market analysis for the remaining regulated markets as it had been more than three years since the previous analysis had expired. These markets included: market 2 of the 2014 Recommendation, market 2 of the 2007 Recommendation and market 15 of the 2003 Recommendation. For both fixed and mobile termination rates, Spain has applied a pure BU-LRIC cost model, in accordance with the 2009 Recommendation on Termination Rates. The current Mobile Termination Rate is 1.09 cEUR/min for all mobile operators, while the Fixed Termination Rate is 0.0817 cEUR/min for all fixed operators.
3 Source: Communications Committee. Data as of July 20154 Including fixed wireless5 Source: Communications Committee. Data as of October 2015.6 Source: Communications Committee. Data as of July 2015.7 Full LLU monthly average total cost in EUR. Source: Communications Committee. Data as of October 2015. 8 In addition, although the bulk of the market of wholesale trunk segments of leased lines is deregulated, there is still regulation in 10 submarine routes connecting the Balearic and Canary Islands, Ceuta and Melilla (market 14 of 2003 Recommendation).
35
EN
4. CONSUMER ISSUES
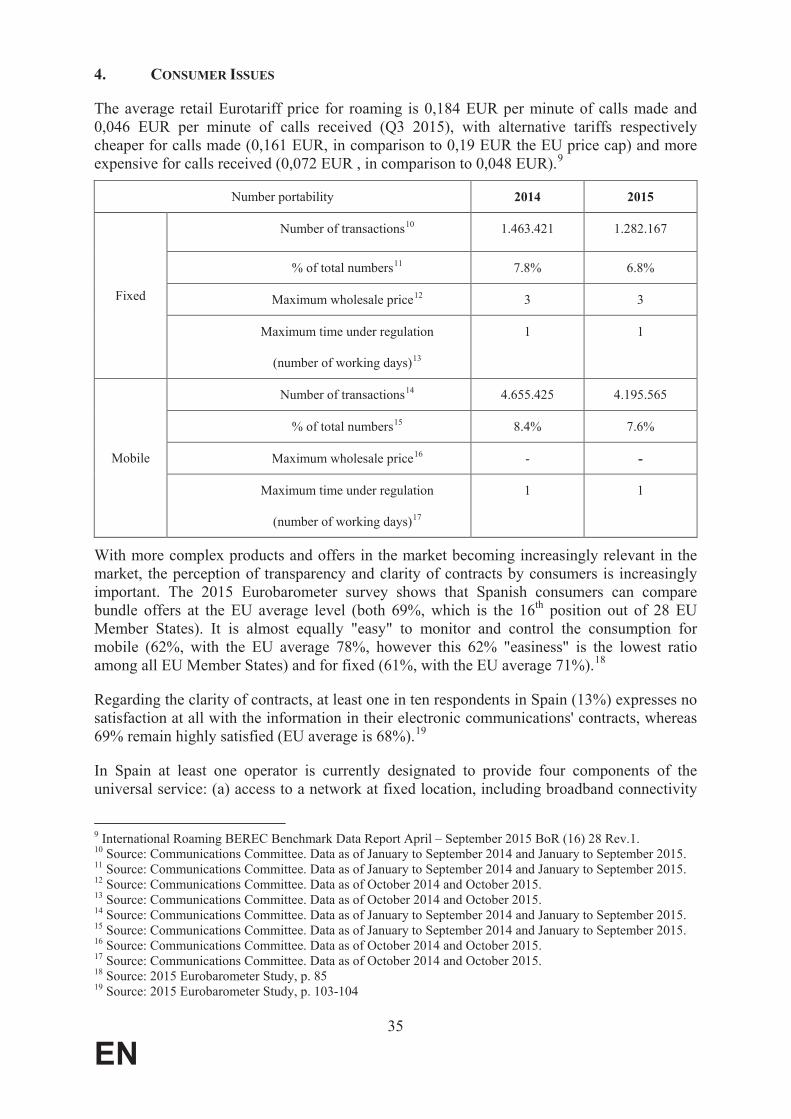
The average retail Eurotariff price for roaming is 0,184 EUR per minute of calls made and 0,046 EUR per minute of calls received (Q3 2015), with alternative tariffs respectively cheaper for calls made (0,161 EUR, in comparison to 0,19 EUR the EU price cap) and more expensive for calls received (0,072 EUR , in comparison to 0,048 EUR).9
Number portability 2014 2015
Fixed
Number of transactions10 1.463.421 1.282.167
% of total numbers11 7.8% 6.8%
Maximum wholesale price12 3 3
Maximum time under regulation
(number of working days)13
1 1
Mobile
Number of transactions14 4.655.425 4.195.565
% of total numbers15 8.4% 7.6%
Maximum wholesale price16 - -
Maximum time under regulation
(number of working days)17
1 1
With more complex products and offers in the market becoming increasingly relevant in the market, the perception of transparency and clarity of contracts by consumers is increasingly important. The 2015 Eurobarometer survey shows that Spanish consumers can compare bundle offers at the EU average level (both 69%, which is the 16th position out of 28 EU Member States). It is almost equally "easy" to monitor and control the consumption for mobile (62%, with the EU average 78%, however this 62% "easiness" is the lowest ratio among all EU Member States) and for fixed (61%, with the EU average 71%).18
Regarding the clarity of contracts, at least one in ten respondents in Spain (13%) expresses no satisfaction at all with the information in their electronic communications' contracts, whereas 69% remain highly satisfied (EU average is 68%).19
In Spain at least one operator is currently designated to provide four components of the universal service: (a) access to a network at fixed location, including broadband connectivity
9 International Roaming BEREC Benchmark Data Report April – September 2015 BoR (16) 28 Rev.1.10 Source: Communications Committee. Data as of January to September 2014 and January to September 2015.11 Source: Communications Committee. Data as of January to September 2014 and January to September 2015.12 Source: Communications Committee. Data as of October 2014 and October 2015.13 Source: Communications Committee. Data as of October 2014 and October 2015.14 Source: Communications Committee. Data as of January to September 2014 and January to September 2015.15 Source: Communications Committee. Data as of January to September 2014 and January to September 2015.16 Source: Communications Committee. Data as of October 2014 and October 2015.17 Source: Communications Committee. Data as of October 2014 and October 2015.18 Source: 2015 Eurobarometer Study, p. 8519 Source: 2015 Eurobarometer Study, p. 103-104

36
EN
at 1Mb/s and PATS; (b) comprehensive directory (c) social tariffs and (d) public payphone20.The comprehensive directory enquiry service was withdrawn in 2012.21
20 Telefónica is the operator designated for providing components (a), (b) and (c), while Telefónica Telecomunicaciones Públicas (TTP), also member of Telefónica Group, is the operator designated for providing public payphones.21 Source: EC internal study
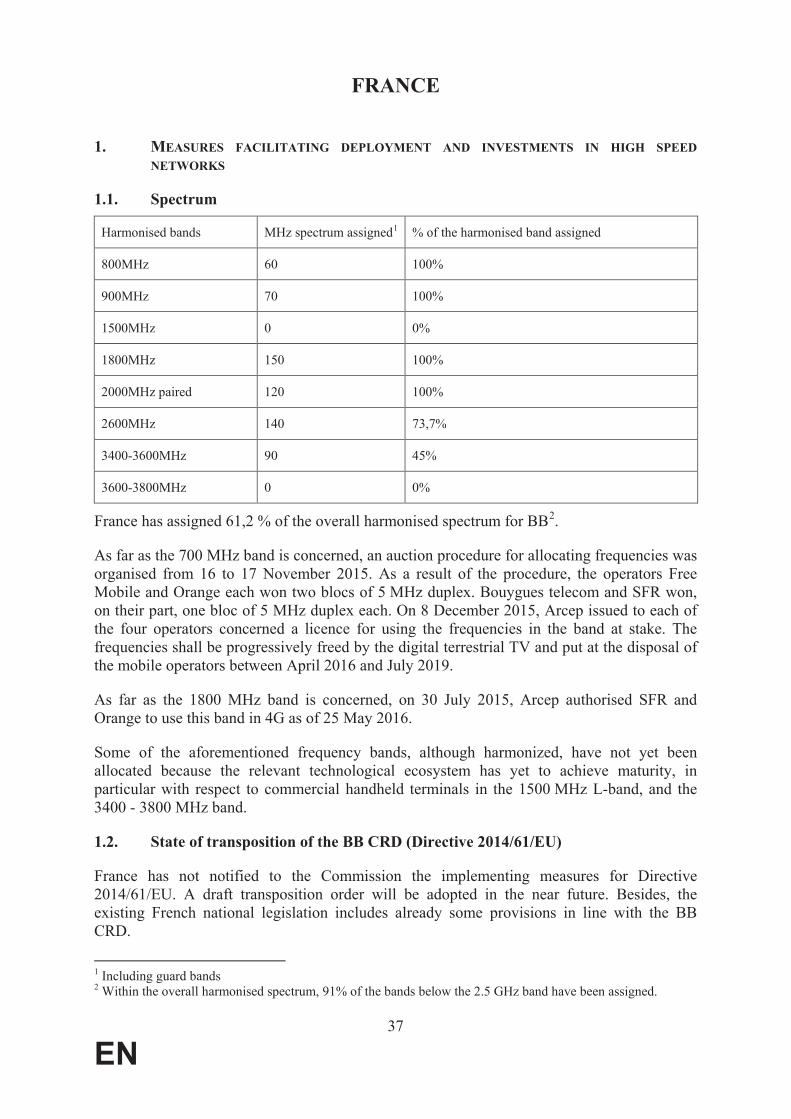
37
EN
FRANCE
1. MEASURES FACILITATING DEPLOYMENT AND INVESTMENTS IN HIGH SPEED
NETWORKS
1.1. Spectrum
Harmonised bands MHz spectrum assigned1 % of the harmonised band assigned
800MHz 60 100%
900MHz 70 100%
1500MHz 0 0%
1800MHz 150 100%
2000MHz paired 120 100%
2600MHz 140 73,7%
3400-3600MHz 90 45%
3600-3800MHz 0 0%
France has assigned 61,2 % of the overall harmonised spectrum for BB2.
As far as the 700 MHz band is concerned, an auction procedure for allocating frequencies was organised from 16 to 17 November 2015. As a result of the procedure, the operators Free Mobile and Orange each won two blocs of 5 MHz duplex. Bouygues telecom and SFR won, on their part, one bloc of 5 MHz duplex each. On 8 December 2015, Arcep issued to each of the four operators concerned a licence for using the frequencies in the band at stake. The frequencies shall be progressively freed by the digital terrestrial TV and put at the disposal of the mobile operators between April 2016 and July 2019.
As far as the 1800 MHz band is concerned, on 30 July 2015, Arcep authorised SFR and Orange to use this band in 4G as of 25 May 2016.
Some of the aforementioned frequency bands, although harmonized, have not yet been allocated because the relevant technological ecosystem has yet to achieve maturity, in particular with respect to commercial handheld terminals in the 1500 MHz L-band, and the 3400 - 3800 MHz band.
1.2. State of transposition of the BB CRD (Directive 2014/61/EU)
France has not notified to the Commission the implementing measures for Directive 2014/61/EU. A draft transposition order will be adopted in the near future. Besides, the existing French national legislation includes already some provisions in line with the BB CRD.
1 Including guard bands2 Within the overall harmonised spectrum, 91% of the bands below the 2.5 GHz band have been assigned.

38
EN
1.3. EU and National investments in broadband
In February 2013, the French Government published its National Broadband Plan entitled "France Très Haut Débit". The plan was updated in 2015. With its broadband plan, France commits to covering the entire territory with high-speed broadband by 2022. In particular, the French broadband target is to achieve 100 % coverage with 100 Mbps until 2022. The French broadband roll-out strategy thereby centres on FttH technology. All in all, France’s broadband targets can be said to exceed the DAE, albeit with a slightly longer time horizon for realisation (by 2022).
Successively, the French Government published a convention agreement on the modalities of FttH deployment (Modèle de « Convention de programmation et de suivi des déploiements
FttH, 2013) as well as specifications for network development project applications (Le cahier
des charges de l'appel à projets " France Très Haut Débit - Réseaux d'initiative publique
2013 2015). The Government has also made public a list, which is continuously upgraded, including the network-roll-out projects in the country initiated under the French Broadband Plan.
The plan distinguishes between, on one hand the ‘zones conventionnées’ where operators have committed to invest EUR 7 billion as a whole through trilateral agreements (State-local authority-operators) and which cover 57 % of the population, and on the other hand, the ‘réseaux d’initiative publique’ where deployment is ensured by local authorities and is estimated to amount to EUR 14 billion. To ensure that public financial support is targeted, local authorities are not to initiate any deployment in areas considered to be served by the market.
The French government estimates total costs of securing high speed broadband for all at EUR20 billion, of which one third will need to be covered by public funds. On average, half of the amount covered by public funds is to be provided by the State and the rest by local authorities, including with the use of the European Structural and Investment Funds, under which France has allocated EUR 586,6 million for broadband deployment for the 2014-2020period for an overall number of 24 programmes.
Furthermore, it should be noted that the several local/regional plans have been approved in October 2015. This concerns "Alsace très haut débit"with the deployment of a very high speed fibre to the home (FTTH) telecommunications network in about 700 communes of the Region of Alsace covering 380 000 connections (sites passed) download bit rates above 30 Mbps and the region "Nord Pas De Calais THD" with over 500,000 households with fibre to the house (FTTH), upgrade nearly 200 ADSL sites with fibre connectivity and to provide fibre access to nearly 75 public and business sites.
2. COMPETITIVE LANDSCAPE
Fixed broadband subscriptions - operator market shares3
Incumbent market share New entrants market share
July 2014 July 2015 (EU average) July 2014 July 2015 (EU average)
3 Source: Communications Committee. Data as of July 2014 and July 2015.
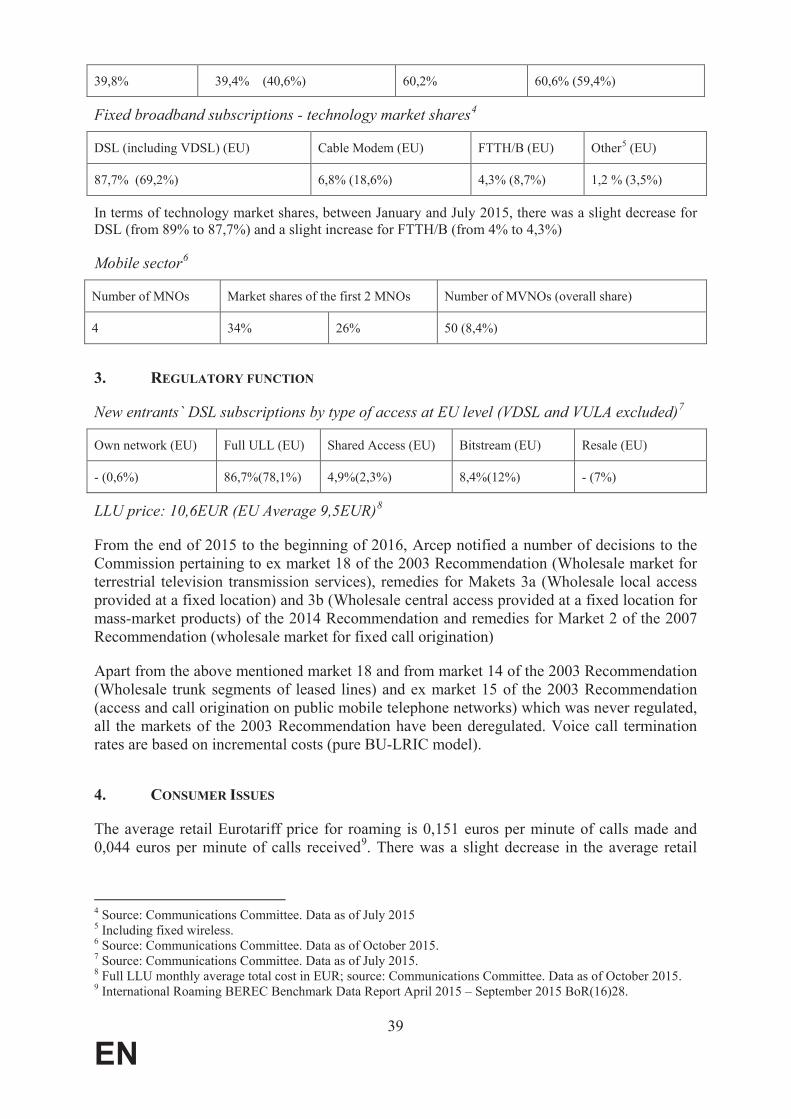
39
EN
39,8% 39,4% (40,6%) 60,2% 60,6% (59,4%)
Fixed broadband subscriptions - technology market shares4
DSL (including VDSL) (EU) Cable Modem (EU) FTTH/B (EU) Other5 (EU)
87,7% (69,2%) 6,8% (18,6%) 4,3% (8,7%) 1,2 % (3,5%)
In terms of technology market shares, between January and July 2015, there was a slight decrease for DSL (from 89% to 87,7%) and a slight increase for FTTH/B (from 4% to 4,3%)
Mobile sector6
Number of MNOs Market shares of the first 2 MNOs Number of MVNOs (overall share)
4 34% 26% 50 (8,4%)
3. REGULATORY FUNCTION
New entrants` DSL subscriptions by type of access at EU level (VDSL and VULA excluded)7
Own network (EU) Full ULL (EU) Shared Access (EU) Bitstream (EU) Resale (EU)
- (0,6%) 86,7%(78,1%) 4,9%(2,3%) 8,4%(12%) - (7%)
LLU price: 10,6EUR (EU Average 9,5EUR)8
From the end of 2015 to the beginning of 2016, Arcep notified a number of decisions to the Commission pertaining to ex market 18 of the 2003 Recommendation (Wholesale market for terrestrial television transmission services), remedies for Makets 3a (Wholesale local access provided at a fixed location) and 3b (Wholesale central access provided at a fixed location for mass-market products) of the 2014 Recommendation and remedies for Market 2 of the 2007 Recommendation (wholesale market for fixed call origination)
Apart from the above mentioned market 18 and from market 14 of the 2003 Recommendation (Wholesale trunk segments of leased lines) and ex market 15 of the 2003 Recommendation (access and call origination on public mobile telephone networks) which was never regulated,all the markets of the 2003 Recommendation have been deregulated. Voice call termination rates are based on incremental costs (pure BU-LRIC model).
4. CONSUMER ISSUES
The average retail Eurotariff price for roaming is 0,151 euros per minute of calls made and 0,044 euros per minute of calls received9. There was a slight decrease in the average retail
4 Source: Communications Committee. Data as of July 20155 Including fixed wireless.6 Source: Communications Committee. Data as of October 2015.7 Source: Communications Committee. Data as of July 2015.8 Full LLU monthly average total cost in EUR; source: Communications Committee. Data as of October 2015. 9 International Roaming BEREC Benchmark Data Report April 2015 – September 2015 BoR(16)28.
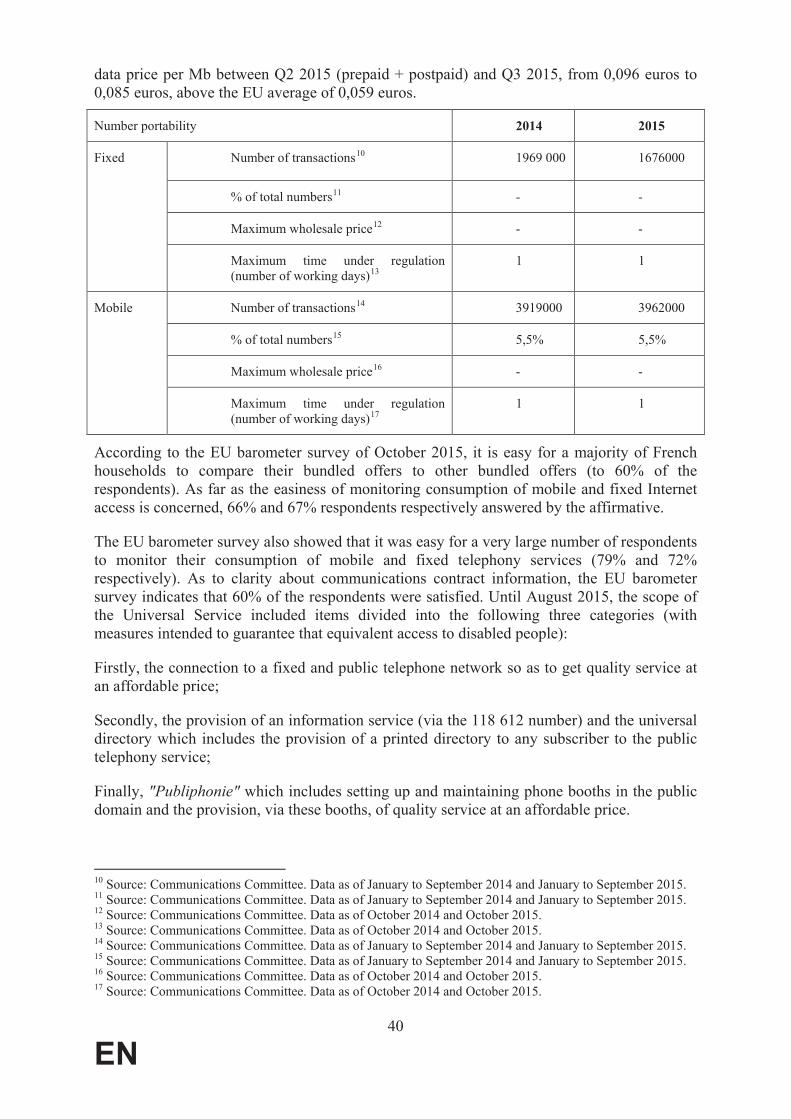
40
EN
data price per Mb between Q2 2015 (prepaid + postpaid) and Q3 2015, from 0,096 euros to 0,085 euros, above the EU average of 0,059 euros.
Number portability 2014 2015
Fixed Number of transactions10 1969 000 1676000
% of total numbers11 - -
Maximum wholesale price12 - -
Maximum time under regulation (number of working days)13
1 1
Mobile Number of transactions14 3919000 3962000
% of total numbers15 5,5% 5,5%
Maximum wholesale price16 - -
Maximum time under regulation (number of working days)17
1 1
According to the EU barometer survey of October 2015, it is easy for a majority of French households to compare their bundled offers to other bundled offers (to 60% of the respondents). As far as the easiness of monitoring consumption of mobile and fixed Internet access is concerned, 66% and 67% respondents respectively answered by the affirmative.
The EU barometer survey also showed that it was easy for a very large number of respondents to monitor their consumption of mobile and fixed telephony services (79% and 72% respectively). As to clarity about communications contract information, the EU barometer survey indicates that 60% of the respondents were satisfied. Until August 2015, the scope of the Universal Service included items divided into the following three categories (with measures intended to guarantee that equivalent access to disabled people):
Firstly, the connection to a fixed and public telephone network so as to get quality service at an affordable price;
Secondly, the provision of an information service (via the 118 612 number) and the universal directory which includes the provision of a printed directory to any subscriber to the public telephony service;
Finally, "Publiphonie" which includes setting up and maintaining phone booths in the public domain and the provision, via these booths, of quality service at an affordable price.
10 Source: Communications Committee. Data as of January to September 2014 and January to September 2015.11 Source: Communications Committee. Data as of January to September 2014 and January to September 2015.12 Source: Communications Committee. Data as of October 2014 and October 2015.13 Source: Communications Committee. Data as of October 2014 and October 2015.14 Source: Communications Committee. Data as of January to September 2014 and January to September 2015.15 Source: Communications Committee. Data as of January to September 2014 and January to September 2015.16 Source: Communications Committee. Data as of October 2014 and October 2015.17 Source: Communications Committee. Data as of October 2014 and October 2015.
41
EN
The law for “growth, activity and equality in economic opportunities” (loi pour la croissance,
l'activité et l'égalité des chances économiques), adopted on August 6th 2015, changed the French universal service scope, deleting the third component (the obligation of providing a public payphones services) and no more obliging to provide a printed directory (Electronic directory possible instead).

42
EN
CROATIA
1. MEASURES FACILITATING DEPLOYMENT AND INVESTMENTS IN HIGH SPEED
NETWORKS
1.1. Spectrum
Harmonised bands MHz spectrum assigned1 % of the harmonised band assigned
800MHz 60 100
900MHz 70 100
1500MHz 0 0
1800MHz 150 100
2000MHz paired 90 75
2600MHz 0 0
3400-3600MHz 70 35
3600-3800MHz 0 0
Overall Croatia has assigned 41.2% of the overall harmonised spectrum for BB.
1.2. State of transposition of the BB CRD (Directive 2014/61/EU)
Although the adoption process of the national legislation transposing the Directive is on –going, Croatia has not yet notified the Commission any measure transposing the Directive.
1.3. EU and National investments in broadband
Fixed basic broadband coverage of rural areas is below the EU average (81.5% vs 90.6%).
Croatia has devised a Strategy for Broadband Development in the Republic of Croatia for 2012-2015 published by the Government in October 2011. A new Strategy for Broadband Development in the Republic of Croatia for the period 2016-2020 has been prepared and is pending the adoption in 2016. Croatia’s overall broadband objectives are convergent with the DAE (100 % coverage with 30 Mbps until 2020; 50 % take-up rate for 100 Mbps). The NBP is accompanied by the “National Framework Programme for the Development of Broadband Infrastructure in Areas Lacking Sufficient Commercial Interest for Investments”. The framework document establishes the procedures for state aid and public deployment of ICT infrastructures in access networks, including investment models2. State aid for mobile technologies is possible as well. There is currently a state aid program for backhaul networks under development. In Croatia, there are no regional broadband plans available.
1 Including guard bands2 Model A: private design, build, operate with public grants; Model B: public design, build, operate; Model C: public-private partnership

43
EN
Croatia takes part in a cross-border broadband roll-out project with Slovenia (RUNE) which has been shortlisted for technical assistance by the World Bank in the context of the Connected Communities to prepare bankable business case for funding from Connecting Europe Facility, European Fund for Strategic Investments and possible other sources of financing.
Operational programme for Competitiveness and Cohesion (OP) includes funding of broadband investments, for the period 2014-2020, for overall 209 million EUR.
2. COMPETITIVE LANDSCAPE
Fixed broadband subscriptions - operator market shares3
Incumbent market share New entrants market share
2014 2015 (EU average) 2014 2015 (EU average)
55.2% 51.4% (40.6%) 44.8% 48.6% (59.4%)
Fixed broadband subscriptions - technology market shares4
DSL (including VDSL) (EU) Cable Modem (EU) FTTH/B (EU) Other5 (EU)
82.1% (69.2%) 12.4% (18.6%) 2.1% (8.7%) 3.4% (3.5%)
Croatia faces a number of challenges concerning connectivity, especially with regards to the NGA networks which is significantly below EU average. There has been however a slight increase of FTTH/B connections (from 1.2% to 2.1% in July 2015).
Mobile sector6
Number of MNOs Market shares of the first 2 MNOs Number of MVNOs (overall share)
3 47% 35% 0 (0%)
3. REGULATORY FUNCTION
New entrants` DSL subscriptions by type of access at EU level (VDSL and VULA excluded)7
Own network (EU) Full ULL (EU) Shared Access (EU) Bitstream (EU) Resale (EU)
0 (0.6%) 59.8% (78.1%) 0.1% (2.3%) 40.1% (12%) N/A (7%)
LLU price:5.9 EUR (EU Average:9.5EUR)8
3 Source: Communications Committee. Data as of July 2014 and July 2015.4 Source: Communications Committee. Data as of July 20155 Including fixed wireless.6 Source: Communications Committee. Data as of October 2015.7 Source: Communications Committee. Data as of July 2015.8 Full LLU monthly average total cost in EUR; source: Communications Committee. Data as of October 2015.
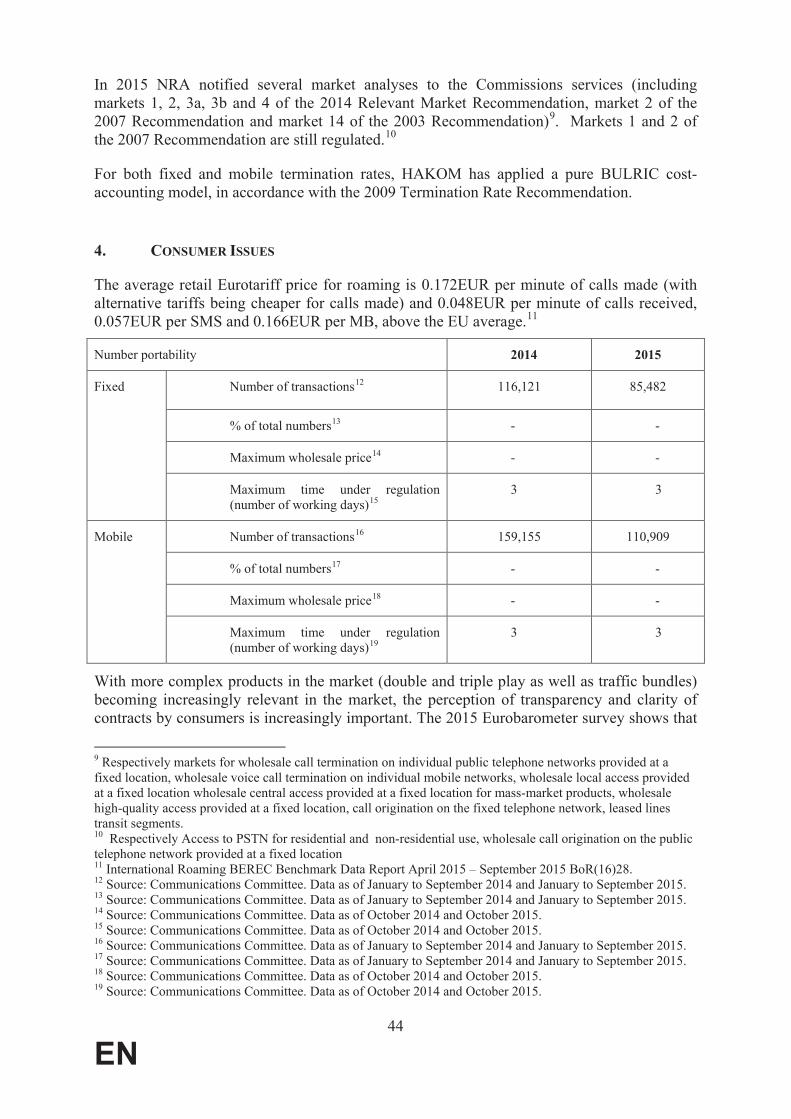
44
EN
In 2015 NRA notified several market analyses to the Commissions services (including markets 1, 2, 3a, 3b and 4 of the 2014 Relevant Market Recommendation, market 2 of the 2007 Recommendation and market 14 of the 2003 Recommendation)9. Markets 1 and 2 of the 2007 Recommendation are still regulated.10
For both fixed and mobile termination rates, HAKOM has applied a pure BULRIC cost-accounting model, in accordance with the 2009 Termination Rate Recommendation.
4. CONSUMER ISSUES
The average retail Eurotariff price for roaming is 0.172EUR per minute of calls made (with alternative tariffs being cheaper for calls made) and 0.048EUR per minute of calls received, 0.057EUR per SMS and 0.166EUR per MB, above the EU average.11
Number portability 2014 2015
Fixed Number of transactions12 116,121 85,482
% of total numbers13 - -
Maximum wholesale price14 - -
Maximum time under regulation (number of working days)15
3 3
Mobile Number of transactions16 159,155 110,909
% of total numbers17 - -
Maximum wholesale price18 - -
Maximum time under regulation (number of working days)19
3 3
With more complex products in the market (double and triple play as well as traffic bundles) becoming increasingly relevant in the market, the perception of transparency and clarity of contracts by consumers is increasingly important. The 2015 Eurobarometer survey shows that
9 Respectively markets for wholesale call termination on individual public telephone networks provided at a fixed location, wholesale voice call termination on individual mobile networks, wholesale local access provided at a fixed location wholesale central access provided at a fixed location for mass-market products, wholesalehigh-quality access provided at a fixed location, call origination on the fixed telephone network, leased lines transit segments.10 Respectively Access to PSTN for residential and non-residential use, wholesale call origination on the public telephone network provided at a fixed location11 International Roaming BEREC Benchmark Data Report April 2015 – September 2015 BoR(16)28.12 Source: Communications Committee. Data as of January to September 2014 and January to September 2015.13 Source: Communications Committee. Data as of January to September 2014 and January to September 2015.14 Source: Communications Committee. Data as of October 2014 and October 2015.15 Source: Communications Committee. Data as of October 2014 and October 2015.16 Source: Communications Committee. Data as of January to September 2014 and January to September 2015.17 Source: Communications Committee. Data as of January to September 2014 and January to September 2015.18 Source: Communications Committee. Data as of October 2014 and October 2015.19 Source: Communications Committee. Data as of October 2014 and October 2015.

45
EN
Croatian consumers can easily compare bundle offers (76%, above EU average), however it is less easy to monitor consumption for mobile (63%, EU average 69%) than for fixed (64%, EU average 71%), whilst there is less satisfaction with regard to contract information (19% unsatisfied, EU 16%).
Regarding the scope of the universal service, broadband is included: the universal service operator has the obligation to provide data communications at a minimum speed of 1 Mbps from 1 January 2015.

46
EN
Ireland
1. MEASURES FACILITATING DEPLOYMENT AND INVESTMENTS IN HIGH SPEED
NETWORKS
1.1. Spectrum
Harmonised bands MHz spectrum assigned1 % of the harmonised band assigned
800MHz 60 MHz 100%
900MHz 70 MHz 100%
1500MHz N/A N/A
1800MHz 150 MHz 100%
2000MHz paired 120 MHz 100%
2600MHz N/A N/A
3400-3600MHz 160 MHz 80%
3600-3800MHz 200 MHz 100%
Overall Ireland has assigned 73.8% of the overall harmonised spectrum for BB (EU average is 69%).
In terms of overall national spectrum policy, the National Broadband Plan set a commitment to review and update national spectrum policy. The 700 MHz band is currently allocated to the broadcasting service and a number of DTT transmitters have been assigned frequencies in this band. In relation to the 3.6GHz band, the existing Fixed Wireless Access Local Area (FWALA) licences in the band would not be extended beyond 31 July 2017 in order to provide for the introduction of national and regional licencing.
1.2. State of transposition of the BB CRD (Directive 2014/61/EU)
Ireland has not yet notified to the Commission any measures transposing the Directive. The finalisation of the adaption process of the national legislation transposing the Directive is on-going. Ireland has advised that the adaptations required to transpose the main elements of the Directive are expected to be transposed by 1 July 2016.
1.3. EU and National investments in broadband
Rural fixed broadband coverage increased slightly to 92% of households in 2015, just above the EU28 average of 90.6%.
1 Including guard bands

47
EN
The Irish Government's National Broadband Plan (NBP) was published in August 2012, and runs under the title Delivering a Connected Society: A National Broadband Plan for Ireland.Ireland has put forward a threefold set of broadband targets: 70Mbps - 100Mbps available toat least 50 % of the population; at least 40Mbps to at least a further 20 % of the population and a minimum of 30Mbps available to all. Since publication of the NBP the roll out of high speed services accelerated, reducing the addressable area for state intervention.
Commercial rollout in urban areas accelerated but due to the low population density in some parts of the country and insufficient investments in broadband infrastructure in those areas, the speeds available in urban areas are demonstrably better than those available in rural areas. The Irish Government therefore agreed on the need to pursue a more ambitious, future proof,state-led intervention with the objective of dealing with the connectivity challenge in rural areas through a combination of commercial and state investment. As public authorities cannot intervene where commercial investors have plans to roll out services under state aid guidelines, a national mapping exercise was carried out to identify those areas of the country that will have access to commercial high speed broadband services. In December 2015, the Irish Government launched the procurement process to deliver the State-led intervention to the areas identified as not having access to commercial high speed broadband services. Ireland estimates EUR75 million of investment into digital society should come from the EU’s structural funds.
2. COMPETITIVE LANDSCAPE
Fixed broadband subscriptions - operator market shares2
Incumbent market share New entrants market share
2014 2015 (EU average) 2014 2015 (EU average)
37.3% 35.5% (40.6%) 62.7% 64.5% (59.4%)
Fixed broadband subscriptions - technology market shares3
DSL (including VDSL) (EU) Cable Modem (EU) FTTH/B (EU) Other4 (EU)
65.9% (69.2%) 28.5% (18.6%) 0.3% (8.7%) 5.2% (3.5%)
Mobile sector5
Number of MNOs Market shares of the first 2 MNOs Number of MVNOs
3 38% 35% 6 (7.9%)
3. REGULATORY FUNCTION
New entrants` DSL subscriptions by type of access at EU level (VDSL and VULA excluded)6
2 Source: Communications Committee. Data as of July 2014 and July 2015.3 Source: Communications Committee. Data as of July 20154 Including fixed wireless access.5 Source: Communications Committee. Data as of October 2015.

48
EN
Own network (EU) Full ULL (EU) Shared Access (EU) Bitstream (EU) Resale (EU)
0% (0.6%) 4% (78.1%) 20.6% (2.3%) 75.4% (12 %) 0% (7%)
LLU price: EUR10.5 (EU average: EUR9.5)7
Ex ante regulation is still applied in the former market 2 (call origination on fixed networks) and in the former market 1 (access to PSTN) of the 2007 Relevant Market Recommendation. Ex ante regulation is still applied in the former market 10 (transit on fixed networks) and in the former market 15 (access and call origination on mobile networks) of the 2003 Relevant Market Recommendation. The cost accounting methodology for fixed termination rates appears to be consistent with the 2009 Termination Rate Recommendation (pure BU LRIC is applied). With regard to mobile termination rates there is no glide path in operation in Ireland because of the ongoing proceedings.
4. CONSUMER ISSUES
The average retail Eurotariff price for roaming is 0,156EUR per minute of calls made and 0,02EUR per minute of calls received (with alternative tariffs respectively more expensive for calls made and cheaper for calls received), 0,052 per SMS and 0,036EUR per MB, generally close to the EU average, except for data roaming which is well below the regulated cap8.
Number portability 2014 2015
Fixed Number of transactions9 70457 65136
% of total numbers10 4.6% 4.4%
Maximum wholesale price11 4 4
Maximum time under regulation (number of working days)12
1 1
Mobile Number of transactions13 301855 268898
% of total numbers14 6.2% 5.5%
Maximum wholesale price15 2 2
Maximum time under regulation (number of working days)16
1 1
6 Source: Communications Committee. Data as of July 2015.7 Full LLU monthly average total cost in EUR; source: Communications Committee. Data as of October 2015. 8 International Roaming BEREC Benchmark Data Report April 2015 – September 2015 BoR(16)28.9 Source: Communications Committee. Data as of January to September 2014 and January to September 2015.10 Source: Communications Committee. Data as of January to September 2014 and January to September 2015.11 Source: Communications Committee. Data as of October 2014 and October 2015.12 Source: Communications Committee. Data as of October 2014 and October 2015.13 Source: Communications Committee. Data as of January to September 2014 and January to September 2015.14 Source: Communications Committee. Data as of January to September 2014 and January to September 2015.15 Source: Communications Committee. Data as of October 2014 and October 2015.16 Source: Communications Committee. Data as of October 2014 and October 2015.

49
EN
With more complex products in the market (double and triple play) becoming increasingly relevant in the market, the perception of transparency and clarity of contracts by consumers is increasingly important with 73% of consumers (EU28 69%) agreeing that it is easy to compare bundled offers. The 2015 Eurobarometer survey shows that Ireland is the country where respondents are most likely to say they considered switching, but they ranked top in terms of satisfaction with the service they were getting.

50
EN
Italy
1. MEASURES FACILITATING DEPLOYMENT AND INVESTMENTS IN HIGH SPEED
NETWORKS
1.1. Spectrum
Harmonised bands MHz spectrum assigned1 % of the harmonised band assigned
800MHz 60 100%
900MHz 70 100%
1500MHz 40 100%
1800MHz 140 93,3%
2000MHz paired 120 100%
2600MHz 150 78,9%
3400-3600MHz 126 63%
3600-3800MHz 0 0%
Overall Italy has assigned 64,7% of the overall harmonised spectrum for BB. Apart from the 3600-3800MHz band, the remaining spectrum is reserved for public security and defence purposes.
In 2015 Italy assigned via an auction 40MHz in two lots in the 1500MHz band for an overall amount of approx. 462milEUR.
After investigation of the Commission services in 2015, the Italian authorities have also reassessed the market demand and the existing use of the 3600-3800MHz band and adopted the tender rules in order to assign different kind of lots for urban and rural coverage, while ensuring protection of existing services. Similarly, following investigations of the Commission services, the general national allocation frequency plan has been adopted, including transposition of the modifications of the SRD decision (Decision 2013/752/EU);finally rules for the assignments of available rights of use for radio broadcasting in the AM band have been adopted.
On the other hand, the Italian authorities have still to finalise the full implementation of the measures addressing long-standing Commission services investigation aiming at eliminating international interferences of broadcasting transmissions to neighbouring countries.
1.2. State of transposition of the BB CRD (Directive 2014/61/EU)
The adoption of the national legislation transposing the Directive was completed in March 2016 through notification to the Commission of the Legislative Decree 33/2015, integrating
1 Including guard bands.

51
EN
some measures concerning the National database for infrastructure and the in-building equipment adopted already in 2014.
1.3. EU and National investments in broadband
Fixed basic broadband coverage of rural areas is slightly above the EU average (92,2% vs 90,6%). Indeed since 2009 a National Broadband plan (Piano Nazionale Banda Larga) has been implemented with a view to ensure full coverage for basic broadband (with a mix of fixed and wireless solutions), in particular by means of fibre upgrade of backhaul links to central switches. The National Ultra-Broadband plan (Strategia Nazionale per la Banda
Ultra-Larga - SNBUL) approved by the Council of Ministers in March 2015, on the other hand, aims at catching up the significant delay in NGA coverage2 also by means of state aids targeting in particular the access network, with a view to ensure 100% coverage with 30Mbps and coverage for 85% of population with 100Mbps broadband infrastructure by 2020. A new state aid strategy, coordinated at national level and targeting in particular NGA coverage in white areas, is about to be notified to the Commission; for white areas overall 2,2billionEURof national funds (out of overall 5billions planned for broadband in general) have been allocated.
In this regard, the use of several European public financing sources is also planned. In particular, 18 Regional ERDF Operational Programs, one national OP and 21 European Agricultural Fund for Rural Development (EAFRD) Programs including the funding of broadband investments, for approx. 1,4bilEUR. Moreover, the European Fund for Strategic Investment (EFSI) set up within EIB in line with the Juncker plan has granted a landing facility to a private investment for deployment of FTTC. Finally, Italian project promoters have submitted some well advanced projects for technical assistance under the Connected Communities Initiative3 (CCI), a joint partnership between the European Commission and the World Bank
2. COMPETITIVE LANDSCAPE
Fixed broadband subscriptions - operator market shares4
Incumbent market share New entrants market share
July 2014 July 2015 (EU average) July 2014 July 2015 (EU average)
48,8% 47,5% (40,6%) 51,2% 52,5% (59,4%)
Fixed broadband subscriptions - technology market shares5
DSL (including VDSL) (EU) Cable Modem (EU) FTTH/B (EU) Other6 (EU)
2 According to DESI index, NGA coverage increased from 36% to 44% in June 2015, but it is still one but last in the EU.3 https://ec.europa.eu/digital-single-market/news/connected-communities-initiative.. The best projects of Connected Communities are expected to be eligible for funding from Connecting Europe Facility, European Fund for Strategic Investments and possibly other sources of financing, likely private financing and financial instruments with European, National and Municipal grants.4 Source: Communications Committee. Data as of July 2014 and July 2015.5 Source: Communications Committee. Data as of July 20156 Including fixed wireless.

52
EN
90.9% (69,2%) 0 (18,6%) 4,9%7 (8,7%) 4,2% (3,5%)
The main market trends of past years have been confirmed: slight but consistent reduction of incumbent's market shares, absence of cable, predominance of copper based x-DSL technology, (also for high speed networks by means of VDSL, more than tripled in 2015), FTTH/B connections slightly increasing, other access technologies, represented predominantly by fixed wireless, continuing to develop, above the EU average.
Mobile sector8
Number of MNOs Market shares of the first 2 MNOs Number of MVNOs (overall share)
4 32% 27% 15(7,2%)
During 2015 the merger between the third and fourth mobile network operators (WIND, also active in the fixed market, and H3G Italia, only active in the mobile sector) has been announced and it is currently under examination by the European Commission.
3. REGULATORY FUNCTION
New entrants` DSL subscriptions by type of access at EU level (VDSL and VULA excluded)9
Own network (EU) Full ULL (EU) Shared Access (EU) Bitstream (EU) Resale (EU)
0 (0,6%) 71,4% (78,1%) 0,8% (2,3%) 27,8% (12%) 0 (7%)
LLU price: 9,6EUR (EU Average; 9,5EUR)10
In 2015 AGCOM notified several market analyses to the Commission (including markets 2, 3a, 3b, and 4 of the 2014 Recommendation and market 1 of the 2007 Recommendation11), catching up part of the delays of past years.
In 2015 the Commission services investigated the delays in conducting a market analysis in the three remaining regulated markets, for which it had been more than three years since the previous analysis had expired, including market 10 of the 2003 Recommendation (Wholesale transit services in the fixed public telephone network), market 2 of the 2007 Recommendation (Wholesale call origination on the public telephone network provided at a fixed location) and market 1 of the 2014 Recommendation (Wholesale fixed voice call termination), which are therefore still subject to the old regulatory obligations. All other markets included in the 2007 and 2003 Recommendations, on the contrary, have been deregulated.
For both fixed and mobile termination rates, AGCOM has applied a pure BU-LRIC cost model, in accordance with the 2009 Recommendation on Termination Rates.
7 This figure is based on a national data gathering methodology currently subject to amendments as from the forthcoming reporting periods.8 Source: Communications Committee. Subscribers data as of October 2015.9 Source: Communications Committee. Data as of July 2015.10 Full LLU monthly average total cost in EUR; source: Communications Committee. Data as of October 2015.11 Respectively voice call termination on mobile networks, wholesale local access, wholesale central access, wholesale high-quality access and access to PSTN for residential & non-residential use.
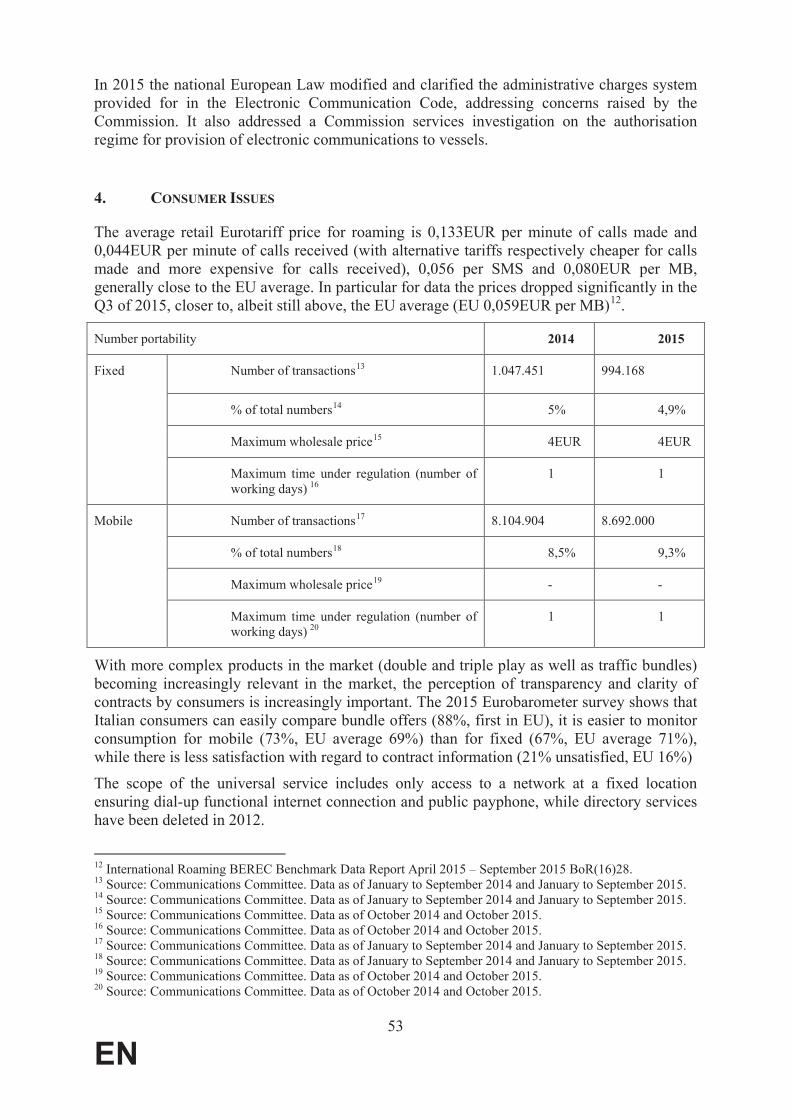
53
EN
In 2015 the national European Law modified and clarified the administrative charges system provided for in the Electronic Communication Code, addressing concerns raised by the Commission. It also addressed a Commission services investigation on the authorisation regime for provision of electronic communications to vessels.
4. CONSUMER ISSUES
The average retail Eurotariff price for roaming is 0,133EUR per minute of calls made and 0,044EUR per minute of calls received (with alternative tariffs respectively cheaper for calls made and more expensive for calls received), 0,056 per SMS and 0,080EUR per MB, generally close to the EU average. In particular for data the prices dropped significantly in the Q3 of 2015, closer to, albeit still above, the EU average (EU 0,059EUR per MB)12.
Number portability 2014 2015
Fixed Number of transactions13 1.047.451 994.168
% of total numbers14 5% 4,9%
Maximum wholesale price15 4EUR 4EUR
Maximum time under regulation (number of working days) 16
1 1
Mobile Number of transactions17 8.104.904 8.692.000
% of total numbers18 8,5% 9,3%
Maximum wholesale price19 - -
Maximum time under regulation (number of working days) 20
1 1
With more complex products in the market (double and triple play as well as traffic bundles) becoming increasingly relevant in the market, the perception of transparency and clarity of contracts by consumers is increasingly important. The 2015 Eurobarometer survey shows that Italian consumers can easily compare bundle offers (88%, first in EU), it is easier to monitor consumption for mobile (73%, EU average 69%) than for fixed (67%, EU average 71%), while there is less satisfaction with regard to contract information (21% unsatisfied, EU 16%)
The scope of the universal service includes only access to a network at a fixed location ensuring dial-up functional internet connection and public payphone, while directory services have been deleted in 2012.
12 International Roaming BEREC Benchmark Data Report April 2015 – September 2015 BoR(16)28.13 Source: Communications Committee. Data as of January to September 2014 and January to September 2015.14 Source: Communications Committee. Data as of January to September 2014 and January to September 2015.15 Source: Communications Committee. Data as of October 2014 and October 2015.16 Source: Communications Committee. Data as of October 2014 and October 2015.17 Source: Communications Committee. Data as of January to September 2014 and January to September 2015.18 Source: Communications Committee. Data as of January to September 2014 and January to September 2015.19 Source: Communications Committee. Data as of October 2014 and October 2015.20 Source: Communications Committee. Data as of October 2014 and October 2015.

54
EN
Cyprus
1. MEASURES FACILITATING DEPLOYMENT AND INVESTMENTS IN HIGH SPEED
NETWORKS
1.1. Spectrum
Harmonised bands MHz spectrum assigned1 % of the harmonised band assigned
800MHz 0 0
900MHz 70 100
1500MHz 0 0
1800MHz 150 100
2000MHz paired 90 75
2600MHz 0 0
3400-3600MHz 0 0
3600-3800MHz 0 0
Overall, Cyprus has assigned 30.1% of the overall harmonised spectrum for broadband. Regarding the 800 MHz band, Cyprus benefited from a derogation running until the spectrum issues encountered by the Republic of Cyprus in the 800 MHz band are effectively resolved or until 31 December 2015, whichever occurs first. Cyprus requested an extension of the derogation pursuant to Article 6(4) RSPP until 31 December 2016 or until the abovementioned authorisation of the use of the 800 MHz band is completed, whicheveroccurs first.
On 22 January 2016, Cyprus launched a competitive procedure for the assignment of three rights of use of radio frequency in the 800 and 2600 MHz bands. The available spectrum, to be granted through a multi-round ascending auction, concerns 3 licenses, each comprising of 2x10 MHz in the 800 MHz band and 2x20 MHz FDD & 1x15MHz TDD in the 2600 MHz band. The licensee should set up a 4G broadband network, with speeds of at least 30 Mbps, covering 50% until end-2018 and 75% until end-2020 of the territory which is under the effective control of the Republic of Cyprus. The coverage obligation may be fulfilled with spectrum assigned to the licensee in other bands. The reserve price is set at EUR 5 million.
1.2. State of transposition of the BB CRD (Directive 2014/61/EU)
While Cyprus has completed the public consultation of the draft text transposing the Directive, the relevant legislation has not been adopted yet.
1 Including guard bands.

55
EN
1.3. EU and National investments in broadband
Fixed basic broadband coverage of rural areas reached 99.9% in Cyprus, above the EU average of 90.6%. Since February 2012, Cyprus has launched its “Digital Strategy, in line with the DAE (100 % coverage with 30 Mbps until 2020; 50 % take-up rate for 100 Mbps). The Strategy is divided into 6 objectives and envisages, in addition to developing future-proof network infrastructure, to promote the digitisation of public services, to increase digital literacy, to foster the digital economy, and to use ICT for the environment. Cyprus follows a market-based approach to achieve its targets.
Some public financing sources are being planned for the deployment of NGA networks. A competitiveness & sustainable development OP includes a total of EUR 19 000 000 (in addition to EUR 3 350 000 national contribution) funding for ultra-high-speed broadband network deployment.
2. COMPETITIVE LANDSCAPE
Fixed broadband subscriptions - operator market shares2
Incumbent market share New entrants market share
July 2014 July 2015 (EU average) July 2014 July 2015 (EU average)
66.1% 63.1% (40.6%) 33.9% 36.9% (59.4%)
Fixed broadband subscriptions - technology market shares3
DSL (including VDSL) (EU) Cable Modem (EU) FTTH/B (EU) Other4 (EU)
80.5% (69.2%) 19.1% (18.6%) 0.2% (8.7%) 0.2% (3.5%)
The main market trends of past years continued throughout 2015 with the slow erosion of the incumbent's market share and the significant rise of cable penetration.
Mobile sector5
Number of MNOs Market shares of the first 2 MNOs Number of MVNOs (overall share)
3 63% 32% 2 (1%)
While the market share of the incumbent's mobile arm continued to shrink (down from 65.9% a year before), it is still significantly higher than the EU average (33.7%).
3. REGULATORY FUNCTION
New entrants` DSL subscriptions by type of access at EU level (VDSL and VULA excluded)6
2 Source: Communications Committee. Data as of July 2014 and July 2015.3 Source: Communications Committee. Data as of July 20154 Including fixed wireless.5 Source: Communications Committee. Data as of October 2015.
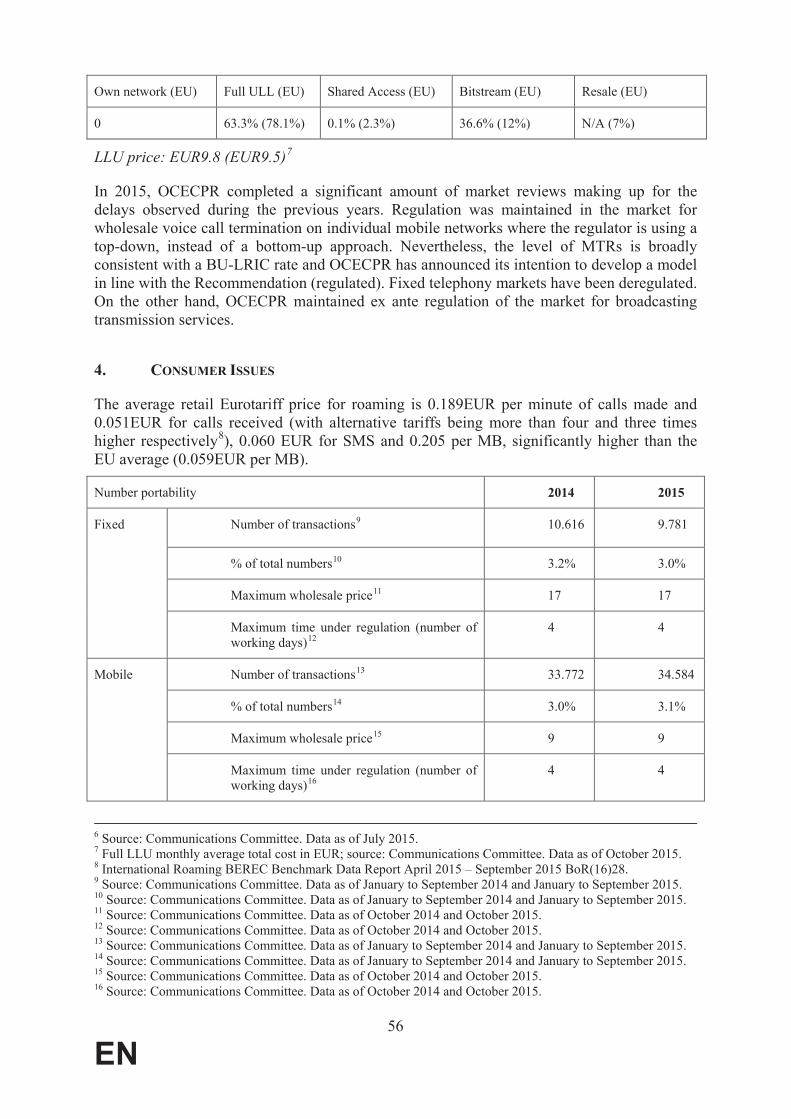
56
EN
Own network (EU) Full ULL (EU) Shared Access (EU) Bitstream (EU) Resale (EU)
0 63.3% (78.1%) 0.1% (2.3%) 36.6% (12%) N/A (7%)
LLU price: EUR9.8 (EUR9.5)7
In 2015, OCECPR completed a significant amount of market reviews making up for the delays observed during the previous years. Regulation was maintained in the market for wholesale voice call termination on individual mobile networks where the regulator is using a top-down, instead of a bottom-up approach. Nevertheless, the level of MTRs is broadly consistent with a BU-LRIC rate and OCECPR has announced its intention to develop a model in line with the Recommendation (regulated). Fixed telephony markets have been deregulated. On the other hand, OCECPR maintained ex ante regulation of the market for broadcasting transmission services.
4. CONSUMER ISSUES
The average retail Eurotariff price for roaming is 0.189EUR per minute of calls made and 0.051EUR for calls received (with alternative tariffs being more than four and three times higher respectively8), 0.060 EUR for SMS and 0.205 per MB, significantly higher than the EU average (0.059EUR per MB).
Number portability 2014 2015
Fixed Number of transactions9 10.616 9.781
% of total numbers10 3.2% 3.0%
Maximum wholesale price11 17 17
Maximum time under regulation (number of working days)12
4 4
Mobile Number of transactions13 33.772 34.584
% of total numbers14 3.0% 3.1%
Maximum wholesale price15 9 9
Maximum time under regulation (number of working days)16
4 4
6 Source: Communications Committee. Data as of July 2015.7 Full LLU monthly average total cost in EUR; source: Communications Committee. Data as of October 2015. 8 International Roaming BEREC Benchmark Data Report April 2015 – September 2015 BoR(16)28.9 Source: Communications Committee. Data as of January to September 2014 and January to September 2015.10 Source: Communications Committee. Data as of January to September 2014 and January to September 2015.11 Source: Communications Committee. Data as of October 2014 and October 2015.12 Source: Communications Committee. Data as of October 2014 and October 2015.13 Source: Communications Committee. Data as of January to September 2014 and January to September 2015.14 Source: Communications Committee. Data as of January to September 2014 and January to September 2015.15 Source: Communications Committee. Data as of October 2014 and October 2015.16 Source: Communications Committee. Data as of October 2014 and October 2015.
57
EN
The Eurobarometer survey shows that Cypriot consumers can easily compare bundle offers (79%, significantly higher than the EU average of 69%), and believe it is easier to monitor consumption for mobile (78%, EU average 69%)) rather than for fixed (62%, EU average 71%). The Cypriot consumers are highly satisfied with the contract information they receive (81%, EU average 68%).
The scope of the Universal Service includes access to a network at a fixed location and e-Directory services.

58
EN
Latvia
1. MEASURES FACILITATING DEPLOYMENT AND INVESTMENTS IN HIGH SPEED
NETWORKS
1.1. Spectrum
Total compliance with the RSPP spectrum target is 95,1% the second in Europe after Germany. There is almost no remaining unassigned spectrum. The total assigned spectrum excluding the unpaired 2 GHz band is 980 MHz compared to the EU average of 707,3 MHz.
Harmonised bands MHz spectrum assigned1 % of the harmonised band assigned
800MHz 60 100%
900MHz 70 100%
1500MHz Harmonised during 2015, awaiting assignment. 0
1800MHz 150 100%
2000MHz paired 120 100%
2600MHz 190 100%
3400-3600MHz 190 95%
3600-3800MHz 200 100%
In Latvia there are currently no problems with spectrum assignment. Only the 3400-3600MHz band is assigned at 95% and the remaining 10MHz are used as guard band.
As regards the 700 MHz band which is presently used for DTT services the Latvian authorities have informed during the last meeting of the Council working group on UHF proposal that they doubt being able to meet the 2020 deadline for releasing this band. Latvia informed that due to licence duration on the 694-790 MHz band that extends past the year 2020 and cross-border coordination issues with non-EU Member States, they plan to request a 2 year derogation.
1.2. State of transposition of the BB CRD (Directive 2014/61/EU)
Finalisation of the adoption process of the national legislation transposing the Directive is on-going. Latvia has not yet notified to the Commission any measure transposing the Directive.
1.3. EU and National investments in broadband
Latvia’s National Broadband Plan is entitled “The conception of next generation broadband electronic communication network development 2013-2020” and was approved by the Government in 2012. Latvia has set as its national broadband objectives to reach 100 %
1 Including guard bands

59
EN
coverage with 30 Mbps until 2020 and 50 % household penetration with 100 Mbps service until 2020.
The overall goal is to ensure the availability of high-speed broadband network access (NGA) in scarcely populated, remote territories where telecommunications providers do not see any commercial interest. 2015 interim comparison of planned and actual outcomes in the process of broadband deployment yields the following picture: planned set up of NGA points in rural areas: 165 (actual outcome: 177); planned siting of optical cable connections between main grid and access points: 1,900 km (actual outcome: 1,813 km).
Currently, there are no specific financial instruments dedicated to broadband deployment in Latvia. Largest part of financial aid provided by the European funds was invested - to the project “Next generation electronic communications network deployment in rural areas” from 2012-2015. However, European funds do provide some financial aid for infrastructural projects, notably via ERDF for almost 44mil. Euro.
2. COMPETITIVE LANDSCAPE
Fixed broadband subscriptions - operator market shares2
Incumbent market share New entrants market share
2014 2015 (EU average) 2014 2015 (EU average)
57.1% 58,8% (40.6%) 42.9% 41.3 (59.4%)
Fixed broadband subscriptions - technology market shares3
DSL (including VDSL) (EU) Cable Modem (EU) FTTH/B (EU) Other4 (EU)
28.1% (69.2%) 4.0% (18,6%) 59.7% (8,7%) 8.2% (3,5%)
Mobile sector5
Number of MNOs Market shares of the first 2 MNOs Number of MVNOs (overall share)
4 44% 24% 1
3. REGULATORY FUNCTION
New entrants` DSL subscriptions by type of access at EU level (VDSL and VULA excluded)6
Own network (EU) Full ULL (EU) Shared Access (EU) Bitstream (EU) Resale (EU)
0 (0.6%) 0,6% (78,1%) 1% (2,3%) 28,3% (12%) 70.1% (7%)
LLU price:9,9 EUR (EU Average 9,5 EUR)7
2 Source: Communications Committee. Data as of July 2014 and July 2015.3 Source: Communications Committee. Data as of July 2015.4 Including fixed wireless.5 Source: Communications Committee. Data as of October 2015.6 Source: Communications Committee. Data as of July 2015.
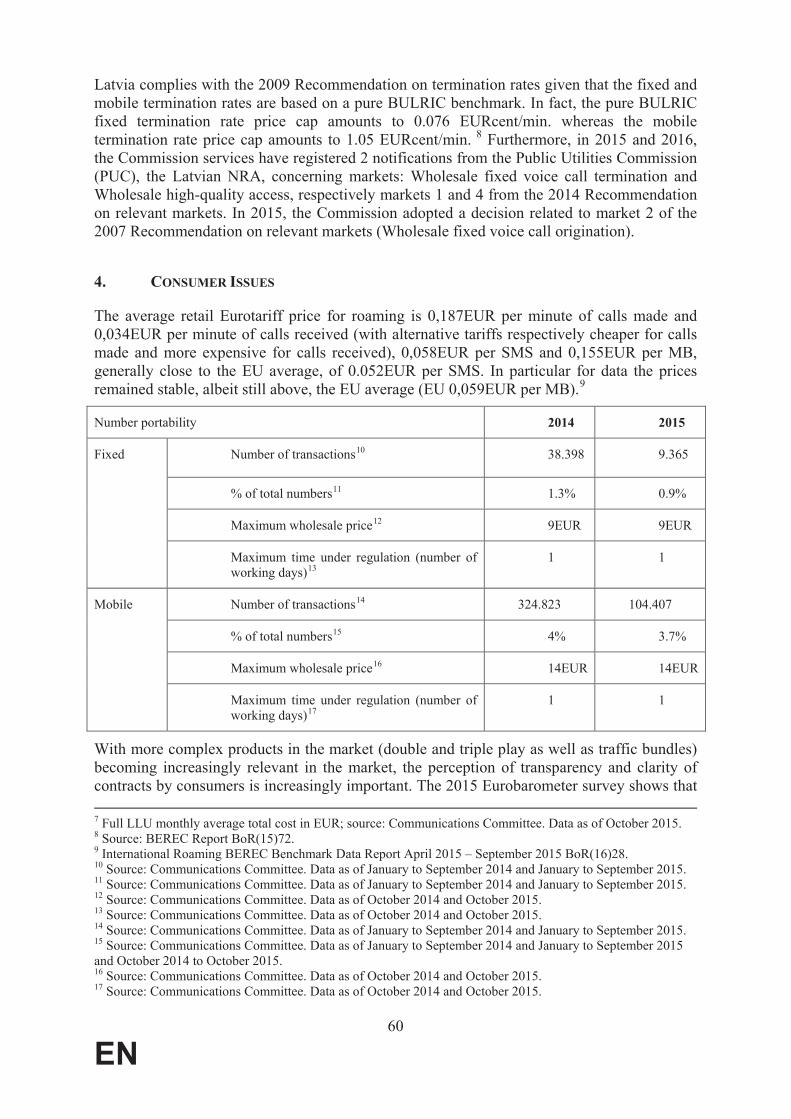
60
EN
Latvia complies with the 2009 Recommendation on termination rates given that the fixed and mobile termination rates are based on a pure BULRIC benchmark. In fact, the pure BULRIC fixed termination rate price cap amounts to 0.076 EURcent/min. whereas the mobile termination rate price cap amounts to 1.05 EURcent/min. 8 Furthermore, in 2015 and 2016, the Commission services have registered 2 notifications from the Public Utilities Commission (PUC), the Latvian NRA, concerning markets: Wholesale fixed voice call termination and Wholesale high-quality access, respectively markets 1 and 4 from the 2014 Recommendation on relevant markets. In 2015, the Commission adopted a decision related to market 2 of the 2007 Recommendation on relevant markets (Wholesale fixed voice call origination).
4. CONSUMER ISSUES
The average retail Eurotariff price for roaming is 0,187EUR per minute of calls made and 0,034EUR per minute of calls received (with alternative tariffs respectively cheaper for calls made and more expensive for calls received), 0,058EUR per SMS and 0,155EUR per MB, generally close to the EU average, of 0.052EUR per SMS. In particular for data the prices remained stable, albeit still above, the EU average (EU 0,059EUR per MB).9
Number portability 2014 2015
Fixed Number of transactions10 38.398 9.365
% of total numbers11 1.3% 0.9%
Maximum wholesale price12 9EUR 9EUR
Maximum time under regulation (number of working days)13
1 1
Mobile Number of transactions14 324.823 104.407
% of total numbers15 4% 3.7%
Maximum wholesale price16 14EUR 14EUR
Maximum time under regulation (number of working days)17
1 1
With more complex products in the market (double and triple play as well as traffic bundles) becoming increasingly relevant in the market, the perception of transparency and clarity of contracts by consumers is increasingly important. The 2015 Eurobarometer survey shows that 7 Full LLU monthly average total cost in EUR; source: Communications Committee. Data as of October 2015. 8 Source: BEREC Report BoR(15)72.9 International Roaming BEREC Benchmark Data Report April 2015 – September 2015 BoR(16)28.10 Source: Communications Committee. Data as of January to September 2014 and January to September 2015.11 Source: Communications Committee. Data as of January to September 2014 and January to September 2015.12 Source: Communications Committee. Data as of October 2014 and October 2015.13 Source: Communications Committee. Data as of October 2014 and October 2015.14 Source: Communications Committee. Data as of January to September 2014 and January to September 2015.15 Source: Communications Committee. Data as of January to September 2014 and January to September 2015and October 2014 to October 2015.16 Source: Communications Committee. Data as of October 2014 and October 2015.17 Source: Communications Committee. Data as of October 2014 and October 2015.

61
EN
Latvian consumers can still relatively easily compare bundle offers (65%, even if below the EU average of 69% and dropped significantly since 2014). Furthermore it is easier to monitor consumption for fixed (74%, EU average 71%), than for mobile offers (65%, EU average 69%). Finally there is good satisfaction with regard to contract information (14% unsatisfied, EU average 16%).
The scope of the universal service is complete and includes Access to a network at a fixed location ensuring dial-up functional internet connection, Comprehensive directory services (limited to E-directory only) only. Public payphones ceased existing in 2014. Functional internet is defined as Universal service including broadband, but only for disabled users and at the speed of all broadband services which the designated operator offers.
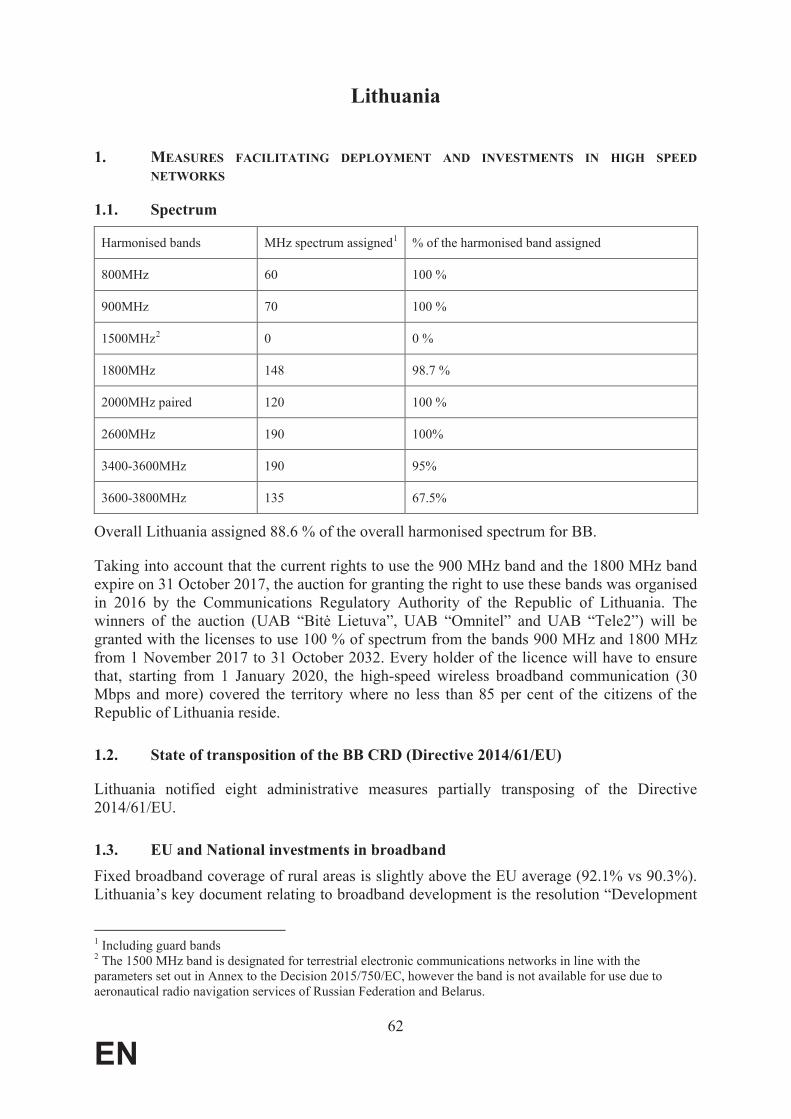
62
EN
Lithuania
1. MEASURES FACILITATING DEPLOYMENT AND INVESTMENTS IN HIGH SPEED
NETWORKS
1.1. Spectrum
Harmonised bands MHz spectrum assigned1 % of the harmonised band assigned
800MHz 60 100 %
900MHz 70 100 %
1500MHz2 0 0 %
1800MHz 148 98.7 %
2000MHz paired 120 100 %
2600MHz 190 100%
3400-3600MHz 190 95%
3600-3800MHz 135 67.5%
Overall Lithuania assigned 88.6 % of the overall harmonised spectrum for BB.
Taking into account that the current rights to use the 900 MHz band and the 1800 MHz band expire on 31 October 2017, the auction for granting the right to use these bands was organised in 2016 by the Communications Regulatory Authority of the Republic of Lithuania. The winners of the auction will be granted with the licenses to use 100 % of spectrum from the bands 900 MHz and 1800 MHz from 1 November 2017 to 31 October 2032. Every holder of the licence will have to ensure that, starting from 1 January 2020, the high-speed wireless broadband communication (30Mbps and more) covered the territory where no less than 85 per cent of the citizens of the Republic of Lithuania reside.
1.2. State of transposition of the BB CRD (Directive 2014/61/EU)
Lithuania notified eight administrative measures partially transposing of the Directive 2014/61/EU.
1.3. EU and National investments in broadband
Fixed broadband coverage of rural areas is slightly above the EU average (92.1% vs 90.3%). Lithuania’s key document relating to broadband development is the resolution “Development
1 Including guard bands2 The 1500 MHz band is designated for terrestrial electronic communications networks in line with the parameters set out in Annex to the Decision 2015/750/EC, however the band is not available for use due to aeronautical radio navigation services of Russian Federation and Belarus.
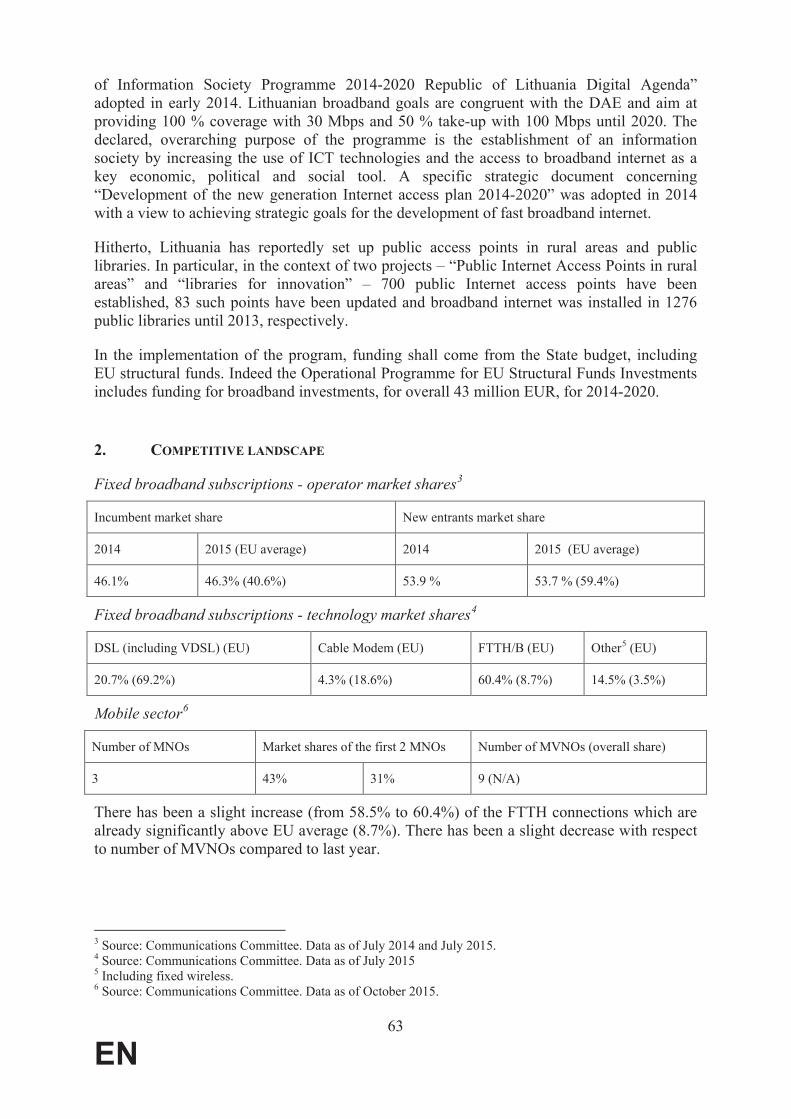
63
EN
of Information Society Programme 2014-2020 Republic of Lithuania Digital Agenda” adopted in early 2014. Lithuanian broadband goals are congruent with the DAE and aim at providing 100 % coverage with 30 Mbps and 50 % take-up with 100 Mbps until 2020. The declared, overarching purpose of the programme is the establishment of an information society by increasing the use of ICT technologies and the access to broadband internet as a key economic, political and social tool. A specific strategic document concerning “Development of the new generation Internet access plan 2014-2020” was adopted in 2014 with a view to achieving strategic goals for the development of fast broadband internet.
Hitherto, Lithuania has reportedly set up public access points in rural areas and public libraries. In particular, in the context of two projects – “Public Internet Access Points in rural areas” and “libraries for innovation” – 700 public Internet access points have been established, 83 such points have been updated and broadband internet was installed in 1276 public libraries until 2013, respectively.
In the implementation of the program, funding shall come from the State budget, including EU structural funds. Indeed the Operational Programme for EU Structural Funds Investments includes funding for broadband investments, for overall 43 million EUR, for 2014-2020.
2. COMPETITIVE LANDSCAPE
Fixed broadband subscriptions - operator market shares3
Incumbent market share New entrants market share
2014 2015 (EU average) 2014 2015 (EU average)
46.1% 46.3% (40.6%) 53.9 % 53.7 % (59.4%)
Fixed broadband subscriptions - technology market shares4
DSL (including VDSL) (EU) Cable Modem (EU) FTTH/B (EU) Other5 (EU)
20.7% (69.2%) 4.3% (18.6%) 60.4% (8.7%) 14.5% (3.5%)
Mobile sector6
Number of MNOs Market shares of the first 2 MNOs Number of MVNOs (overall share)
3 43% 31% 9 (N/A)
There has been a slight increase (from 58.5% to 60.4%) of the FTTH connections which are already significantly above EU average (8.7%). There has been a slight decrease with respect to number of MVNOs compared to last year.
3 Source: Communications Committee. Data as of July 2014 and July 2015.4 Source: Communications Committee. Data as of July 20155 Including fixed wireless.6 Source: Communications Committee. Data as of October 2015.

64
EN
3. REGULATORY FUNCTION
New entrants` DSL subscriptions by type of access at EU level (VDSL and VULA excluded)7
Own network (EU) Full ULL (EU) Shared Access (EU) Bitstream (EU) Resale (EU)
N/A (0.6%) 0.2% (78.1%) 4.3% (2.3%) 95.5 %( 12%) N/A 7%)
LLU price: 4.92 EUR (EU Average: 9.5 EUR)8
In 2015 the Commission services investigated the delays in conducting a market analysis for the three remaining regulated markets, for which it had been more than three years since the previous analysis had expired, including market 3a of the 2014 Recommendation (market for wholesale (physical) network infrastructure access (including shared or fully unbundled access) at a fixed location), market 4 (wholesale terminating segment of leased lines) of the 2014 Recommendation, market 7 of the 2003 Recommendation (minimum set of leased lines) and market 14 (wholesale trunk segment of leased lines) of the 2003 Recommendation. After the investigation, at the end of 2015, RRT notified analysis of these markets to the Commission. In 2015 RRT also notified markets 1 and 2 of the 2014 Recommendation and market 1 of the 2007 Recommendation. 9 Markets 1 and 2 of the 2007 Recommendation and market 7 of the 2003 Recommendation are still regulated in Lithuania.10
For fixed termination rates, RRT applied a pure BULRIC cost-accounting model, in accordance with the 2009 Termination Rate Recommendation. For mobile termination rates, a benchmark based on countries which have implemented pure BULRIC cost-accounting model was applied.
4. CONSUMER ISSUES
The average retail Eurotariff price for roaming is 0.177EUR per minute of calls made and 0.043EUR per minute of calls received (with alternative tariffs cheaper in both cases), 0.052EUR per SMS and 0.183EUR per MB, above the EU average (EU 0.059EUR per MB).11
Number portability 2014 2015
Fixed Number of transactions12 4,057 6,362
% of total numbers13 0.6% 1.1%
Maximum wholesale price14 - -
7 Source: Communications Committee. Data as of July 2015.8 Full LLU monthly average total cost in EUR; source: Communications Committee. Data as of October 2015. 9 Respectively wholesale call termination on individual public telephone networks providedat a fixed location, Wholesale voice call termination on individual mobile networks and access to the public telephone network at a fixed location for residential and non-residential customers.10 Respectively access to the public telephone network at a fixed location for residential and non-residential customers, call origination on fixed networks and retail leased lines.11 International Roaming BEREC Benchmark Data Report April 2015 – September 2015 BoR(16)28.12 Source: Communications Committee. Data as of January to September 2014 and January to September 2015.13 Source: Communications Committee. Data as of January to September 2014 and January to September 2015.

65
EN
Maximum time under regulation (number of working days)15
1 1
Mobile Number of transactions16 126,548 89,091
% of total numbers17 2.9% 2.1%
Maximum wholesale price18 - -
Maximum time under regulation (number of working days)19
1 1
With more complex products (double and triple play as well as traffic bundles) becoming increasingly relevant in the market, the perception of transparency and clarity of contracts by consumers is increasingly important. The 2015 Eurobarometer survey shows that Lithuanian consumers can easily compare bundle offers (72%, above EU average), it is slightly easier to monitor consumption for fixed internet services (67%, EU average 71%), than for mobile (66%, EU average 69%), whilst there is more satisfaction with regard to contract information (9% unsatisfied, EU average 16%).
Universal service includes a comprehensive set of services (access to a network at a fixed location, directory enquiry services and public payphones); on the other hand, it does not encompass broadband.
14 Source: Communications Committee. Data as of October 2014 and October 2015.15 Source: Communications Committee. Data as of October 2014 and October 2015.16 Source: Communications Committee. Data as of January to September 2014 and January to September 2015.17 Source: Communications Committee. Data as of January to September 2014 and January to September 2015.18 Source: Communications Committee. Data as of October 2014 and October 2015.19 Source: Communications Committee. Data as of October 2014 and October 2015.
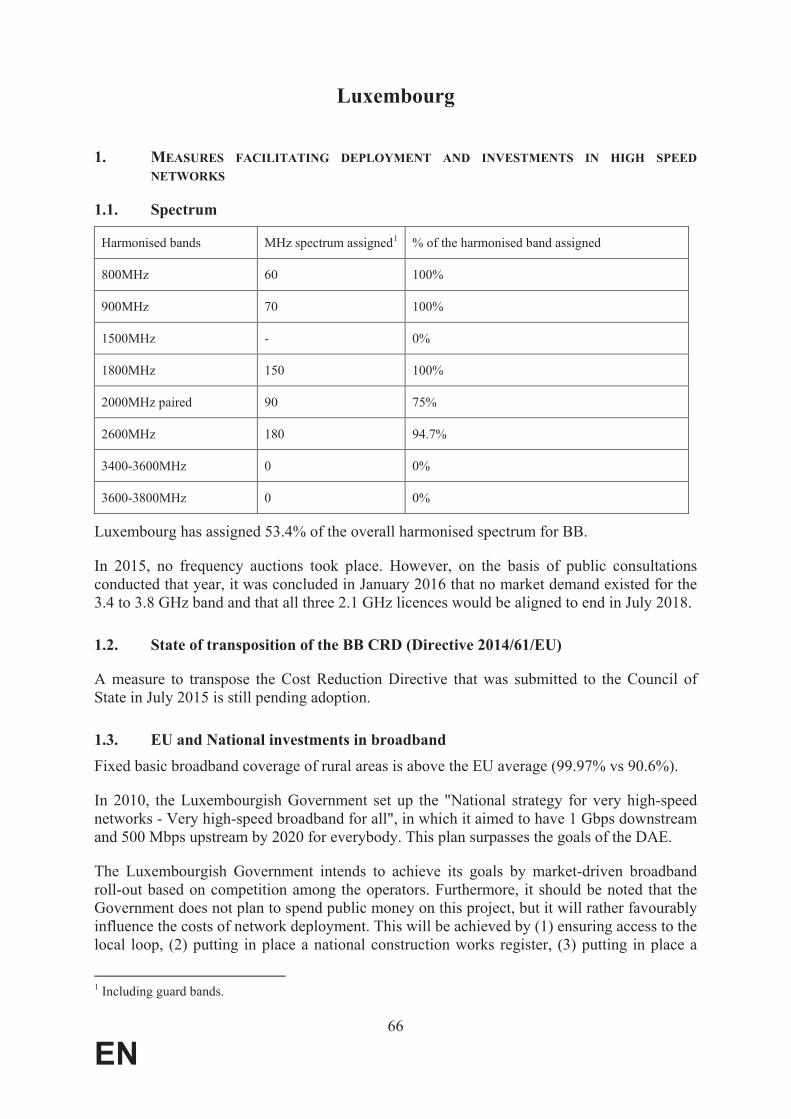
66
EN
Luxembourg
1. MEASURES FACILITATING DEPLOYMENT AND INVESTMENTS IN HIGH SPEED
NETWORKS
1.1. Spectrum
Harmonised bands MHz spectrum assigned1 % of the harmonised band assigned
800MHz 60 100%
900MHz 70 100%
1500MHz - 0%
1800MHz 150 100%
2000MHz paired 90 75%
2600MHz 180 94.7%
3400-3600MHz 0 0%
3600-3800MHz 0 0%
Luxembourg has assigned 53.4% of the overall harmonised spectrum for BB.
In 2015, no frequency auctions took place. However, on the basis of public consultations conducted that year, it was concluded in January 2016 that no market demand existed for the 3.4 to 3.8 GHz band and that all three 2.1 GHz licences would be aligned to end in July 2018.
1.2. State of transposition of the BB CRD (Directive 2014/61/EU)
A measure to transpose the Cost Reduction Directive that was submitted to the Council of State in July 2015 is still pending adoption.
1.3. EU and National investments in broadband
Fixed basic broadband coverage of rural areas is above the EU average (99.97% vs 90.6%).
In 2010, the Luxembourgish Government set up the "National strategy for very high-speed networks - Very high-speed broadband for all", in which it aimed to have 1 Gbps downstream and 500 Mbps upstream by 2020 for everybody. This plan surpasses the goals of the DAE.
The Luxembourgish Government intends to achieve its goals by market-driven broadband roll-out based on competition among the operators. Furthermore, it should be noted that the Government does not plan to spend public money on this project, but it will rather favourably influence the costs of network deployment. This will be achieved by (1) ensuring access to the local loop, (2) putting in place a national construction works register, (3) putting in place a
1 Including guard bands.

67
EN
national infrastructure register, (4) introducing an obligation to roll out associated facilities for optical fibre, (5) in-house wiring in new buildings, and (6) broadening the mandate of Luxconnect (private company created by the Luxembourgish Government aimed to improve the national dark fibre network).
2. COMPETITIVE LANDSCAPE
Fixed broadband subscriptions - operator market shares2
Incumbent market share New entrants market share
July 2014 July 2015 (EU average) July 2014 July 2015 (EU average)
71.1% 67.3% (40.6%) 28.9% 32.7% (59.4%)
Fixed broadband subscriptions - technology market shares3
DSL (including VDSL) (EU) Cable Modem (EU) FTTH/B (EU) Other4 (EU)
77.2% (69.2%) 11.2% (18.6%) 11.1% (8.7%) 0.5% (3.5%)
There has been a decrease of the market share of the incumbent from 71.1% in 2014 to 67.3% in 2015. The share of DSL (slight increase of 0.01% to 77.2% in 2015) and the share of FTTH/B (slight decrease of 1.0% to 11.1% in 2015) are over the EU average of, respectively, 69.2% and 8.7%. The other technology means, cable, and others, remain significantly below the EU average.
Mobile sector5
Number of MNOs Market shares of the first 2 MNOs Number of MVNOs (overall share)
3 53.0% 36% 3 (N/A)
3. REGULATORY FUNCTION
New entrants` DSL subscriptions by type of access at EU level (VDSL and VULA excluded)6
Own network (EU) Full ULL (EU) Shared Access (EU) Bitstream (EU) Resale (EU)
- (0,6%) 68.6% (78.1%) -% (2,3%) -% (12%) 31.4% (7%)
LLU prices: 11.5EUR (EU Average; 9.5EUR)7
In 2015, the ILR notified to the Commission analyses of markets 7 and 14 of the 2003 Recommendation and of markets 1 and 6 of the 2007 Recommendation,8 as well as a range of 2 Source: Communications Committee. Data as of July 2014 and July 2015.3 Source: Communications Committee. Data as of July 20154 Including fixed wireless.5 Source: Communications Committee. Data as of October 2015.6 Source: Communications Committee. Data as of July 2015.7 Full LLU monthly average total cost in EUR; source: Communications Committee. Data as of October 2015.

68
EN
price setting decisions covering markets 1, 2, 3b and 4 of the 2014 Recommendation and markets 1 and 2 of the 2007 Recommendation.
With these notifications, Luxembourg fully aligned its market review cycle with EU law and was thus not included in the investigation of delays launched by the Commission services in 2015. Luxemburg still maintains regulation of some markets no longer recommended for ex ante regulation under the 2014 Recommendation. These are the markets for access to the public telephone network at a fixed location for residential and non-residential customers and fixed voice call origination (markets 1 and 2 of 2007 Recommendation). For both fixed and mobile termination rates, the ILR has applied its own pure BU-LRIC cost model, in accordance with the 2009 Recommendation on Termination Rates.
4. CONSUMER ISSUES
The average retail Eurotariff price for roaming is 0.180EUR per minute of calls made and 0.043EUR per minute of calls received (with alternative tariffs respectively cheaper for calls made and more expensive for calls received), 0.058EUR per SMS and 0.183EUR per MB. All prices are above the EU average9.
Number portability 2014 2015
Fixed Number of transactions10 N/A N/A
% of total numbers11 N/A N/A
Maximum wholesale price12 N/A N/A
Maximum time under regulation (number of working days) 13
1 1
Mobile Number of transactions14 26,146 33,704
% of total numbers15 3.1% 3.9%
Maximum wholesale price16 7 7
Maximum time under regulation (number of working days) 17
1 1
8 Respectively retail market for leased lines, wholesale market for leased lines, access to the public telephone
network at a fixed location for residential and non-residential use, wholesale market for leased lines, wholesale voice call termination on individual mobile networks, and wholesale local access provided at a fixed location.
9 International Roaming BEREC Benchmark Data Report October 2014 – March 2015 BoR(15)134.10 Source: Communications Committee. Data as of January to September 2014 and January to September 2015.11 Source: Communications Committee. Data as of January to September 2014 and January to September 2015.12 Source: Communications Committee. Data as of October 2014 and October 2015.13 Source: Communications Committee. Data as of October 2014 and October 2015.14 Source: Communications Committee. Data as of January to September 2014 and January to September 2015.15 Source: Communications Committee. Data as of January to September 2014 and January to September 2015.16 Source: Communications Committee. Data as of October 2014 and October 2015.17 Source: Communications Committee. Data as of October 2014 and October 2015.
69
EN
With more complex products (double and triple play as well as traffic bundles) becoming increasingly relevant in the market, the perception of transparency and clarity of contracts by consumers is increasingly important. The 2015 Eurobarometer survey shows that Luxembourgish consumers can easily compare bundle offers, which is the same as last year. It is easier to monitor consumption for mobile (69, the same as the EU average) than for fixed (64%, EU average 71%). However, 24% of Luxembourgish consumers were unsatisfied with the information in their communications contract (14% low satisfaction, and 10% no satisfaction). This is higher than the EU average, namely respectively 9% and 7%. As universal service is voluntarily provided by incumbent operator Post Luxembourg, no obligations have been formally imposed.
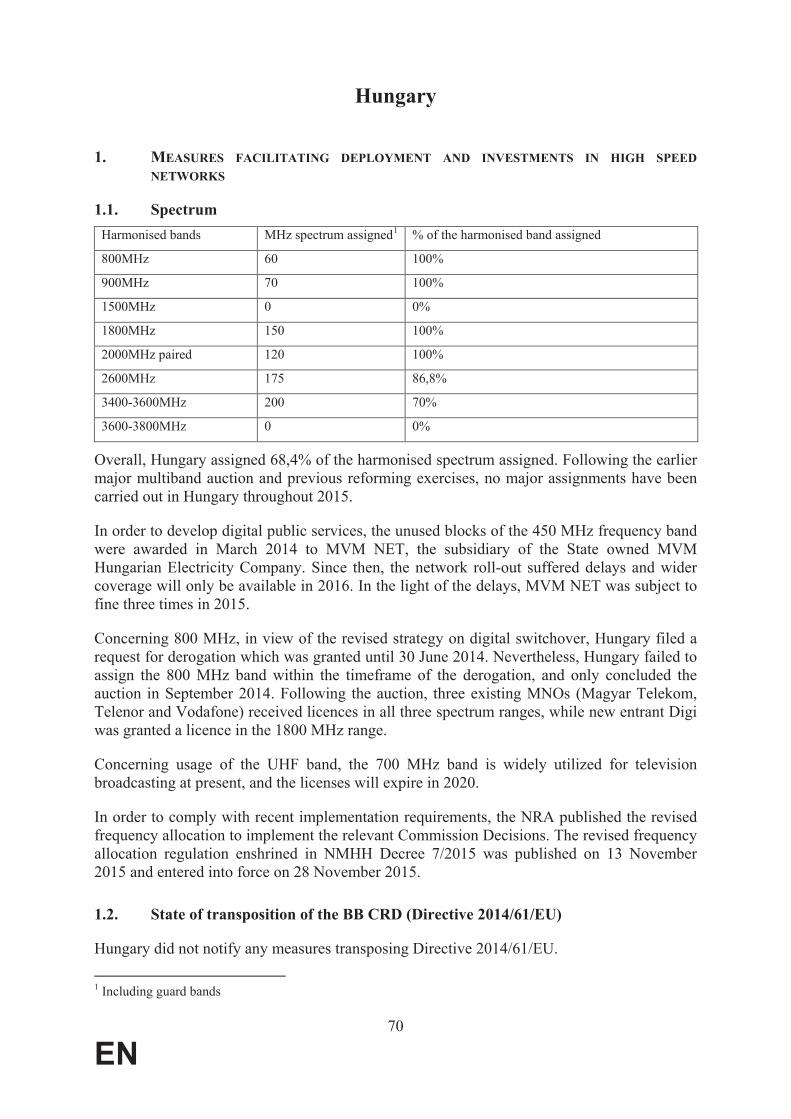
70
EN
Hungary
1. MEASURES FACILITATING DEPLOYMENT AND INVESTMENTS IN HIGH SPEED
NETWORKS
1.1. Spectrum
Harmonised bands MHz spectrum assigned1 % of the harmonised band assigned
800MHz 60 100%
900MHz 70 100%
1500MHz 0 0%
1800MHz 150 100%
2000MHz paired 120 100%
2600MHz 175 86,8%
3400-3600MHz 200 70%
3600-3800MHz 0 0%
Overall, Hungary assigned 68,4% of the harmonised spectrum assigned. Following the earlier major multiband auction and previous reforming exercises, no major assignments have been carried out in Hungary throughout 2015.
In order to develop digital public services, the unused blocks of the 450 MHz frequency band were awarded in March 2014 to MVM NET, the subsidiary of the State owned MVM Hungarian Electricity Company. Since then, the network roll-out suffered delays and wider coverage will only be available in 2016. In the light of the delays, MVM NET was subject to fine three times in 2015.
Concerning 800 MHz, in view of the revised strategy on digital switchover, Hungary filed a request for derogation which was granted until 30 June 2014. Nevertheless, Hungary failed to assign the 800 MHz band within the timeframe of the derogation, and only concluded the auction in September 2014. Following the auction, three existing MNOs (Magyar Telekom, Telenor and Vodafone) received licences in all three spectrum ranges, while new entrant Digi was granted a licence in the 1800 MHz range.
Concerning usage of the UHF band, the 700 MHz band is widely utilized for television broadcasting at present, and the licenses will expire in 2020.
In order to comply with recent implementation requirements, the NRA published the revised frequency allocation to implement the relevant Commission Decisions. The revised frequency allocation regulation enshrined in NMHH Decree 7/2015 was published on 13 November 2015 and entered into force on 28 November 2015.
1.2. State of transposition of the BB CRD (Directive 2014/61/EU)
Hungary did not notify any measures transposing Directive 2014/61/EU.
1 Including guard bands

71
EN
1.3. EU and National investments in broadband
In February 2014, the Government adopted the National Infocommunication Strategy 2014-2020 in line with the Digital Agenda targets, also covering demand side measures taking particular consideration of vulnerable citizens. The Digital Infrastructure Pillar of the National Infocommunication Strategy 2014-2020 includes broadband related objectives and Hungary's strategy for the next seven years. The broadband targets enshrined in the strategy (all households have access to at least 30 Mbps internet and at least 50 % of the households should have 100 Mbps or faster internet access) are consistent with the broadband targets laid down by the Digital Agenda.
With regard to budgetary issues the National Broadband Plan states that about 180 – 210Billion HUF (600 - 700 Million EUR) investments are needed in order to assure at least 30 Mbps internet speed for all households in Hungary. Such an investment may bring about additional 25 – 40 % (1 -1.6 Million of households) coverage of households with superfast broadband.
The Hungarian broadband plan also delineates potential problems and risks regarding the realisation of the broadband targets. Most notable is a potential shortage of financial resources and EU funds. White spots in rural areas, similar to other territorially bigger countries, represent a problem in Hungary as well. In Hungary, the fixed basic broadband coverage of rural areas (85%) is below the EU average of 90%.
Overall, the Hungarian broadband strategy envisions to primarily promote market-based broadband roll-out by enacting adequate public policy and regulatory measures. Where deployment incentives for market players lack, credit or tender schemes (e.g., tax relief for developments, allocation of application funds to support investments not recoverable on a market basis, etc.) shall be developed to support network upgrades.
It remains to be seen whether the financial incentives made available will be able to compensate for the effects of levies established on providers, in particular the infrastructure tax introduced in 2013. In the new programming period 2014-2020, broadband development priorities focus on the development of new generation NGA networks, the wind-up of still remaining backhaul bottlenecks and the improvement of government network capacity and access of public institutions. The first major call for proposal under the Economic Development and Innovation Operational Programme has been published in August 2015.
2. COMPETITIVE LANDSCAPE
Fixed broadband subscriptions - operator market shares2
Incumbent market share New entrants market share
2014 2015 (EU average) 2014 2015 (EU average)
43,9% 41,9% (40,6)% 56,1% 58,1% (59,4%)
Fixed broadband subscriptions - technology market shares3
2 Source: Communications Committee. Data as of July 2014 and July 2015.3 Source: Communications Committee. Data as of July 2015

72
EN
DSL (including VDSL) (EU) Cable Modem (EU) FTTH/B (EU) Other4 (EU)
31,1% (69,2%) 48,0% (18,6%) 15,5% (8,7%)
5,4 (0,8%)%
The Hungarian fixed telephony market continues to be characterized by the presence of so called local telephony operators, originally created in a geographic split-up of the former state monopoly area. There are now three companies (mainly Magyar Telekom, Invitel and UPC in only one city area) that all remain leading operators in their area each designated as SMP. At the same time, the market share of three incumbents have continued to decrease for the past years, as they are facing increasing competitive pressure from cable operators. As in the past years, the television offers continue to be a major driver of competition that also drives the incumbents to developing their fibre networks to improve bundle offers. The deregulation of the fixed telephone market is under preparation, the related market analysis decisions are in the process of national consultation.
Mobile sector5
Number of MNOs Market shares of the first 2 MNOs Number of MVNOs (as of October 2015)
3 45% 30% 1 (2%)
The Hungarian mobile market has shown a rather stable market structure with three mobile network operators (the incumbent Magyar Telekom's subsidiary, and its competitors, Telenor and Vodafone), despite previous efforts for an entry into market of a fourth mobile operator. Following the outcome of the multiband auction in 2014, cable operator DIGI has acquired rights in the 1800 MHz range, as the fourth mobile network operator. Throughout 2014 and 2015, two new MVNOs (UPC and Netfone) entered the mobile market, and branded resellers have started to provide services as well, while the existing services of Tesco Mobile are phased out in 2016. UPC started to market its MVNO services relying on a shared medium platform.
3. REGULATORY FUNCTION
New entrants` DSL subscriptions by type of access at EU level (VDSL and VULA excluded)6
Own network (EU) Full ULL (EU) Shared Access (EU) Bitstream (EU) Resale (EU)
- (0,6%)15,5% (78,1%) 0,3% (2,3%) 84,3% (12,0%) - (7,0%)
LLU price: 7,0 EUR (EU Average: 9,5EUR)7
NMHH complied with the 2009 Termination Rate Recommendation for both fixed and mobile markets. Concerning ex-markets 4, 5 and 6 under the 2007 Recommendation on relevant markets, the three-year deadline expired in 2014, for which NMHH notified a request for an extension of until 31 December 2015. While NMHH launched preparatory actions (data collection and public hearings), it did not notify any measures within the extended deadline.
4 Including fixed wireless.5 Source: Communications Committee. Data as of October 2015.6 Source: Communications Committee. Data as of July 2015.7 Full LLU monthly average total cost in EUR; source: Communications Committee. Data as of October 2015.

73
EN
Thus the Commission is looking into the matter to investigate the reasons for the delays in conducting these market analyses.
4. CONSUMER ISSUES
The average retail Eurotariff price for roaming is 0,175EUR8 per minute of calls made and 0,049EUR per minute of calls received (while alternative tariffs are considerably less expensive than the EU average at 0,063EUR (well below the price cap) for calls made and 0,054EUR (slightly above the price cap) for calls received). With regard to SMS and data roaming prices, 0,058 per SMS, is close to the EU average. While 0,099EUR per MB is below the price cap, but is above the EEA average of 0.059EUR.
Number portability – N/A 2014 2015
Fixed Number of transactions9 26134 23023
% of total numbers10 0.8% 0.8%
Maximum wholesale price11 4 4
Maximum time under regulation (number of working days) 12
1 1
Mobile Number of transactions13 101116 86995
% of total numbers14 0.9% 0.8%
Maximum wholesale price15 - -
Maximum time under regulation (number of working days) 16
1 1
With more complex products in the market (double and triple play as well as traffic bundles) becoming increasingly relevant in the market, the perception of transparency and clarity of contracts by consumers is increasingly important. The 2015 Eurobarometer survey shows that consumers in Hungary can easily compare bundle offers (73%, above the EU average of 69%). The ratio of positive respondents in Hungary, who can easily monitor and control fixed telephone consumption are exactly at the EU average of 71%, while for mobile, 76% is below the EU average of 78%. On the other hand, with regard to contract information, respondents
8 All data is for Q3 2015, as enshrined in the International Roaming BEREC Benchmark Data Report April –September 2015 BoR (16) 289 Source: Communications Committee. Data as of January to September 2014 and January to September 2015.10 Source: Communications Committee. Data as of January to September 2014 and January to September 2015.11 Source: Communications Committee. Data as of October 2014 and October 2015.12 Source: Communications Committee. Data as of October 2014 and October 2015.13 Source: Communications Committee. Data as of January to September 2014 and January to September 2015.14 Source: Communications Committee. Data as of January to September 2014 and January to September 2015.15 Source: Communications Committee. Data as of October 2014 and October 2015.16 Source: Communications Committee. Data as of October 2014 and October 2015.

74
EN
in Hungary voiced more positive opinion than the EU average (only 12% unsatisfied compared to the EU average of 16%).
In February 2015, the Prime Minister's Office inaugurated a website launching the public consultation on the internet, announced at the time of the withdrawal of the disputed internet tax. The consultation has a wider scope that was to be defined in the first stage, when questions could be proposed in three main areas: consumer protection, net neutrality, and competition and innovation. In December, a report has been tabled to the government on the results of the public consultation.
The scope of universal service in Hungary includes functional internet connection, fixed-line telephony services, directory enquiry services and directories, as well as public payphones and other public voice telephony access points. Functional internet connection within the scope of universal service is defined as a guaranteed download speed of least 30 kbps and a guaranteed upload speed of at least 8 kbps.
The designation process is laid down in the implementing NMHH Decree No. 13/2013 (IX. 25.), and was completed in 2014. Accordingly, the NRA signed a public contract with the single applicant Magyar Telekom as regards the connection to the public telephone network at a fixed location on its previous concession territory. Furthermore Invitel and UPC Hungary have been designated US providers as SMPs on their geographic retail markets. Regarding a telephone directory enquiry service, the NRA signed a public contract with Invitel. In the absence of offers, Magyar Telekom, Invitel and UPC have been designated for the provisionof public pay phones and the directory information service in their relevant geographic areas.

75
EN
Malta
1. MEASURES FACILITATING DEPLOYMENT AND INVESTMENTS IN HIGH SPEED
NETWORKS
1.1. Spectrum
Harmonised bands MHz spectrum assigned1 % of the harmonised band assigned
800MHz 0 0 %
900MHz 70 100 %
1500MHz 0 0 %
1800MHz 90 60 %
2000MHz paired 120 100 %
2600MHz 0 0 %
3400-3600MHz 121,5 60,75 %
3600-3800MHz 0 0 %
Out of the above-listed harmonised bands, Malta has made available 930 MHz of spectrum for WBB services. This figure equates to 90,29% of the total EU harmonised spectrum for these services. Nevertheless, only 38,98% of this harmonised spectrum has been taken up by the industry. (EU average is 69%).
Although the unassigned parts of the 1800 MHz band, the 2600 MHz and the 3600-3800 MHz bands have been placed on the market some years ago, the market did not show interest in making use of these bands. With respect to the 1500 MHz band, a policy leading to the availability of the band for WBB in accordance with Decision No. 2015/750/EU is currently underway.
Concerning the 800MHz band, the Commission granted a derogation until 31 December 2014 for the actual use of the spectrum due to cross-border frequency coordination problems. It was based on temporary unavailability of part of the 800 MHz band (830-838 MHz),2 as DTT channel 66 in the 800 MHz band could not be freed due to interference from Italy. Meanwhile, following a public consultation process3, Malta adopted a decision establishing the national framework for the assignment of the 800 MHz band4. Malta formally requested in January 2016 that the derogation in respect of making available the 800 MHz band for electronic communications other than broadcasting is extended to the end of February 2017 in order to allow for the completion of the required migration of channel 66. The Commission services are investigating the request. Should requests for this spectrum be received in the
1 Including guard bands2 Analogue television in Malta was switched off in October 2011.3 A public consultation took place in May 2014.4 https://www.mca.org.mt/sites/default/files/attachments/decisions/2014/MCA-Decision-800-final.PDF

76
EN
meantime, the Malta Communications Authority intends to run the authorization process in parallel.
The UHF Band is currently used by GO for its terrestrial television operations. Wireless audio PMSE devices operating in accordance with Decision No. 2014/641/EU are also using the UHF band. The future usage of the 700 MHz band is being assessed by the Malta Communications Authority.
1.2. State of transposition of the BB CRD (Directive 2014/61/EU)
Malta has not yet notified to the Commission any measures transposing the Directive. The finalisation of the adaption process of the national legislation transposing the Directive is ongoing.
1.3. EU and National investments in broadband
Fixed broadband coverage is nationwide: 100 % coverage in rural areas in Malta vs 90, 6 % in EU28.
The current National Broadband Plan of Malta (called “Digital Malta 2014 – 2020”) was issued in March 2014. The present Maltese National Broadband Plan comes with an online portal providing information, inter alia, on Malta’s policy goals, initiatives and performance indicators. The Maltese Digital Agenda defines different strategic themes, including digital business, digital citizen, digital government, human capital, regulation and legislation, and infrastructure. Malta’s infrastructure and other performance targets are in line with the DAE targets: 100 % cover-age with 30 Mbps until 2020; 50 % take-up rate for 100 Mbps.
In terms of investments, the National Broadband Plan states the possibility to “explore the feasibility of private funding and public-private partnerships” for the deployment of infrastructures. However, this only applies within areas where market failure exists. With Malta standing at a leading position within Europe with respect to NGA coverage, it is unlikely that state aid will be needed in the foreseeable future. The country puts emphasis on infrastructure-based competition in meeting the DAE targets which were already close to fulfilling the respective requirements. Due to the relative small size of Malta, there are no regional broadband plans in existence.
In April 2016, Malta’s incumbent telecom operator Go, received from the European Investment Bank a loan of 20 million euros from a fund for “innovative firms” to finance rollout of state-of-the-art fixed and mobile broadband networks on the Mediterranean island.
2. COMPETITIVE LANDSCAPE
Fixed broadband subscriptions - operator market shares5
Incumbent market share New entrants market share
2014 2015 (EU average) 2014 2015 (EU average)
5 Source: Communications Committee. Data as of July 2014 and July 2015.

77
EN
48,9% 47,7% (40,6%) 51,1% 52,3% (59,4%)
Fixed broadband subscriptions - technology market shares6
DSL (including VDSL) (EU) Cable Modem (EU) FTTH/B (EU) Other7 (EU)
47,8% (69,2%) 51,2% (18,6%) 0 (8,7%) 1% (3,5%)
The Maltese market has unique characteristics, with two nationwide competing fixed access infrastructures. GO operates a nationwide copper network which over the past years has been upgraded to FTTC in the majority of areas. Throughout 2015, and in subsequent years, GO plans to continue with the deployment of its FTTH network starting with the areas which are the most commercially attractive. Melita provides broadband connections over its cable infrastructure.
Mobile sector8
Number of MNOs Market shares of the first 2 MNOs Number of MVNOs (overall share)
3 45% 38% 2 (1.8%)
In the mobile market, Vodafone remains the leading operator in terms of market shares, followed by GO. Since Melita entered the market in 2009, its market share continues to grow.
3. REGULATORY FUNCTION
New entrants` DSL subscriptions by type of access at EU level (VDSL and VULA excluded)9
Own network (EU) Full ULL (EU) Shared Access (EU) Bitstream (EU) Resale (EU)
100% (0,6%) 0 (78,1%) 0 (2,3%) 0 (12 %) 0 (7%)
LLU price: 12,0 EUR (EU average 9,5EUR )10
For both fixed and mobile termination rates, the MCA has applied a pure BU-LRIC cost model, in accordance with the 2009 Recommendation on Termination Rates.
In 2015, the Commission registered two notifications from MCA (i) concerning wholesale call termination on individual public telephone networks provided at a fixed location in Malta (market 1 of 2014 recommendation) and (ii) concerning wholesale local access provided at a fixed location/physical network infrastructure access (market 3a of 2014 recommendation).
The Commission services investigated in October 2015 the delays in conducting market analysis in the former market 2 for call origination on fixed networks of the 2007 Recommendation, where more than three years had passed since the adoption of the measures
6 Source: Communications Committee. Data as of July 2014 and July 20157 Including fixed wireless.8 Source: Communications Committee. Data as of October 2014 and October 2015.9 Source: Communications Committee. Data as of July 2014 and July 2015.10 Full LLU monthly average total cost in EUR; source: Communications Committee. Data as of October 2014 and October 2015.

78
EN
concerning this market. Malta notified the market review of wholesale call origination on the public telephone network provided at a fixed location in Malta in January 2016.
4. CONSUMER ISSUES
In general, retail pricing for roaming services in Malta is above the EU average levels. The average roaming retail price for Eurotariff for calls made is at EUR0.153, slightly above the EU average of EUR0.131 and below the retail price cap. The same trend applies for the average Eurotariff retail price for calls received, which stands at EUR0.046, slightly above the EU average of EUR0.034 and also below the price cap. The same applies for the average roaming SMS price at EUR0.058 is also above the EU average of EUR0.052, and just below the price cap. Finally, as regards data roaming, Malta's average retail data roaming price of EUR0.128 per Mb is well above the EU average of EUR0.059, but below the retail price cap. 11
Number portability 2014 2015
Fixed Number of transactions12 1,834 1,288
% of total numbers13 0,8% 0,6%
Maximum wholesale price14 3 3
Maximum time under regulation (number of working days)15
1 1
Mobile Number of transactions16 27,126 24,110
% of total numbers17 4,8% 4,3%
Maximum wholesale price18 2 2
Maximum time under regulation (number of working days)19
1 1
With more complex products in the market (double and triple play as well as traffic bundles) becoming increasingly relevant in the market, the perception of transparency and clarity of contracts by consumers is increasingly important. The 2015 Eurobarometer survey shows that 59% of the Maltese respondents, who have a bundle, believe it is easy to compare the services and prices offered by bundles (below the EU average of 69%). It is easier to monitor consumption for fixed telephone services (70%, EU average 71%) than for mobile data (62%, EU average 69%), while there is the same satisfaction with regard to contract information (17% unsatisfied, EU 16%). The scope of the universal service includes access to a network at a fixed location ensuring dial-up functional internet connection, directory enquiries and public 11 International Roaming BEREC Benchmark Data Report April 2015 – September 2015 BoR(16)28.12 Source: Communications Committee. Data as of January to September 2014 and January to September 2015.13 Source: Communications Committee. Data as of January to September 2014 and January to September 2015.14 Source: Communications Committee. Data as of October 2014 and October 2015.15 Source: Communications Committee. Data as of October 2014 and October 2015.16 Source: Communications Committee. Data as of January to September 2014 and January to September 2015.17 Source: Communications Committee. Data as of January to September 2014 and January to September 2015.18 Source: Communications Committee. Data as of October 2014 and October 2015.19 Source: Communications Committee. Data as of October 2014 and October 2015.
79
EN
payphone. The minimum download connection speed within the universal service is of 4Mbps within the Maltese islands.
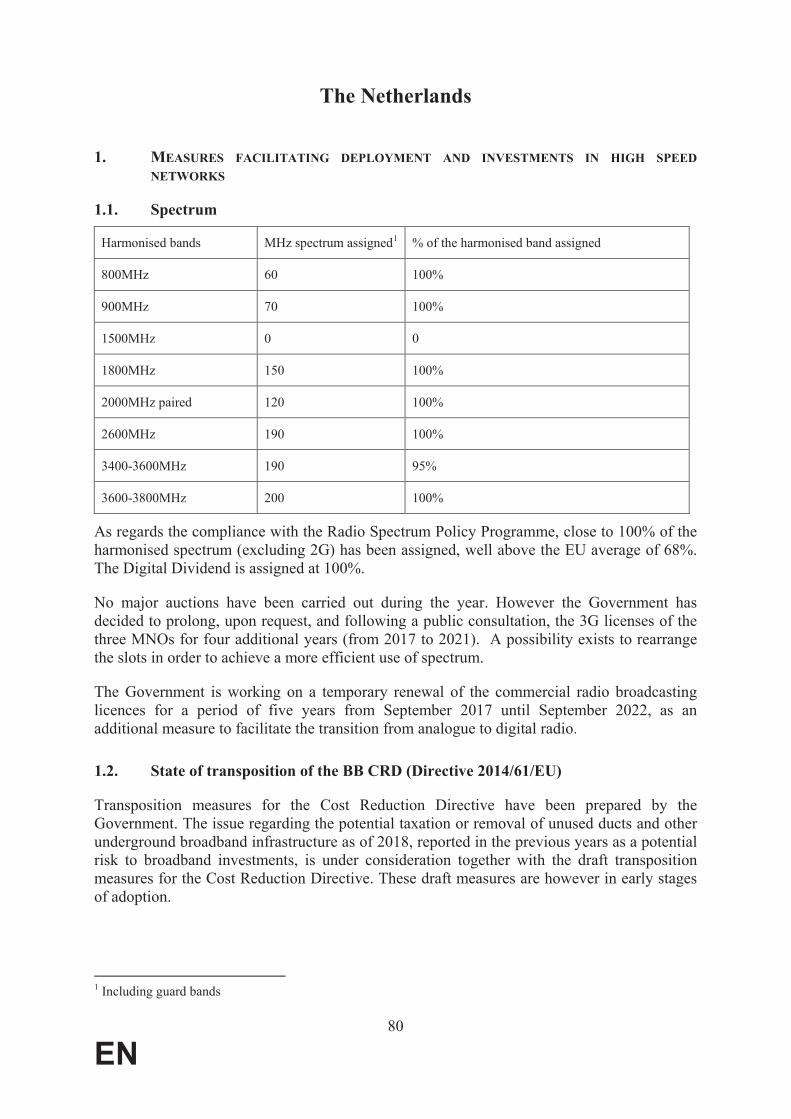
80
EN
The Netherlands
1. MEASURES FACILITATING DEPLOYMENT AND INVESTMENTS IN HIGH SPEED
NETWORKS
1.1. Spectrum
Harmonised bands MHz spectrum assigned1 % of the harmonised band assigned
800MHz 60 100%
900MHz 70 100%
1500MHz 0 0
1800MHz 150 100%
2000MHz paired 120 100%
2600MHz 190 100%
3400-3600MHz 190 95%
3600-3800MHz 200 100%
As regards the compliance with the Radio Spectrum Policy Programme, close to 100% of the harmonised spectrum (excluding 2G) has been assigned, well above the EU average of 68%. The Digital Dividend is assigned at 100%.
No major auctions have been carried out during the year. However the Government has decided to prolong, upon request, and following a public consultation, the 3G licenses of the three MNOs for four additional years (from 2017 to 2021). A possibility exists to rearrange the slots in order to achieve a more efficient use of spectrum.
The Government is working on a temporary renewal of the commercial radio broadcasting licences for a period of five years from September 2017 until September 2022, as an additional measure to facilitate the transition from analogue to digital radio.
1.2. State of transposition of the BB CRD (Directive 2014/61/EU)
Transposition measures for the Cost Reduction Directive have been prepared by the Government. The issue regarding the potential taxation or removal of unused ducts and other underground broadband infrastructure as of 2018, reported in the previous years as a potential risk to broadband investments, is under consideration together with the draft transposition measures for the Cost Reduction Directive. These draft measures are however in early stages of adoption.
1 Including guard bands
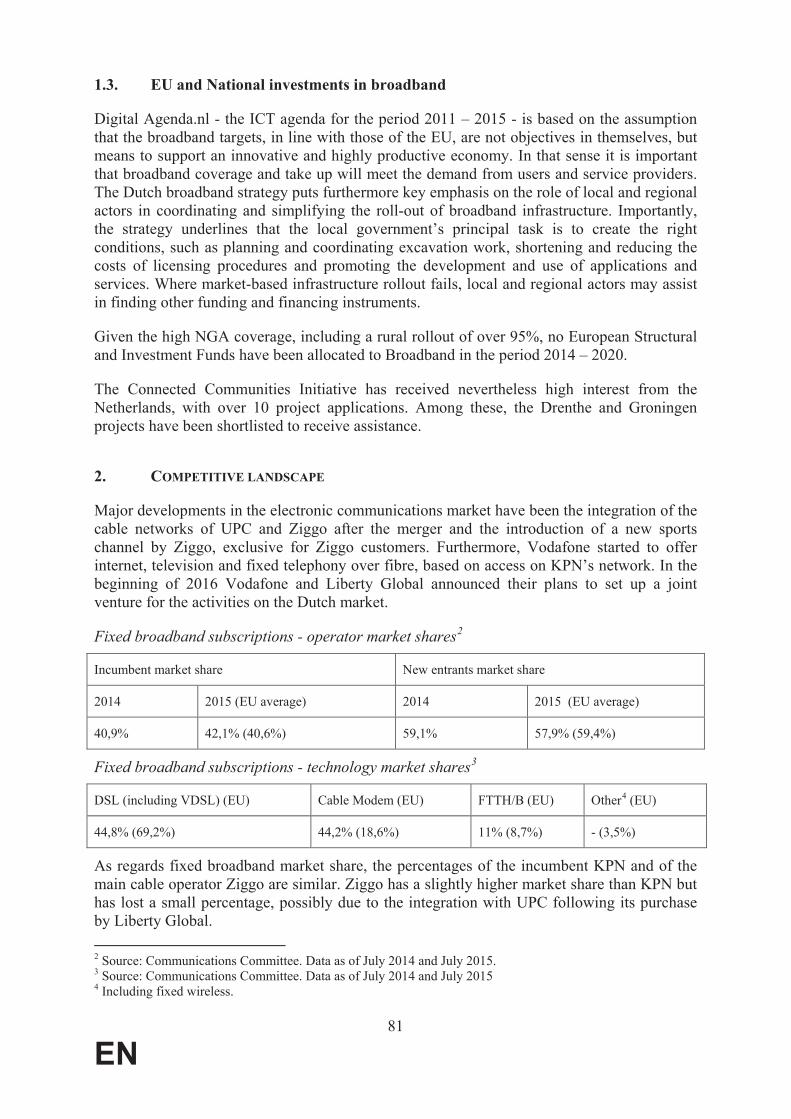
81
EN
1.3. EU and National investments in broadband
Digital Agenda.nl - the ICT agenda for the period 2011 – 2015 - is based on the assumption that the broadband targets, in line with those of the EU, are not objectives in themselves, but means to support an innovative and highly productive economy. In that sense it is important that broadband coverage and take up will meet the demand from users and service providers. The Dutch broadband strategy puts furthermore key emphasis on the role of local and regional actors in coordinating and simplifying the roll-out of broadband infrastructure. Importantly, the strategy underlines that the local government’s principal task is to create the right conditions, such as planning and coordinating excavation work, shortening and reducing the costs of licensing procedures and promoting the development and use of applications and services. Where market-based infrastructure rollout fails, local and regional actors may assist in finding other funding and financing instruments.
Given the high NGA coverage, including a rural rollout of over 95%, no European Structural and Investment Funds have been allocated to Broadband in the period 2014 – 2020.
The Connected Communities Initiative has received nevertheless high interest from the Netherlands, with over 10 project applications. Among these, the Drenthe and Groningen projects have been shortlisted to receive assistance.
2. COMPETITIVE LANDSCAPE
Major developments in the electronic communications market have been the integration of the cable networks of UPC and Ziggo after the merger and the introduction of a new sports channel by Ziggo, exclusive for Ziggo customers. Furthermore, Vodafone started to offer internet, television and fixed telephony over fibre, based on access on KPN’s network. In the beginning of 2016 Vodafone and Liberty Global announced their plans to set up a joint venture for the activities on the Dutch market.
Fixed broadband subscriptions - operator market shares2
Incumbent market share New entrants market share
2014 2015 (EU average) 2014 2015 (EU average)
40,9% 42,1% (40,6%) 59,1% 57,9% (59,4%)
Fixed broadband subscriptions - technology market shares3
DSL (including VDSL) (EU) Cable Modem (EU) FTTH/B (EU) Other4 (EU)
44,8% (69,2%) 44,2% (18,6%) 11% (8,7%) - (3,5%)
As regards fixed broadband market share, the percentages of the incumbent KPN and of the main cable operator Ziggo are similar. Ziggo has a slightly higher market share than KPN but has lost a small percentage, possibly due to the integration with UPC following its purchase by Liberty Global.
2 Source: Communications Committee. Data as of July 2014 and July 2015.3 Source: Communications Committee. Data as of July 2014 and July 20154 Including fixed wireless.
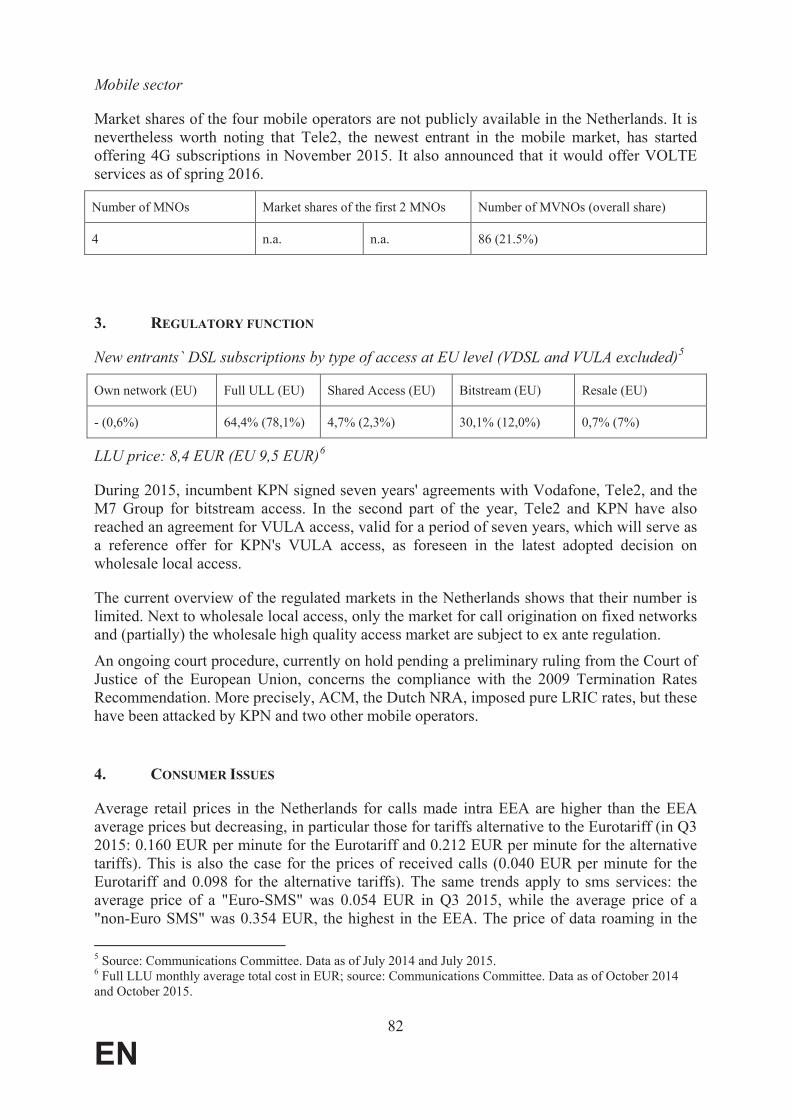
82
EN
Mobile sector
Market shares of the four mobile operators are not publicly available in the Netherlands. It is nevertheless worth noting that Tele2, the newest entrant in the mobile market, has started offering 4G subscriptions in November 2015. It also announced that it would offer VOLTE services as of spring 2016.
Number of MNOs Market shares of the first 2 MNOs Number of MVNOs (overall share)
4 n.a. n.a. 86 (21.5%)
3. REGULATORY FUNCTION
New entrants` DSL subscriptions by type of access at EU level (VDSL and VULA excluded)5
Own network (EU) Full ULL (EU) Shared Access (EU) Bitstream (EU) Resale (EU)
- (0,6%) 64,4% (78,1%) 4,7% (2,3%) 30,1% (12,0%) 0,7% (7%)
LLU price: 8,4 EUR (EU 9,5 EUR)6
During 2015, incumbent KPN signed seven years' agreements with Vodafone, Tele2, and the M7 Group for bitstream access. In the second part of the year, Tele2 and KPN have also reached an agreement for VULA access, valid for a period of seven years, which will serve as a reference offer for KPN's VULA access, as foreseen in the latest adopted decision on wholesale local access.
The current overview of the regulated markets in the Netherlands shows that their number is limited. Next to wholesale local access, only the market for call origination on fixed networks and (partially) the wholesale high quality access market are subject to ex ante regulation.
An ongoing court procedure, currently on hold pending a preliminary ruling from the Court of Justice of the European Union, concerns the compliance with the 2009 Termination Rates Recommendation. More precisely, ACM, the Dutch NRA, imposed pure LRIC rates, but these have been attacked by KPN and two other mobile operators.
4. CONSUMER ISSUES
Average retail prices in the Netherlands for calls made intra EEA are higher than the EEA average prices but decreasing, in particular those for tariffs alternative to the Eurotariff (in Q3 2015: 0.160 EUR per minute for the Eurotariff and 0.212 EUR per minute for the alternative tariffs). This is also the case for the prices of received calls (0.040 EUR per minute for the Eurotariff and 0.098 for the alternative tariffs). The same trends apply to sms services: the average price of a "Euro-SMS" was 0.054 EUR in Q3 2015, while the average price of a "non-Euro SMS" was 0.354 EUR, the highest in the EEA. The price of data roaming in the
5 Source: Communications Committee. Data as of July 2014 and July 2015.6 Full LLU monthly average total cost in EUR; source: Communications Committee. Data as of October 2014 and October 2015.
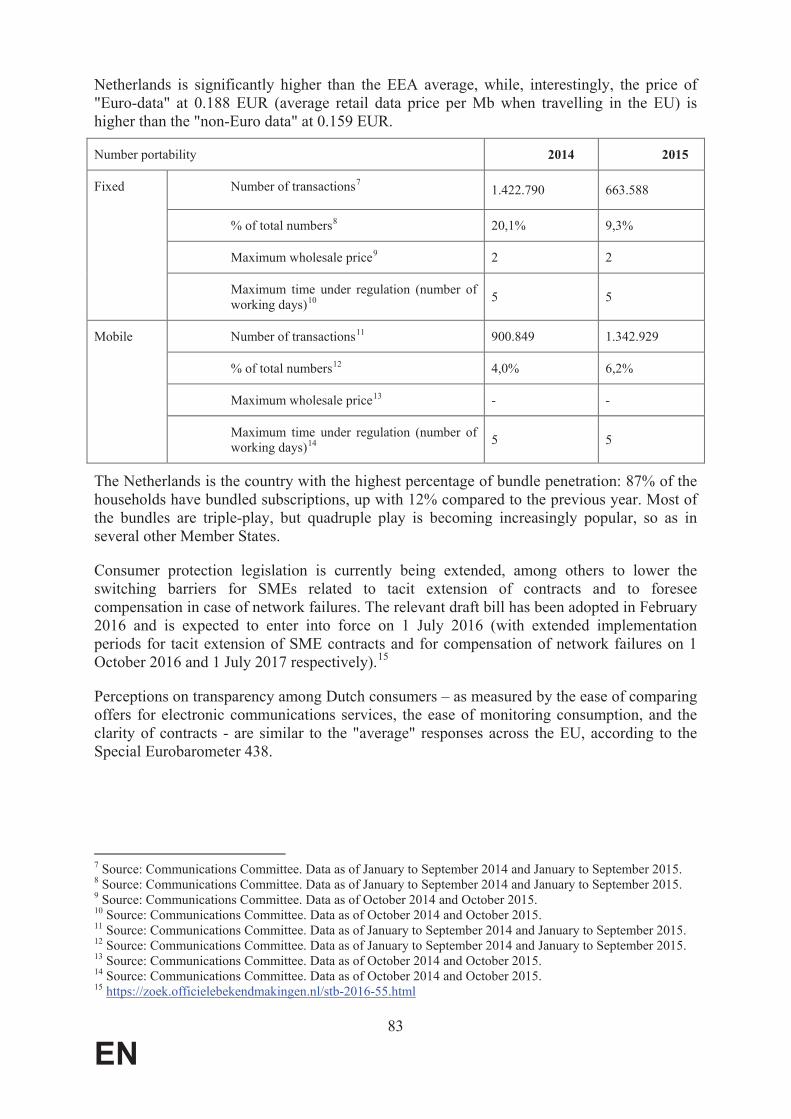
83
EN
Netherlands is significantly higher than the EEA average, while, interestingly, the price of "Euro-data" at 0.188 EUR (average retail data price per Mb when travelling in the EU) is higher than the "non-Euro data" at 0.159 EUR.
Number portability 2014 2015
Fixed Number of transactions71.422.790 663.588
% of total numbers8 20,1% 9,3%
Maximum wholesale price9 2 2
Maximum time under regulation (number of working days)10 5 5
Mobile Number of transactions11 900.849 1.342.929
% of total numbers12 4,0% 6,2%
Maximum wholesale price13 - -
Maximum time under regulation (number of working days)14 5 5
The Netherlands is the country with the highest percentage of bundle penetration: 87% of the households have bundled subscriptions, up with 12% compared to the previous year. Most of the bundles are triple-play, but quadruple play is becoming increasingly popular, so as in several other Member States.
Consumer protection legislation is currently being extended, among others to lower the switching barriers for SMEs related to tacit extension of contracts and to foresee compensation in case of network failures. The relevant draft bill has been adopted in February 2016 and is expected to enter into force on 1 July 2016 (with extended implementation periods for tacit extension of SME contracts and for compensation of network failures on 1 October 2016 and 1 July 2017 respectively).15
Perceptions on transparency among Dutch consumers – as measured by the ease of comparing offers for electronic communications services, the ease of monitoring consumption, and the clarity of contracts - are similar to the "average" responses across the EU, according to the Special Eurobarometer 438.
7 Source: Communications Committee. Data as of January to September 2014 and January to September 2015.8 Source: Communications Committee. Data as of January to September 2014 and January to September 2015.9 Source: Communications Committee. Data as of October 2014 and October 2015.10 Source: Communications Committee. Data as of October 2014 and October 2015.11 Source: Communications Committee. Data as of January to September 2014 and January to September 2015.12 Source: Communications Committee. Data as of January to September 2014 and January to September 2015.13 Source: Communications Committee. Data as of October 2014 and October 2015.14 Source: Communications Committee. Data as of October 2014 and October 2015.15 https://zoek.officielebekendmakingen.nl/stb-2016-55.html

84
EN
Austria
1. MEASURES FACILITATING DEPLOYMENT AND INVESTMENTS IN HIGH SPEED
NETWORKS
1.1. Spectrum
Harmonised bands MHz spectrum assigned1 % of the harmonised band assigned
800MHz 60 100%
900MHz 70 100%
1500MHz 0 0
1800MHz 150 100%
2000MHz paired 118.8 100%2
2600MHz 190 100%
3400-3600MHz 168 84%3
3600-3800MHz 0 0
Overall, Austria assigned 73,5% of the harmonised spectrum assigned. Following the earlier major multiband auction, no major assignments have been carried out throughout 2015.
1.2. State of transposition of the BB CRD (Directive 2014/61/EU)
Austria notified partial transposition of the Cost Reduction Directive. The measures include Acts to amend the Telecommunications Act as well as other laws and regulations.
1.3. EU and National investments in broadband
In Austria, the fixed basic broadband coverage of rural areas (94%) is above the EU average of 90%.
Austria’s National Broadband Plan (Breitbandstrategie 2020) is generally in line with the DAE targets but also supersedes them in several aspects. The Austrian Government’s aim is to achieve 70 % coverage of ultrafast-broadband (defined as 100 Mbps downstream) in metropolitan areas until 2018, coupled with 99 % coverage of ultrafast-broadband for all households in Austria until 2020. While the Austrian Broadband Plan is quite comprehensive, it does not specify investment needs. Austria aims at a market-driven network roll-out and intends to confine the use of public funds to where they are absolutely necessary.
1 Including guard bands2 The band is completely assigned to the extent technically feasible33 The band is completely assigned in some of the regions,

85
EN
Part of the national broadband plan are several state aid programs (“Broadband Austria 2020 Access”; “Broadband Austria 2020 Backhaul”, “Broadband Austria 2020 empty ducts funding”, “Broadband Austria 2020 AT:net”) that shall bridge the digital divide between urban and rural areas. The funding programs also allows for mobile technologies (e.g. LTE/5G). Austria is planning a partial reinvestment of the proceeds from the digital dividend (multiband auction). In addition, Austria has set up a broadband competence centre in early 2013. It functions as a coordination and service centre for municipalities, cities, states and operators.
There are regional broadband plans that differ from the NBP inter alia in its targets. Upper Austria for example aims for 100 % ultrafast-broadband in Upper Austria until 2022. Upper Austria’s own state aid programmes include special funding for small scale projects and FTTH-projects. In addition, the EAFRD Operational Program (OP) includes funding of broadband investments, for overall 27 million EUR in rural areas for the period 2014-20204 .
2. COMPETITIVE LANDSCAPE
Fixed broadband subscriptions - operator market shares5
Incumbent market share New entrants market share
2014 2015 (EU average) 2014 2015 (EU average)
58,1% 58,4% (40,6%) 41,9% 41,6% (59,4%)
The Austrian telecommunication market is characterised by price-driven competition and a prominent role of mobile services, both in terms of voice and broadband markets. The incumbent A1 Telekom Austria maintains a strong position in all market segments and is also active abroad through its subsidiaries in Eastern Europe.
Fixed broadband subscriptions - technology market shares6
DSL (including VDSL) (EU) Cable Modem (EU) FTTH/B (EU) Other7 (EU)
65,8% (69,2%) 31,9% (18.6%) 1,5% (8,7%) 0,8%
While the market share in fixed broadband of the incumbent remained above the EU average, the share of cable operators is slightly increasing.
Mobile sector8
Number of MNOs Market shares of the first 2 MNOs Number of MVNOs
3 41%% 29%% 7 (N/A)
4 http://s3platform.jrc.ec.europa.eu/ict-monitoring/-/tool/search?code=b4028e86d14b4a12a99639ab9d96574c5 Source: Communications Committee. Data as of July 2014 and July 2015.6 Source: Communications Committee. Data as of July 20157 Including fixed wireless.8 Source: Communications Committee. Data as of October 2015.

86
EN
The structure of the Austrian mobile market has been considerably reshaped in 2014 following the acquisition of the third player Orange by the fourth operator Drei. The market restructuring considerably delayed the multiband mobile frequency auctions originally planned for 2012 to be in line with EU requirements. Thus, following consolidation in the Austrian mobile market, there are at present three mobile operators, while as a result of recent market remedies, UPC, Hofer Telekom and Ventocom entered the market as MVNO or MVNE.
3. REGULATORY FUNCTION
New entrants` DSL subscriptions by type of access at EU level (VDSL and VULA excluded)9
Own network (EU) Full ULL (EU) Shared Access (EU) Bitstream (EU) Resale (EU)
0% (0,6%) 75,8% (78,1%) 0% (2,3%) 22,1% (12,0%) 2,1% (7,0%)
LLU prices: 5,9 EUR (EU 9,5)10
RTR complied with the 2009 Termination Rate Recommendation for both fixed and mobile markets. Austria notified draft remedies on Markets 1 and 2 on 23 February 2016.
4. CONSUMER ISSUES
The average retail Eurotariff price for roaming in Austria is 0,099EUR per minute of calls made and 0,029EUR per minute of calls received (while alternative tariffs are considerably more expensive than the EU average at 0,333EUR (well above the price cap) for calls made and 0,135EUR (the third highest) for calls received). With regard to SMS and data roaming prices, 0,046 per SMS, is close to the EU average. At the same time, 0,024EUR per MB is among the lowest, well below the EEA average of 0.059EUR.11 In March 2016, a new implementing decree on the porting of numbers entered into force, considerably reducing the porting fees to 10 EUR.
Number portability 2014 2015
Fixed Number of transactions12 N/A N/A
% of total numbers13 N/A N/A
Maximum wholesale price14 22EUR 22EUR
Maximum time under regulation (number of working days)15
N/A N/A
9 Source: Communications Committee. Data as of July 2015.10 Full LLU monthly average total cost in EUR; source: Communications Committee. Data as of October 2015. 11 International Roaming BEREC Benchmark Data Report April 2015 – September 2015 BoR(16)28.12 Source: Communications Committee. Data as of January to September 2014 and January to September 2015.13 Source: Communications Committee. Data as of January to September 2014 and January to September 2015.14 Source: Communications Committee. Data as of October 2014 and October 2015.15 Source: Communications Committee. Data as of October 2014 and October 2015.

87
EN
Mobile Number of transactions16 195.000 193.000
% of total numbers17 N/A N/A
Maximum wholesale price18 8EUR 8EUR
Maximum time under regulation (number of working days)19
N/A N/A
In Austria, complex products in the market (double and triple play as well as traffic bundles) have always proven to be of high relevance, therefore, the perception of transparency and clarity of contracts by consumers is increasingly important. The 2015 Eurobarometer survey shows that consumers in Austria can easily compare bundle offers (73%, above the EU average of 69%). The ratio of positive respondents in Austria, 62% of subscribers who can easily monitor and control fixed telephone consumption are on the other hand well below the EU average of 71%, while for mobile, the 72% seems noticeable, as the EU average is 78. On the other hand, with regard to contract information respondents in Austria voiced more positive opinion than the EU average (only 10% unsatisfied compared to the EU average of 16%).
The following services are included in the scope of universal service in Austria: functional internet connection, telephony services, public pay telephones and directories (directory enquiry services are no longer included). Currently, A1 Telekom Austria is the designated universal service provider for an undefined period for the provision of the universal service at national level.
16 Source: Communications Committee. Data as of January to September 2014 and January to September 2015.17 Source: Communications Committee. Data as of January to September 2014 and January to September 2015.18 Source: Communications Committee. Data as of October 2014 and October 2015.19 Source: Communications Committee. Data as of October 2014 and October 2015.

88
EN
Poland
1. MEASURES FACILITATING DEPLOYMENT AND INVESTMENTS IN HIGH SPEED
NETWORKS
1.1. Spectrum
Harmonised bands MHz spectrum assigned1 % of the harmonised band assigned
800MHz 60 100%
900MHz 70 100%
1500MHz 0 0%
1800MHz 150 100%
2000MHz paired 120 100%
2600MHz 190 100%
3400-3600MHz 200 100%
3600-3800MHz 200 100%
Poland has assigned 96.1% of harmonised spectrum compared to the overall EU target.
Poland received derogation for the assignment of 800 MHz and 2.6 GHz till 31 December 2013. The auction for 800 MHz and 2.6 MHz that was announced in October 2014 only completed on 19 October 2015. The assignment procedure of the auctioned 800 MHz and 2.6 GHz blocks of spectrum to the selected entities has been concluded, however requests for reviewing frequency reservations decisions have been made to the NRA.
-Mobile started to share their respective radio access networks for the provision of mobile communications services in Poland via a dedicated joint venture company "Networks!", which coordinates the operation and development of the shared network. The cooperation includes the sharing of physical RAN infrastructure as well as radio spectrum frequencies separately allocated to each operator.
1.2. State of transposition of the BB CRD (Directive 2014/61/EU)
On 22 January Poland notified partial transposition of the Directive 2014/61/EU referring to several existing laws. The adoption of national legislation fully transposing the Directive is on-going.
1.3. EU and National investments in broadband
Fixed broadband coverage for rural areas is below the EU average (82% vs 90,6%). Poland has no single national broadband plan but a series of documents that circumscribe the overall framework, strategy and implementation approach regarding broadband network roll-out. The
1 Including guard bands

89
EN
country’s broadband targets are in line with the DAE. A series of socio-economic objectives include: safe and quick access to electronic public services and efficient communication between public institutions, citizens and businesses; the development of digital society; the development of modern education; the development of research and innovation; the creation of a digital single market.
Broadband infrastructure funding comes from both EU and state funds as well as private investments. Monetary resources from the EU are made available via the Operational Programme “Digital Poland” (Polska Cyfrowa), valid from 2014 to 2020. The estimated budget for activities relating to the construction of broadband infrastructure is approx. EUR 1.03 billion or about 4.33 billion PLZ funds allocated for co-financing investment. Regional and local actors are now responsible for 40 % of the sums available in the Digital Poland programme. Private investment needs for an effective broadband roll-out is calculated in the order of 8-12 billion PLZ until 2020.
No projects have been financed so far under CEF and Juncker plan. No Technical Assistance has been provided to Polish projects under Connected Communities.
2. COMPETITIVE LANDSCAPE
Fixed broadband subscriptions - operator market shares2
Incumbent market share New entrants market share
2014 2015 (EU average) 2014 2015 (EU average)
34,3% 30,4% (40,6%) 65,7% 69,6% (59,4%)
Fixed broadband subscriptions - technology market shares3
DSL (including VDSL) (EU) Cable Modem (EU) FTTH/B (EU) Other4 (EU)
38,9 % (EU 69,2%) 33,6% (EU 18,6%) 4,8% (EU 8,7%) 22,7% (EU 3,5%)
Mobile sector5
Number of MNOs Market shares of the first 2 MNOs Number of MVNOs (overall share)
8 29% 25% 18 (2.4%)
3. REGULATORY FUNCTION
New entrants` DSL subscriptions by type of access at EU level (VDSL and VULA excluded)6
Own network (EU) Full ULL (EU) Shared Access (EU) Bitstream (EU) Resale (EU)
2 Source: Communications Committee. Data as of July 2015.3 Source: Communications Committee. Data as of July 20154 Including fixed wireless.5 Source: Communications Committee. Data as of October 2015.6 Source: Communications Committee. Data as of July 2015.

90
EN
37% (0.6%) 17,8% (78.1%) 5% (2.3%) 39,5% (12%) 1% (7%)
LLU prices: 5.5EUR (EU Average 9.5EUR)7
The markets 1 (retail fixed-line access), 2 (wholesale fixed voice call origination) of 2007 Recommendation and market 18 (wholesale broadcasting transmission services) of 2003 Recommendation are still regulated as there is no effective competition. There is partial competition and therefore partial ex-ante regulation as regards market 13 (wholesale trunk segments of leased lines).
As regards FTRs, Poland is not compliant with the 2009 Termination Rate Recommendation. Poland applies BU LRIC+ cost accounting model for FTRs and pure BU LRIC cost accounting model for MTRs.
In 2015 the Commission services investigated the delays in conducting a market analysis forthe remaining regulated markets, for which it had been more than three years since the previous analysis had expired, including the market for wholesale local access at a fixed location (market 3a/2014), market for call origination on the public telephone network provided at a fixed location (market 2/2007), market for wholesale broadcasting transmission services (18/2003) and the market for SMS termination, market for wholesale call termination on individual public telephone networks provided at a fixed location (market 1/2014), access to the public telephone network at a fixed location for residential and non-residential customers (market 1/2007).
4. CONSUMER ISSUES
In Q3 2015 the average retail Eurotariff price for roaming was EUR 0.092 per minute for calls made and EUR 0.025 for calls received, both below the EU average (with alternative tariffs less expensive for calls made and for calls received). The average price for Euro-SMS in Poland was: EUR 0.053, close to the EU average. The average retail data price per Mb in Poland was EUR 0.070, above the EU average of EUR 0.0598.
Number portability 2014 2015
Fixed Number of transactions9 384.227 435.612
% of total numbers10 5,8% 7,0%
Maximum wholesale price11 4 3
Maximum time under regulation (number of working days)12
1 1
Mobile Number of transactions13 1.555.931 1.598.826
7 Full LLU monthly average total cost in EUR; source: Communications Committee. Data as of October 2015. 8 International Roaming BEREC Benchmark Data Report April 2015 – September 2015 BoR(16)289 Source: Communications Committee. Data as of January to September 2014 and January to September 2015.10 Source: Communications Committee. Data as of January to September 2014 and January to September 2015.11 Source: Communications Committee. Data as of October 2014 and October 2015.12 Source: Communications Committee. Data as of October 2014 and October 2015.13 Source: Communications Committee. Data as of January to September 2014 and January to September 2015.

91
EN
% of total numbers14 3,0% 3,0%
Maximum wholesale price15 - -
Maximum time under regulation (number of working days)16
1 1
With more complex products in the market (double and triple play as well as traffic bundles) becoming increasingly relevant in the market, the perception of transparency and clarity of contracts by consumers is increasingly important. The 2015 Eurobarometer survey17 shows that 77% of Polish consumers consider they can easily compare bundle offers which is above EU average of 69%. Furthermore, it is easier to monitor consumption for mobile (76%, EU average 78%) than for fixed (64%, EU average 71%), 68% for mobile internet consumption (close to EU average of 69%), and 75% for fixed internet access (above EU average of 67%).
With regards to the clarity of contracts 82% are satisfied (EU average 84%) with the contract information. In total 76% are satisfied with the contract information. 10% have not been satisfied compared to 7% of EU average.
As evidenced by the annual survey of consumer preferences, 6% of consumers saw improvement of transparency of telecommunications contracts as one of positive changes on the telecommunications market in 2015. In the abovementioned survey 6% of respondents pointed out that the lack of transparency of telecommunication contracts is a negative factor on the telecommunications market.18
In Poland the Universal Service Obligation was withdrawn in 2011 as regards all four components of the Universal Service.
Every 3 years Poland carries out the analysis of quality, availability and affordability of all four components of the Universal Service and the results are described in a report. The latest report was published in 2014. Preparations have started for the analysis covering the period 2013-2015.
14 Source: Communications Committee. Data as of January to September 2014 and January to September 2015.15 Source: Communications Committee. Data as of October 2014 and October 2015.16 Source: Communications Committee. Data as of October 2014 and October 2015.17 Source: Special Eurobarometer 438 E-communications and the Digital Single Market, October 201518 Source: UKE based on a consumer survey "Telecommunications market in Poland in 2015,"conducted by PBS DGA and INDICATOR: https://www.uke.gov.pl/files/?id_plik=21543

92
EN
Portugal
1. MEASURES FACILITATING DEPLOYMENT AND INVESTMENTS IN HIGH SPEED
NETWORKS
1.1. Spectrum
Harmonised bands MHz spectrum assigned1 % of the harmonised band assigned
800MHz 60 100%
900MHz 54 77,1%
1500MHz 0 0%
1800MHz 120 80%
2000MHz paired 110 91,7%
2600MHz 145 76,3%
3400-3600MHz 200 100%
3600-3800MHz 60 30%
Overall Portugal has assigned 72,7% of the overall harmonised spectrum for BB (the same as the EU average). Portugal had already carried out in 2011 a spectrum allocation process (multiband auction) for a period of 15 years renewable. The assigned spectrum is used to provide electronic communication services including mobile broadband and operators which acquired spectrum in the 800 MHz band have to fulfil certain coverage obligations2. A part of the multiband spectrum auction (around 25 % of the frequency bands) remained unsold. Further spectrum awards (including the remaining spectrum from the multiband auction) are under scrutiny. The future usage of the 700 MHz band is not part of any political discussions at the moment.
1.2. State of transposition of the BB CRD (Directive 2014/61/EU)
Portugal has already implemented a Centralised Information System (CIS) in line with Directive 2014/61/EU. The system is operational since the 14th of January 2016. According to the law, entities (mentioned on article 2 of Decree Law 123/2009) who hold infrastructures suitable for the accommodation of electronic communications networks, electronic communications companies, as well as holders of infrastructures suitable for the accommodation of electronic communications networks that are used by the latter shall make available in CIS the relevant information about the referred infrastructures. Despite the fact that a significant part of the provisions of Directive 2014/61/EU is already provided for by existing Portuguese legislation, some adjustments to Portuguese law still have to be made to ensure the complete transposition of the Directive. The adoption process of the national
1 Including guard bands2 Within the recent procedure of renewal of rights of use of the 2100 MHz, new coverage obligations were imposed on the three mobile operators.
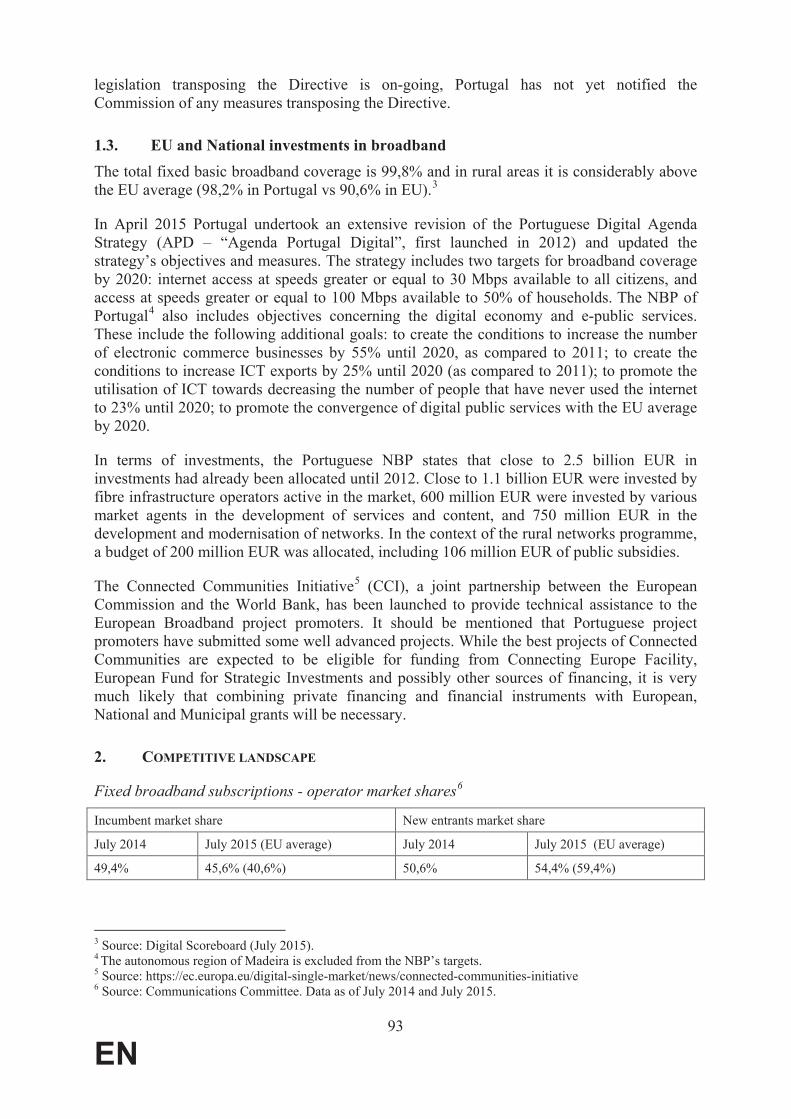
93
EN
legislation transposing the Directive is on-going, Portugal has not yet notified the Commission of any measures transposing the Directive.
1.3. EU and National investments in broadband
The total fixed basic broadband coverage is 99,8% and in rural areas it is considerably above the EU average (98,2% in Portugal vs 90,6% in EU).3
In April 2015 Portugal undertook an extensive revision of the Portuguese Digital Agenda Strategy (APD – “Agenda Portugal Digital”, first launched in 2012) and updated the strategy’s objectives and measures. The strategy includes two targets for broadband coverage by 2020: internet access at speeds greater or equal to 30 Mbps available to all citizens, and access at speeds greater or equal to 100 Mbps available to 50% of households. The NBP of Portugal4 also includes objectives concerning the digital economy and e-public services. These include the following additional goals: to create the conditions to increase the number of electronic commerce businesses by 55% until 2020, as compared to 2011; to create the conditions to increase ICT exports by 25% until 2020 (as compared to 2011); to promote the utilisation of ICT towards decreasing the number of people that have never used the internet to 23% until 2020; to promote the convergence of digital public services with the EU average by 2020.
In terms of investments, the Portuguese NBP states that close to 2.5 billion EUR in investments had already been allocated until 2012. Close to 1.1 billion EUR were invested by fibre infrastructure operators active in the market, 600 million EUR were invested by various market agents in the development of services and content, and 750 million EUR in the development and modernisation of networks. In the context of the rural networks programme, a budget of 200 million EUR was allocated, including 106 million EUR of public subsidies.
The Connected Communities Initiative5 (CCI), a joint partnership between the European Commission and the World Bank, has been launched to provide technical assistance to the European Broadband project promoters. It should be mentioned that Portuguese project promoters have submitted some well advanced projects. While the best projects of Connected Communities are expected to be eligible for funding from Connecting Europe Facility, European Fund for Strategic Investments and possibly other sources of financing, it is very much likely that combining private financing and financial instruments with European, National and Municipal grants will be necessary.
2. COMPETITIVE LANDSCAPE
Fixed broadband subscriptions - operator market shares6
Incumbent market share New entrants market share
July 2014 July 2015 (EU average) July 2014 July 2015 (EU average)
49,4% 45,6% (40,6%) 50,6% 54,4% (59,4%)
3 Source: Digital Scoreboard (July 2015).4 The autonomous region of Madeira is excluded from the NBP’s targets. 5 Source: https://ec.europa.eu/digital-single-market/news/connected-communities-initiative6 Source: Communications Committee. Data as of July 2014 and July 2015.
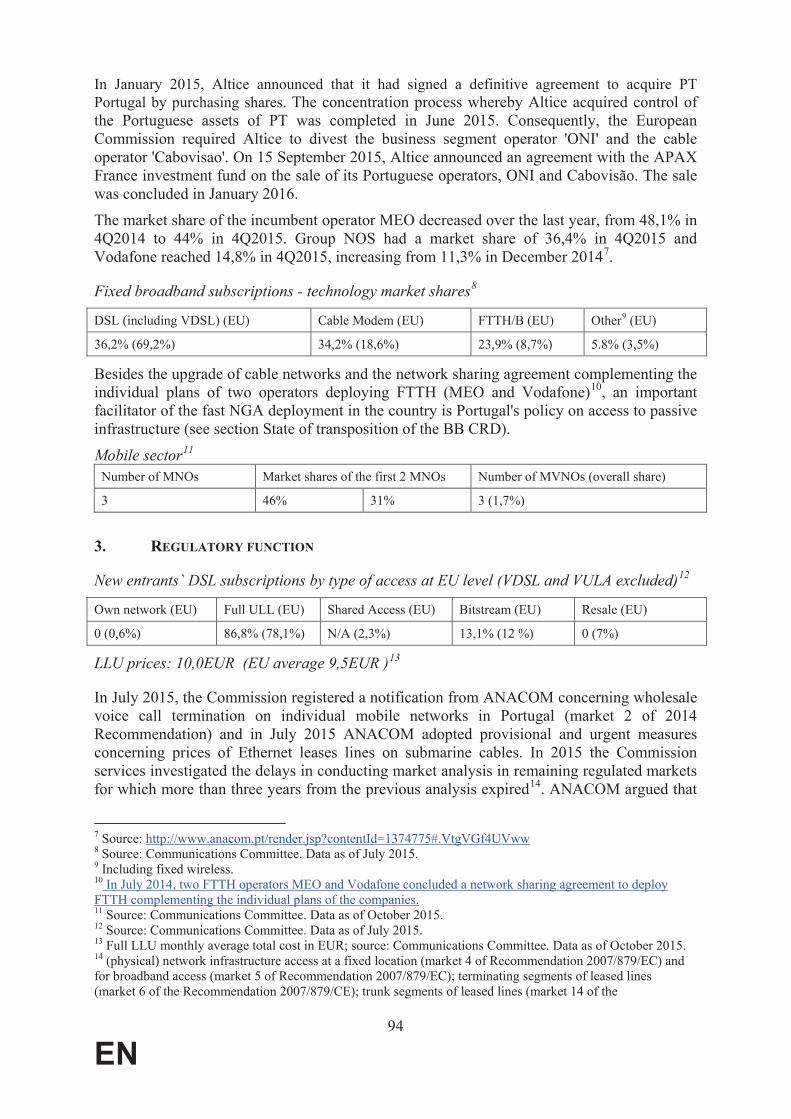
94
EN
In January 2015, Altice announced that it had signed a definitive agreement to acquire PT Portugal by purchasing shares. The concentration process whereby Altice acquired control of the Portuguese assets of PT was completed in June 2015. Consequently, the European Commission required Altice to divest the business segment operator 'ONI' and the cable operator 'Cabovisao'. On 15 September 2015, Altice announced an agreement with the APAX France investment fund on the sale of its Portuguese operators, ONI and Cabovisão. The sale was concluded in January 2016.
The market share of the incumbent operator MEO decreased over the last year, from 48,1% in 4Q2014 to 44% in 4Q2015. Group NOS had a market share of 36,4% in 4Q2015 and Vodafone reached 14,8% in 4Q2015, increasing from 11,3% in December 20147.
Fixed broadband subscriptions - technology market shares8
DSL (including VDSL) (EU) Cable Modem (EU) FTTH/B (EU) Other9 (EU)
36,2% (69,2%) 34,2% (18,6%) 23,9% (8,7%) 5.8% (3,5%)
Besides the upgrade of cable networks and the network sharing agreement complementing the individual plans of two operators deploying FTTH (MEO and Vodafone)10, an important facilitator of the fast NGA deployment in the country is Portugal's policy on access to passive infrastructure (see section State of transposition of the BB CRD).
Mobile sector11
Number of MNOs Market shares of the first 2 MNOs Number of MVNOs (overall share)
3 46% 31% 3 (1,7%)
3. REGULATORY FUNCTION
New entrants` DSL subscriptions by type of access at EU level (VDSL and VULA excluded)12
Own network (EU) Full ULL (EU) Shared Access (EU) Bitstream (EU) Resale (EU)
0 (0,6%) 86,8% (78,1%) N/A (2,3%) 13,1% (12 %) 0 (7%)
LLU prices: 10,0EUR (EU average 9,5EUR )13
In July 2015, the Commission registered a notification from ANACOM concerning wholesale voice call termination on individual mobile networks in Portugal (market 2 of 2014 Recommendation) and in July 2015 ANACOM adopted provisional and urgent measures concerning prices of Ethernet leases lines on submarine cables. In 2015 the Commission services investigated the delays in conducting market analysis in remaining regulated markets for which more than three years from the previous analysis expired14. ANACOM argued that
7 Source: http://www.anacom.pt/render.jsp?contentId=1374775#.VtgVGf4UVww8 Source: Communications Committee. Data as of July 2015.9 Including fixed wireless.10 In July 2014, two FTTH operators MEO and Vodafone concluded a network sharing agreement to deploy FTTH complementing the individual plans of the companies.11 Source: Communications Committee. Data as of October 2015.12 Source: Communications Committee. Data as of July 2015.13 Full LLU monthly average total cost in EUR; source: Communications Committee. Data as of October 2015. 14 (physical) network infrastructure access at a fixed location (market 4 of Recommendation 2007/879/EC) and for broadband access (market 5 of Recommendation 2007/879/EC); terminating segments of leased lines (market 6 of the Recommendation 2007/879/CE); trunk segments of leased lines (market 14 of the
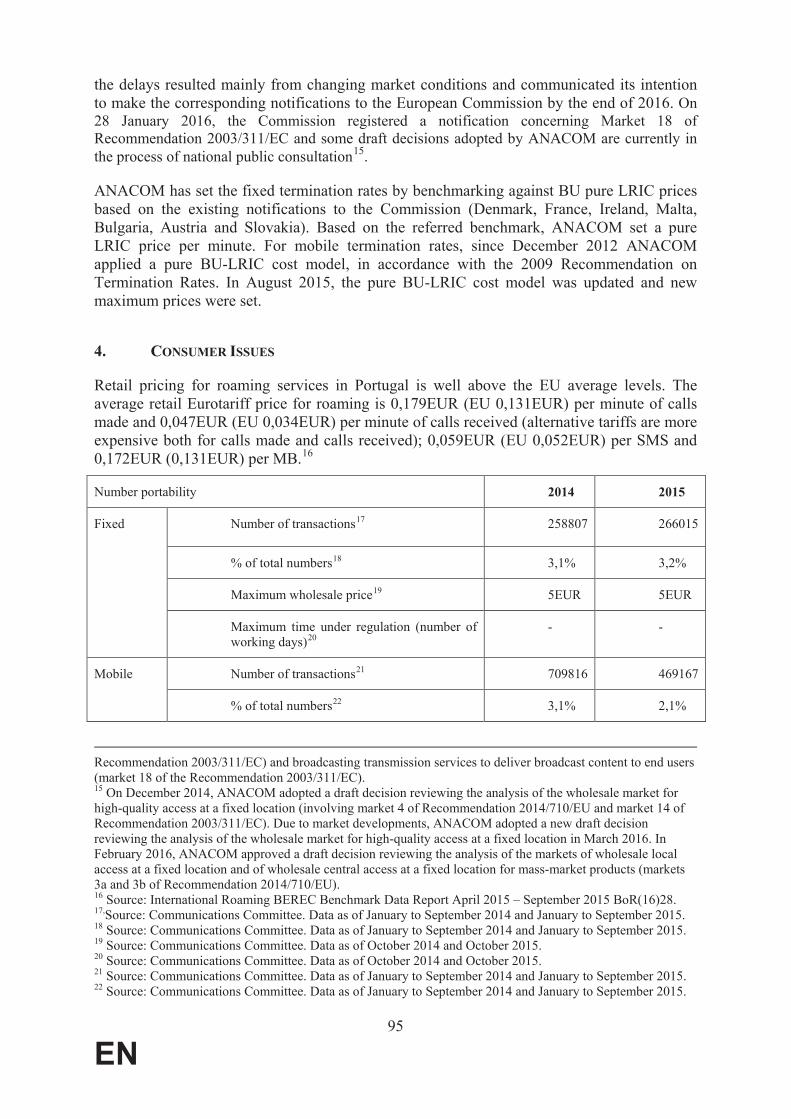
95
EN
the delays resulted mainly from changing market conditions and communicated its intention to make the corresponding notifications to the European Commission by the end of 2016. On 28 January 2016, the Commission registered a notification concerning Market 18 of Recommendation 2003/311/EC and some draft decisions adopted by ANACOM are currently in the process of national public consultation15.
ANACOM has set the fixed termination rates by benchmarking against BU pure LRIC prices based on the existing notifications to the Commission (Denmark, France, Ireland, Malta, Bulgaria, Austria and Slovakia). Based on the referred benchmark, ANACOM set a pure LRIC price per minute. For mobile termination rates, since December 2012 ANACOM applied a pure BU-LRIC cost model, in accordance with the 2009 Recommendation on Termination Rates. In August 2015, the pure BU-LRIC cost model was updated and new maximum prices were set.
4. CONSUMER ISSUES
Retail pricing for roaming services in Portugal is well above the EU average levels. The average retail Eurotariff price for roaming is 0,179EUR (EU 0,131EUR) per minute of calls made and 0,047EUR (EU 0,034EUR) per minute of calls received (alternative tariffs are more expensive both for calls made and calls received); 0,059EUR (EU 0,052EUR) per SMS and 0,172EUR (0,131EUR) per MB.16
Number portability 2014 2015
Fixed Number of transactions17 258807 266015
% of total numbers18 3,1% 3,2%
Maximum wholesale price19 5EUR 5EUR
Maximum time under regulation (number of working days)20
- -
Mobile Number of transactions21 709816 469167
% of total numbers22 3,1% 2,1%
Recommendation 2003/311/EC) and broadcasting transmission services to deliver broadcast content to end users (market 18 of the Recommendation 2003/311/EC).15 On December 2014, ANACOM adopted a draft decision reviewing the analysis of the wholesale market for high-quality access at a fixed location (involving market 4 of Recommendation 2014/710/EU and market 14 of Recommendation 2003/311/EC). Due to market developments, ANACOM adopted a new draft decision reviewing the analysis of the wholesale market for high-quality access at a fixed location in March 2016. InFebruary 2016, ANACOM approved a draft decision reviewing the analysis of the markets of wholesale local access at a fixed location and of wholesale central access at a fixed location for mass-market products (markets 3a and 3b of Recommendation 2014/710/EU).16 Source: International Roaming BEREC Benchmark Data Report April 2015 – September 2015 BoR(16)28.17,Source: Communications Committee. Data as of January to September 2014 and January to September 2015.18 Source: Communications Committee. Data as of January to September 2014 and January to September 2015.19 Source: Communications Committee. Data as of October 2014 and October 2015.20 Source: Communications Committee. Data as of October 2014 and October 2015.21 Source: Communications Committee. Data as of January to September 2014 and January to September 2015.22 Source: Communications Committee. Data as of January to September 2014 and January to September 2015.

96
EN
Maximum wholesale price23 5EUR 5EUR
Maximum time under regulation (number of working days)24
- -
Eurobarometer Survey data25 shows that the vast majority of Portuguese respondents (80%) find it easy to compare the services and prices of their current bundle with other bundled offers. The level of consumer satisfaction in this respect is higher than the EU average of 69%. It is easier to monitor consumption for fixed telephone services (76%, EU 71%) than for mobile data (60%, EU 69%), while there is less satisfaction with regard to contract information (22% unsatisfied, EU 16%).
The scope of the universal service includes access to a network at a fixed location ensuring dial-up functional internet connection and the provision of fixed telephony services, comprehensive directories, comprehensive directory enquiries and public payphone. Currently the inclusion of broadband within the scope is not envisaged. Portugal was subject to infringement proceedings and judgements by the CJEU over the past years regarding the implementation of the designation of universal service requirements under the Universal Service Directive. Since then a new designation procedure was carried out following an open tender and two alternative operators, which have since merged, became the current universal service providers for the fixed telephony services and access to a network at a fixed location (in different regions) whilst the incumbent became the universal service provider for comprehensive directories, comprehensive directory enquiries and public payphone services. Infringement proceedings are ongoing concerning the non-conformity of the compensation fund in Portugal with the relevant provisions of the Universal Service Directive.
23 Source: Communications Committee. Data as of October 2014 and October 2015.24 Source: Communications Committee. Data as of October 2014 and October 2015.25 Source: Eurobarometer survey (2015).

97
EN
Romania
1. MEASURES FACILITATING DEPLOYMENT AND INVESTMENTS IN HIGH SPEED
NETWORKS
1.1. Spectrum
Harmonised bands MHz spectrum assigned1 % of the harmonised band assigned
800MHz 50 83.3
900MHz 70 100
1500MHz 0 0
1800MHz 150 100
2000MHz paired 120 100
2600MHz 110 57.9
3400-3600MHz 1502 75
3600-3800MHz 145 72.5
73,58%3 of spectrum is assigned compared to the overall EU target.
Romania requested a derogation until 5 April 2014, on which date the 800 MHz band will be freed by the Department of Defence and will become available for electronic communications services. At the beginning of 2014, ANCOM launched a public consultation with the aim to investigate the interest and the intentions of the market players to participate in a new selection procedure, for granting rights of use for the spectrum not yet awarded in the 800 MHz and 2600 MHz bands. All operators were extremely firm in expressing their lack of interest for that available spectrum in the 2014-2015 period.
During September-October 2015, ANCOM organised a competitive selection procedure in order to grant spectrum usage rights in the 3.4-3.8 GHz band. The minimum licence fee was 370.000 euros, for each 2x5 MHz block in the 3.4-3.6 GHz band, and 185,000 euros, for each 5 MHz block in the 3.6-3.8 GHz band. These values were the starting bidding prices for any frequency blocks, depending of the frequency band. Five public operators participated in this selection procedure: two of them acquired spectrum in the 3400-3600 MHz band, two other operators acquired spectrum in the 3600-3800 MHz band and one operator acquired spectrum in both bands. The total amount collected through the licence fees, for both bands, is 10,124,101 EUR.
1 Including guard bands2 The value includes 110 MHz of actually occupied spectrum (that was granted during the auction) and 40 MHz consisting of 2x10 MHz lateral guard bands and 20 MHz duplex gap.3 Differs from the 2016 DESI indicator as it was updated by the Member State
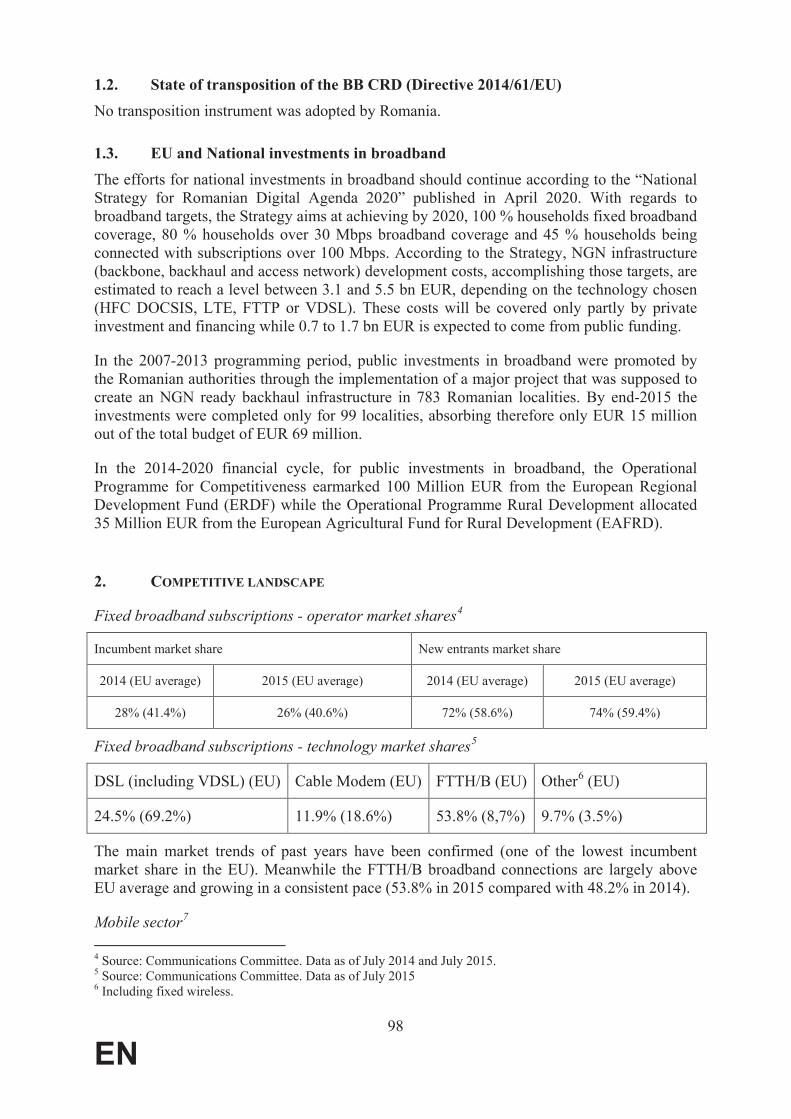
98
EN
1.2. State of transposition of the BB CRD (Directive 2014/61/EU)
No transposition instrument was adopted by Romania.
1.3. EU and National investments in broadband
The efforts for national investments in broadband should continue according to the “National Strategy for Romanian Digital Agenda 2020” published in April 2020. With regards to broadband targets, the Strategy aims at achieving by 2020, 100 % households fixed broadband coverage, 80 % households over 30 Mbps broadband coverage and 45 % households being connected with subscriptions over 100 Mbps. According to the Strategy, NGN infrastructure (backbone, backhaul and access network) development costs, accomplishing those targets, are estimated to reach a level between 3.1 and 5.5 bn EUR, depending on the technology chosen (HFC DOCSIS, LTE, FTTP or VDSL). These costs will be covered only partly by private investment and financing while 0.7 to 1.7 bn EUR is expected to come from public funding.
In the 2007-2013 programming period, public investments in broadband were promoted by the Romanian authorities through the implementation of a major project that was supposed to create an NGN ready backhaul infrastructure in 783 Romanian localities. By end-2015 the investments were completed only for 99 localities, absorbing therefore only EUR 15 million out of the total budget of EUR 69 million.
In the 2014-2020 financial cycle, for public investments in broadband, the Operational Programme for Competitiveness earmarked 100 Million EUR from the European Regional Development Fund (ERDF) while the Operational Programme Rural Development allocated 35 Million EUR from the European Agricultural Fund for Rural Development (EAFRD).
2. COMPETITIVE LANDSCAPE
Fixed broadband subscriptions - operator market shares4
Incumbent market share New entrants market share
2014 (EU average) 2015 (EU average) 2014 (EU average) 2015 (EU average)
28% (41.4%) 26% (40.6%) 72% (58.6%) 74% (59.4%)
Fixed broadband subscriptions - technology market shares5
DSL (including VDSL) (EU) Cable Modem (EU) FTTH/B (EU) Other6 (EU)
24.5% (69.2%) 11.9% (18.6%) 53.8% (8,7%) 9.7% (3.5%)
The main market trends of past years have been confirmed (one of the lowest incumbent market share in the EU). Meanwhile the FTTH/B broadband connections are largely above EU average and growing in a consistent pace (53.8% in 2015 compared with 48.2% in 2014).
Mobile sector7
4 Source: Communications Committee. Data as of July 2014 and July 2015.5 Source: Communications Committee. Data as of July 20156 Including fixed wireless.

99
EN
Number of MNOs Market shares of the first 2 MNOs Number of MVNOs (overall share)
5 42% 30% 1 Full MVNO (0.3%)
3. REGULATORY FUNCTION
New entrants` DSL subscriptions by type of access at EU level (VDSL and VULA excluded)8
Own network (EU) Full ULL (EU) Shared Access (EU) Bitstream (EU) Resale (EU)
52% (0.6%) 47.7% (78.1%) - (2.3%) - (12%) - (7%)
LLU price EUREUR 7.3 (EU Average: EUR 9.5)9
ex-Markets 10 and 18 of the 2003 relevant market recommendation are still regulated.
In 2015 the Commission services investigated the delays in conducting a market analysis in the four remaining regulated markets, for which it had been more than three years since the previous analysis had expired, including market 18 of the 2003 Recommendation (wholesale broadcasting transmission services), market 1 of the 2014 Recommendation (Wholesale fixed voice call termination), market 2 of the 2014 Recommendation (Wholesale mobile voice call termination) and market 4 of the 2014 Recommendation (Wholesale leased lines terminating segments) which are therefore still subject to the old regulatory obligations and for which national public consultation has not yet been launched. All other markets included in the 2007 and 2003 Recommendations, on the contrary, have been deregulated with the exception of market 10 of the 2003 Recommendation (Wholesale transit services in the fixed public telephone network).
As a first within the EU Romania decided to deregulate markets 3a and 3b of the 2014 Recommendation (Wholesale local access and Wholesale central access)
For both fixed and mobile termination rates, ANCOM has applied a pure BU-LRIC cost model, in accordance with the 2009 Recommendation on Termination Rates.
4. CONSUMER ISSUES
The average retail Eurotariff price for roaming is 0,143EUR per minute of calls made and 0,041EUR per minute of calls received (with alternative tariffs more expensive for calls made but cheaper for calls received: 0,015) and 0,058 per SMS. However 0,170EUR per MB for data is well beyond the EU average (EU 0,059EUR per MB).
Number portability 2014 2015
Fixed Number of transactions10 58874 58949
7 Source: Communications Committee. Data as of October 2015.8 Source: Communications Committee. Data as of July 2015.9 Full LLU monthly average total cost in EUR; source: Communications Committee. Data as of October 2015. 10 Source: Communications Committee. Data as of January to September 2014 and January to September 2015.

100
EN
% of total numbers11 1,3% 1,4%
Maximum wholesale price12 8 8
Maximum time under regulation (number of working days)13
1 1
Mobile Number of transactions14 298406 468803
% of total numbers15 1,2% 1,8%
Maximum wholesale price16 6 6
Maximum time under regulation (number of working days)17
1 1
With more complex products in the market (double and triple play as well as traffic bundles) becoming increasingly relevant in the market, the perception of transparency and clarity of contracts by consumers is increasingly important. The 2015 Eurobarometer survey shows 80% of Romanian consumers consider that they can easily compare bundle offers (up from 64% in previous 2014 survey), it is easier to monitor consumption for mobile (78%, EU average 69%) than for fixed (61%, EU average 71%), while the satisfaction with regard to contract information is above with the EU average of 84% (91% declared high and medium satisfaction).
The following services are included in the scope of universal service in Romania: telephone services at household level, directory enquiry services and directories, and public pay phones. Currently no universal service provider is designated.
11 Source: Communications Committee. Data as of January to September 2014 and January to September 2015.12 Source: Communications Committee. Data as of October 2014 and October 2015.13 Source: Communications Committee. Data as of October 2014 and October 2015.14 Source: Communications Committee. Data as of January to September 2014 and January to September 2015.15 Source: Communications Committee. Data as of January to September 2014 and January to September 2015.16 Source: Communications Committee. Data as of October 2014 and October 2015.17 Source: Communications Committee. Data as of October 2014 and October 2015.

101
EN
SLOVENIA
1. MEASURES FACILITATING DEPLOYMENT AND INVESTMENTS IN HIGH SPEED
NETWORKS
1.1. Spectrum
Harmonised bands MHz spectrum assigned1 % of the harmonised band assigned
800MHz 60 100%
900MHz 70 100%
1500MHz 0 0%
1800MHz 130 86.7%
2000MHz paired 110 91.7%
2600MHz 190 100%
3400-3600MHz 422 21%
3600-3800MHz 20 10%
Overall Slovenia has assigned 60.4% of overall harmonised spectrum for broadband.
In 2014 the National Regulatory Authority AKOS has started preparing a new tender for public auction for the allocation of radio frequencies for the provision of mobile services. TheNational Regulatory Authority planned to auction frequencies of 700 MHz, 1400 MHz, 1800 MHz, 2100MHz, 2300 MHz, 3500 MHz and 3700 MHz frequency bands in year 2016 but the project was suspended in accordance with strategic guidelines from the Ministry. Forfrequencies 1800 and 2100 MHz, the public auction is due in first half of 2016 after the approval of the price by the government.
1.2. State of transposition of the BB CRD (Directive 2014/61/EU)
On 22.12.2015 Slovenia notified the Commission of partial transposition of the Directive 2014/61/EU. The adoption of national legislation fully transposing the Directive is on-going. In this context, beginning of 2016 AKOS has published a study3 analysing existing legislation and proposing legislative changes required for optimal implementation of the Directive 2014/61/EU.
1 Including guard bands2 Licences will be modified in accordance with new EC decision 2014/276/EU3 Študija pregleda slovenske zakonodaje in predloga za optimalno implementacijo Direktive 2014/61/EU, November 2015, Eudace d.o.o.

102
EN
1.3. EU and National investments in broadband
Fixed basic broadband coverage of rural areas is below the EU average (84% vs 90,6%). Following the public consultation held in 2014 and 2015 and following the ministerial consultation held in 2015 the Government of the Republic of Slovenia approved in March 2016 the new national NGN plan. The new plan sets new targets to be achieved by 2020, with a planned 96% of the households to be connected with broadband speeds of at least 100 Mb/s and the remaining 4% of households connected with speeds of at least 30 Mb/s. The plan also foresees an estimated EUR 365 million of investments, of which EUR 72,5 million of public resources.
The Operational Programme for the Implementation of the EU Cohesion Policy in the period 2014 – 2020 includes ERDF funding for broadband investments of 50.02 million EUR. ), 12.5 millions of national co-financing and EUR 7.5 million from the European Agricultural Fund for Rural Development (EAFRD Programme), with further EUR 2.5 million of national co-financing.
The Connected Communities Initiative4 (CCI), a joint partnership between the European Commission and the World Bank, has been launched to provide technical assistance to the European Broadband project promoters. It should be mentioned that Slovenian project promoters have submitted some well advanced projects. While the best projects of Connected Communities are expected to be eligible for funding from Connecting Europe Facility, European Fund for Strategic Investments and possibly other sources of financing, it is very much likely that combining private financing and financial instruments with European, National and Municipal grants will be necessary.
2. COMPETITIVE LANDSCAPE
Fixed broadband subscriptions - operator market shares5
Incumbent market share New entrants market share
July 2014 July 2015 (EU average) July 2014 July 2015 (EU average)
35.5% 34.3% (40.6%) 64.5% 65.7% (59.4%)
Fixed broadband subscriptions - technology market shares6
DSL (including VDSL) (EU) Cable Modem (EU) FTTH/B (EU) Other7 (EU)
43.5% (69.2%) 30.4% (18.6%) 24.1% (8.7%) 2.1% (3.5%)
Mobile sector8
Number of MNOs Market shares of the first 2 MNOs Number of MVNOs (overall share)
4 https://ec.europa.eu/digital-single-market/news/connected-communities-initiative5 Source: Communications Committee. Data as of July 2014 and July 2015.6 Source: Communications Committee. Data as of July 20157 Including fixed wireless.8 Source: Communications Committee. Data as of October 2015.

103
EN
4 47% 30% 3 (7.1%)
During 2015 two mergers have been completed. Firstly in April 2015 the third largest mobile operator Tusmobil was acquired by the cable operator Telemach. In Autumn 2015 the second largest mobile operator Simobil acquired fixed line operator Amis.
3. REGULATORY FUNCTION
New entrants` DSL subscriptions by type of access at EU level (VDSL and VULA excluded)9
Own network (EU)
Full LLU (EU) Shared Access (EU) Bitstream (EU) Resale (EU)
0% (0.6%) 40.5% (78.1%) 4.7% (2.3%) 54.7 (12.0%) N/A(7.0%)
LLU price: 9.1 EUR (EU Average: 9.5 EUR)10
In 2015 the Commission services investigated the delays in conducting a market analysis for the four regulated markets, for which it had been more than three years since the previous analysis had expired, including the market for wholesale local access provided at a fixed location (M 3a), the market for wholesale central access provided at a fixed location for mass-market products (M 3b), the market for wholesale high-quality access provided at a fixed location (M4) and the wholesale broadcasting transmission services market (ex-M 18). In December 2015, AKOS launched a public consultation process on the Methodologies for regulation of relevant markets M3a, M3b and M4 while in January 2016, AKOS started analysing relevant ex-M 18. Progress has been registered in the implementation of the new mapping system, with adoption of secondary legislation on access to data to preserve business secrets and with verification of the accuracy and trustworthiness of data through field research. AKOS developed its own database integrating already available information with additional data collected from owners of electronic communications infrastructure, enabling the NRA to get a complete picture of the fixed and wireless networks available in Slovenia. This mapping system will be used in the process of analysing relevant markets 3a, 3b and 4 in the geographical segmentation part and to assess the potential inclusion of broadband access in the universal service obligation.
With regard to the compliance with the 2009 Termination Rate Recommendation in Slovenia AKOS has adopted a pure BULRIC cost-accounting model for FTR and MTR.
4. CONSUMER ISSUES
The average retail Eurotariff price for roaming is 0,142EUR per minute of calls made and 0,041EUR per minute of calls received (with alternative tariffs more expensive for calls made and for calls received), 0,053EUR per SMS and 0,064EUR per MB, generally close to the EU average. Data prices dropped significantly in the Q3 of 2015, significantly below the EU average of EUR0.05911.
9 Source: Communications Committee. Data as of July 2015.10 Full LLU monthly average total cost in EUR; source: Communications Committee. Data as of October 2015.11 International Roaming BEREC Benchmark Data Report April 2015 – September 2015 BoR(16)28

104
EN
Number portability 1 2014 2015
Fixed Number of transactions12 62 888 32 207
% of total numbers13 4.5% 2.4%
Maximum wholesale price14 - -
Maximum time under regulation (number of working days) 15
1 1
Mobile Number of transactions16 77 639 81 795
% of total numbers17 3.4% 3.4%
Maximum wholesale price18 - -
Maximum time under regulation (number of working days) 19
1 1
The 2015 Eurobarometer survey shows that 68% of Slovenian consumers consider they can easily compare bundled offers which in line with the EU average. Furthermore, it is easier to monitor consumption for mobile (83%, EU average 69%) than for fixed (63%, EU average 71%), while there is above average satisfaction with regard to contract information (87%, EU 84%).
The scope of the universal service includes connection to a fixed network at a reasonable request, directory services, provision of public telephone boxes (with a glide path to reduce those), and provision of measures for disabled people. Telekom Slovenije is the designated provider for the provision of access at a fixed location and provision of telephone services for a period of two years since November 2014. The AKOS is planning to analyse in 2016 the market and determine the functional speed for internet through a General act prescribing the speed for the functional internet access based on which the next designation will be done.
12 Source: Communications Committee. Data as of January to September 2014 and January to September 2015.13 Source: Communications Committee. Data as of January to September 2014 and January to September 2015.14 Source: Communications Committee. Data as of October 2014 and October 2015.15 Source: Communications Committee. Data as of October 2014 and October 2015.16 Source: Communications Committee. Data as of January to September 2014 and January to September 2015.17 Source: Communications Committee. Data as of January to September 2014 and January to September 2015.18 Source: Communications Committee. Data as of October 2014 and October 2015.19 Source: Communications Committee. Data as of October 2014 and October 2015.

105
EN
Slovakia
1. MEASURES FACILITATING DEPLOYMENT AND INVESTMENTS IN HIGH SPEED
NETWORKS
1.1. Spectrum
Harmonised bands MHz spectrum assigned1 % of the harmonised band assigned
800MHz 60 MHz 100%
900MHz 61.2 MHz 87%
1500MHz N/A N/A
1800MHz 132 MHz 88%
2000MHz paired 120 MHz 100%
2600MHz 190 MHz 100%
3400-3600MHz 176 MHz 88%
3600-3800MHz 120 MHz 60%
Three blocks of 8x5 MHz were assigned to O2 Slovakia, SWAN and BENESTRA in 3.7 GHz spectrum band in February 2015, following an electronic auction with the final total price value of 1.17 million EUR. These nationwide licenses in 3.7 GHz (TDD) are valid until the end of 2024.
Following an electronic auction (SMRA format) related to 3.5 GHz spectrum band, two frequency assignments took place in August 2015: 16x5 MHz (TDD and FDD) for O2 Slovakia and 4x5 MHz (TDD) for SWAN, with the total final price value of 2.43 million EUR. The licenses are valid until the end of August 2025. A call for tender for the remaining available frequencies in the 3.5 GHz spectrum band (7 MHz) was initiated in February 2016.
Commission services are investigating the issue of lack of spectrum assignment in the 3.7 GHz spectrum band, in particular with respect to local licenses.
1.2. State of transposition of the BB CRD (Directive 2014/61/EU)
Slovakia notified a partial transposition of the Cost Reduction Directive in November 2015, by Law 247/2015 amending the Electronic Communications Act 351/2011. In order to complete the transposition process, further legislative measures are required in particular with respect to the establishment of a Single Information Point.
1 Including guard bands

106
EN
1.3. EU and National investments in broadband
Rural fixed broadband coverage increased slightly to 83% of households in 2015, but remained however still below the EU average of 91%.
In its latest Strategic Document for Digital Growth and Next Generation Access Infrastructure (2014-2020), Slovakia formulates strategic digital society objectives towards broadband development, cultivating eGovernment services, improving the functioning of information society and establishing a “Smart Government”. Slovakia estimates that about 161.5 million EUR of investment into digital society should come from the EU’s structural funds, 28.5 million EUR from state budget coupled with ERDF or EAFRD funds, and 1.7 billion EUR are expected from private investments, totalling 1.89 billion EUR. Planned financing for broadband deployment, earmarked from ERDF via Operational Programme Integrated Infrastructure, totals 97.75 million EUR.
Until 2015, there was a major state aid measure in place to achieve the construction of a national backhaul network to connect the so-called "white spots". The establishment of public-sector-only wireless network is also in discussion. There are no regional broadband plans available in the Slovak Republic.
2. COMPETITIVE LANDSCAPE
Fixed broadband subscriptions - operator market shares2
Incumbent market share New entrants market share
2014 2015 (EU average) 2014 2015 (EU average)
35% 34.7% (40.6%) 65% 65.3% (59.4%)
Fixed broadband subscriptions - technology market shares3
DSL (including VDSL) (EU) Cable Modem (EU) FTTH/B (EU) Other4
(EU)
38.8% 12.6% 26.2% 22.4%
Mobile sector5
Number of MNOs Market shares of the first 2 MNOs Number of MVNOs (overall share)
4 43% 31% 2 (N/A)
The latest entrant in the mobile market, the fourth mobile operator SWAN, started building its nationwide network for the provision of broadband access in July 2014.
2 Source: Communications Committee. Data as of July 2014 and July 20153 Source: Communications Committee. Data as of July 20154 Including fixed wireless5 Source: Communications Committee. Data as of October 2015
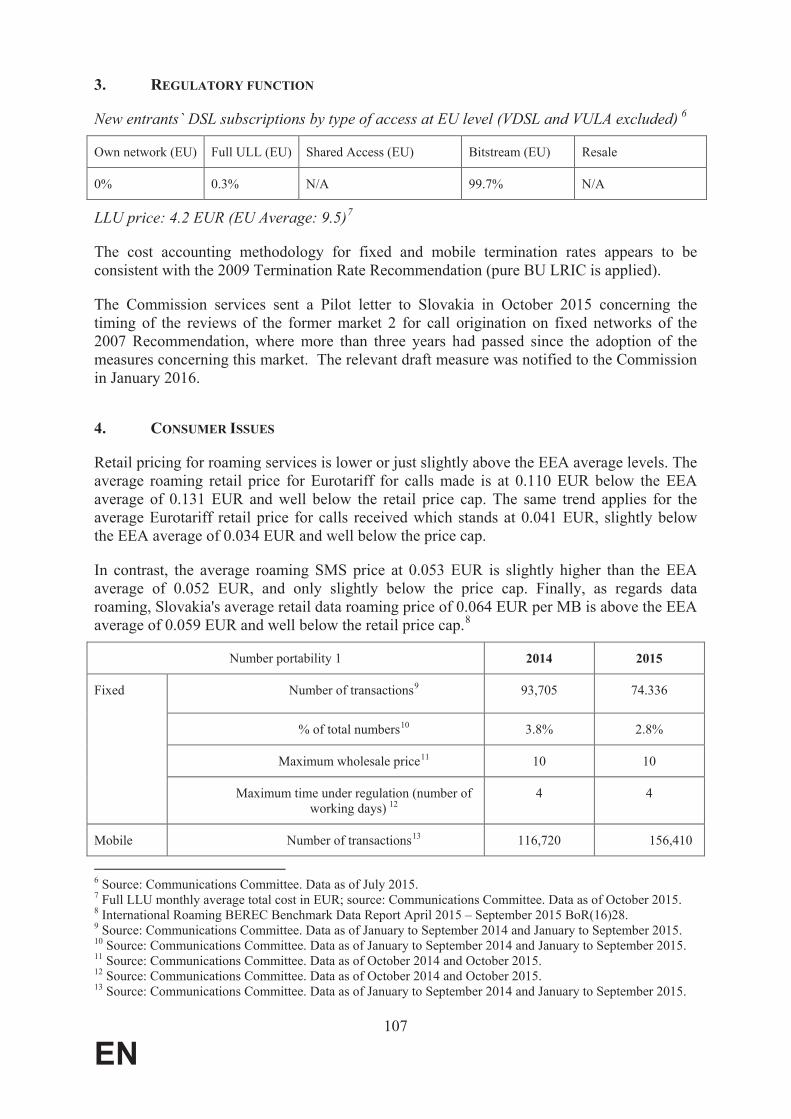
107
EN
3. REGULATORY FUNCTION
New entrants` DSL subscriptions by type of access at EU level (VDSL and VULA excluded)6
Own network (EU) Full ULL (EU) Shared Access (EU) Bitstream (EU) Resale
0% 0.3% N/A 99.7% N/A
LLU price: 4.2 EUR (EU Average: 9.5)7
The cost accounting methodology for fixed and mobile termination rates appears to be consistent with the 2009 Termination Rate Recommendation (pure BU LRIC is applied).
The Commission services sent a Pilot letter to Slovakia in October 2015 concerning the timing of the reviews of the former market 2 for call origination on fixed networks of the 2007 Recommendation, where more than three years had passed since the adoption of the measures concerning this market. The relevant draft measure was notified to the Commission in January 2016.
4. CONSUMER ISSUES
Retail pricing for roaming services is lower or just slightly above the EEA average levels. The average roaming retail price for Eurotariff for calls made is at 0.110 EUR below the EEA average of 0.131 EUR and well below the retail price cap. The same trend applies for the average Eurotariff retail price for calls received which stands at 0.041 EUR, slightly below the EEA average of 0.034 EUR and well below the price cap.
In contrast, the average roaming SMS price at 0.053 EUR is slightly higher than the EEA average of 0.052 EUR, and only slightly below the price cap. Finally, as regards data roaming, Slovakia's average retail data roaming price of 0.064 EUR per MB is above the EEA average of 0.059 EUR and well below the retail price cap.8
Number portability 1 2014 2015
Fixed Number of transactions9 93,705 74.336
% of total numbers10 3.8% 2.8%
Maximum wholesale price11 10 10
Maximum time under regulation (number of working days) 12
4 4
Mobile Number of transactions13 116,720 156,410
6 Source: Communications Committee. Data as of July 2015.7 Full LLU monthly average total cost in EUR; source: Communications Committee. Data as of October 2015.8 International Roaming BEREC Benchmark Data Report April 2015 – September 2015 BoR(16)28.9 Source: Communications Committee. Data as of January to September 2014 and January to September 2015.10 Source: Communications Committee. Data as of January to September 2014 and January to September 2015.11 Source: Communications Committee. Data as of October 2014 and October 2015.12 Source: Communications Committee. Data as of October 2014 and October 2015.13 Source: Communications Committee. Data as of January to September 2014 and January to September 2015.

108
EN
% of total numbers14 1.9% 2.7%
Maximum wholesale price15 2 2
Maximum time under regulation (number of working days) 16
4 4
Eurobarometer Survey data17 show that vast majority of Slovak respondents (80%) find it easy to compare the services and prices of their current bundle with other bundled offers. The level of consumer satisfaction in this respect is thus higher than the EU average of 69%. 6 out of 10 Slovak respondents find it easy to monitor and control their consumption for mobile and fixed internet services. This is slightly lower than the EU average of 7 out of 10. On the other hand, the clarity of contracts is considered the highest in the EU with 82% of respondents being highly satisfied with contractual information provided. The EU average in this respect stands at 68%.
Since 2012, universal service obligations have been imposed only with respect to disabled end-users, namely obligation to provide access to public telephone services, and availability of comprehensive telephone directory and comprehensive telephone directory inquiry service equivalent to that of other end-users. The obligations include the facility of carrier selectionfor disabled end-users and obligation to lease or sell, on request, special terminal equipment for the price of standard equipment.
14 Source: Communications Committee. Data as of January to September 2014 and January to September 2015.15 Source: Communications Committee. Data as of October 2014 and October 2015.16 Source: Communications Committee. Data as of October 2014 and October 2015.17 Special Eurobarometer 435, October 2015.

109
EN
FINLAND
1. MEASURES FACILITATING DEPLOYMENT AND INVESTMENTS IN HIGH SPEED
NETWORKS
1.1. Spectrum
Harmonised bands MHz spectrum assigned1 % of the harmonised band assigned
800MHz 60 100%
900MHz 70 100%
1500MHz 0 0%
1800MHz 150 100%
2000MHz paired 120 100%
2600MHz 190 100%
3400-3600MHz 180 90%
3600-3800MHz 0 0%
Finland has assigned 74,8 % of the overall harmonised spectrum for BB. No auctions were organised in 2015 for the purposes of granting rights of use for the remaining parts of the relevant spectrum since according to public consultations, operators have shown no interest to use these bands.
1.2. State of transposition of the BB CRD (Directive 2014/61/EU)
Finland has not yet notified to the Commission implementing measures for Directive 2014/61/EU. Finland will notify implementing measures as soon as the National Parliament has accepted all relevant proposals.
1.3. EU and National investments in broadband
The Finnish Government reviewed its communications policy guidelines in December 2008. Two aims were set for the deployment of broadband connections: to make basic broadband available at a download speed of 1 Mbps by 2010 and to promote coverage with fast broadband of 100 Mbps or more. The minimum speed of Universal Service was increased to 2 Mbps from November 1, 2015.
As regards the latter, the target of the Finnish broadband strategy was that by the end of 2015, practically all (more than 99 % of population) permanent residences and permanent offices of business or public administration bodies will be within 2 km of a fibre or cable network supporting 100 Mbps connections. In areas where such networks will not be built by market
1 Including guard bands
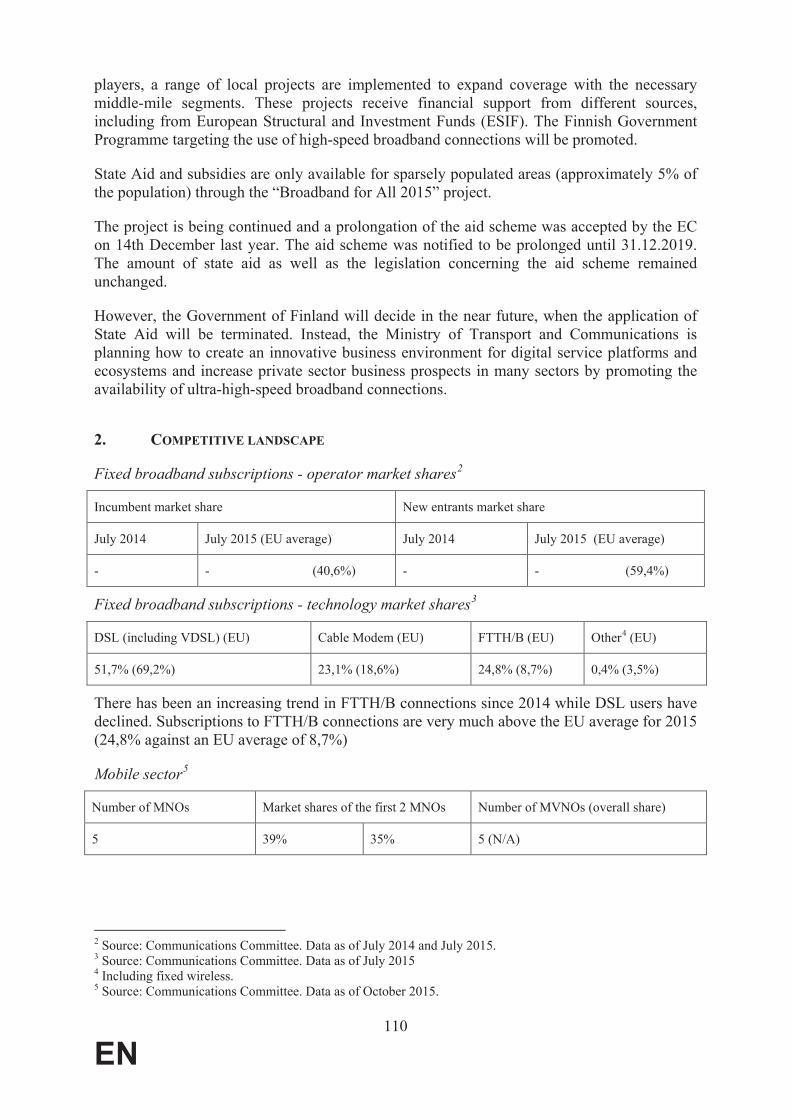
110
EN
players, a range of local projects are implemented to expand coverage with the necessary middle-mile segments. These projects receive financial support from different sources, including from European Structural and Investment Funds (ESIF). The Finnish Government Programme targeting the use of high-speed broadband connections will be promoted.
State Aid and subsidies are only available for sparsely populated areas (approximately 5% of the population) through the “Broadband for All 2015” project.
The project is being continued and a prolongation of the aid scheme was accepted by the EC on 14th December last year. The aid scheme was notified to be prolonged until 31.12.2019. The amount of state aid as well as the legislation concerning the aid scheme remained unchanged.
However, the Government of Finland will decide in the near future, when the application of State Aid will be terminated. Instead, the Ministry of Transport and Communications is planning how to create an innovative business environment for digital service platforms and ecosystems and increase private sector business prospects in many sectors by promoting the availability of ultra-high-speed broadband connections.
2. COMPETITIVE LANDSCAPE
Fixed broadband subscriptions - operator market shares2
Incumbent market share New entrants market share
July 2014 July 2015 (EU average) July 2014 July 2015 (EU average)
- - (40,6%) - - (59,4%)
Fixed broadband subscriptions - technology market shares3
DSL (including VDSL) (EU) Cable Modem (EU) FTTH/B (EU) Other4 (EU)
51,7% (69,2%) 23,1% (18,6%) 24,8% (8,7%) 0,4% (3,5%)
There has been an increasing trend in FTTH/B connections since 2014 while DSL users have declined. Subscriptions to FTTH/B connections are very much above the EU average for 2015 (24,8% against an EU average of 8,7%)
Mobile sector5
Number of MNOs Market shares of the first 2 MNOs Number of MVNOs (overall share)
5 39% 35% 5 (N/A)
2 Source: Communications Committee. Data as of July 2014 and July 2015.3 Source: Communications Committee. Data as of July 20154 Including fixed wireless.5 Source: Communications Committee. Data as of October 2015.
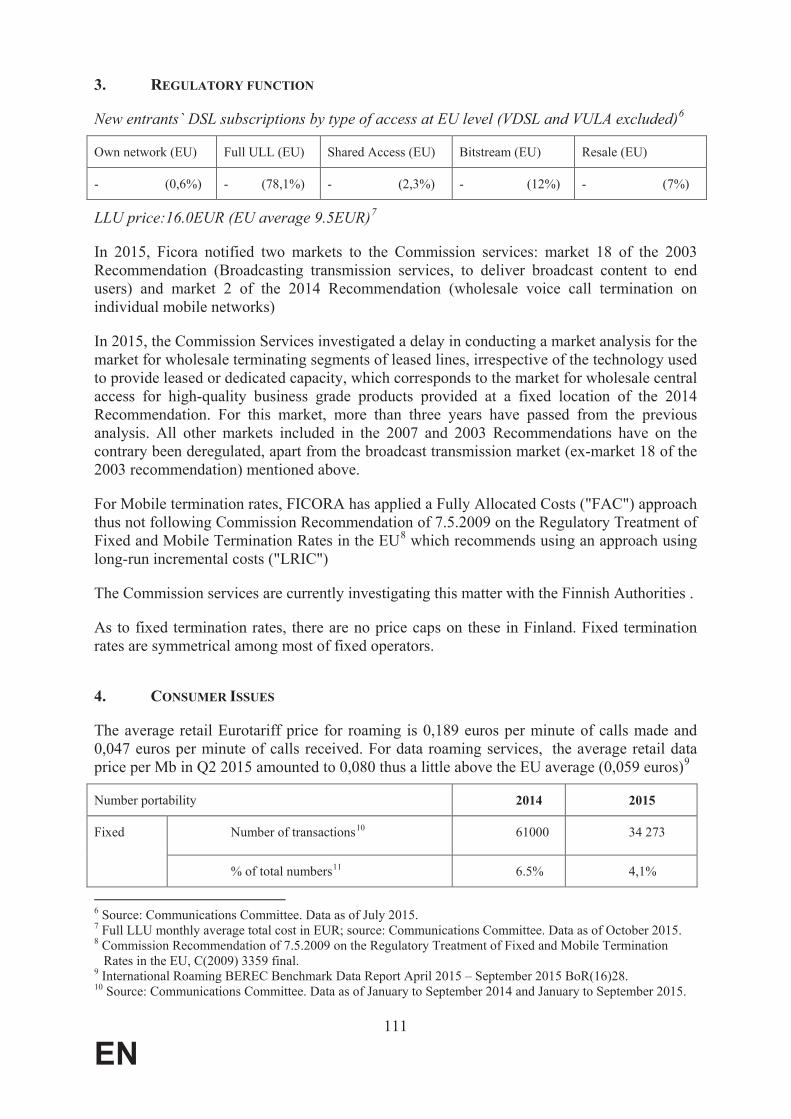
111
EN
3. REGULATORY FUNCTION
New entrants` DSL subscriptions by type of access at EU level (VDSL and VULA excluded)6
Own network (EU) Full ULL (EU) Shared Access (EU) Bitstream (EU) Resale (EU)
- (0,6%) - (78,1%) - (2,3%) - (12%) - (7%)
LLU price:16.0EUR (EU average 9.5EUR)7
In 2015, Ficora notified two markets to the Commission services: market 18 of the 2003 Recommendation (Broadcasting transmission services, to deliver broadcast content to end users) and market 2 of the 2014 Recommendation (wholesale voice call termination on individual mobile networks)
In 2015, the Commission Services investigated a delay in conducting a market analysis for the market for wholesale terminating segments of leased lines, irrespective of the technology used to provide leased or dedicated capacity, which corresponds to the market for wholesale central access for high-quality business grade products provided at a fixed location of the 2014 Recommendation. For this market, more than three years have passed from the previous analysis. All other markets included in the 2007 and 2003 Recommendations have on the contrary been deregulated, apart from the broadcast transmission market (ex-market 18 of the 2003 recommendation) mentioned above.
For Mobile termination rates, FICORA has applied a Fully Allocated Costs ("FAC") approach thus not following Commission Recommendation of 7.5.2009 on the Regulatory Treatment of Fixed and Mobile Termination Rates in the EU8 which recommends using an approach using long-run incremental costs ("LRIC")
The Commission services are currently investigating this matter with the Finnish Authorities .
As to fixed termination rates, there are no price caps on these in Finland. Fixed termination rates are symmetrical among most of fixed operators.
4. CONSUMER ISSUES
The average retail Eurotariff price for roaming is 0,189 euros per minute of calls made and 0,047 euros per minute of calls received. For data roaming services, the average retail data price per Mb in Q2 2015 amounted to 0,080 thus a little above the EU average (0,059 euros)9
Number portability 2014 2015
Fixed Number of transactions10 61000 34 273
% of total numbers11 6.5% 4,1%
6 Source: Communications Committee. Data as of July 2015.7 Full LLU monthly average total cost in EUR; source: Communications Committee. Data as of October 2015. 8 Commission Recommendation of 7.5.2009 on the Regulatory Treatment of Fixed and Mobile Termination
Rates in the EU, C(2009) 3359 final.9 International Roaming BEREC Benchmark Data Report April 2015 – September 2015 BoR(16)28.10 Source: Communications Committee. Data as of January to September 2014 and January to September 2015.

112
EN
Maximum wholesale price12 40 40
Maximum time under regulation (number of working days)13
5 5
Mobile Number of transactions14 657000 740 881
% of total numbers15 6.5% 7,3%
Maximum wholesale price16 9 9
Maximum time under regulation (number of working days)17
5 5
According to the EU-Barometer survey of October 2015, it is fairly easy for Finnish households to compare their current bundled offers with other bundled offers (to 62% of
the respondents) Likewise, when it comes to clarity of contract information, a large
number of respondents to the EU-Barometer survey (69%) noted that they were highly
satisfied in this respect
Finally, the EU-Barometer survey showed that monitoring consumption of mobile and
Internet services was easy according to 70% of the respondents.
As of 1 November 2015 the scope of the Universal Service includes a minimum rate (2 Mbps) of a functional Internet access. More precisely, this means an average minimum speed of 1,5 Mbps (within 24 hours measurement period) and 1 Mbps (within any 4 hour measurement period).
11 Source: Communications Committee. Data as of January to September 2014 and January to September 2015.12 Source: Communications Committee. Data as of October 2014 and October 2015.13 Source: Communications Committee. Data as of October 2014 and October 2015.14 Source: Communications Committee. Data as of January to September 2014 and January to September 2015.15 Source: Communications Committee. Data as of January to September 2014 and January to September 2015.16 Source: Communications Committee. Data as of October 2014 and October 2015.17 Source: Communications Committee. Data as of October 2014 and October 2015.

113
EN
Sweden
1. MEASURES FACILITATING DEPLOYMENT AND INVESTMENTS IN HIGH SPEED
NETWORKS
1.1. Spectrum
Harmonised bands MHz spectrum assigned1 % of the harmonised band assigned
800MHz 60 100%
900MHz 70 100%
1500MHz 0 0%
1800MHz 143.4 100 %
2000MHz paired 120 100%
2600MHz 190 100%
3400-3600MHz 168 84%
3600-3800MHz 200 100%
Overall Swedish NRA has assigned 93% of harmonised spectrum for broadband and is among the best performing Member States in this regard.
Following the Swedish Government decision in 2014 to allow the assignment of 700 frequencies to mobile broadband services, PTS concluded in April 2015 a pre-study and a public consultation on the potential use of the 700 MHz preparing for a spectrum award in late 2016. In 2015 PTS launched an investigation of the needs and demands of the use of the 3.4-3.8 GHz frequency band
1.2. State of transposition of the BB CRD (Directive 2014/61/EU)
Finalisation of the adoption process of the national legislation transposing the Directive is on-going. New rules are expected to enter into force on the 1st July and the NRA is planning to launch a web portal on that date that will form the central information point together with the already established web site “Ledningskollen.se”.
1.3. EU and National investments in broadband
Fixed basic broadband coverage of rural areas is 93.6%, above the EU average of 90.6%. Sweden’s National Broadband Strategy adopted in 2009 sets a long term objective of 90 % coverage with 100 Mbps until 2020 and is part of an overall strategy, the Digital Agenda for Sweden (DAS), a tool for coordinating the Government’s efforts and actions in the area of ICT, addressing supply and demand. The mid-term broadband goal has been already achieved
1 Including guard bands
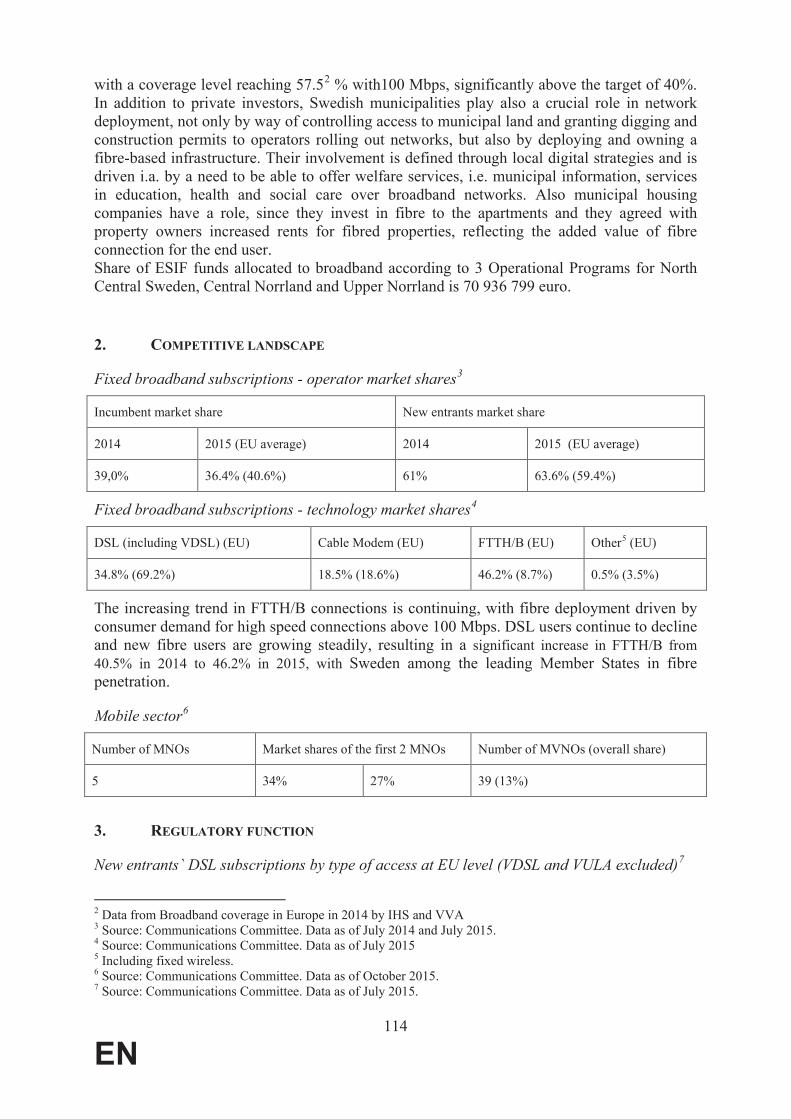
114
EN
with a coverage level reaching 57.52 % with100 Mbps, significantly above the target of 40%. In addition to private investors, Swedish municipalities play also a crucial role in network deployment, not only by way of controlling access to municipal land and granting digging and construction permits to operators rolling out networks, but also by deploying and owning a fibre-based infrastructure. Their involvement is defined through local digital strategies and is driven i.a. by a need to be able to offer welfare services, i.e. municipal information, services in education, health and social care over broadband networks. Also municipal housing companies have a role, since they invest in fibre to the apartments and they agreed with property owners increased rents for fibred properties, reflecting the added value of fibre connection for the end user.Share of ESIF funds allocated to broadband according to 3 Operational Programs for North Central Sweden, Central Norrland and Upper Norrland is 70 936 799 euro.
2. COMPETITIVE LANDSCAPE
Fixed broadband subscriptions - operator market shares3
Incumbent market share New entrants market share
2014 2015 (EU average) 2014 2015 (EU average)
39,0% 36.4% (40.6%) 61% 63.6% (59.4%)
Fixed broadband subscriptions - technology market shares4
DSL (including VDSL) (EU) Cable Modem (EU) FTTH/B (EU) Other5 (EU)
34.8% (69.2%) 18.5% (18.6%) 46.2% (8.7%) 0.5% (3.5%)
The increasing trend in FTTH/B connections is continuing, with fibre deployment driven by consumer demand for high speed connections above 100 Mbps. DSL users continue to decline and new fibre users are growing steadily, resulting in a significant increase in FTTH/B from 40.5% in 2014 to 46.2% in 2015, with Sweden among the leading Member States in fibre penetration.
Mobile sector6
Number of MNOs Market shares of the first 2 MNOs Number of MVNOs (overall share)
5 34% 27% 39 (13%)
3. REGULATORY FUNCTION
New entrants` DSL subscriptions by type of access at EU level (VDSL and VULA excluded)7
2 Data from Broadband coverage in Europe in 2014 by IHS and VVA3 Source: Communications Committee. Data as of July 2014 and July 2015.4 Source: Communications Committee. Data as of July 20155 Including fixed wireless.6 Source: Communications Committee. Data as of October 2015.7 Source: Communications Committee. Data as of July 2015.

115
EN
Own network (EU) Full ULL (EU) Shared Access (EU) Bitstream (EU) Resale (EU)
51.4% (78.1%) 26.1% (2.3%) 4.1% (12%) 18.5% (7%)
LLU prices: 12.8 EUR (EU Average; 9,5EUR)8
As regards the 2014 Relevant Market Recommendation, the Wholesale central access market (M3b) has been considered competitive and deregulated, while all the other markets have been regulated. Three markets from the 2003/2007 Recommendation are still regulated: the Access to PSTN market (ex M1), the market for call origination on fixed networks (ex M2) and the broadcasting market (ex M18).
For both fixed and mobile termination rates, PTS has adopted and applied a pure BULRIC MTRs of 0.8800 eur cents and FTRs of 0.12/0.07, in accordance with the 2009 Termination Rates Recommendation.
4. CONSUMER ISSUES
Swedish consumers benefit from an average retail Eurotariff price for roaming of 0.165EURper minute of calls made and 0.046EUR per minute of calls received (with alternative tariffs more expensive for both calls made with 0.295 and for calls received with 0.062). The average price for Euro-SMS roaming is of 0.049 eur. Average retail price per data is of 0.045 eur for each Mb, below the EU average (EU 0.059EUR per MB).9
Number portability 2014 2015
Fixed Number of transactions10136 566 132 891
% of total numbers11 3.5% 3.6%
Maximum wholesale price12 - 4
Maximum time under regulation (number of working days)13 3 3
Mobile Number of transactions14 407 284 547 698
% of total numbers15 3.4% 4.5%
Maximum wholesale price16 - 2
Maximum time under regulation (number of working days)17 3 3
8 Full LLU monthly average total cost in EUR; source: Communications Committee. Data as of October 2015.9 International Roaming BEREC Benchmark Data Report April 2014 –September 2015 BoR (16) 2810 Source: Communications Committee. Data as of January to September 2014 and January to September 2015.11 Source: Communications Committee. Data as of January to September 2014 and January to September 2015.12 Source: Communications Committee. Data as of October 2014 and October 2015.13 Source: Communications Committee. Data as of October 2014 and October 2015.14 Source: Communications Committee. Data as of January to September 2014 and January to September 2015.15 Source: Communications Committee. Data as of January to September 2014 and January to September 2015.16 Source: Communications Committee. Data as of October 2014 and October 2015.

116
EN
The Eurobarometer 2015 Survey shows that only 59% Swedish consumers consider they can easily compare bundles; this is below the EU average of 69% (12.position in the EU).
Furthermore, 77% of Swedish mobile phone users consider it is easy to monitor and control their mobile consumption, while a lower percentage of fixed phone users 73% easily monitor their consumption, which is very close to the EU average of respectively 78% for mobile and 71% for fixed. The uncertainty is however slightly higher as regards internet services, with only 62% and 53% Swedish consumers that finds it easy to monitor and control mobile and fixed internet consumption, that is below the EU average of respectively 69% for European mobile internet users and 67% for European fix internet users that find it easy to monitor and control internet consumption.
Swedish consumers are in principle equally critical as the EU average as regards the clarity of contracts since only 82% of consumers considered the contract they signed provided sufficient and clear information compared to an EU average of 84%, while 14% of swedes were not satisfied with the information provided compared to 13% of the EU average.
The NRA has not imposed any universal service obligation to provide electronic communication services.
17 Source: Communications Committee. Data as of October 2014 and October 2015.

117
EN
United Kingdom
1. MEASURES FACILITATING DEPLOYMENT AND INVESTMENTS IN HIGH SPEED
NETWORKS
1.1. Spectrum
Harmonised bands MHz spectrum assigned1 % of the harmonised band assigned
800MHz 60 100%
900MHz 70 100%
1500MHz 40 100%
1800MHz 150 100%
2000MHz paired 120 100%
2600MHz 190 100%
3400-3600MHz 40 20%
3600-3800MHz 84 42%
The United Kingdom has assigned 73.2% of the overall harmonised spectrum for BB.
On 26 October 2015, Ofcom published a decision to conduct an auction of 190 MHz (40 MHz located in the 2.3 GHz band and another 150 MHz above 3.4 GHz) following the release of those bands by the Ministry of Defence. It was intended to start the auction process during December 2015. However, inter alia due to national merger proceedings (of BT Group plc and EE Limited, which was approved since) as well as merger proceedings pending with the European Commission (Telefónica UK Limited and Hutchison 3G UK Limited) Ofcom decided for reasons of good public administration to delay commencing the auction process until the European Commission has taken its decision as to whether said proposed merger is compatible with the common market.
1.2. State of transposition of the BB CRD (Directive 2014/61/EU)
So far, the United Kingdom has notified to the Commission the "Building (Scotland)
Amendment Regulations 2016" which addresses the introduction into statutory legislation of Article 8 of the Directive which is being transposed separately by the UK government and devolved administrations into each of the four national sets of building regulations. As regards all other provisions of the Directive the UK has carried out a public consultation on a change of the relevant UK regulations which closed at the end of January 2016. Once the responses have been analysed, final regulations will be drafted that are intended to be put before Parliament by the end of June 2016.
1
Including guard bands.

118
EN
1.3. EU and National investments in broadband
Fixed basic broadband coverage of rural areas is above the EU average (99.7% vs 90.6%).
The UK has developed and is implementing a national broadband strategy (‘Superfast Britain’) to extend broadband to the hardest-to-reach areas in the ‘final third’ of England, Wales, Scotland and Northern Ireland. The programme’s target is to extend ‘superfast broadband’ (UK Government’s definition: >24 Mbit/s)2 to 95% of the UK by 2017 and to ensure universal availability of standard broadband (> 2Mbit/s). The Government’s ‘Superfast Broadband Programme’ involves approximately £ 1.7 billion in public funding from local authorities, devolved administrations, the UK Government (allocated by ‘Broadband Delivery UK’ (BDUK), a specialist body of the Department for Culture, Media and Sport) and European funding programmes. BDUK also provides the National Competence Centre for the State aid umbrella scheme of the UK for rural broadband development. The UK’s first State aid scheme was approved in November 2012 and ran until June 2015. In January 2015 the UK pre-notified the extension of the scheme until 2021. The extension foresees a further budget increase of up to £500million.
Four ERDF funded Operational Programmes for England, Scotland, West Wales and the Valleys, East Wales have included the funding of broadband investments, for a total of l EUR176 million.
2. COMPETITIVE LANDSCAPE
Fixed broadband subscriptions - operator market shares3
Incumbent market share New entrants market share
July 2014 July 2015 (EU average) July 2014 July 2015 (EU average)
31,4% 32.4% (40.6%) 68.6% 67.6% (59.4%)
Fixed broadband subscriptions - technology market shares4
DSL (including VDSL) (EU) Cable Modem (EU) FTTH/B (EU) Other5 (EU)
80.7% (69,2%) 19.0% (18,6%) 0.3% (8.7%) 0.1% (3.5%)
The main market trends of past years have been confirmed (one of the lowest incumbent market share in the EU, predominance of copper based x-DSL technology, no relevant increase of FTTH/B connections from 0.1% in July 2014 to 0.3% in July 2015, significantly below the EU average).
Mobile sector6
2
The relevant target of the DAE is 30 Mbit/s by 2020.3
Source: Communications Committee. Data as of July 2014 and July 2015.4
Source: Communications Committee. Data as of July 20155
Including fixed wireless.6
Source: Communications Committee. Data as of October 2015.
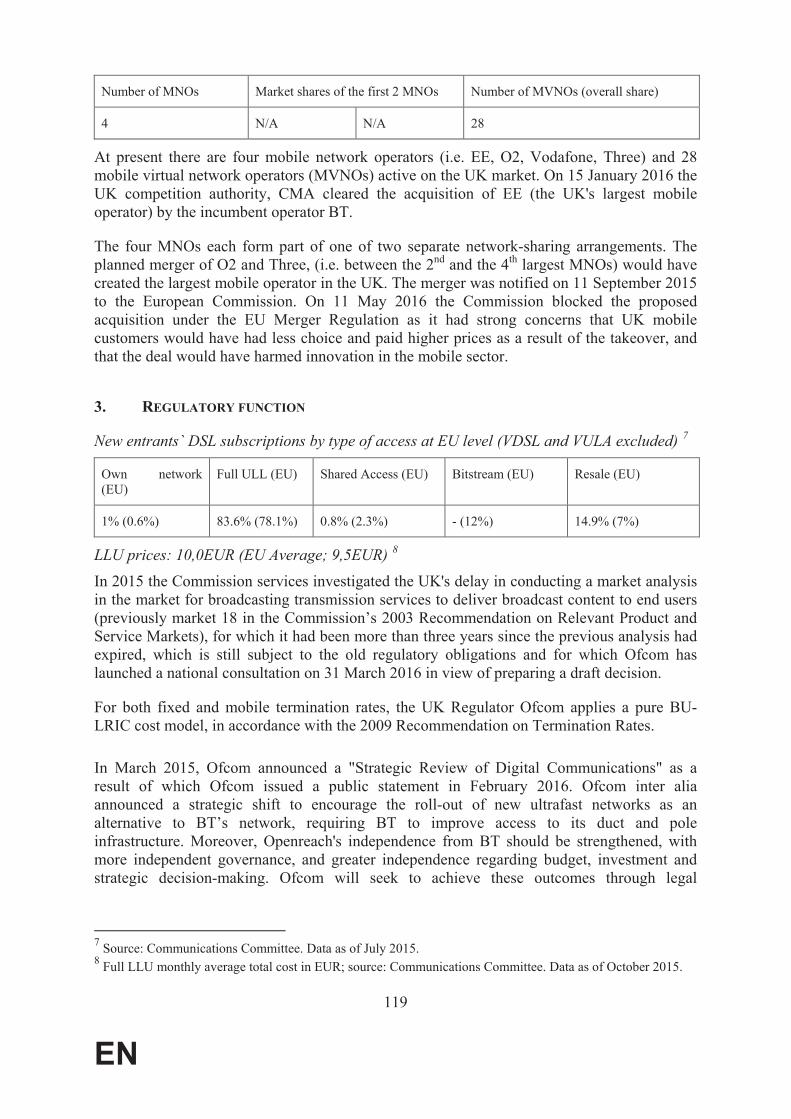
119
EN
Number of MNOs Market shares of the first 2 MNOs Number of MVNOs (overall share)
4 N/A N/A 28
At present there are four mobile network operators (i.e. EE, O2, Vodafone, Three) and 28 mobile virtual network operators (MVNOs) active on the UK market. On 15 January 2016 the UK competition authority, CMA cleared the acquisition of EE (the UK's largest mobile operator) by the incumbent operator BT.
The four MNOs each form part of one of two separate network-sharing arrangements. The planned merger of O2 and Three, (i.e. between the 2nd and the 4th largest MNOs) would have created the largest mobile operator in the UK. The merger was notified on 11 September 2015 to the European Commission. On 11 May 2016 the Commission blocked the proposed acquisition under the EU Merger Regulation as it had strong concerns that UK mobile customers would have had less choice and paid higher prices as a result of the takeover, and that the deal would have harmed innovation in the mobile sector.
3. REGULATORY FUNCTION
New entrants` DSL subscriptions by type of access at EU level (VDSL and VULA excluded)7
Own network (EU)
Full ULL (EU) Shared Access (EU) Bitstream (EU) Resale (EU)
1% (0.6%) 83.6% (78.1%) 0.8% (2.3%) - (12%) 14.9% (7%)
LLU prices: 10,0EUR (EU Average; 9,5EUR)8
In 2015 the Commission services investigated the UK's delay in conducting a market analysis in the market for broadcasting transmission services to deliver broadcast content to end users (previously market 18 in the Commission’s 2003 Recommendation on Relevant Product and Service Markets), for which it had been more than three years since the previous analysis had expired, which is still subject to the old regulatory obligations and for which Ofcom has launched a national consultation on 31 March 2016 in view of preparing a draft decision.
For both fixed and mobile termination rates, the UK Regulator Ofcom applies a pure BU-LRIC cost model, in accordance with the 2009 Recommendation on Termination Rates.
In March 2015, Ofcom announced a "Strategic Review of Digital Communications" as a result of which Ofcom issued a public statement in February 2016. Ofcom inter alia announced a strategic shift to encourage the roll-out of new ultrafast networks as an alternative to BT’s network, requiring BT to improve access to its duct and pole infrastructure. Moreover, Openreach's independence from BT should be strengthened, with more independent governance, and greater independence regarding budget, investment and strategic decision-making. Ofcom will seek to achieve these outcomes through legal
7
Source: Communications Committee. Data as of July 2015.8
Full LLU monthly average total cost in EUR; source: Communications Committee. Data as of October 2015.

120
EN
separation, but reserves the right to return to full ‘structural’ separation if this does not achieve sufficient independence.
4. CONSUMER ISSUES
The average retail Eurotariff price for roaming is 0,097EUR per minute of calls made and 0,034EUR per minute of calls received (with alternative tariffs more expensive both for calls made and calls received), 0,054 per SMS (close to the EEA average) and 0,036EUR per MB (significantly lower than the EEA average of 0,059EUR per MB)9.
Number portability 2014 2015
Fixed Number of transactions10 - -
% of total numbers11 - -
Maximum wholesale price12 31EUR 31EUR
Maximum time under regulation (number of working days) 13
1 1
Mobile Number of transactions14 5.707.624 5.597.482
% of total numbers15 - -
Maximum wholesale price16 - -
Maximum time under regulation (number of working days) 17
1 1
With more complex products becoming increasingly relevant in the market (double and triple play as well as varying inclusive call and data allowances) the notion of tariff transparency and clarity of contracts is becoming increasingly important for consumers. The 2015 Eurobarometer survey shows that consumers in the UK can relatively easily compare bundle offers (71%, slightly above the EU average of 69%). Respondents in the UK (and Ireland, both 80%) are the most likely to say it is easy to monitor and control their fixed telephone consumption (EU average 71%). The UK also ranks first as regards the ease of monitoring and controlling mobile Internet consumption (78%, EU average 69%). Also with regard to contract information respondents in the UK are among the most satisfied in the EU (rank 7 with only 13% unsatisfied compared to the EU average of 16%).
The scope of universal service includes internet connection, telephony services, schemes for consumers with special social needs, call box services, relay service for textphone users,
9
International Roaming BEREC Benchmark Data Report April 2015 – September 2015 BoR(16)28.10
Source: Communications Committee. Data as of January to September 2014 and January to September 2015.11
Source: Communications Committee. Data as of January to September 2014 and January to September 2015.12
Source: Communications Committee. Data as of October 2014 and October 2015.13
Source: Communications Committee. Data as of October 2014 and October 2015.14
Source: Communications Committee. Data as of January to September 2014 and January to September 2015.15
Source: Communications Committee. Data as of January to September 2014 and January to September 2015.16
Source: Communications Committee. Data as of October 2014 and October 2015.17
Source: Communications Committee. Data as of October 2014 and October 2015.
121
EN
tariffs for US, itemised billing, directory enquiry services and directories and quality of service. Broadband is currently not part of the universal service obligation, however, in November 2015 the Prime Minister announced the Government’s intention to implement a new broadband USO, and that the Government’s ambition is for it to be set at 10Mbps.