commission on genetic resources for … information about sheep and goats 2.3 general information...
TRANSCRIPT

CGRFA/WG-AnGR-3/04/Inf. 3
March 2004 ENGLISH ONLY E
COMMISSION ON GENETIC RESOURCES FOR FOOD AND AGRICULTURE
WORKING GROUP ON ANIMAL GENETIC RESOURCES FOR FOOD AND AGRICULTURE
Third Session
Rome, 31 March – 2 April 2004
MEASUREMENT OF DOMESTIC ANIMAL DIVERSITY - A REVIEW OF RECENT DIVERSITY STUDIES
The major goal of this document is to evaluate the current status of molecular genetics research in species of domestic animals. In 2000, FAO made public a list of recommended microsatellite markers for cattle, chickens, sheep and swine. These lists were carefully assembled and are intended to serve as the foundation for future studies in genetic distancing among breeds. By including a standard list of microsatellite loci in the roster of markers chosen for a given study, the possibility of combining results later in meta-analyses is created.
The information contained in this manuscript is complementary to other documents produced for the ITWG. Genetic distancing between some of the world breeds that have been catalogued at DAD-IS (http://www.fao.org/dad-is) was established. The information in this manuscript will also become instrumental in the future, once a system designed to aid the decision-making process for the management of animal genetic resources is finalized and becomes operational.
In the review of the application of various marker sets in recent studies, voluntary compliance to the lists of FAO-recommended markers was found to vary across species. A revised set of list of microsatellite markers is being prepared by the International Society for Animal Genetics (ISAG) / FAO Advisory Group for Animal Genetic Distance Work. These revised lists, covering also more livestock species, are planned to be released by 29th ISAG Conference in September of 2004. Some of the previous lists will undergo minimal changes, while others will be completely rehashed. The plan is to also develop and make widely available standardised primers to all interested parties. Appropriation of funds to support the elaboration of the primers has still not been secured.

CGRFA/WG-AnGR-3/04/Inf.3 ii
Table of Contents
Page
I. INTRODUCTION 1 II. GENERAL INFORMATION 1
2.1. General information about cattle, buffaloes and yaks 2.2. General information about sheep and goats 2.3 General information about pigs 2.4 General information about horses and asinines 2.5. General information about camelids 2.6. General information about rabbits 2.7. General information about chickens
III. FIELD SAMPLING 6 3.1. Cattle, buffaloes and yaks 3.2. Sheep and goats 3.3. Pigs 3.4. Horses and asinines 3.5. Camelids 3.6. Rabbits 3.7. Chickens
IV. MOLECULAR GENETIC INFORMATION 12 4.1. Molecular genetic information from cattle, buffaloes and yaks 4.2. Molecular genetic information from sheep and goats 4.3. Molecular genetic information from pigs 4.4. Molecular genetic information from horses and asinines 4.5. Molecular genetic information from camelids 4.6. Molecular genetic information from rabbits 4.7. Molecular genetic information from chickens 4.8. General considerations 4.9. Use of microsatellite markers recommended by FAO 4.10. Reasons for not using the FAO-recommended microsatellites and criteria for choosing other microsatellites 4.11. Promising genetic markers
V. MICROSATELLITE LOCI IN DETAIL 19 5.1. Microsatellites used in genetic distancing studies with cattle, sheep, pigs and chickens 5.2. Microsatellites used in genetic distancing studies with yaks, buffaloes, goats, horses, asinines, camelids and rabbits 5.3. General considerations
VI. ADDITIONAL BREED CHARACTERISTICS 29 VII. MATHEMATICAL AND STATISTICAL TOPICS 30 VIII. AVAILABILITY OF RESULTS 32 IX. PROJECT COSTS 32 X. SUMMARY AND CONCLUSIONS 33 XI. CONTRIBUTORS 34 XII. INFORMATION ABOUT GENETIC DIVERSITY STUDIES ON THE WORLD
WIDE WEB 34 XIII. REFERENCES 35

CGRFA/WG-AnGR-3/04/Inf.3 1
MEASUREMENT OF DOMESTIC ANIMAL DIVERSITY - A REVIEW OF RECENT DIVERSITY STUDIES
I. INTRODUCTION
Molecular genetics techniques provide direct information on genotypes of polymorphic loci. Highly polymorphic DNA microsatellite markers are widely used to measure breed1 relationships in the most important species of domestic animals.
FAO’s Measurement of Domestic Animal Diversity (MoDAD) provides recommendations about sampling of individuals for genetic diversity studies. In collaboration with FAO, an advisory group of the International Society for Animal Genetics (ISAG) has established, for each species of interest, a set of microsatellite markers to be used as the standard set for the calculation of genetic distances. Adherence to such recommendations allows for reasonable comparison of parallel or overlapping studies and helps combine results in meta-analyses.
The main goal of this report was to verify the adherence to FAO recommendations in genetic diversity studies of domestic animals. The results presented in this report were based on responses to a questionnaire completed by research teams who have been involved in genetic distancing studies for the past ten years. The points surveyed were: number of breeds and sample sizes, number and type of markers used, additional breed information like phenotypic traits or geographic spread, availability of detailed genotyping results and of storage of tissues or DNA samples for future research projects, the mathematical and statistical methods chosen for measuring genetic distance, the method for construction of phylogenies, the software used for presentation of results, and the project costs, including a breakdown for sampling, genotyping, statistical analysis and coordination. Reasons for non-compliance with the FAO/MoDAD recommendations were included. The results provided a basis for a review of these recommendations.
II. GENERAL INFORMATION
One hundred and thirty-two questionnaires were sent to research teams involved in genetic distance studies. Fifty-seven researchers returned at least one completed questionnaire. Samples from 93 countries were investigated in 86 projects. Table 2.1 presents the number of countries where samples were collected for genetic distancing studies.
Table 2.1 Number of countries where samples were collected for genetic distancing studies FAO Region Number of CountriesAfrica 13Asia and the Pacific 19 Europe 37 Latin America and the Caribbean 10 Near East 9 North America 2
Total 93
1 In this document the term “breed” is also used in the sense of “strain” or “ecotype”. In some species there is not a formal definition of breeds. No relationships between strains or ecotypes were investigated.

2 CGRFA/WG-AnGR-3/04/Inf.3
Table 2.2 shows that most genetic distancing studies were carried out in ruminants, and that genetic distancing in cattle was of particularly high interest. A review of the literature revealed a similar result: the recent publication of a large number of studies on genetic distancing in cattle, based on microsatellite information (Dorji et al., 2003, Edwards et al., 2000, Hanotte et al., 2002, Hansen et al., 2002, Hanslik et al. 2000, Jordana et al., 2003, Kim et al, 2002, MacHugh et al., 1997, 1998, Martin-Burriel et al., 1999, Maudet et al., 2002, Peelman et al., 1998, Simianer, 2002), followed by sheep (Arranz et al., 1998, Diez-Tascon et al., 2000, Gutierrez-Espeleta et al. 2000, Hedrick et al. 2001) and pigs (Fan et al. 2002, Lemus-Flores et al., 2001, Martinez et al. 2000a, 2000b, 2000c, Mo et al. 2003). Genetic distancing studies for a large number of breeds and highly selected lines were also published for chickens (Crooijmans et al., 1996, Rosenberg et al., 2001, Wimmers et al., 2000, Zhou and Lamont, 1999). Some studies based on microsatellite markers were published for horses (Bjornstad and Roed, 2001, 2002, Bjornstad et al., 2003, Cañon et al., 2000), donkeys (Ivankovic et al., 2002), goats (Luikart et al., 1999, Saitbekova et al., 1999, Yang et al., 1999), Asian and African water buffaloes (Barker et al., 1997, Navani et al., 2002, van Hooft et al., 1999 and Ritz et al., 2000) and dromedaries (Mburu et al., 2003).
Genetic distancing studies of ruminants were in the focus of researchers during the last ten years, with a large number of national projects mainly considering breeds in a certain country or region. There were also a few large international projects with cattle and goats. A smaller number of pig and chicken projects were executed. No feedback was received regarding breeds of llama, ducks, turkey or goose.

CGRFA/WG-AnGR-3/04/Inf.3 3
Table 2.2 Number of projects and countries in which samples were collected, according to FAO-regions for each species
Species Number projects Number countries FAO-region Buffalo 3 9 Africa
Asia and the Pacific Europe Latin America and the Caribbean
Cattle 24 40 Africa Asia and the Pacific Europe Latin America and the CaribbeanNear East
Goat 11 28 Africa Asia and the Pacific Europe Latin America and the CaribbeanNear East
Sheep 19 56 Africa Asia and the Pacific Europe Latin America and the CaribbeanNear East
Pig 6 19 Africa Asia and the Pacific Europe
Ass 1 1 Europe Horse 5 25 Africa
Asia and the Pacific Europe Latin America and the CaribbeanNorth America
Bactrian Camel 1 2 Asia and the Pacific Dromedary 2 7 Africa
Near East Alpaca 3 2 Near East
Latin America and the Caribbean Rabbit 1 19 Africa
Asia and the Pacific Europe
Chicken 8 34 Africa Asia and the Pacific Europe Latin America and the CaribbeanNear East
OTHERS: Yak 2 8 Europe Asia and the Pacific Near East

4 CGRFA/WG-AnGR-3/04/Inf.3
2.1. General information about cattle, buffaloes and yaks
A total of 24 completed questionnaires dealing with different cattle projects were received. Samples were collected in 40 different countries in North America, Latin America and Caribbean, Europe, Asia and the Pacific and Africa. Projects dealing with buffalo were described in three questionnaires. Samples originated from nine different countries in Africa, Latin America and the Caribbean, Asia and the Pacific and also Europe, but dealt mainly with Asian water buffaloes. In addition, information on two projects investigating yak were received. In the yak projects, animals from eight different countries mainly in Asia and the Pacific, but also from Europe (Russian Federation) were investigated.
The number of investigated cattle breeds per project varied between one and 96. On average roughly 15 breeds were investigated per project. Figure 2.1 shows the skewed distribution with regard to involved breeds. In most projects, less than ten different breeds where considered. These results are similar to those found in literature (Dorji et al., 2003, Edwards et al., 2000, Hanotte et al., 2002, Hansen et al., 2002, Hanslik et al. 2000, Jordana et al., 2003, Kim et al, 2002, MacHugh et al., 1998, MacHugh et al., 1997, Martin-Burriel et al., 1999, Maudet et al., 2002, Peelman et al., 1998).
Figure 2.1: Distribution of projects by number of investigated breeds of cattle
0
2
4
6
8
10
12
14
16
1-10 11-20 21-30 >30
breeds per project
num
ber o
f pro
ject
s
In the three questionnaires about buffalo projects, four, nine and 17 breeds were investigated. For the two provided yak questionnaires the situation differs. Only one project is a pure “yak project” in which 27 different yak populations (or breeds) was investigated. The goal of the other projects was to investigate the relationship between four pure yak breeds, a yak-cattle cross and different cattle breeds belonging to the Bos indicus, the Bos taurus and the Bos frontalis groups.
To attain a certain precision for different levels of resolution or discrimination among breeds, it is recommended to sample at least 25 animals per breed and investigate 25 loci with 4-10 alleles per locus (FAO, 1998). In one section of the questionnaire it was asked whether such minimum requirements were fulfilled. It was established that sample sizes should contain at least 25 animals per breed in each of the 24 projects. The actual samples size for projects in which microsatellites were used varied between 20 and 300. In half of the projects it was not possible to sample a minimum of 25 animals for at least one breed it because of small population sizes, which means there were not enough living individuals available. Financial limitation was another main reason for small actual sample sizes in cattle projects.
In the buffalo projects, the average sample sizes reported were of about 32 animals per breed; in the yak projects, the actual sample sizes were larger than 25 animals per breed.

CGRFA/WG-AnGR-3/04/Inf.3 5
2.2. General information about sheep and goats
Nineteen completed questionnaires on sheep projects were received, with information collected on 56 countries of every FAO region. An average of 16 breeds was investigated per project, the largest one comprising more than 40 breeds. Eleven projects from 28 countries dealing with goats were reported, representing all FAO regions except for North America.
The number of breeds of sheep and goat investigated per project varied from between two and 56 and between one and 42, respectively. An average of 16 sheep breeds (ranging from 2 to 56) and 11 goat breeds (ranging from one to 42) were investigated per project.
Two projects with goats encompassed very large sample sizes from a single breed (about 800 and 1100 animals). These projects were not planned as classical genetic distancing studies. Excluding these two large-scale projects, the actual sample sizes per breed of goats varied between 10 and 100 animals. In the sheep projects, the actual number of animals sampled per breed ranged from 10 to 65. In the few projects where the actual sample size was of less than 25 animals per breed, it occurred because of either financial restraints, small number of animals available, poor accessibility to the flocks, technical problems during the extraction of DNA, or, in the case where a wild breed of sheep was studied, because of the small number of known living animals.
2.3 General information about pigs
Six questionnaires were received. Samples were collected in 19 countries: three from Africa, China, and 16 European countries. Half of the projects dealt with a large number of breeds (71, 46, and 39 breeds). The average sample size was of 61 animals; in only two projects the sample size was lesser than 25 animals, due to the limited number of living animals.
2.4 General information about horses and asinines
Samples were collected in 25 countries from all FAO regions with the exception of the Near East. One large project on horses dealt with 120 breeds from 23 countries; in the other five projects no more than eight breeds were genotyped. An average of 47 animals was sampled in each breed. In a few instances breeds were represented by less than 25 animals, chiefly due to low numbers of live or available animals and because of limited funds.
2.5. General information about camelids
Three projects dealing with alpacas (Peru and South Africa), two with dromedaries (Africa and the Near East) and one with Bactrian camels (breeds from China and Mongolia) were reported. All FAO regions except for Europe and North America were represented.
Few breeds were investigated in each project, with a maximum of two breeds of alpacas, seven of dromedaries and six of Bactrian camels in any single report. Sample sizes were large in one dromedary project and mostly adequate in all other species and breeds. The few exceptions arose due to low numbers of animals with a certain coat color (alpaca), unavailability of adequate samples (dromedary), and financial restraints (Bactrian camel).
2.6. General information about rabbits
One questionnaire referring to a very large rabbit project was completed. For this project, samples from 13 rabbit breeds in 19 different countries were collected. Eighteen countries are localized in Europe and one, China, belongs to the FAO region of Asia and the Pacific.
It was planned to sample between 35 and 40 animals for each breed, which resulted in an actual average sample size over all breeds of 33. For one breed technical problems made it impossible to sample or genotype the minimum of 25 individuals.
6 CGRFA/WG-AnGR-3/04/Inf.3
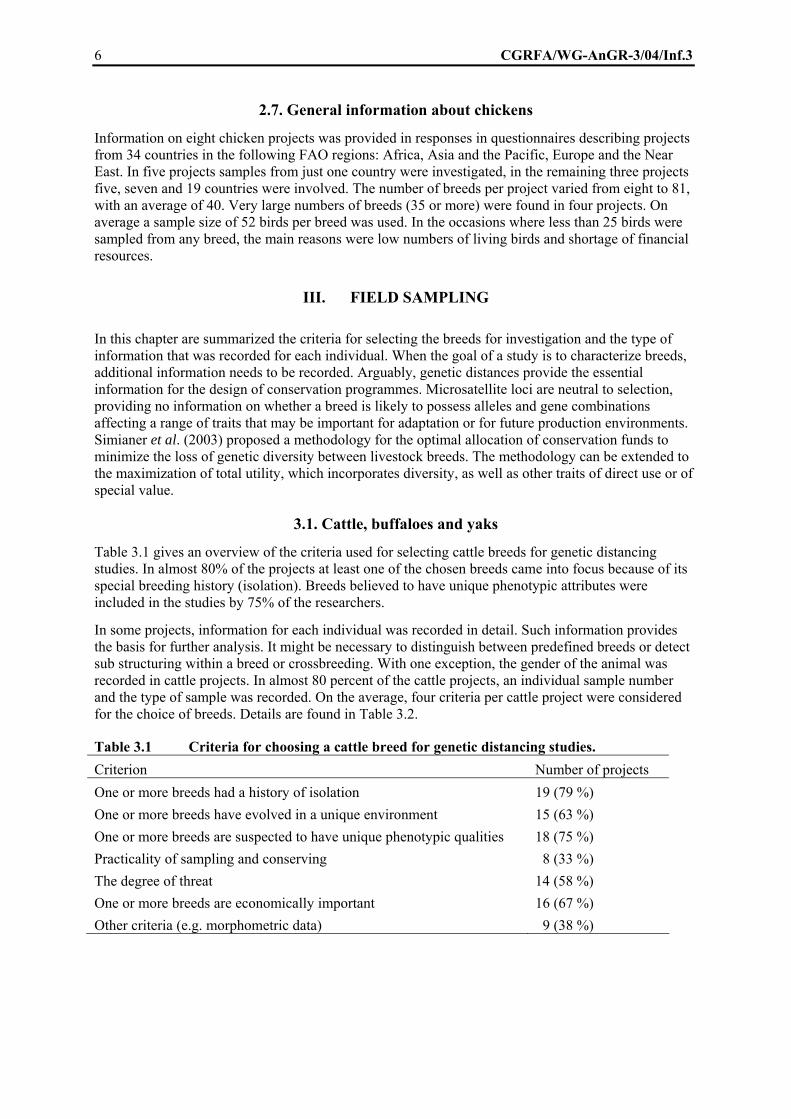
2.7. General information about chickens
Information on eight chicken projects was provided in responses in questionnaires describing projects from 34 countries in the following FAO regions: Africa, Asia and the Pacific, Europe and the Near East. In five projects samples from just one country were investigated, in the remaining three projects five, seven and 19 countries were involved. The number of breeds per project varied from eight to 81, with an average of 40. Very large numbers of breeds (35 or more) were found in four projects. On average a sample size of 52 birds per breed was used. In the occasions where less than 25 birds were sampled from any breed, the main reasons were low numbers of living birds and shortage of financial resources.
III. FIELD SAMPLING
In this chapter are summarized the criteria for selecting the breeds for investigation and the type of information that was recorded for each individual. When the goal of a study is to characterize breeds, additional information needs to be recorded. Arguably, genetic distances provide the essential information for the design of conservation programmes. Microsatellite loci are neutral to selection, providing no information on whether a breed is likely to possess alleles and gene combinations affecting a range of traits that may be important for adaptation or for future production environments. Simianer et al. (2003) proposed a methodology for the optimal allocation of conservation funds to minimize the loss of genetic diversity between livestock breeds. The methodology can be extended to the maximization of total utility, which incorporates diversity, as well as other traits of direct use or of special value.
3.1. Cattle, buffaloes and yaks
Table 3.1 gives an overview of the criteria used for selecting cattle breeds for genetic distancing studies. In almost 80% of the projects at least one of the chosen breeds came into focus because of its special breeding history (isolation). Breeds believed to have unique phenotypic attributes were included in the studies by 75% of the researchers.
In some projects, information for each individual was recorded in detail. Such information provides the basis for further analysis. It might be necessary to distinguish between predefined breeds or detect sub structuring within a breed or crossbreeding. With one exception, the gender of the animal was recorded in cattle projects. In almost 80 percent of the cattle projects, an individual sample number and the type of sample was recorded. On the average, four criteria per cattle project were considered for the choice of breeds. Details are found in Table 3.2.
Table 3.1 Criteria for choosing a cattle breed for genetic distancing studies. Criterion Number of projects One or more breeds had a history of isolation 19 (79 %) One or more breeds have evolved in a unique environment 15 (63 %) One or more breeds are suspected to have unique phenotypic qualities 18 (75 %) Practicality of sampling and conserving 8 (33 %) The degree of threat 14 (58 %) One or more breeds are economically important 16 (67 %) Other criteria (e.g. morphometric data) 9 (38 %)

CGRFA/WG-AnGR-3/04/Inf.3 7
Table 3.2 Information recorded in each animal in cattle projects. Individual information Number of projects Identity number of animal 15 (63 %) Sampling date 16 (67 %) Type of sample 19 (79 %) Gender of animal 23 (96 %) Precise location of the herd 18 (75 %) Size of the herd 13 (54 %) Name of collector 15 (63 %) Sample identification number 19 (79 %) Basic pedigree information 8 (33 %) Other information 5 (21 %)
Buffalo breeds were chosen according to the three received questionnaires as follows: In all three buffalo projects, the history of isolation was taken into account, but the degree of threat played no role in the selection of breeds. The type of sample and the gender of each animal were always recorded, in additional to some individual information.
Yak breeds were chosen based many reasons: the history of isolation, unique phenotypic traits, degree of threat, and economic importance. One project wanted to clarify the origin, history and diversity of the present yak populations, thus as many yak populations as possible were sampled. Individual information was collected in most animals.
3.2. Sheep and goats
Criteria considered important in deciding which breeds of sheep were included in the genetic distancing studies are presented in Table 3.3. “Practicality of sampling and conserving” is of just marginal importance, while “History of isolation” is again the main criterion.
Table 3.3 Criteria for choosing breeds of sheep for genetic distancing studies. Criterion Number of projectsOne or more breeds had a history of isolation 16 (89 %)One or more breeds have evolved in a unique environment 15 (83 %)One or more breeds are suspected to have unique phenotypic qualities 13 (72 %)Practicality of sampling and conserving 6 (33 %)The degree of threat 13 (72 %)One or more breeds are economically important 11 (61 %)Other criteria 7 (39 %)
Details on the type of individual information recorded for each animal are found in Table 3.4.

8 CGRFA/WG-AnGR-3/04/Inf.3
Table 3.4 Information recorded in each animal in sheep projects. Individual information Number of projects Identity number of animal 14 (78 %) Sampling date 13 (72 %) Type of sample 14 (78 %) Gender of animal 17 (94 %) Precise location of the flock 13 (72 %) Size of the flock 7 (39 %) Name of collector 12 (67 %) Sample identification number 15 (83 %) Basic pedigree information 7 (39 %) Other information 7 (39 %)
Type of sample and gender of animals were recorded in most projects. Basic pedigree information was not collected very often. Tables 3.5 and 3.6 present similar information for the genetic diversity studies with goats.
Table 3.5 Criteria for choosing a goat breeds for genetic distancing studies. Criterion Number of projects One or more breeds had a history of isolation 8 (73 %) One or more breeds have evolved in a unique environment 8 (73 %) One or more breeds are suspected to have unique phenotypic qualities 9 (82 %) Practicality of sampling and conserving 5 (45 %) The degree of threat 4 (36 %) One or more breeds are economically important 9 (82 %) Other criteria 4 (36 %)
Table 3.6 Information recorded in each animal in goat projects. Individual information Number of projects Identity number of animal 9 (82 %) Sampling date 9 (82 %) Type of sample 11 (100 %) Gender of animal 10 (91 %) Precise location of the flock 10 (91 %) Size of flock 5 (45 %) Name of collector 9 (82 %) Sample identification number 10 (91 %) Basic pedigree information 3 (27 %) Other information 3 (27 %)
CGRFA/WG-AnGR-3/04/Inf.3 9
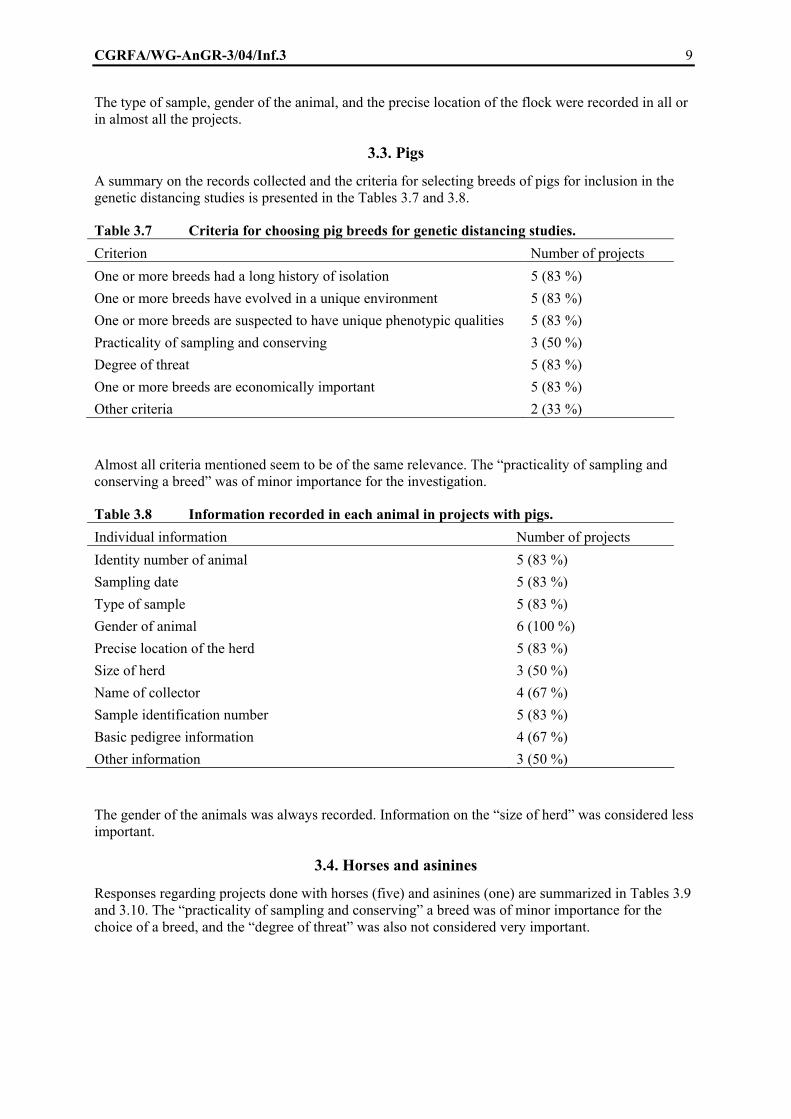
The type of sample, gender of the animal, and the precise location of the flock were recorded in all or in almost all the projects.
3.3. Pigs
A summary on the records collected and the criteria for selecting breeds of pigs for inclusion in the genetic distancing studies is presented in the Tables 3.7 and 3.8.
Table 3.7 Criteria for choosing pig breeds for genetic distancing studies. Criterion Number of projects One or more breeds had a long history of isolation 5 (83 %) One or more breeds have evolved in a unique environment 5 (83 %) One or more breeds are suspected to have unique phenotypic qualities 5 (83 %) Practicality of sampling and conserving 3 (50 %) Degree of threat 5 (83 %) One or more breeds are economically important 5 (83 %) Other criteria 2 (33 %)
Almost all criteria mentioned seem to be of the same relevance. The “practicality of sampling and conserving a breed” was of minor importance for the investigation.
Table 3.8 Information recorded in each animal in projects with pigs. Individual information Number of projects Identity number of animal 5 (83 %) Sampling date 5 (83 %) Type of sample 5 (83 %) Gender of animal 6 (100 %) Precise location of the herd 5 (83 %) Size of herd 3 (50 %) Name of collector 4 (67 %) Sample identification number 5 (83 %) Basic pedigree information 4 (67 %) Other information 3 (50 %)
The gender of the animals was always recorded. Information on the “size of herd” was considered less important.
3.4. Horses and asinines
Responses regarding projects done with horses (five) and asinines (one) are summarized in Tables 3.9 and 3.10. The “practicality of sampling and conserving” a breed was of minor importance for the choice of a breed, and the “degree of threat” was also not considered very important.

10 CGRFA/WG-AnGR-3/04/Inf.3
Table 3.9 Criteria for choosing breeds or horses or asinines for genetic distancing studies. Criterion Number of projects One or more breeds had a long history of isolation 6 (100 %) One or more breeds have evolved in a unique environment 6 (100 %) One or more breeds are suspected to have unique phenotypic qualities 5 (83 %) Practicality of sampling and conserving 2 (33 %) Degree of threat 2 (33 %) One or more breeds are economically important 3 (50 %) Other criteria 2 (33 %)
Table 3.10 Information recorded in each animal in projects with horses or asinines. Individual information Number of projects Identity number of animal 5 (83 %) Sampling date 6 (100 %) Type of sample 5 (83 %) Gender of animal 6 (100 %) Precise location of the herd 6 (100 %) Size of herd 4 (67 %) Name of collector 5 (83 %) Sample identification number 5 (83 %) Basic pedigree information 4 (67 %) Other information 2 (33 %)
3.5. Camelids
Only a few completed questionnaires were received for single camelid species, the three species in which data was obtained (alpaca, dromedary and Bactrian camel) were grouped and are presented in Tables 3.11 and 3.12. In choosing breeds of Bactrian camels, all criteria were of relevance in the received questionnaire. For projects with alpaca and dromedaries the “evolution of breeds in a unique environment” was not mentioned. Various criteria were listed under “other”, like coat color or use of a breed as an out-group.

CGRFA/WG-AnGR-3/04/Inf.3 11
Table 3.11 Criteria for choosing breeds of camelids for genetic distancing studies. Number of projects1Criterion
Alpaca Dromedary Bactrian camel
One or more breeds had a long history of isolation 1 2 1 One or more breeds have evolved in a unique environment
0 0 1
One or more breeds are suspected to have unique phenotypic qualities
1 2 1
Practicality of sampling and conserving 2 2 1 Degree of threat 1 1 1 One or more breeds are economically important 2 1 1 Other criteria 3 1 1 1 Out of three projects with alpaca, two with dromedaries and one with Bactrian camels.
Table 3.12 Information recorded in each animal in projects with camelids. Individual information Number of projects Identity number of animal 4 (67 %) Sampling date 6 (100 %) Type of sample 6 (100 %) Gender of animal 5 (83 %) Precise location of the herd 6 (100 %) Size of herd 3 (50 %) Name of collector 6 (100 %) Sample identification number 6 (100 %) Basic pedigree information 3 (50 %) Other information 1 (17 %)
A high number of individual information (average of 7.6 records per animal) was obtained in all projects with camelids.
3.6. Rabbits
One questionnaire was received about a large genetic distancing study in rabbits. The “history of isolation” and the “unique phenotypic qualities” were the main reasons for choosing the 13 breeds of rabbits. Seven individual records were collected per animal: the identity number, sampling date, type of sample, gender of the animal, the precise location of the herd, the sample identification number and basic pedigree information.
3.7. Chickens
A summary of the criteria for choosing the breeds of chickens for a genetic distancing study is presented in Table 3.13. Most projects with chickens considered that “unique phenotypic qualities” was an important criterion for inclusion of a breed in the study. In Table 3.14 the specific individual

12 CGRFA/WG-AnGR-3/04/Inf.3 information collected on each bird is summarized. About seven additional individual records were obtained per bird in each project.
Table 3.13 Criteria for choosing chicken breeds for genetic distancing studies. Criterion Number of projects One or more breeds had a long history of isolation 6 (75 %) One or more breeds have evolved in a unique environment 3 (38 %) One or more breeds are suspected to have unique phenotypic qualities 7 (88 %) The practicality of sampling and conserving 3 (38 %) The degree of threat 4 (50 %) One or more breeds are economically important 4 (50 %) Other criteria 3 (38 %)
Table 3.14 Information recorded in each bird in projects with chickens. Individual information Number of projects Identity number of bird 5 (63 %) Sampling date 7 (88 %) Type of sample 6 (75 %) Gender of bird 6 (75 %) Precise location of the flock 7 (88 %) Size of flock 4 (50 %) Name of collector 7 (88 %) Sample number 8 (100 %) Basic pedigree information 2 (25 %) Other information 5 (63 %)
IV. MOLECULAR GENETIC INFORMATION
The following topics are treated in this chapter: type of samples used, storage methods for long-term (ex-situ) conservation and/or investigation, types of genetic markers used, analysis of mitochondrial and/or Y-specific DNA, use of microsatellite markers, criteria for choosing microsatellite markers, and recommendations from the researchers for future studies. The reasons for not using FAO-recommended microsatellite marker loci in genetic distancing studies are also covered.
4.1. Molecular genetic information from cattle, buffaloes and yaks
Blood samples were taken in 23 of the 24 cattle projects. In 14 projects, in addition to the blood samples, hair, semen, tissues and milk were collected some projects. In 14 projects, it was reported that some samples were stored (ex-situ) for conservation, but just in three of those projects semen was sampled.
The samples were used to analyze genetic markers. In only three projects no microsatellite markers were analyzed, but in all others this type of marker was used. On average two different types of genetic markers were investigated in a cattle project. Table 4.1 presents an overview of the importance

CGRFA/WG-AnGR-3/04/Inf.3 13
of different types of markers. In eight projects mitochondrial and/or Y-specific DNA was investigated. In 17 cattle projects (71 %) isolated DNA was stored for further analysis.
Table 4.1 Types of genetic markers analyzed in cattle projects. Types of genetic markers Number of projects Biochemical markers 6 (25 %) Blood groups 5 (21 %) Allonyms 3 (13 %) Microsatellites 21 (88 %) AFLP 2 ( 8 %) RFLP 4 (17 %) SNP 3 (13 %) Other markers 3 (13 %)
In all three buffalo projects blood samples were taken and in only on project semen was also sampled. In one of the three buffalo projects no storage for conservation purposes was carried out. In all these projects microsatellite loci were analyzed, but biochemical markers, allozymes and mitochondrial DNA were also used in individual projects. In only one project isolated DNA was stored for future investigation.
Blood and hair samples were collected in the two projects with yaks. Tissue samples were also taken in one project. In both projects microsatellite loci were analyzed; in one of them biochemical markers, allozymes, mitochondrial and Y-specific DNA were also investigated.
4.2. Molecular genetic information from sheep and goats
The types of samples taken in sheep projects are summarized in Table 4.2. Blood was the sample most commonly taken for genetic distancing studies, in the likeness of cattle projects.
Table 4.2 Number of sheep projects in which a specific type of sample was collected. Type of sample Number of projects Blood 16 (89 %) Tissue 3 (17 %) Hair 4 (22 %) Other (e.g. mouth swabs) 1 (6 %)
Semen was not collected in any project, perhaps because artificial insemination plays a minor role in sheep compared to cattle. In 22% of the projects no samples were stored for conservation purposes or further investigations. Table 4.3 shows which types of genetic markers were investigated.

14 CGRFA/WG-AnGR-3/04/Inf.3
Table 4.3 Types of genetic markers analyzed in sheep projects. Types of genetic markers Number of projects Biochemical markers 3 (17 %) Allozymes 1 (6 %) Microsatellites 17 (89 %) AFLP 1 (6 %) RFLP 3 (17 %) SNP 1 (6 %) Other markers 4 (22 %)
Microsatellite loci were the preferred type of genetic marker used. Mitochondrial and Y-specific DNA were also investigated. In 14 projects samples and isolated DNA were stored for conservation purposes and for future investigation. Tables 4.4 and 4.5 present an overview of the 11 goat projects. In every project blood was collected for genetic analysis; samples of tissue or hair were also taken in some projects.
Table 4.4 Number of projects with goats in which a specific type of sample was collected. Type of sample Number of projects Blood 11 (100 %) Tissue 2 (19 %) Hair 4 (36 %)
Table 4.5 Types of genetic markers analyzed in sheep projects. Types of genetic markers Number of projects Biochemical markers 2 (18 %) Allozymes 2 (18 %) Microsatellites 10 (91 %) AFLP 1 (9 %) RFLP 3 (27 %) SNP 3 (27 %) Other markers 2 (18%)
Mitochondrial DNA and Y-specific DNA were also investigated in some projects. In ten projects isolated DNA was stored for future investigation and in eight projects blood, hair or tissue samples were stored for conservation.
4.3. Molecular genetic information from pigs
Blood samples were taken in all six pig projects described. Tissue, hair, and semen were also collected in some projects. All but one project stored samples for conservation purposes and the same happened with isolated DNA being kept for future investigations. Mitochondrial DNA was investigated in one project. Table 4.6 summarizes the results for all investigated markers in pig projects.

CGRFA/WG-AnGR-3/04/Inf.3 15
Table 4.6 Number of projects with pigs in which a specific type of sample was collected. Types of genetic markers Number of projects Biochemical markers 3 (50 %) Allozymes 1 (17 %) Microsatellites 6 (100 %) AFLP 1 (17 %) RFLP 1 (17 %) SNP 2 (33 %)
4.4. Molecular genetic information from horses and asinines
Blood samples were taken in all projects with horses and asinines projects and in the one ass project blood samples were taken. In two horse projects hair samples were also collected. No other sample type was collected according to the information received. The samples were stored for conservation purposes in case of one horse and one ass project, but no isolated DNA was stored. The types of markers analyzed are shown in Table 4.7.
Table 4.7 Number of projects with horses and asinines in which a specific type of sample was collected.
Types of genetic markers Number of projects Biochemical markers 4 (67 %) Blood groups 1 (17 %) Allozymes 2 (33 %) Microsatellites 5 (83 %) RFLP 3 (50 %) Other markers 2 (33 %)
Mitochondrial DNA was investigated in the project with asinines and in two projects with horses; Y-specific DNA was not investigated in any of the projects reported.
4.5. Molecular genetic information from camelids
Blood samples were taken in all but one of the reported projects with camelids. Other types of samples collected were hair and tissue. Isolated DNA was stored in all described projects and mitochondrial DNA in the Bactrian camel project. Table 4.8 presents the types of genetic markers investigated in projects with camelids.

16 CGRFA/WG-AnGR-3/04/Inf.3
Table 4.8 Number of projects with camelids in which a specific type of sample was collected.
Type of genetic markers Number of projects Species Biochemical markers 1
1 Alpaca Bactrian camel
Microsatellites 3 2 1
Alpaca Dromedary Bactrian camel
RFLP 1 Bactrian camel
4.6. Molecular genetic information from rabbits
Blood samples were collected in the single large project with rabbits, and stored for long-term ex-situ conservation. Biochemical markers, allozymes, microsatellite loci and mitochondrial DNA were analyzed. One sample of isolated DNA was stored to have material for further investigations.
4.7. Molecular genetic information from chickens
Blood samples were the basis for investigation in all eight questionnaires received about chicken projects, but in five projects additional sample types were collected: tissue, feathers, semen and egg content. In five projects some samples were stored for conservation purposes.
In only six projects were microsatellite loci analyzed. Table 4.9 gives an overview of the markers used for chickens.
Table 4.9 Number of projects with chickens in which a specific type of sample was collected.
Types of genetic markers Number of projects Biochemical markers 2 (25 %) Blood groups 2 (25 %) Microsatellites 6 (75 %) AFLP 1 (13 %) SNP 1 (13 %) Others 1 (13 %)
4.8. General considerations
Blood was the most frequently chosen sample type across all studies, having been chosen in more than 95% of the described projects. The second most widely used sample type according to the completed questionnaires was hair or feathers.
Microsatellite loci were the preferred choice of genetic marker. They were included in 66% of all genetic distancing studies. Biochemical markers were the next type of genetic markers most frequently chosen, used in 34 % of the projects. The interpretation of these figures must take into account that the information was collected primarily from projects in which microsatellite loci were believed to have been used. Therefore, the high percentage of projects in which this kind of marker was used may not be a good estimator of the actual proportion.

CGRFA/WG-AnGR-3/04/Inf.3 17
4.9. Use of microsatellite markers recommended by FAO
FAO has produced draft guidelines with lists of recommended microsatellite loci for genetic distancing studies (http://dad.fao.org/en/refer/library/guidelin/marker.pdf). There are lists for cattle, chicken, pig and sheep. For other species minimum requirements were suggested on the quality and quantity of microsatellite loci, but no special lists were given.
Table 4.10 classifies all projects according to the usage of the lists of markers recommended by FAO. In the species where FAO-recommended markers exist, these were used at least partly in 92% of the projects. In 26% of the projects the complete list was used.
No special list of recommended microsatellites exists for buffaloes, but in two projects the list for cattle was used and an attempt was made at fulfilling the minimum requirements on the quality of microsatellites.
In four of the six projects with pigs, the FAO list was used almost entirely. In several of the projects additional microsatellite loci were investigated beyond the recommended markers.
In only one of the eight chicken projects it was reported that the FAO recommended list was used in its entirety. In half of the chicken projects this list was not used at all, partly because a different type of marker was chosen.
Table 4.10 Number of projects in which FAO-recommended microsatellites were used. 1
Species (projects) Use of FAO-recommended microsatellites No microsatellites Not used Partly used Used Cattle (24) 0 (0 %) 14 (67 %) 7 (33 %) 3 Buffaloes (3) 1 (33 %) 1 (33 %) 1 (33 %) 0 Yaks (2) 0 (0 %) 2 (100 %) 0 (0 %) 0 Sheep (19) 1 (6 %) 15 (88 %) 1 (6 %) 2 Goats (11) 4 (40 %) 4 (40 %) 2 (20 %) 1 Pigs (6) 1 (17 %) 1 (17 %) 4 (67 %) 0 Horses/Asinines (6) 0 (0 %) 4 (80 %) 1 (20 %) 1 Camelids (6) 6 (100 %) 0 (0 %) 0 (0 %) 0 Rabbits (1) 1 (100 %) 0 (0 %) 0 (0 %) 0 Chickens (8) 2 (33 %) 3 (50 %) 1 (17 %) 2 FAO combined (57) 2 4 (8 %) 33 (66 %) 13 (26 %) 7 All projects (86) 16 (21%) 44 (57 %) 17 (22 %) 9 1 Percentages refer to the number of projects within a species where microsatellite loci were investigated, not to the total number of received questionnaires. 2 Combined information from projects with cattle, sheep, pigs and chickens.
4.10. Reasons for not using the FAO-recommended microsatellites and criteria for choosing other microsatellites
There are several reasons why researchers decide to use different sets of genetic markers. It must be distinguished whether a detailed list of markers or just general requirements on quality and quantity were recommended by FAO. Therefore cattle, sheep, pig and chicken, where detailed microsatellite list already exist, are considered separately from all other domestic animal species. A summary of the most common reasons for not using the FAO-recommended lists is presented in Table 4.11.

18 CGRFA/WG-AnGR-3/04/Inf.3 There is clearly one main reason, why FAO recommended microsatellites are not used for cattle and sheep studies. It seems that quite often other microsatellite loci are already in the laboratory, e.g. for parentage control. In these cases such markers are obviously preferred. The next important reason for the choice of different markers in sheep and cattle are better readability and better possibility for multiplexing. In sheep, cross-species amplification (with goats) was also one of the main reasons for using other sets of markers. No conclusive information can be drawn for pigs and chickens, in part because of the small number of questionnaires received.
Table 4.11 Reasons for not using FAO recommended microsatellite loci for genetic distancing studies in cattle, sheep, pigs and chickens.
Reasons Species Cattle Sheep Pigs Chickens Total No FAO recommendations exist 1 3 0 0 4 Unaware of FAO recommendations 1 1 0 0 2 Markers already available in the laboratory 12 11 2 2 37 Markers with better readability 4 6 0 1 11 Markers with better possibility for multiplexing
4 5 2 1 12
Cross-species amplification 1 6 0 1 8 Markers with higher information content 5 4 1 2 12 Publicly available primer kits 2 1 0 1 4 Other reasons 3 4 1 0 8
The reasons for not adopting the FAO-recommended microsatellite loci in genetic distancing studies in buffaloes, yaks, goats, horses, asinines, camelids, and rabbits are presented in Table 4.12. The main reason for not using recommended FAO microsatellites in these species was obviously the non existence of such a list. Nevertheless, researchers gave additional reasons for the choice of markers. In most cases, microsatellite loci already available in the laboratory were tested and, especially in projects with goats, microsatellite loci suitable for use in cross-species amplifications with sheep were chosen. High value was given to the possibility of multiplexing and to easy readability of the marker loci. Various other reasons for choosing certain markers were, e.g., to allow overlapping with other large projects and therefore markers were chosen from other existing lists. Some projects were especially carried out to test microsatellite loci. Some guidelines are described for selection of appropriate microsatellites can be found at http://dad.fao.org/en/refer/library/workgrp.pdf .

CGRFA/WG-AnGR-3/04/Inf.3 19
Table 4.12 Reasons for not using FAO-recommended microsatellite loci for genetic distancing studies in buffaloes, yaks, goats, horses, asinines, camelids and rabbits
Reasons Species Buffaloes/
yaks Goats Horses/
asinines Camelids Rabbits Total
No FAO recommendations exist
4 8 2 6 1 21
Unaware of FAO recommendations
0 2 0 0 0 2
Markers already available in the laboratory
2 4 2 0 0 8
Markers with better readability
0 0 5 0 0 5
Markers with better possibility for multiplexing
0 4 1 0 0 5
Cross-species amplification 1 5 2 0 0 8 Markers with higher information content
0 0 1 0 0 1
Public available primer kits 0 1 0 0 0 1 Other reasons 1 3 1 0 0 5
4.11. Promising genetic markers
At present, microsatellites are one of the most widely used genetic markers in genetic distancing studies. The rapid evolution of molecular genetic techniques may lead to the use of other types of genetic types in the near future. The questionnaire asked which genetic marker researchers were preferable for genetic distancing studies without considering genotyping costs. In 39 of the completed questionnaires there was a personal opinion of the researcher on which type of marker should be used. About 72% of the researchers recommended using microsatellites for future studies and about 31% suggest analyzing SNPs in addition to or in place of microsatellites. Investigation of Y-specific sequences and/or mitochondrial DNA was recommended by 21 and 18% of the researchers, respectively. Almost 36% suggested using various other genetic markers in addition to microsatellites.
Microsatellites will tend to be the genetic marker of choice in genetic distancing in the near future. FAO recommendations are often not considered because it may be cheaper or more convenient to use genetic markers already available in the laboratory. It is necessary to provide recommendations for other promising marker types before a similar trend of convenience develops in the like of microsatellites.
V. MICROSATELLITE LOCI IN DETAIL
In this section more detailed information is given on the microsatellite loci used. The first part deals with species where a list of FAO recommended microsatellite loci already exists, the second part with those where only general FAO recommendations are available.

20 CGRFA/WG-AnGR-3/04/Inf.3
5.1. Microsatellites used in genetic distancing studies with cattle, sheep, pigs and chickens
In Table 5.1 all microsatellite loci recommended by FAO for genetic distancing studies in cattle are listed in alphabetical order. Data on the second and third columns show in how many projects these loci were used. The percentage of projects where these loci were typed refers to the 21 cattle projects where microsatellite loci were genotyped. In other four projects, different types of genetic markers were used.
Table 5.1 Number of projects with cattle in which FAO-recommended microsatellite loci were genotyped (total of 21 projects)
Recommended microsatellite loci Number of projects Percentage of projects BM1818 (D23S21) 12 57 % BM1824 (D1S34) 18 86 % BM2113 (D2S26) 16 76 % CSRM60 (D10S5) 9 43 % CSSM66 (D14S31) 10 48 % ETH3 (D19S2) 15 71 % ETH10 (D5S3) 17 81 % ETH152 (D5S1) 12 57 % ETH185 (D17S1) 9 43 % ETH225 (D9S1) 19 90 % HAUT24 (D22S26) 11 52 % HAUT27 (D26S21) 10 48 % HEL1 (D15S10) 12 57 % HEL5 (D21S15) 12 57 % HEL9 (D8S4) 10 48 % HEL13 (D11S15) 11 52 % ILSTS005 (D10S25) 14 67 % ILSTS006 (D7S8) 13 62 % ILSTS011 (D14S16) 5 24 % ILSTS030 (D2S44) 4 19 % ILSTS033 (D12S31) 5 24 % ILSTS034 (D5S54) 3 14 % ILSTS054 (D21S44) 3 14 % INRA005 (D12S4) 11 52 % INRA023 (D3S10) 14 67 % INRA032 (D11S9) 11 52 % INRA035 (D16S11) 12 57 % INRA063 (D18S5) 11 52 % MM8 (D2S29) 5 24 % MM12 (D9S20) 11 52 %
CGRFA/WG-AnGR-3/04/Inf.3 21
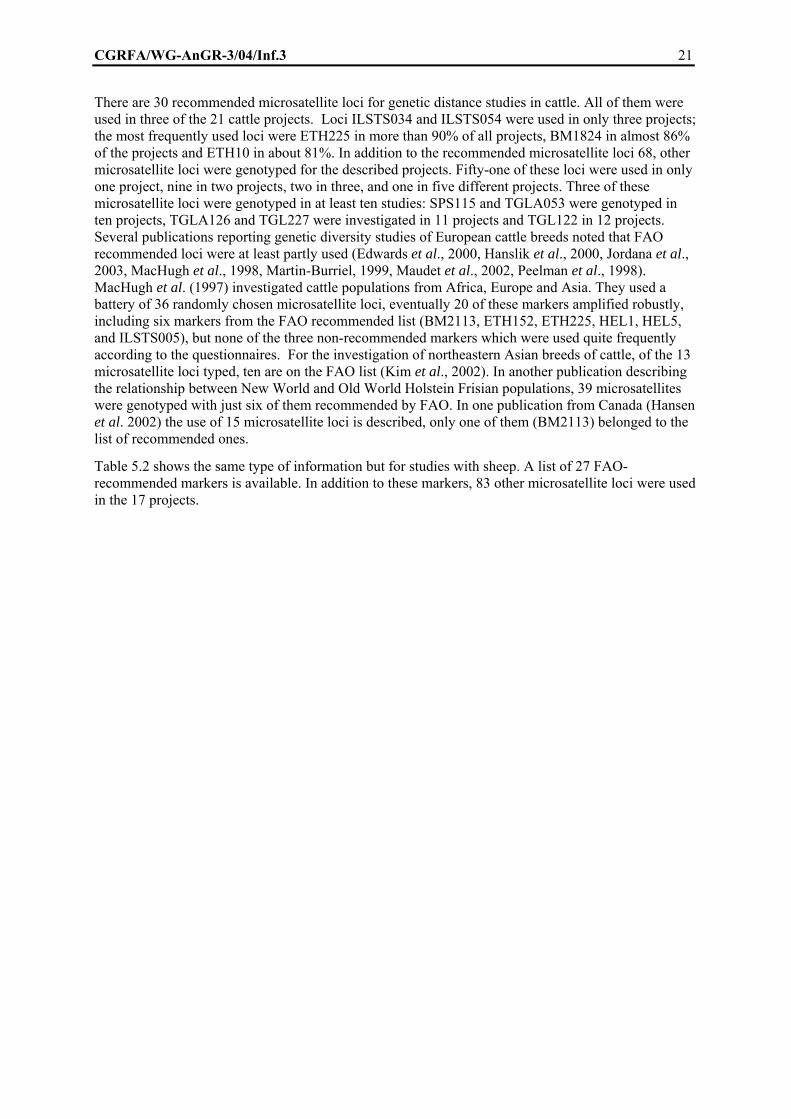
There are 30 recommended microsatellite loci for genetic distance studies in cattle. All of them were used in three of the 21 cattle projects. Loci ILSTS034 and ILSTS054 were used in only three projects; the most frequently used loci were ETH225 in more than 90% of all projects, BM1824 in almost 86% of the projects and ETH10 in about 81%. In addition to the recommended microsatellite loci 68, other microsatellite loci were genotyped for the described projects. Fifty-one of these loci were used in only one project, nine in two projects, two in three, and one in five different projects. Three of these microsatellite loci were genotyped in at least ten studies: SPS115 and TGLA053 were genotyped in ten projects, TGLA126 and TGL227 were investigated in 11 projects and TGL122 in 12 projects. Several publications reporting genetic diversity studies of European cattle breeds noted that FAO recommended loci were at least partly used (Edwards et al., 2000, Hanslik et al., 2000, Jordana et al., 2003, MacHugh et al., 1998, Martin-Burriel, 1999, Maudet et al., 2002, Peelman et al., 1998). MacHugh et al. (1997) investigated cattle populations from Africa, Europe and Asia. They used a battery of 36 randomly chosen microsatellite loci, eventually 20 of these markers amplified robustly, including six markers from the FAO recommended list (BM2113, ETH152, ETH225, HEL1, HEL5, and ILSTS005), but none of the three non-recommended markers which were used quite frequently according to the questionnaires. For the investigation of northeastern Asian breeds of cattle, of the 13 microsatellite loci typed, ten are on the FAO list (Kim et al., 2002). In another publication describing the relationship between New World and Old World Holstein Frisian populations, 39 microsatellites were genotyped with just six of them recommended by FAO. In one publication from Canada (Hansen et al. 2002) the use of 15 microsatellite loci is described, only one of them (BM2113) belonged to the list of recommended ones.
Table 5.2 shows the same type of information but for studies with sheep. A list of 27 FAO- recommended markers is available. In addition to these markers, 83 other microsatellite loci were used in the 17 projects.

22 CGRFA/WG-AnGR-3/04/Inf.3
Table 5.2 Number of projects with sheep in which FAO-recommended microsatellite loci were genotyped (total of 17 projects) Recommended microsatellite loci Number of projects Percentage of projects BM757 6 35 % BM827 1 6 % BM1314 4 24 % BM6506 5 29 % BM6526 5 29 % BM8125 5 29 % CSSM31 4 24 % CSSM47 2 12 % HUJ616 2 12 % ILSTS002 2 12 % OarAE129 5 29 % OarCP20 8 47 % OarCP34 8 47 % OarCP38 4 24 % OarFCB128 7 41 % OarFCB20 12 71 % OarFCB48 8 47 % OarHH35 2 12 % OarHH41 1 6 % OarHH47 5 29 % OarHH64 4 24 % OarJMP29 7 41 % OarJMP8 1 6 % OarVH72 4 24 % OMHC1 1 6 % RM4 2 12 % TGLA137 1 6 %
The most frequently used sheep locus, OarFCB20, was genotyped in 12 of the 17 projects, about 71%. Five loci were just used in one genetic distancing study in sheep. The list of recommended loci in sheep appears to be less accepted or useful than the list recommended for cattle. The fact that in 17 projects with sheep there were used 83 microsatellites, which are not on the FAO list, points into this direction. The non-FAO recommended microsatellite locus MAF65 was the most popular, present in ten sheep projects. Three loci (MAF214, OarFCB304, and TGLA53) were used in eight sheep projects (47%). However a little bit more than half of all those loci (42) were used in only one project. Several examples can be found in the literature were a small percentage of the genotyped microsatellites are FAO-recommended (e.g. Arranz et al., 1998, Diez-Tascon et al., 2000, Gutiéreez-Espelata et al., 2000, Hedrick et al., 2001). No example was found in which the majority of the markers used was chosen from the FAO list.
CGRFA/WG-AnGR-3/04/Inf.3 23
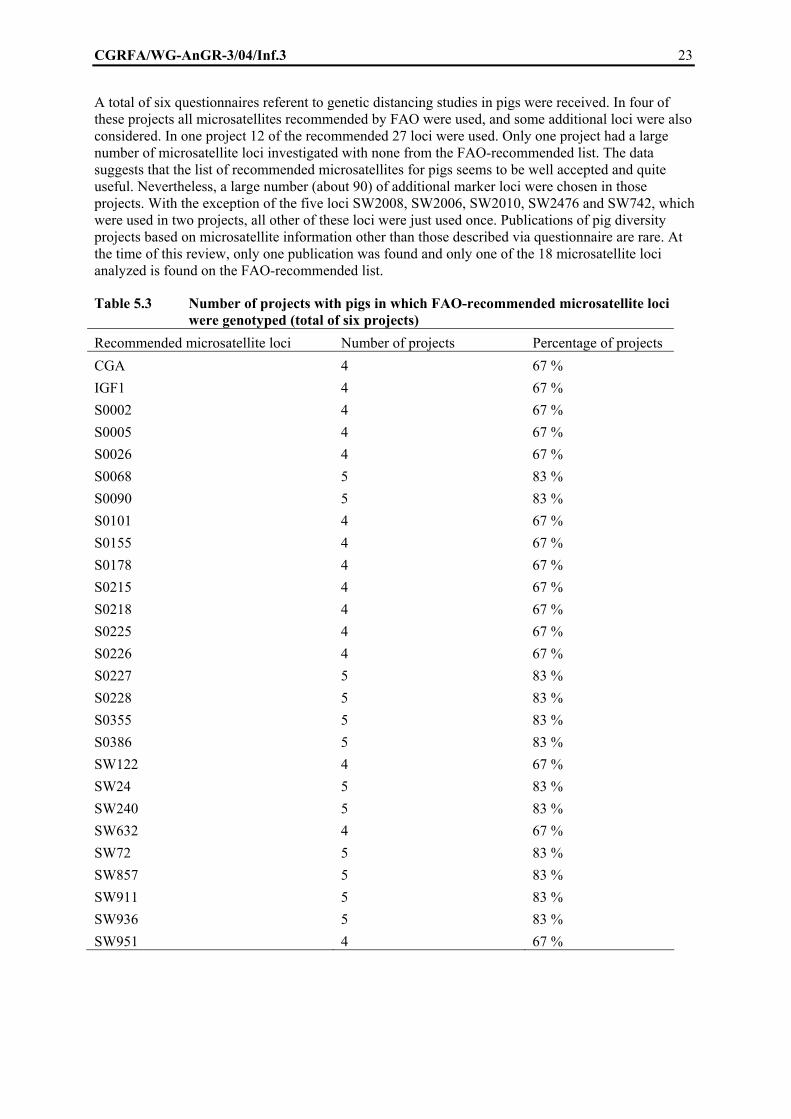
A total of six questionnaires referent to genetic distancing studies in pigs were received. In four of these projects all microsatellites recommended by FAO were used, and some additional loci were also considered. In one project 12 of the recommended 27 loci were used. Only one project had a large number of microsatellite loci investigated with none from the FAO-recommended list. The data suggests that the list of recommended microsatellites for pigs seems to be well accepted and quite useful. Nevertheless, a large number (about 90) of additional marker loci were chosen in those projects. With the exception of the five loci SW2008, SW2006, SW2010, SW2476 and SW742, which were used in two projects, all other of these loci were just used once. Publications of pig diversity projects based on microsatellite information other than those described via questionnaire are rare. At the time of this review, only one publication was found and only one of the 18 microsatellite loci analyzed is found on the FAO-recommended list.
Table 5.3 Number of projects with pigs in which FAO-recommended microsatellite loci were genotyped (total of six projects)
Recommended microsatellite loci Number of projects Percentage of projects CGA 4 67 % IGF1 4 67 % S0002 4 67 % S0005 4 67 % S0026 4 67 % S0068 5 83 % S0090 5 83 % S0101 4 67 % S0155 4 67 % S0178 4 67 % S0215 4 67 % S0218 4 67 % S0225 4 67 % S0226 4 67 % S0227 5 83 % S0228 5 83 % S0355 5 83 % S0386 5 83 % SW122 4 67 % SW24 5 83 % SW240 5 83 % SW632 4 67 % SW72 5 83 % SW857 5 83 % SW911 5 83 % SW936 5 83 % SW951 4 67 %

24 CGRFA/WG-AnGR-3/04/Inf.3
An overview on the use of the FAO-recommended microsatellites for chickens is presented in Table 5.4. In two of the eight chicken projects, no microsatellite loci were genotyped at all: AFLP, biochemical markers and blood groups were used instead. In one project microsatellite loci were used but no detailed information was provided to the loci genotyped in addition to the FAO-recommended. Data in Table 5.4 covers only the six projects where the information was reliable.
Table 5.4 Number of projects with chickens in which FAO-recommended microsatellite loci were genotyped (total of six projects)
Microsatellite loci Projects Microsatellite loci Projects ADL102 2 (33%) MCW16 3 (50%) ADL136 2 (33%) MCW41 1 (17%) ADL158 2 (33%) MCW43 2 (33%) ADL171 1 (17%) MCW44 1 (17%) ADL172 2 (33%) MCW48 1 (17%) ADL176 2 (33%) MCW49 2 (33%) ADL210 2 (33%) MCW50 1 (17%) ADL267 2 (33%) MCW51 2 (33%) MCW1 2 (33%) MCW59 2 (33%) MCW2 1 (17%) MCW71 1 (17%) MCW4 2 (33%) MCW73 2 (33%) MCW5 1 (17%) MCW75 1 (17%) MCW14 4 (67%)
In five projects information on other loci was given. A total of 55 microsatellite loci were used in addition to the 25 FAO-recommended loci. Four microsatellite loci, MCW067, MCW183, MCW295 and MCW330 were used in three projects and nine loci, ADL112, ADL268, ADL278, LEI166, MCW078, MCW081, MCW111, MCW222 and MCW248 were used in two projects.
Several publications on chicken projects were found. In one of those projects (Zhou and Lamont, 1999) just two out of 42 microsatellites are, by chance, on the FAO-recommended list. In another large project (Wimmers et al., 2000) that investigated the distinctness of African, Asian and South American chicken breeds, eight out of 22 genotyped microsatellite loci were chosen from the FAO-recommended list.
5.2. Microsatellites used in genetic distancing studies with yaks, buffaloes, goats, horses, asinines, camelids and rabbits
For the majority of domestic animals species no specific list of suitable microsatellites has yet been published by FAO, despite the fact that these species are also the target of genetic distancing studies. As reported above in the first chapter, several responses were received citing studies with buffaloes, yaks, goats, horses, asinines, camelids and rabbits. In a project with buffaloes, only microsatellites recommended for genetic distancing studies in cattle were used, in another project, 21 microsatellite loci were tested especially for Asian water buffalo.
The following microsatellite loci, recommended for genetic distancing in cattle, were used: BM1818, BM1824, ETH3, ETH10, ETH225, HEL1, HEL5, HEL13, ILSTS005, INRA005, INRA032 and INRA063. In addition to those microsatellites several other loci were tested, the following table lists 31 microsatellite loci, which lead to reasonable data for the Asian water buffalo. In Table 5.5 a list of useful microsatellite loci for genetic distancing studies in buffaloes is presented.

CGRFA/WG-AnGR-3/04/Inf.3 25
Table 5.5 Microsatellite loci known to provide useable data in genetic distancing studies in buffaloes
AGLA293 CSSM038 CYP21 BMC1009 CSSM041 BRN CSSM008 CSSM043 ETH121 CSSM013 CSSM045 ERH131 CSSM015 CSSM046 HMH 1R CSSM019 CSSM047 MGTG4B CSSM022 CSSM075 TGLA48 CSSM029 CSSM060 TGLA57 CSSM032 CSSM061 TGLA126 CSSM033 CSSM038 TGLA227 CSSM036 CSSM062 TGLA263
In one of the mentioned buffalo projects, yaks were also investigated. It is reported that ILSTS005, which is recommended for cattle, failed to amplify in yaks. In two other projects, BM1824 and CSSM66, recommended for cattle, provided useful results. Furthermore, the loci AGLA093, AGLA293, BML2113, ETH225, ILSTS008, ILSTS028, MGTG4B, MGTG7, SPS115, TGLA053, TGLA122, and TGLA126 were genotyped for the yak.
Information on ten projects, where genetic distancing studies were based on microsatellite information in goats, was received. Ninety-three microsatellite loci were investigated; 12 of them are on the list of FAO-recommended loci for sheep and 15 are found on the list for cattle. Special comments were provided for several loci. It was reported that locus BMS357 showed single base pair allele difference, in one project less than 4 alleles were found for the loci ILSTS059, INRA037and INRABERN148. Some information on these loci is presented in Table 5.6. Only one of the most common used microsatellite loci, MAF065, was not recommended either for sheep or for cattle. These results are in agreement with the fact that quite often the choice of markers in projects with goats is done because of the possibility of cross-species amplification, in this case, sheep.

26 CGRFA/WG-AnGR-3/04/Inf.3
Table 5.6 Information on the microsatellites used in genetic distance studies for goats Microsatellite Number of projects FAO list Specific comments BM1314 2 sheep BM1818 6 cattle High PIC BM1824 2 cattle BM2113 2 cattle BM6506 2 sheep BM8125 2 sheep CSSM066 2 cattle ETH10 5 cattle ETH152 1 cattle ETH225 4 cattle Null alleles reported in sheep HAUT27 2 cattle INRA005 6 cattle INRA023 6 cattle INRA032 1 cattle INRA063 6 cattle ILSTS005 6 cattle ILSTS011 8 cattle High PIC MAF065 8 no MM12 2 cattle OarAE129 1 sheep OarCP20 3 sheep OarCP34 2 sheep OarCP38 1 sheep OarFCB20 7 sheep OarFCB48 6 sheep High PIC OarJMP29 1 sheep RM004 1 sheep TGLA137 1 sheep
Four questionnaires were completed for projects where microsatellite loci were investigated in horses. Less than 25 loci were genotyped in total; they are listed in the Table 5.7. Results on genetic distancing studies in breeds of horses were published, also providing information on reliable microsatellite loci (e.g. Bjornstad and Roed, 2001; Canon et al. 2000; Cunningham et al., 2001; Luis et al., 2002).
One questionnaire provided data on three breeds of asinines. Eight equine microsatellite loci were investigated and six of them provided useful data: AHT21, LEX24, MPZ002, NVHEQ18, UCDEQ502 and UCDEQ505. The two other loci investigated, HMS1 and HMS8, were homozygous.

CGRFA/WG-AnGR-3/04/Inf.3 27
Table 5.7. Microsatellite loci used in four genetic distancing studies with horses AHT4 HTG10 AHT5 HTG15 ASB2 LEX3 ASB17 LEX32 ASB23 LEX33 HMS1 LEX34 HMS2 LEX35 HMS3 LEX41 HMS6 TKY19 HMS7 TKY321 HTG4 UCDEQ405 HTG6 VHL20 HTG7
A small number of completed questionnaires on camelids was received. Some microsatellite loci were successfully used for different species: alpaca, dromedary and Bactrian camel. Table 5.8 gives an overview of the usage of the microsatellite loci across species. One research team mentioned the following loci as being specifically unsuitable for several reasons (monomorphic, difficult to score, sex-linked): LCA65, LCA66, VOLP12, VOLP17, VOLP33, VOLP59, VOLP67, YWLL29 and YWLL36.
In one project with rabbits, 28 microsatellite loci were genotyped in 13 breeds originating from five European countries. Twenty-three loci provided useful results. Their names were not listed because there is no normalized list of microsatellites names for rabbit.

28 CGRFA/WG-AnGR-3/04/Inf.3
Table 5.8 Microsatellites used in genetic distancing studies of camelids. Microsatellite Alpaca Dromedary Bactrian camel CVRL1 X X CVRL2 X X CVRL5 X X CVRL6 X X CVRL7 X X LCA5 X X X LCA19 X X X LCA22 X X X LCA33 X X X LCA37 X X X LCA56 X X X LCA63 X X X LCA651 X LCA661 X X X LCA77 X X VOLP03 X X X VOLP08 X X X VOLP10 X X X VOLP171 X VOLP32 X X X VOLP591 X VOLP671 X X X YWLL02 X X YWLL08 X X X YWLL09 X X X YWLL19 X YWLL291 X X YWLL361 X YWLL38 X X X YWLL40 X YWLL43(X-linked) X YWLL44 X X X YWLL59 X X
Convention: X: typed for the species. 1 Not recommended for dromedaries.

CGRFA/WG-AnGR-3/04/Inf.3 29
5.3. General considerations
In cattle and pigs, the FAO-recommended loci were widely used, but that was not the case with chickens. It appears to be necessary to provide a new list of microsatellite markers for chickens that accommodates the current praxis. The information gathered also suggests the need for recommended lists of genetic markers for the species where it does not yet exist. This could assist in obtaining a high degree of overlap of genotyped loci.
In large projects carried out in China, all or almost all microsatellites recommended for the species investigated were used. As shown in Table 4.10, about 22% of all projects used all FAO-recommended microsatellite loci, but about 21% of the projects do not use any of the FAO-recommended microsatellite loci. A certain overlap between genotyped loci is quite probable within sheep and cattle projects because some markers not recommended by FAO are also widely used. In pigs there is high overlap because the FAO-recommended markers are quite accepted. In chickens the situation is worse: no FAO-recommended markers were used and the large number of microsatellite loci used provided almost no overlap between projects.
For buffaloes and yaks it seems necessary to recommend loci that are suitable for cross-species amplifications with cattle. According to the literature, bovine microsatellites seem to be applicable for Asian and African water buffalos. For goats a high number of loci that are recommended for sheep or cattle are appropriate. When possible, microsatellite loci should be recommended to provide usable results for a larger spectrum of species.
VI. ADDITIONAL BREED CHARACTERISTICS
Genetic distances based on microsatellite loci arguably (FAO, 1998) provide the best information representing the relationship between breeds. If true, these should aid objective and rational decision-making in the choice of breeds for conservation, utilization, and evaluation studies, to determine comparative genetics for production traits. Ruane (1999) pointed out that genetic distancing studies are quite expensive, so that with limited financial resources in the area of animal genetic recourses, only a small part would be earmarked for the further documentation of breed criteria. This is quite important, because distancing measures cannot account for consequences of artificial selection for morphological or economic traits or for natural selection for fitness. Further to this point of view in, one section of the questionnaire asked whether and which type of additional breed characteristics were recorded in genetic distance projects. Sixty-four percent of the projects recorded some additional data on traits or characteristics of the animals or birds. The details are presented in Table 6.1.
In projects where no additional breed characteristics were recorded, the main goal may have been solely to determine if subpopulations with similar phenotypes might actually constitute different breeds. A project aimed to characterize livestock breeds should not consider exclusively molecular genetic information.
FAO defines a breed as a sub-specific group of domestic livestock with definable and identifiable external characteristics that enables it to be separated by visual appraisal from other similarly defined groups within the same species, or a group for which geographical and/or cultural separation from phenotypically similar groups has led to the acceptance of its separate identity. Note that breeds have been developed according to geographic and cultural differences and to meet human food and agricultural requirements. In this sense, breed is not a technical term. The differences between breeds, both visual and otherwise, account for much of the diversity associated with each domestic animal species. A breed is often accepted as a cultural rather than a technical term. (World watch list for domestic animal diversity, 3rd edition, http://dad.fao.org/en/refer/library/wwl/wwl3.pdf)
The above definition of a breed makes it sensible to collect various other data in a population like morphological traits (including body measurements, color and pattern of pelts, shape of horns etc.), production performance and disease resistance. Other useful information may be the geographical

30 CGRFA/WG-AnGR-3/04/Inf.3 spread or the history of separation. In the questionnaire it was asked which additional information on a breed was recorded. Table 6.2 contains the answers for the 56 projects where additional information was collected. Multiple answers were possible.
In most cases some kind of description of the morphology of the breed was recorded, and descriptors of performance level were also of high importance, In only 32% of the projects some kind of information was recorded describing disease resistance. In 27% of the projects some other criteria were recorded, but some of those might fall in the category of morphological traits if they are defined as qualitative (e.g. coat colour) or quantitative (e.g. height of wither) traits describing the appearance of an animal. The next most common criterion in the category “other” was the geographical distribution of a breed. This type of information was recorded for 9% of the projects. Other criteria mentioned were reproductive traits, descriptors of behavior, special cultural value, conservation activities, husbandry aspects, the origin of the breeds, breed history and current use.
Table 6.1 Number of projects where additional characteristics on a breed were recorded. Species Production
performance Morphological traits
Disease resistance Other
Buffaloes 1 0 1 0 Cattle 12 15 5 4 Yaks 1 1 1 0 Goats 6 6 1 1 Sheep 8 9 5 4 Pigs 3 3 1 2 Asinines 0 1 0 0 Horses 3 3 1 1 Bactrian camels 0 0 0 0 Dromedaries 2 2 1 0 Alpacas 1 1 0 0 Rabbits 1 1 0 0 Chickens 5 6 2 3 Total Percentage
43 77
48 86
18 32
15 27
It is good use of resources to record additional information about a breed while collecting samples for molecular genetic analyses. In the majority of the projects such information was recorded. For the definition of breeds, as given above, recording of additional characteristics is recommended, and it is also useful when identifying breeds for conservation purposes.
VII. MATHEMATICAL AND STATISTICAL TOPICS
A large number of genetic distancing measurements exists which are more or less adequate to explain the relationships between breeds of a species. There is no general consensus on which of the many genetic distancing measures is the best for analysis of within-species populations, such as in domestic animal breeds (FAO, 1998). The correlations among various distance measures have been found to be generally very high (Simianer, 2002).
According to the responses received, the most frequently used distance measure is Nei’s standard genetic distance, which was calculated in 67% of the projects, followed by Nei’s DA distance, in 47%

CGRFA/WG-AnGR-3/04/Inf.3 31
of the projects (Table 7.1). These commonly used distance measures may not the most suitable distance measures if a short divergence time between breeds is believed to exist; the most appropriate use is for studies where breeds from all over the world are investigated. Typically, in each project two or three different measures of genetic distance were calculated.
Table 7.1 Number of projects where a specific genetic distance measure was calculated. Genetic distance measure Number of projects Shared allele distance 12 (14 %) Nei’s standard genetic distance 58 (67 %) Nei’s minimum genetic distance 21 (24 %) Rogers’ distance 11 (13 %) Cavali-Sforza and Edwards chord distance 22 (25 %) Nei’s DA distance 41 (47 %) Reynold’s genetic distance for short term evolution 22 (25 %) Goldstein et al. 6 (7 %) Average Squared Distance 6 (7 %) Shriver et al.’s distance 6 (7 %) Other genetic distance measures 19 (22 %)
The decision about which genetic distance measures were adopted was closely linked to the availability of software packages. In FAO’s Secondary Guidelines (FAO, 1998) the DISPAN (T. Ota, Institute of Molecular Evolutionary Genetics, Pennsylvania State University) and BIOSYS-1 computer programs are mentioned as suitable. Recently a great number of software packages has been developed for the calculation of genetic distances, heterozygosity and similarity. Many are available free of charge. Table 7.2 shows how frequently some well-known programs were used in the studies. The two most popular programs, PHYLIP and DISPAN, are available free of charge.
Table 7.2 Number of projects in which specific computer software was used to calculate genetic distances.
Software Number of projects PHYLIP http://evolution.genetics.washington.edu 26 PAUP* http://paup.csit.fsu.edu 4 DISPAN http://ftp.bio.indiana.edu 15 POPGENE http://www.ualberta.ca/~fyeh 8 ARLEQUIN http://lgb.unige.ch/arlequin 5 GENETIX http://www.univ-montp2.fr/~genetix/genetix/genetix.htm 5 MICROSTAT 7 BIOSYS-1; BIOSYS-2 11
Graphical representations of genetic distance matrices are called distance trees. Different methods to draw such trees exist. The most frequently used method was Neighbor-Joining NJ, which was used in 62 projects, followed by UPGMA, applied in 28 projects. Maximum likelihood-based methods were used in nine projects. The survey also showed which computer software was most popular to construct genetic distance trees. In 52 projects, distance trees were constructed using PHYLIP (http://evolution.genetics.washington.edu); TreeView (http://taxonomy.zoology.gla.ac.uc/rod/treeview.html) and PAUP* (http://paup.csit.fsu.edu) were used

32 CGRFA/WG-AnGR-3/04/Inf.3 in 26 and 21 projects, respectively. The preferred programs were those available free of charge and that allowed both the calculation of distance matrices and the drawing of distance trees in a publishable form. For the choice of the genetic distance measure those aspects might have been more important than the choice of the most adequate genetic distance measure.
VIII. AVAILABILITY OF RESULTS
One reason for sending out a questionnaire was to obtain information on ongoing, not yet published projects. A short overview is given on that information, which is already or will soon be published. Some ongoing project publications are available, mainly from completed contracts. Forty-seven articles related to this project were published, the majority written in English. Other languages represented were Chinese, French, German, Portuguese, Russian, and Spanish.
It is also of interest which results are or will become available for the scientific community. For 62 of the projects it was reported that at least plots of distance trees will be made available. In 54 projects the distance matrices will be published, and in 48 projects detailed genotyping results are or will become available, e.g. through a public database. Tissue samples (27 studies) and DNA samples (14 studies) will be available for use by other researchers.
IX. PROJECT COSTS
Usually scientific publications on genetic distance studies yield no information on the cost of the project. To obtain such information, an extra section about project costs was included in the questionnaire. About 50 percent of the received questionnaires provided at least some information about the costs of genetic diversity studies. In Table 9.1, an overview of the average costs is presented. Contributors were asked to give cost in US dollars even if for many projects the original budget was established in a different currency. Because some extreme values may influence the mean costs, the medians are also presented.
For all costs a complete report was requested or, if not available, at least an estimate. Generally one of the most important costs in genetic diversity studies is the cost of sampling animals. Another important factor is the cost of genotyping. On average, 65% of the whole project expenses were spent on genotyping, about 20% of the costs in sampling costs, 10% in the statistical analysis and only 5% for coordination. The most expensive part of genetic distance studies, genotyping of microsatellite loci, showed a wide range for the portion on the total costs, between 20% and 90% of the whole project costs.
The costs for genotyping one microsatellite loci varied between USD 0.44 and USD 25.30, with an average value of USD 2.90. The relatively high investment in genotyping should stimulate the collection of additional in the animals or birds being sampled.
Table 9.1 Descriptive statistics on costs of genetic distancing studies (figures in US dollars). Cost Projects Range Mean Median Minimum Maximum Whole project 41 500 14,000,000 131,622 20,000 Sampling animals 29 0 336,000 35,772 6000 Genotyping 31 1200 2,791,000 90,032 13,500 Statistical analysis 28 0 620,000 22,164 1000 Project coordination 29 0 304,100 10,486 3000

CGRFA/WG-AnGR-3/04/Inf.3 33
X. SUMMARY AND CONCLUSIONS
A number of studies on the genetic diversity of farm animal species has been carried out. Under the co-ordination of FAO an initiative called MoDAD (Maintenance of Domestic Animal Diversity) was established to provide technical recommendations for such biodiversity studies in farm animals. To define species-specific standards, the International Society for Animal Genetics (ISAG) formed an advisory group on animal genetic diversity in 1995. This ISAG/FAO advisory group set up lists of recommended microsatellite marker loci for cattle, chickens, sheep and pigs. These recommendations were partly adopted by the scientific community. These recommendations were reviewed to provide a basis for updating the recommendations. Most results of the review were based on feedback received in response to a questionnaire, which was sent worldwide to research teams working with genetic distancing. In addition, a comprehensive literature research was carried out, in which it became evident that the FAO recommendations are rarely cited, despite being widely known. The major results from this study were:
The majority of genetic distancing studies were carried out in ruminants, especially for cattle, where specific recommendations for microsatellite loci already exist. Large international studies including many breeds spread over a wide area were also carried out for chickens, pigs, and sheep.
Researchers have made an effort to fulfill at least minimum requirements with regard to sample size per breed. The main reason why sample sizes are sometimes too small is the low number of living or available animals. Researchers reported that a better coordination in the phase of sample collection could improve the situation.
In about two-thirds of the projects, additional breed characteristics like production performance, morphological traits, disease resistance, behavioral traits and cultural values were recorded. Because of limited availability of financial resources for conservation purposes and the importance of making a sound and reliable decision which breeds to conserve for the future, recording of additional breed characteristics is recommended. Genetic distances based on allele frequencies derived from several selection-neutral microsatellite loci should be just one source of information out of several for such a sensitive decision. Recording of additional breed characteristics would also improve the cost efficiency of projects.
Blood is the most frequently used type of sample, even if it requires more effort with in conservation and transportation.
In about 57% of the genetic distancing studies, microsatellites recommended by the ISAG/FAO advisory group were partly used. The highest acceptance rate of the recommendations was found in cattle, the lowest in chickens. The main reason why different sets of loci were analyzed was the use of already available microsatellite loci in the laboratory. Arguably, if microsatellite loci than other than the recommended ones show higher readability, higher information content and better possibilities for multiplexing exist. Further investigation would be necessary to prove such arguments.
Microsatellite loci will still be the most useful type of genetic marker in the near future. A revision of the list of FAO-recommended microsatellite loci is recommended. SNPs were also singled out as promising markers for future genetic distancing studies. To avoid a low acceptance of recommended sets of loci for the same reasons as observed for microsatellite loci, recommendations for other types of genetic markers have to be developed and made public early.
In cattle and sheep a certain overlap of the investigated loci can be expected across projects. In cattle, a very high acceptance of the recommended loci was found, but in a revised list especially the possibility for cross species amplification with Asian and African water buffaloes and maybe yaks should be considered. Several studies have showed that bovine microsatellite loci are suitable for those species.

34 CGRFA/WG-AnGR-3/04/Inf.3 In sheep the acceptance of the recommended loci is lower than in cattle. Some non-recommended loci were used often; their inclusion in a revised FAO-recommended list should be considered. For sheep the recommendation of loci used for goats must be considered. No microsatellite recommendations for goats exist yet; developing such recommendations is necessary. Some degree of overlap with sheep loci must be ensured; data from several large projects with goats and sheep projects could provide the basis for such list.
In projects with pigs a high acceptance of the recommended loci was found; in several of these described projects the recommended loci were used totally. No negative experiences with FAO-recommended loci for pig were reported.
In chickens the recommended microsatellite list were only marginally accepted. In most cases markers already available in the laboratories were used. These markers sets differ a lot between laboratories. It is argued that the chicken markers used yield better information than the recommended ones. A complete revision of the list of microsatellite loci for chickens is necessary.
For several species the lack of recommendations for genetic distancing studies dictates an urgent need to develop of relevant lists of microsatellite loci. The possibility for cross-species amplification would be suitable for water buffaloes and cattle. In the case of case of goats, several loci suitable for sheep may be recommended.
A large project with horses is currently being carried out; it will be worthwhile to take into account experiences from this ongoing project. Frequently used microsatellite loci from several other projects with horses can be the basis for developing recommendations.
For rabbits, the research team of a large project should be consulted to make a list of recommended markers. No normalized list of microsatellites in rabbit currently exists.
Genetic distancing studies with camelids show clearly that several markers are usable for different species. These marker loci should be preeminent in an upcoming list of recommendations.
It is not clear if data analysis should be standardized using one or few methods believed to be “best”. Training courses and workshops are believed to improve the situation with regard to assay standardization and data management between project partners.
A revised version of the guidelines must be published and advertised in journals of high circulation. Finding and downloading of new or revised guidelines should be made easy.
XI. CONTRIBUTORS
A detailed list of contributors is available from FAO (AGAP) upon request.
XII. INFORMATION ABOUT GENETIC DIVERSITY STUDIES ON THE WORLD WIDE WEB
Information on several projects on genetic diversity in domestic animals is available on the internet. The internet websites listed below were provided by the contributors to this report. Only websites informing directly about genetic diversity studies are included here.
http://www.projects.roslin.ac.uk/pigbiodiv/
“Characterisation of the genetic variation in the European pig to facilitate the maintenance and exploitation of biodiversity”
http://lasig.epfl.ch/projets/econogene/

CGRFA/WG-AnGR-3/04/Inf.3 35
“Sustainable Conservation of Animal Genetic Resources in Marginal Rural Areas: Integrating Molecular Genetics, Socio-economic and Geostatistical Approaches”
http://www.uco.es/grupos/cyted/
“RED IBEROAMERICANA SOBRE LA CONSERVACIÓN DE LA BIODIVERSIDAD DE ANIMALES DOMÉSTICOS LOCALES PARA EL DESARROLLO RURAL SOSTENIBLE (RED XII-H)”
http://www.genres.de/tgr/rotviehprojekt/
“Molekulargenetische Differenzierung verschiedener Rotviehpopulationen” [Molecular genetic differentiation of different red cattle populations]
http://www.androclus.vet.uu.nl/RESGEN/
“Towards Strategy for the conservation of the genetic diversity of the European cattle”
http://www.inia.gob.pe/PRONIGEB/pinrz/Zoogeneticos.htm
“Characterization of animal genetic resources on the basis of useful traits: Evaluation of the existence of a Criollo Cattle breed in the interandean valleys of the central sierra and Punto Andes”
http://www.sunare.helsinki.fi/eng/agriculture/vilkki/index.htm
“Sustainable use of National Resources”
http://w3.tzv.fal.de/aviandiv/
“Development of Strategy and Application of Molecular Tools to Assess Biodiversity in Chicken Genetic Resources”
http://www.inia.gob.pe/PRONIRGEB/pinrz/Zoogeneticos.htm
“PRONIGREB: Recursos Zoogenéticos”
http://www.rala.is/beta/
“NorthSheD: Origin and Diversity of North European sheep breeds”
XIII. REFERENCES
Arranz, J.J., Bayón, Y. and San Primitivo, F. (1998) Genetic relationships among Spanish sheep using microsatellites. 29: 435-440.
Barker, J.S.F., Moore, S., Hetzel, S., Evan, D., Tan, S.G. and Byrne, K. (1997a) Genetic diversity of Asian water buffalo (Bubalus bubalis): microsatellite variation and comparison with protein-coding loci. Animal Genetics 28: 103-115.
Barker, J.S.F., Tan, S.G., Selvaraj, O.S.. and Mukherjee, T.K. (1997b) Genetic variation within and relationships among populations of Asian water buffalo (Bubalus bubalis). Animal Genetics 28: 1-13.
Bjørnstad, G. and Røed, K.H. (2001) Breed demarcation and potential for breed allocation of horses assessd by microsatellite markers. Animal Genetics, 32: 59-65.
Bjørnstad, G. and Røed, K.H. (2002) Evaluation of factors affecting individual assignment precision using microsatellite data from horse breeds and simulated breed crosses. Animal Genetics, 33: 264-270.
Bjørnstad, G., Nilsen, N.Ø. and Røed, K.H. (2003) Genetic relationship between Mongolian and Norwegian horses? Animal Genetics, 34: 55-58.

36 CGRFA/WG-AnGR-3/04/Inf.3 Cañon, J., Checa, M.L., Carleos, C., Vega-Pla, J.L., Vallejo, M. and Dunner, S. (2000) The genetic structure of Spanish Celtic horse breeds inferred from microsatellite data. Animal Genetics. 31: 39-48.
Crooijmans, R.P.M.A., Groen, A.F., van Kampen, A.J.A., van der Beek, S., van der Poel, J.J. and Groenen, M.A.M. (1996) Microsatellite Polymorphism in Commercial Broiler and Layer Lines Estimated Using Pooled Blood Samples. Poultry Science 75: 904-909.
Cunningham, E.P., Dooley, J.J., Splan, R.K. and Bradley, D.G. (2001) Microsatellite diversity, pedigree relatedness and the contributons of founder lineages to thoroughbred horses. Animal Genetics. 32: 360-364.
Diez-Tascón, C., Littlejohn, R.P., Almeida, P.A.R. and Crawford, A.M. (2000) Genetic variation within the Merino sheep breed: analysis of closely relarted populations using microsatellites. Animal Genetics 31, 243-251.
Dorji, T., Hanotte, O., Arbenz, M., Rege, J.E.O. and Roder, W. (2003) Genetic Diversity of Indigenous Cattle Populations in Bhutan: Implications for Conservation. Asian-Aust. J. Anim. Sci. 16(7): 946-951.
Edwards, C.J., Dolf, G., Looft, C., Loftus, R.T. and Bradley, D.G. (2000) Relationships between the endangered Pustertaler-Sprinzen and tree related European cattle breeds as analysed with 20 microsatellite loci. Animal Genetics 31: 329-332.
Fan, B., Wang, Z.G., Li, Y.J., Zhao, X.L., Liu, B., Zhao, S.H., Yu, M., Li, M.H., Xiong, T.A. and L.K. (2002) Genetic variation analysis within and among Chinese indigenious swine populations using microsatellite markers. Anim. Genet. 33: 222-227.
FAO Food and Agriculture Organisation of the United Nations (1998) Secondary Guidelines for Development of National Farm Animal Genetic Resources Management Plans. Measurement of Domestic Animal Diversity (MoDAD): Original Working Group Report. http://dad.fao.org/en/refer/library/guidelin/workgrp.pdf
FAO Food and Agriculture Organisation of the United Nations Secondary Guidelines for Development of National Farm Animal Genetic Resources Management Plans. Measurement of Domestic Animal Diversity (MoDAD): Recommended Microsatellite Markers. http://dad.fao.org/en/refer/library/guidelin/marker.pdf
Gutiérrez-Espeleta, G.A., Kalinowski, S.T., Boyce, W.M. and Hedrick, P.W. (2000) Genetic variation and population structure in desert bighorn sheep: implications for conservation. Conservation Genetics 1:3-15.
Hanotte, O., Bradley, D.G., Ochieng, J., Verjee, Y., Hill, E.W. and Rege, J.E.O. (2002) African pastoralism: genetic imprints of origin and migrations. Science. 296: 336-339.
Hansen, C., Shrestha, J.N.B., Parker, R.J. , Crow, G.H. , McAlpine, P.J. and Derr, J.N. (2002) Genetic diversity among Canadienne, Brown Swiss, Holstein, and Jersey cattle of Canada based on 15 bovine microsatellite markers. Genome 45 (5) pp 897.
Hanslik, S., Harr, B., Brem, G. and Schlötterer, C. (2000) Microsatellite analysis reveals substantial genetic differentiation between contemorary New Worls and Old World Holstein Friesian populations. Animal Genetics 31: 31-38.
Hedrick, P.W., Gutiérrez-Espeleta, G.A. and Lee, N. (2001) Founder effect in an island population of bighorn sheep. Molecular Ecology 10: 851-857.
Ivanković, A., Kavar, T., Caput, P., Mioč, B., Pavić, V. and Dovč, P. (2002) Genetic diversity of three donkey populations in the Croatian coastal region. Animal Genrtics. 33:169-177.

CGRFA/WG-AnGR-3/04/Inf.3 37
Jordana, J., Alexandrino, P., Beija-Pereira, A., Bessa, I., Cañon, J., Carretero, Y., Dunner, S., Laloë, D., Mozami-Goudarzi, K., Sanchez, A. and Ferrand, N. (2003) Genetic structure of eighteen local south European beef cattle breeds by comparative F-statistigs analysis. J. Anim. Genet. 120: 73-87.
Kim, K.S., Yeo, J.S. and Choi, C.B. (2002) Genetic diversity of north-east Asian cattle based on mocrosatellite data. Animal Genetics 33: 201-204.
Lemus-Flores, C., Ulloa-Arvizu, R., Ramos-Kuri, M., Estrada, F.J. ans Alonso, A. (2001) Genetic analysis of Mexican hairless pig populations. Journal of Animal Science 79(12): 3021-3026.
Luikart, G., Biju-Duval, M.-P., Ertugrul, O., Zagdsuren, Y., Maudet, C. and Taberlet, P. (1999) Power of 22 microsatellite markers in fluorescent multiplexes for parentage testing in goats (Capra hircus). Animal Genetics. 30: 431-438.
Luís, C., Cothran, E.G. and Oom, M.M. (2002) Microsatellites in Portuguese autochthonous horse breeds: usefulness for parentage testing. Genetics and Molecular Biology, 25(2):131-134.
MacHugh, D.E., Loftus, R.T., Cunningham, P. and Bradley, D.G. (1998) Genetic structure of seven European cattle breeds assessed using 20 microsatellite markers. Animal Genetics 29: 333-340.
MacHugh, D.E., Shriver, M.D., Loftus, R.T., Cunningham, P. and Bradley, D.G. (1997) Microsatellite DNA Variation and the Evolution, Domestication and Phylogeography of Taurine and Zebu Cattle (Bos taurus and Bos indicus). Genetics 146: 1071-1086.
Martín-Burriel, I., García-Muro, E. and Zaragoza, P. (1999) Genetic diversity analysis of six Spanish native cattle breeds using microsatellites. Animal Genetics 30: 177-182.
Martínez , A.M., Delgado, J.V., Rodero, A. and Vega-Pla, J.L. (2000a) Genetic structure of the Iberian pifg breed using Microsatellites. Animal Genetics. 31: 295-301.
Martínez, A.M., Peinado, B., Barba, J,V., Vega-Pla, J.L. (2000b) Gentic analysis of the Chato Murciano and is relationship with the Iberian pig using Microsatellites. Book of Abstracts of the 27th International Conference on Animal Genetics. Minneapolis.
Martínez , A.M., Rodero, A. and Vega-Pla, J.L. (2000c) Estudio con microsatélites de las principales variedades de ganado porcino del tronco Ibérico. Arch. Zootec. 49: 45-52.
Maudet, C., Luikart, G. and Taberlet, P. (2002) Genetic diversity and assignment tests among seven French cattle breeds based on microsatellite DNA analysis. J. Anim. Sci. 80(4) 942-950.
Mburu, D.N., Ochieng, J.W., Kuria, S.G., Jianlin, H.,Kaufmann, B., Rege, J.E.O. and Hanotte, O. (2003) Genetic diversity and relationships of indigenous Kenyan camel (Camelus dromedarius) populations:m implications for their classification. Animal Genetics 34: 26-32.
Miretti, M. M., Pereira Jr, H. A., Poli, M. A., Contel, E.P. B. and Ferro, J. A. (2002) African Derived Mitochondria in South American Native Cattle Breeds (Bos taurus): Evidence of a New Taurine Mitochondrial Lineage. J. of Heredity 93 (5) 323-330.
Mo, D.L., Liu, B., Wang, Z.G., Zhao, S.H., yu., M., Fan, B., Li, H., Yang, S.L., Zhang, X.G., Xiong, T.A. anf Li, K. (2003) Genetic Variation and genetic Relationship of Seventeen Indigenious Chinese Pig Breeds using Serum Protein Loci. Asian-Australasian Journal of Animal Science 16(7): 939-945.
Navani, N., Jain, P.K., Gupta, S., Sisodia, B.S. and Kumar, S. (2002) A set of cattle microsatellite DNA markers for genome analysis of riverine buffalo (Bubalus bubalis). Animal Genetics. 33: 149-154.
Peelman, L.J., Mortiaux, F., van Zeveren, A., Dansercoer, A., Mommens, G., Coopman, F., Bouquet, Y., Burny, A., Reanville, R. and Portetelle, D. (1998) Evaluation of the genetic variability of 23 bovine microsatellite makers in four Belgian cattle breeds. Animal Genetics 29: 161-167.

38 CGRFA/WG-AnGR-3/04/Inf.3 Ritz, L.R., Glowatzki-Mullis, M.L., MacHugh, D.E. and Gaillard, C. (2000) Phylogenetic analysis of the tribe Bovini using microsatellites. Animal Genetics 31: 178-185.
Roosen, J., Fadlaoui, A. and Bertaglia, M. (2003). Economic Evaluation and Biodiversity Conservation of Animal Genetic Resources. Econogene publication.
Rosenberg, N.A., Burke, T., El, K., Feldman, M.W., Feidlin, P.J., Groenen, M.A., Hillel, J., Maki-Tanila, A., Tixier-Boichard, M., Vignal, A., Wimmers, K. and Weigend, S. (2001) Empirical evaluation of genetic clustering methods using multilocus genotypes from 20 chicken breeds. Genetics 159 (2): 699-713.
Ruane, J. (1999) A critical review of the value of genetic distance studies in conservation of animal genetic resources. J. Anim. Genet. 116: 317-323.
Saitbekova, N., Gaillard, C., Obexer-Ruff, G. and Dolf, G. (1999) Genetic diversity in Swiss goat breeds based on microsatellite analysis. Animal Genetics 30: 36-41.
Simianer, H. (2002) Molekulargenetische Differenzierung verschiedener Rotviehpopulationen. Schriftenreihe des Bundesministeriums fűr Verbraucherschutz, Ernaehrung und Landwirtschaft, Angewandte Wissenschaft Heft 493.
Simianer, H., Marti, S.B., Gibson, J., Hanotte, O. and Rege, J.E.O. (2003) An approach to the optimal allocation of conservation funds to minimize loss of genetic diversity between livestock breeds. Ecological Economics 45: 377-392.
Tapio, M., Grigaliunaite, I., Holm, L.E., Jeppsson, S., Kantanen, J., Miceikiene, I., Olsaker, I., Viinalass, H. and Eythorsdottir, E. (2002). Mitochondrial differentiation in Northern European Sheep breeds. Proceedings of the 7th World Congress of Genetics Applied to Livestock Production. Montpellier, France, August 19-23, 2002.
Tapio, M., Miceikiene, I., Vikki, J. and Kantanen, J. (2003) Comparison of microsatellite and blood protein diversity in sheep: inconsistencies in fragmented breeds. Molecular Ecology (in press).
van Hooft , W.F., Hanotte, O., Wenink, P.W., Groen, A.F., Sugimoto, Y., Prins, H.H.T. and Teale, A. (1999) Applicability of bovine microsatellite markers for population genetic studies on African buffalo (Syncerus caffer). Animal Genetics. 30: 214-220.
Wimmers, K., Ponsuksili, S., Hardge, T., Valle-Zerate, A., Marthur, P.K. and Horst. P. (2000) Genetic distinctness of African, Asian and South American local chickens. Animal Genetics. 31: 159-165.
Yang, L., Zhao, S.H., Li, K., Peng., Z.Z. and Montgomery, G.W. (1999) Determination of genetic relationships among five indigenous Chinese goat breeds with six microsatellite markers. Animal Genetics. 30: 452-455.
Zhou, H. and Lamont, S.J. (1999) Genetic characterization of biodiversity in highly inbred chicken lines by microsatellite markers. Animal Genetics. 30: 256-264.