commission of the european communitiesaei.pitt.edu/3449/1/3449.pdfcommission of the european...
TRANSCRIPT
COMMISSION OF THE EUROPEAN COMMUNITIES Sec(91) 1732/2
Brussels, 27 September 1991
) REPORT OF THE COMMISSION
THE MARKET FOR SOLID FUELS IN THE COMMUNITY IN 1990 AND THE OUTLOOK FOR 1991
~~' trii~;;;fMl./
0
Revision of the report of the Commission Doc. SEC (91) 471 final - July 1991 -
--------------

2
CONTENTS
1. . INT!WOCTIOO 4
2. EOJNOMIC SITUATION 4
2.1. Results for 1990 4
2.2. Forecasts for 1991 5
' 3. ill.VEI.DPMENT OF 'IRE CXJMl..liJNITY ENER:iY MARKET 6
3.1. The energy market in 1990 6
3.2. t En.e.rgy forecasts for 1991 8
4. T.dF. HARD CX>AL MARKE·r 9
4.1. Community ha.rcl coal pro:luction 9
4.2. ·Hard coal deliv-eries 10
4.2.1. Deliv-eries to power stations 12
4.2.2. DeJ.i veries to' coking plants ani the stee.l .in:lustry 12 •.
4.2.3. DeJ.i veries .to other industries 13
4.2.4. Deliveries for domestic consumption and other
consurners 14
4.3. Intracammuni ty trade in hard coal 14 ·~.
. 5. LIGNI'I'E 15 I
5.1. Ava i 1 ahl e lignite resources . Prc:d.uction ani imports . 15
5.2. Lignite deliveries. :J. 16 ,• .~;
P· CXlKE 17
7. HARD ffi'ili DffiJRI'S FROM NON-MEMBER CXJUNTRIES 18
7.1. The coal situation in the Community's main suppliers 19
8. SUMMARY P...ND OJNCLUSIC:lNS 20

LIST OF TABLF..S
1 . Hard coaJ.. w a:nce sheet - 1991 .
2. Ha.rd coa.l balance sheet - 1990.
3. Ha:rd. coa.J. reJance sheet - 1990. Market report - Ma...""Ch 1991.
4.
5. C'.oke ba.1ance sheet - 1990.
6. Coke l::a1.a.nce sheet -! 1990. Market rep:Jrt - March 1001.
;? . Lignite ar:d peat b:l.la.nce sheet - 1991.
8 . Li.gni te . a.n:l pea. t · la1 ance sheet - 1990.
9. Li.gni te a..."rl pea. t 1:alance sheet - 1000.
Market report - March 1991 .
10. Hard coal prcx:luction by area.
11. Hard coaJ. imports from third countries in 1991 by ty~ of coaJ..
12. Hat'd coaJ. i.rrtpJrts from third countries in 1990 by type of coa.l.
13. Hard coal i.m];x)rts from th:ird countl·ies - 1000/1991. I 14. Intraconmnmi ty exchanges. Hard. coal :":i 1991.
· 15. Intracammtini ty excha.nges. Hard coal - 1990.
16. IntracOmmuni ty excha.nges. Hard coal - 1990.
Market report - M&--ch 1991.
17. In~a.cammuni ty. excha.nges. Coke - 1991.
18. Intra.cornmun.i ty excha.nges. Coke ~ 1990.
19. Intracormnu:ni ty excha.nges. Coke - 1oo:J.
Market report -~ 1991.
20. Effrotive consumption in power sta.tions.
21. Stooks.
3

Cnmmi SSi on report on:
The market for solid .fuels in tbe Ccummmity in 1990
and the outlook for 1991.
(rev:Lsion)
This report suroma.rizes the results obtaine:i in 1990 and gives the Member
: States' forecasts for 1001, on the b3sis of information forwa.rded to t..lle
Cormn.:Lssion in June 1001.
Tile purpose of the report is to inform the ECSC Consultative Committee ani
those concerne:i about developments on the market for solid fuels in the
Community as soon as pos.._c:ct.ble.
Tbe r€p)rt thus uJrla:tes the information conta.ine::l in the Commissi.on' s I . annual report on "the IM.rket for solid fuels in the Community in 1990 ani
the outlook for 1001 ul wbich gave the forecasts nade at the end of 1990.
At t.."'le end of the yea.:r a n....OVl report t,;jJJ. be drawn up 'Wi tb. the prov.i.siona.l
results for 1991 and the outlook for 1992.
The information· conta.inei in this document, unless specifie:i to the
contr~, does not cover the new Germ.:m provinces. s.ince the neoessa.ry data
is mostly una.vai lahl e. ''
2. :ECDNDMIC SITOATION
2. 1. P.esu1 ts for 1S90
During the course of 1990, the vmrld economy was affecte:i by a series of
exceptional events, including: the collapse of the planned e:::xmomies of
Fastern :iplrope, German reunification, mounting uncertainty in the Soviet
Union and, lastly. the Gulf crisis . However. the Community was
1 SEX::(91) 471 FlnaJ.
4
sul:stantially una.ffectei by the international. situation ani many of the
negatiVe effoots on the e::xmoray were offset by the favourable influence of
German reuni£ica:tion a.n:i the progress made towards tlie creation of the
single market. Nevertheless, there was an una. 'Voidable slCTWi.Dg <l.own of the
Community's economic growth: the GDP growth rate in real terms was 2. 7%
(3. 3% in 1989). This <l.ownturn in economic acti v"i ty did not affect
6nployment, where the a.rinuaJ. growth rate (+ 1.~) rema.i.ne:i stable, al~ the job e+eation rate slowe:i down during the course of the year. Infia.tioh rose slightly to 5% (4.~ in 1989).
2.2. Forecasts for 1001
The economic ·outlook for the Comrrnmity in 1991 is slightly more
pessim:i..stic. However, the. main irx:lica.tors which form the l:esis of the
current economic downturn seem to be disappearing: the Gulf crisis bas been
largely resolved, oil prices have returned. to pre-conflict leve:Ls. economic
a.cti vi ty in the Un1 te:l States shou1.d begin to pick up in the secon:i half' of
the year ani the value of the OS dollar is now rising aga.:m .. In short,
there seems to be a gradual return of confidence to the fina.nci.a.l markets.
The economic forecasts for the Community in 1991 are less favourable than
those made at.. the errl of last y69X. Accorcl:Ulg to the Commission's
·fore::asts ln9de in· May 1991, the r€!:JOOVerY of. investment ani private
. C011SlliDPtion should lead to an upturn in economic activity during the secon:i
half of the year. However, real GDP grciwth. will not excee:i 1. 5% in 1991 ,
i.e. arouni half the rate achieved in 1990.
. ./ '"
! The growth rate of domestic deffi:url iii · real terms is expecte:l to fall
sharply frcnn. last ye:u-'s figure to 1.4%, :which roughly ties in with the GDP
forecasts. Investment is expecte:i to l:e affectei most, w:l. tb. a growtbrate
of less than 1% as compa.re:i to 4.3% in 1~. For the first time since 1986 r.,
this figure will be · lower than the GDP. growth rate. The re:iuction in . '
; ·investment is due to many factors, including: the increase in real unit
i s:U.ary costS ( +0. ex, in 1900 arrl +0. 3% in 1991) , the less promising outlook
I in respect Of dema.Irl aver the past year ani a half an:i, lastlY, a certain ; . . .
level.li.ng of investment which bad been very dynS.mic for sevP-l'al years.
5

The lo;.;r growth rate of economic activity is likely to result. in a job
creation rate of less than 1/4% :in 1991;, that is, the lowest rate since
1984. This la;.r gro-wth of employment will be insu:fficient to meet the
expectej_ inCre3.se in the active population. so that the unemployment rate.
on the decline since 1986, is expectei to rise to around 8. 7% in 1991 .
Despite the slOVling down of economic activity, the lllfla.tion rate. rneasurei
by the deflator of private CODSUlilptiOn, should remain virtually unchange:l
at a relatively high level ( ~) . The persistence of inflationary pressure
is essenti.a.lly due to the development of unit sa.la.ry costs. which could
rise by 5. 93b. .The prices of ill1porte::l goo::ls ani services could increase by
only 1%.
Community exports of gocxis ani services to the rest of the world could grow
by 3 3/4% in volume, wbich is considerably less than the growth recordei in
1000 an:l !1989 (a drop of aroun::i 5%).
3 .1. Tbe energy market in 19901
In 1990 the d.ema.n1 for pr:ilre.ry energy in the Community rose by arourrl 2%,
despite the economic downturn, the high oil prices recordei during the
second half of the y63.I' and the gocxi weather. There was an increase in the
dem3n::l for all types of fossil fuel.
The demand for petroleum pro:iucts rose by 0. ~ :1J:l terms of domestic
deli ver~es and by 2. 1% in terms of domestic consumption, mainly owi.ng to
increa.sai dem:url in the transport and :P .. ea:ting sector, whilst power station
consumption· fell by 3. %.
The demand for natural gas rose by 3.~ despite the good weather. It
should be rernembere:l that consumption of this fuel is more closely l:Ulke::i
to weather conditions than that of other fuels. Moreover. as a result of
1 Drawn up on the l::Bsis of the forecasts conta.ine:l in "Energy in Europe.
May 1991". Cornm:Lssion of the European Cornmunities/!Xi XVII.
6

7
the Gulf· crj f',.:i.s other f'uels were to some a-tent replac9i by natural. gas .for
elcctri.ci.t-y generation: in the last quarter a:msumption shot up by more
than 2CY.6.
The dem:mi for solid fuels in terms of consumption r€IM.inai aJ.roost stable
in absolute terms, ris:L,g by only 0.3%, althoug'h their share in meeting .the
Communi.ty's energy rEqUirements once again fell in relative terms. The
:Lncrease:i d.enen:i from pcrwer stations offset the decJ 1 ne recordai i.n most of i ' :the other sectors.
'Ihe de!rard for electricity rose by only 2~.3%, the lor.vest figUre since 1983.
Hydroelectric prcxiuction pickOO. up to a 6ertain ertent, e..m. at the end. of.
lg;() was 10lli up on tbe previous year's figure. Hwever, it was still much
, lwer than il1 1988. .Rainfall was sJig"'ntly higher but. e\ren so, the I · increase in pro:iuc"t:J.on was ac.rueved mainly at the cost of rErltl.c.ing T,rd. te.r
reserves in dams.
Conventional pawer stations bad ·to compensate for the. dxop in el.ectrici ty
g.:-me:ra·tion frora other SOUJ.'C€S an:i this lei t;o a suhstantial increase in tb.e
cr..'lnSl:L.1tption of bard co-J.l ( +4. 5%) ru:x:l m.tural gas . ( +:t. 2CfJ). :t-ru.cl.ear
pr~uction fell by 0. 5% in 1000.
P".rilta.;"'"'Y energy prcxiuction .in t.lJ.e Comrm.mi ty decrease:i l:rf 0. 3%, ma..llliy owll1g
to the drop in the pro:iuction of solid fuels ani heat of 1mClear o:r.1.gin.
GFOSS J.:OiESTIC OJNStJldPTION (Mtoe)
1989 19'2() 1001 1001100 (*) ("'*) (%)
' 228.6 1 Sol.i.c;i :f'Uels ' 230~8 231.5 - 1.3
.Oil 491.6 50'~.0 504.8 + 0.6 N'a t-ura.l gas 201.4 ror.·e 214.5 + 3.2 Calor. 158.8 158.3 '165.6 + 4.6 Other' I 15.7 16.6' 18.8 +13.3
'IDI'AL. 1038.4 1116.2 1132.6 + 1.5
Source: LG XVI.I - Energy :1...1·1 h"'urope. May 1001 . . I
C *) . · provisional ( * * ) estJJna te
3. 2. Energy foreo3Sts for 1991
On the resi s of the economic forecasts given above ani as.sumi.:Dg an aVerage
price of arourrl 20 dollars per l:arrel of crude - 13.4% lower than the
average price recorded in 1990 - ani norma.l. wea. ther conditions, the
· domestic energy demand , in terms of consumption, is expecte::l to rise by
1. 6% to 1133 Mtoe.
By type of fuel, the demand for petroleum products is unl i kel y to rise by
more than 0. '7%, d.espi te the expecte::l re:luction in price. Only deliveries
to power stations will prol:::e.bl. y fall as a result of the expecte::l recavery
of :rruclea.r ani hydraulic production ani :Lncrease:i deliveries of solid
fuels.
Of the fossil fuels, the biggest increase is likely to be for natural gas;
on the ba .. sis of the above assumptions it could be around 3. 2%.
The dema.n:i for solid fuels, in terms of .,consumption, is likely to fall by
1. 3% as a. result of the expecte::l decreasi.ng dem:l.nd in all traditional
markets with the exception of power stations. It is possible that more
natural gas w:Ul be usEd for elootric.ity production, at the expense of
solid fuels .
'Ibis once again confirms that the dema.nd. for coa.l is increas.ingly linka:l to
elootricity generation. For example, while deliveries of hard coal to this
sector accounte::l for 61% of total domestic deliveries in 1987, in 1990 the
figure was 65% and in 1001 it 'Will reach nearly 67%.
I
1 Lastly, the dema.n:i for electricity could rise by aroun:i 2:9lb. Assurnlllg
that the :rruclea.r sector will recover as a result of the inc.!rease in the
rnnnber of power sta. tions in operation ani that hydroelectric production
will also recover, electricity prcxiuction in conventional power stations
could decline slightly :in 1991, especially :in fuel oil fire:l power
stations.
8

i 4.1. Ha:rd CX-al prq;luction in the Community (Table 10).
i Accorcling to the l.a.test information available, hard coa.l production in tl1B
Community amounte:i to 198 .8 Mt in 1000, which is 1. 1 Mt less thap. forecast
·in the previous report, owing to the fact that both France ani the United.
Kingdom have revise:i their prcx:luction figures dOwnwards. Prcx:luction in
1930 Was 9.9 Mt down on the previous yea.r!s figure.
HARD COAL PRODUCTION IN THE COMMUNITY
'(mllllona tonn~al 100m 80
I 60
40
1989
~.:
1
:·.' ,,
1990 1991 REV.
Pi::!'ld PORTUGAL
~~'@ BELGIUM
D FRANCE
8 SPAIN
I' ··I GERMANY
CJ UNITED KINGDOM
Fo~ 1001, 'proiuction is expecte:i to be 192.3 Mt, that is, 6.5 Ht less than
· in 1990. This figure is 2.8 Mt higher ~ that quote:i previously, owing
to Gei-m:my Is a.IXi the Uni tei Kingdom Is reyi.sion upwa.rds .
. The sr.a.rPest drop li1. prcduc~on ·is expected. . in Gerrnarry (- 4:. 1 Mt) , which,
for the first time in many years, ~'i.J~ put it ahe:lr.l of the Unite:i Kingdom
in ·terms' of cuttecl~ in hard coal pro:iuction.
9

4.2. Ha.:rd coal deliveries (Tables 2 to 4)
In 1990 bard coal deliveries in the Conummity totalle:l 319.9 Mt, nearly
5 Mt up on the previous year. The increase was due aJJnost ex:olusively to
the greater demand from power stations. Deliveries outside the Community
amounte:l to 1 . 1 Mt.
In carnp3.I'ison with tbe estimate made at the eni of last year, there has
been a significant increase ( + 5. 3 Mt) owi.ng to tbe fact t.ba t all the
Member Sta. tes, 'INi th the exception of ItaJ. y ani the Uni te:l Kingdom, have
· revised. their deliveries upwards. Although all sectors have revise:l
upwards, v7i th the exception of "other" , t'D..e sharpest increases have been in
;the electricity sector ani, to a lesser extent, cok.ing plants, al thoug1l the
a.ctu.a.l volume of deliveries to the latter has dropp::d in relation to last
year's figure.
1989
• Including recoveries
HARD COAL AVAILABILITIES EUR-12
D IMPORTS
- PRODUCTION •
1990 1991 REV.
10
'I
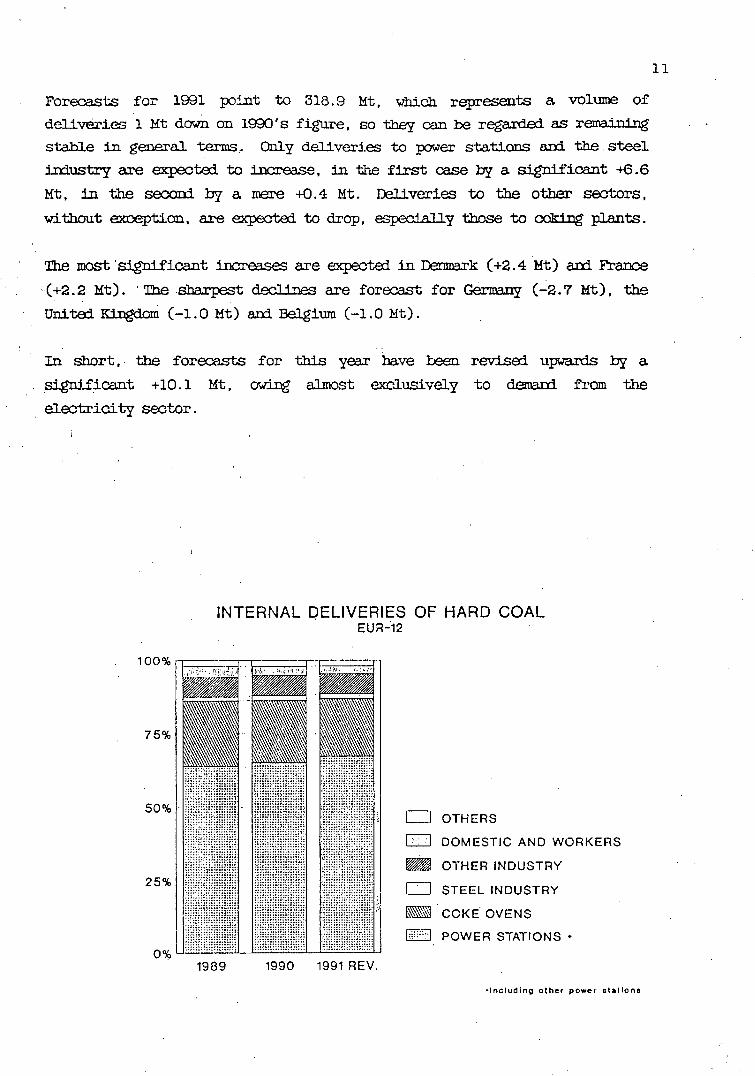
Forecasts for 1991 }X)int to 318.9 Mt, which represents a volume of
deLi w~ies 1 Mt d.crwn on 1990 Is figure' so they can be rega.rde:i as rema..ini.ng
stable 1n general ~,. Only deliveries to power sta.t.ions an:i the. steel
in:lustry are expectei to increase, in the first case by a signif'icant +6. 6
Mt, :1Jl the se:::xm:1. by a mere +0. 4 Mt. Deliveries to the other sectors,
w.i thout exception, are expEXltei to drop. especi.a.ll y those to co.ki.Dg plants.
The most ·significant :i.ncre:lses are expecte:i in Dennark ( +2. 4 Mt) ani France
·{ +2. ~ Mt) . · The sharpest declines are forecast for Germa..ny ( -2. 7 Mt) , the
Unite:l Kingdom ( -1.0 Mt) an:i Belgium ( -1.0 Mt).
In short, . the foreoasts for this year have l:ee:n revise:i upwards by a
sign!..fica.nt +10.1 Mt, a...rlng almost excJ.usively to d.ema.ni fJ.'om the
elootrici ty sector.
75%
50%
25%
INTERNAL OELIVERIES OF HARD COAL EUR-12
1989 1990 1991 REV.
D OTHERS
0 DOMESTIC AND WORKERS
~ OTHERJNDUSTRY
CJ STEEL INDUSTRY
B. COKE OVENS
@'] POWER STATIONS •
•Including other power atallona
11

4.2.1. Deliveries to pooer sta.ticm..s
Hard coal deliveries to public power stations lllcrease:i consjderahly during
1990, reaching 197.1 Mt as a result of a dECline in rruclear prcxiuction
c-o.~). various plants belllg put out of operation, and. the effects of the
Gull crisis.
In 1991, it is ex:pecte:l tbat there will be a fresh increase in consumption
ani, to a grooter extent, deliveries, s.i..nce some oountries are pJ...a.nnll:1g to
1ncreuse the stocks of ba:rd coal in power stations. Rainfall remaine'J law
an:i, as a result, so clid hY-IToelectric production. This points to a
consi.stant demand on conventional power stations, espec.ia.lly the coa.l-file:i I
ones. Supplies could thus reach 203.6 Mt.
By country, Belgium, Spain, Italy a.rx:l Portugal expect deliveries to fall by
not more tban 1 Mt. '.I'h.Ls is due to the use of existing power station
stocks and, in Belgium, the increasi.ng use of natural gas.
The rema.:i..ning cormtries expec:t increases._. in particular France ( +4.1 Mt),
Denmark ( +2. 5 Mt) , the United Kingdom ( + l. 4 Mt) ani Gernany ( + l. 1 Mt) .
There are various reaso..TlS for t..llls. In De:nma.rk the i.llCI'eases reflect the
electricity demarrl from a united Germany. In France) EDF conti m1es to
increase its stccks as a safeguard against possible supply incj dents within
or outside the Cormmmi ty, as well as low hydroelectric production
pos.sibi 1 i ties. In the other countries the increase is almost exclusively
due to the growing demand for electricity.
There bas been an j~'lCrease of +11.3 Mt compa.re:i with the forecasts made at
·the start of the year, which is la.rg'el y due to the increases in deliveries
to France and I:'enmark.
4. 2. 2. Deliveries to cok::Lng plants and tbe steel industry
As in 1990, the production of both pig iron ani steel is expected to
decline thrCJ.Jg'110Ut the year.
12

I '
In 1001. a.llO'W.ing for certain adjustments in trade ani the volume of
stocks. the prcduction of raw steel could be aroun:i 132 Mt as against 136. 7
Mt in 19GX). As regards Consumption, the variation is expecte:i to be
similar in absolute terms.
In 1001 bard coaJ.. d.eliveries to ~..g plants, continuing the trelrl
: d.ispl.a.ye:i in 1g;:x), are almost certain to drop by aroun:i 5.4 Mt (-8.1%) to
· appraxi.nately 61.6 Mt.
'i
This is ooinly due to the present situation in the steel irrlustry but also
to the increas1ng use of steam coal as a partial substitute for coki.ng coa.1
in blast :t'u.i-na.oes am. in Gernany. the increaserl use of scrap jn steel
prcxiuction.
By country, a gene:ra.lizei doollne is ex.J?e(?tei. In a.l::solute terms, the most
St.lh:;ta.Dtial re:iuctions will be m Gernany C -2. 0 Mt) • the United. Kingdom
(-1.3 Mt) a.tii France (-1.0 Mt).
Deliveries of steam coal to the steel i¢ustry seem to l::e moving in the
opposite ~tj_on, with an expootei increase of 0.4 Mt (+6.~). so that
deli ~ies could total 6. 1 Mt by the en:i of 1001.
4.2.3. Deliveries to "otber in:iustries"
As a whole, the market may be regardei as relatively stable, .since the
amounts supplierl rerrain fairly constant, although there is a slight
. downward t:rerrl which is a.llnost perrn:ment. ! I'
' I '
The forecasts for ~991 pomt to diliveries of 27.2 Mt as against 27.5 Mt in
lOOJ. Thb variations by country are generally less than 0.1 Mt. A drop of , 0.3 Mt is expectEd in. France, not as a result of a re:iucei dema.n:l for
energy from the consumers. but owing to an expectei incre:l.Se in the use of ' '
· ~ oil, 'which is more oompetitively pricei.
13

4.2.4.· Deliveries for domestic consumption and "other CODS'Illllei'S"
Deliveries of' bard coa.l for domestic use are cont:i..nuing to fall in the
COmrmmi ty as a whole. In 1000, 8. 6 Mt were supplie:i and 7. 9 Mt are
expecta:l for t'l:l:L<:> yeax, i . e. 0. 7 Mt less . Allnost all the Member Sta. tes ,
with the exception of the Uni:te::l Kingdom, estilna.te that deliveries will be
exactly the same or slightly hig1:ler than in 1990. However, the drop of 0.5
Mt in, the Unite:i Kingdom is big enough to drag total deliveries to this
sector d.owirwards.
Gene:rall y spea.k.ing, deliveries to other consumers, which include
concessiona.ry coal, are coritinu.ing to exhibit a downward. trend which is 0
unl 1 keJ y to be reversei in the future. As a whole, these supplies - which
represent 2. m. of domestic hard coal supplies in the Cormnun.i ty - could
amount to 6. 3 Mt in 1991 as against 7. 1 Mt in 1980.
4.3. Intraoammun1.ty trade in bard coal ('I'cllles 14 to 16)
Prospects for intracommuni ty trade in hard coal are not goo:i. In terms of
imports, i.e. the amounts Member States expect to re::::e:ive from other
Conmruni ty countries, the figure is expecte:l to be aroun::l 7. 1 Mt, which is
3.2 Mt da..m on last year's figure of 10.3 Mt (-31.4%). Countries which are I .
' expecting to rEduce their purchases substantially are the Uni tei Krngdom (-
. 1. 5 Mt) , Fra.noa (--Q. 65 Mt) an::l Del:mark ( -Q. 5 Mt) ; the re:ma..:inlllg variations
are smaJ.ler.
14
In terms of exports, the estima.tei figure for 1991 is 8.0 Mt as against
10. 1 Mt in 1990. Germany an::l the Uni te:i Kingdom expect substantial
re::luctions, the former aroun1 1.3 Mt and the latter approx:i..roa.tely 0.9 Mt, I .
an::l shipments of 3.6 Mt a.n:l 0.7 Mt respectively for the year as a whole.

. ,.
At all . events. this trade. which is mostly in blast furnace coa.l will
' . inevitably dec1 1 ne. 'Ibis applies. in particular to exports from Germany,
given .that un:ier the terms of the 1987 Kohle.run::le agreement an:i a
. government dec1 si on all aid. for the marketing of such types of coal will be
·! · wi t~rlrawn after 1992. The wi tlxlrawal of aid, which will aLso affect the
narketing of coke, will mean that this coal will have difficulty competing
with coa.l from non-lllE!IIlbe.r countries :t:eca.use it will be more expensive.
5. i.:r:GN:rm (Tables. 7 to 9)
5. 1. Ava:l..l.a.ble l.ign:i. te :re301.ll"'eS. Proiuct:ton a.rrl imp:!rts
Lignite pro:luction for 1991 is estirna. ted at 193 Mt. which is 5. 1 Mt up on
1990's figure. Imports are est:ilra.te:i at a.roun:i 2 Mt, which will bring
ava11ahle lignite resources for 1991 up td' 198 Mt.
Por..1er stations THill consume aroun:l 174. 5 Mt. which represents a ll ttle over
88% of available resources ain is +4.5 M~. up on deliveries for 1990. This 0 . . . . .
incre9.se is almost exclusively due to the··,·exp3.L1sion forecast in Greece (+5
Mt) .
. ~ reunification ha.s incorporate:i vast resources of 1igni te into the
Community. The eestern provinces pro:lucei more lignite in 1990 than the
rest of the Community put together, 249 Mt COI!!p9.re:l to 191 Mt.
As a result. lignite is now Germany's biggest own energy resource: tota.l.
resources rea.ch.erl. 359 Mt. provid.ing much more e:nergy than their own
pro:iuction of bard .coa.l. In addition, prcx:luction costs in terms of energy 90ntent are sul::stantially lower than for hard coal in the western provinces ;
ani hence closer to solid fuel prices on the internationaJ. .narket .
15

However. a. cut in prcxiuction ca.p:lCi ty in the eastern area seems inevitable
owing to tbe environmental impact of burn.ing lignite. This restructuring
will be ao.:xJinpmied. by a transfer of technology from the west to improve
competitiveness. The results obta.ine:l in 1990 and the forecasts for 1991
'are as follows:
LIGNITE AND ERIQJEITE RESOORCES lli EASTERN GERMANY
(.000 t)
RESOURCES:
- Pro:iuction - Ilnports
BR.IQURI"l'ES
RESOORCES:
- Production -, Supplies from
I Western Germ:my
1990
248 962
248 924 38
39 '('48
39 495
253
;,
1991
185 600
185 000 600
n.a.
n.a.
n.a.
Prcxiuction forecasts for eastern Germany for the errl of the de:::ade are 130
Mt roa..~.
As rega:rds lignite briquettes for the Conmrunity, available resources in
1991 are, estimate:i at 6.5 Mt, on a par with the figure for 1990; no
substantial variations are expectei in the consumption pattern either.
5. 2. Lignite deliveries
Deliveries to power stations will amount to aroun:l 174.5 Mt in 1991, which
is 4.5 Mt up on 1990. This increase isi.:due to the increases expected in
Greece ( 5 Mt) as a result of a new 400 MW generating unit being brought
into operation.
16

' : . .
I 'I ,l
'.
'e
Dell veries to briquetting plants are estllra.te:i at 17. 1 Mt, which is also
o. 8 Mt up on 1990, due to the increase expecte:i in Germany.
'. The follcrwi.ng table gives the results fo:r 1990 a.n1 forec.a.sts for 1001 for ~ ;'l
: 1igni te deliveries in eastern Germ9..IDJ. ! .
USE OF LIGNITE AND BRIG;PEl'l'ES m FASTERN GERHANY
USE:
USE:
- Briquettes ~ Power stations -Other
' -:- Iniustry . - D::lmestic use - Deliveries· to other
·EPSC countries* . , - Exports ·
: s.! a::KB cTa.bles 4 to 6 a.n1 17 to 19)
1990
248 932
101 341 103 894 40 727
38.748
12JM8 23 843
1 '373 1 588
1001
185 600
70 cx:o 85 coo 30 600
n.a.
n.a. n.a.
n.a . .n.a.
. The pro:iuction of coking coaJ. contimles to decline, vlith. 46.8 Mt being
f9re:::E.St for 1001 as against the 50.9 Mt reached in 1990. The reasons for
: tbis ,decline are gi ~-en in point 4. 2. 2.
The biggest variB.t..ions are forecast for Germany (-2.0 Mt) arrl Italy (-Q.7
· Mt) where a coking plant has been closerl down?
As regards coke deliveries, t}:l.e biggest rerluction is forecast in the steel
se:::rtor ( -2. 5 Mt) . Deli ve:ries to other seotors are expecte:i. to be much the
, ·same a5 in 199J; exhibiting a slight downvrard tren:i.
* Includes 1045 Kt sent to western Germany.
17

Intracarnrmm:i ty trade in coke is expected to remain relatively stable. In
term.s of imports they are estimated. at 3.7 Mt, similar to 1000, and. exports
at 3.3 Mt, 0.3 Mt down on 1000.
7. :r:MPCm'S OF HARD mAL m ROO-MEMBER OJCtNTRIES
(Tables 11 to 13)
Imports of bard coa.l contirru.e to rise. In 1990 they went beyorrl 110 Mt for
the first time to reach 115. 8 Mt an::1. everything points to a :new' record
bP...ing. reachoo in · 1991 , aroun::l 123. 2 Mt. Jitwhich is 7. 4 Mt up on last year Is
figure.
The biggest increases are expec:tei .in the Uni te:l K.:Lngdom ( +4. 1 Mt), Denmark
(+2.8 Mt) and France (+1.4 Mt). The rern3.:in:iJ:1g variations, whether up or
down, are not eA."PPOted. to excee:i 1 Mt.
Duri:ng the first months of the year imports into the United. Kingdom were
already 67% up on the figure for the same pericd last year. This increase
was p:lXtly a result of long term contracts concluded by National Power and
Power Gen in 1989 which are now begillrl:Ulg to come into operation.
It is also due to the pt1I'Chases mde by Power Gen on the Australian "spot"
market at the eni of 1000 an::1. delivered duri:ng e:LI'lier this year ani,
lastly. i.ncrea.$ei purcbases by British Steel of roth CQk:U)g coa.1 a.n:i steam
coa..l from abroad.
In Denmark, the increase in imports does not result from changes in
domestic derna.nd but from the greater dernan::l for elootrica.l. energy from a
united. Germany. The increase in France Is purcbases is a result of EDF Is
wish to increase power station stocks!\: as a safeguard against possible
.inc.idents.
18

As regards suppliers, the na1n increase has been in purcbr:J.SeS from the
Unitei ·States (+5.6 Mt) ani, to a lesser~ extent, Austra.lla. ani Colombia.
Purchases from Polan:i have dropped..
D.lring .the first months of the year the~· average irrlecative CIF price of
. coking coal in the Community's najor portb\ was arouni 63. 8 US$ /t as against
61.9 US$/t for :the same pericxi in 1000. Freight costs, arouni 7.8. US$/t,
have, scarcely riseli.
As regards the average CIF price of .steam coal for use in power plants, the
:iJ:J.fornation ava.1 1 ah1 e - as yet incomplete - for the first quarter of 1931
. points to a drop in price compared. to last year. The in:iica ti ve price 1.-:;
li ttle over 52 US$/tce.
COAL IMPORTS FROM THIRD COUNTRIES
1989 !
1990
1991 REV.
0% 25% 50% 75% 100%
-USA
0 POLAND
- S. AFRICA 0 AUSTRALIA- COLOMBIA
c=J URSS ~ CANADA IT~il OTHERS
7 .1. Coa.1 si tuatian in the Olmmunity' s In9.in suppliers
' As ~ega.rds the international coal market, ani in particular the situation
in those countries which supply large amounts of coal to the Cornmun.ity,
recent developments in the Uni te:i Sta. tes, the Soviet Union an::1 Polani are
worth not:ing.
19

In the Unitei States, there wa...c:; a surplus dur.ll)g the first months of this
y63.I'. · The S"t:abi'Da.tion of economic g-rowth bas affecte::l coal consumption in
the US, so that stocks have increasei considerably. In these
c:Lrcurostanoes, a mnnber of sma.ll pro::iucers with rela. ti vel y low costs may
have re:iuoe:l their pr<Xiuction levels an:i sold. at low prices.
In the Soviet Union, the poll tical si tua.~on ani the lal::xJur disputes in the
coal industry du:ri.ng t..'le first part of ·tb.e year le:i to a oerta.in drop in
exports. The country most affected by this was Japan, which imports a.roun:i
6 Mt, mainly coking coal, an:i, to offset this, had to increase its
purchases from other suppJ..iers ( Australia, ani, to a lesser ert,ent,
Ca.nada). This le:i to a re:iuction in the amount of coal avaiJahle a.rrl an
increase iJ.1 shipping costs in the Pacific an::l Irrlia.n oceans. However, it
does not look as j.£ supplies to the Corrtmlll1.tty for the year as a whole will
be affe::te::l.
r..astl y, in Pol.an:i, the Cornrmmi ty' s fifth supplier, all the signs point to a
substantial drop in exports. Pr<Xiuction is lower than last year ow:i.ng to
unreSt amongst tbe workers an:i the difficulty - sometimes irnpossibili ty -
of making new investments as a result of government restrictions. A number
of sources point to total exports of aroun:i 18-19 Mt for this yea:r as
against 28 Mt in 1990. In addition, firms' export e3XIlings have fallen as
a result of the 1ncrea.se in rail transport costs, taxes on exports (which
were abol1 shed in April) and the zloty/dolla.r exchange rate. For 1991
exports from Poland tO the Conum.mity a.re estirnate::l at 6.3 Mt, which is 1.2
, Mt .down on last year's figure. !
Although the cli.siUiet an:i uncertainty on the energy markets, in particular
the oil market, duxing the seconi h3J..f of 1990 and ani the first part of
this year as a result of the Gulf crisis has am te:i, the same cannot be
. said of economic prospects, which are less promi sing than in the pg.st,
a1:though the economic indica tors point to a rapid return of confidence on
the fi rnnci aJ narkets. Even so, GDP growth ( 1. !'Jt,) will be slightJ.y over
half the rate recorde.:l in 1990.
20

Energy d.ema.rrl. in terms of consumption is expectro to rise by a.roun:i 1 . m; in
1991. 1 In aJ::solute terms there wl-ll l::e increases for all types of fuel or
energy sources, with the p::>SS.i.ble exception of solid fuels which could drop
by a.rouni 1 . 3%.
As regards the hard. coa.l narket, Community proiuction will continue to
decJ 1 ne ( -9 9 Mt in 1990 ani -B. 5 Mt in , 1001) , owing to measures taken to
reorganize ani improve the competi ti v~ of the coa.l in:iustry in the . ~--:
.: Member States. Supplies are still relatively stable ani imports from non-. I . .
21
meo:iber countries continue .to rise in order to compensa.te for the cuth3cks ·
iri prcxiuction an:i h3J a nee clem:url.
A slight drop in total deliveries of bard coa.l is expecte:i in 1001 ( -1 . 0
Mt). Hawever, if deliv-eries do rerrai.n a.t levels s.imila.r to last yoor 's, it
· will be beca11se the inc:rease:i d.errani for hard coa.l from power sta. tions . bas
offset the re:luction in dema.ni from other se::;tors.
. 'lb.e greatest reduction. in dema.rrl has been from the steel in:iustry. Because
steel production is by ani large dec1.ining, ani owing to the introiuction
o~ tee~ such as the injection of coal in· blast furna.ces, which mean
that a. certain amount of expensive cok.ing cool can be replace:i by cheaper
~te:un coa.l, ooke deliveries are gradually fa.ll:i.ng ani, consequent! y, so are
dell veries of hard. coa.l to cok:l..ng plants.
Lignite, excluding the D£M Gernan provinces, exhibits a. slight u:pwa.rd
tren:i, ma.inl. y ow:1ng to the expansion of electricity genera. tion in Greece.
Imports of hard coa.l will again rise sigp.ificantl y ( +7. 4 Mt) . Much of the
increase in dem3..rrl will be met by the Uni ta:l Sta. tes.

.. HAP.D012 TABLE 1
HARD COAL BALAIKE SHEET FOR 1991
08--0ct-91 ( '000 TONNES)
~~~---------------------------------~-~------·········-~------------------------------·--~------····-··--------- ---··-··--·····.·····--------------------------·-··················1 1 1 BELGIQUE 1 DANMARK --DEUTSCH· 1 ESPAIIA 1 FRANCE 1 HELLAS I IRELAND JTALJA 1 LUXEM- I NEDER· I PORTUGAL 1 UNITED 1 EUR - 12 j l I I - LAND I I I I I BOURG I LAND I I KINGDOM I I I· ----· -· ~ ---------.- -------------· -1- ---------I· --· --· -· · ------· ---1- ---· ----· · ---· --· -· I· ----· --· · I· · · --· -· -- -· · · · · · · --I· ---------I· · ---· --· -1- · ----· · --I· -· -------.1- ------• ·- -I I 1. PROOUCTION (t:t) I 590 I 72550 I 19094 10200 I I 25 75 I I I 280 I 89500 I 192314 I I 2. RECOVERIES I 1200 I 1600 I 170 765 I I I I I I 500 I 4235 I
_I 3. ARRIVALS FROM ECSC COUNTRIES. I. 1585 I 97 700 I 600 14i5 I 573 721 I 42 650 I 170 I 500 I 7053 I I 4. IMPORTS FROM THIRD COUNTRIES •I 12350 I 12153 9500 I 9600 18700 I 1500 2760 19869 I 220 15700 I 3840 I 17000 I 123192 I I · ----· ---------- -----· -------·- ---·I· -------· -I· · · • --·. --- · · -· ------1- --· ---· · · · ---· -· · · · 1- · --· · --· · · -· · --· -· · · · · -· · ----1- ·· -· --· --- · · -· · -· · · · · · · · · · --· · I· · · · ·· · · · · -1- -------· --I I 5. AVAILASlllT!ES (1+2+3+4) - I 15725 I 12250 84350 I 29464 31030 I 1500 3358 20M5 I 262 16350 4290 I 107500 I 319741 I 1-------------------------~-------- 1---------- ---------- ----------1---------- ----------1---------- ---------- ----------1---------- ---------- ······----I-········· I·---------- I I 6. INTERNAL DEliVERIES (TOTAL) i 15030 12330 79600 I 29464 30600 I 1500 3320 20165 I 262 13950 4290 I 107500 I 318061 I I A. COLLIERY POIJER STATIONS I 90 1800 I 3500 I I I I 5390 I I B. PUBLIC POiiER STATIONS I 5705 11600 45600 I 21694 11300 I 2070 10000 I 9000 3165 I . 83500 I 203634 I I c. COKE OVEIIS I 6900 20450 I 4200 8500 795!3 I 3800 300 I 9500 I 61608 I I D. STEEL INDUSTRY I 650 2200 I 400 1500 100 280 101 600 I 220 *I . 6051 I I (OF WHICH POIJER STATIONS) I (·) (·) (·) I (-) 60 (-) (·) (·) (·) (·) (-) I (·) I 60 I 1 E. oTHER INDUSTRIEs 1 995 . soo noo f' 2630 3700 1400 sso 1412 160 .• 324 1 12eo *I 27151 1 I (OF WHICII POIJER STATIONS) I (·) . (-) 5000 I (·) (-) (·) (·) I (·) (-) (-) (-) I (-) I 5000 I I F. DOMESTIC SECiOR I 675 600 I 350 1600 700 1 I 1 I 4000 I 7927 I I G. MISCELLANEOUS (TOTAL) OF I 15 280 1250 I 190 500 515 550 I I 3000 I 6300 I I \.IHICII: 1. ISSUES TO I.'ORKERS I (·) (·) 100 I 95 20 (·) (·) (·) (·) (-) (-) I 600 I 815 I I 2. PATENT FUEL I 5 (·) 870 I (·) 370 (·) (·) (·) (-) (-) (·) I 1400 I 2645 I I 3. 0\JN CONSUMPTION I 10 (·) 80 I 95 100 (·) I (·.) (·) (-) (·) (-) I 100 I 385 I I 4. GASWORKS I (- ) (- ) . (- ) I (- ) (- ) (- ) I ( -) (- ) (- ) (- ) (. ) I (- ) I I I 5. RAILWAYS I (-) (-) 80 I (-) (-) . (-) I (-) (-) (-) (-) (-) I (-) I 80 I I 6. OTHERS- I (-) 280 120 I (-) 10 (-) I (·) 515 (-) 550 (·) I 1000 I 2475 I I· ------· -· · --------· ---· --~ -----· -I· -------· · --------· - -· · ~ ------1- -----· · · - · ----· · -· · ---- ~ -· · · · I · · · · · · -· -- --· --· ---- --· ------- ----· --· -· · · · · · -----I· -.-~ · -----I· -· ------· · I I 7. DEL! VERI ES TO ECSC I 695 50 * 3600 I 537 * I 20 2350 . I 700 I 7952 I I 8. EXPORTS TO NON MEMBER I * 150 I 103 * I I 600 I 853 I I COUNTRIES I I I I I I 1----·-·····-----------------·-····1··-------- ---------- ----------1------·--- ~-------··1----------1·--------- .......... ---------- ---------- ----------1----~-----1----------·1 I 9. TOTAL DELIVERIES (6+7+8) I 15725 121,30 83350 I 29464 31240 I 1500 I 3340 20165 262 16300 4290 I 108800 I 318914 I 1---------------------------------·1·------·-· -------···1----------l-·-·······1····-·····1··-------·1·········-l·········· ----------l----------1-------···1·-·-······l-····------1 I 10. MOVEMENTS OF PRODUCERS' AND I I I I I I I I I I I I I I IMPORTERS' STOCKS (5·9) I -.130 I 1000 a! ·1 ·160 I I 18 I 500 I I 50 I I ·1300 I 827 I
.1··----------------·······"··--------------·-- ------------------·--·-·------------------------------------------------------------------··············-···········---------·--····1 * C~nnission forecasts a : Including repurchases from the Nationale Kohlenreserve
I lU R..l

f.~.RD012 TABlE 2
HARD COAL BALANCE SHEET FOR 1990
19-Jul-91 ('000 TONHES)
·----··-·-------;········:············-············----------------- ----·-··-----------------------·-·················-·····················~---··············---------------,----1 u -- , BELGIQUE 1 DAHMARK 1 DEUTSCH- ESPANA , FRANCE , HELLAS , IRELAND , ITALIA , LUXEM· , HEDER- , PORTUGAL , UfllTED , EUR - 12 1
i I I . I LAND I I I I I BOURG I LAND I I K I NGDOH I I l·--- · · · ·------- ·------------------ I·-------- ·I·----·---- I·--····-- -: -- ·-·---··I-·------- ·I·----- ---·I··------- ·I·---·---- ·I·----·--- ·I·-··----- ·I··---···· ·I········· ·I···--·-·-· ·I i 1. PROOUCTIOH (t=t) I 1036 I I 76553 19312 I 10487 I I 35 I 60 I I 281 I 91031 I 198795 I ! 2. RECOVERIES I 1321 I I 2686 157 I 709 I I I I I I 3600 I 8473 I j 3. ARRIVALS FROM ECSC COUNTRIES I 1559 I 598 I 681 644 I . 2069 I I 573 I 1107 I 35 I 769 201 I 2043 I 10279 I ~ 4. IMPORTS FROM THIRD COUNTRIES 13201 I 9347 I 8638 9809 I 17321 I 1400 I 2765 I 19441 I 162 I 16366 4467 I 12900 I 115817 I ! ---- ·-- · --- ·--- · ·;- ·--- · · ·-------- --------··I·--------- I···-···-·- ·---·-····I--·--·--- ·I·---- ----·I·-------· ·I·-------- ·I·------· -· I··- --· · · · · · · ········I···--···- ·I·-·-···--· ·I ~ 5. AVAILABILITIES (1+2+3+4) 17117 9945 I 88558 29922 I 30586 I 1400 I 3373 I 20608 ! 197 I 17135 4949 I 109574 I 323085 I ;·······················-----·----- --------·- ---·-·-···!········.·· -------·--1----------l··--------l··--------l---------- ----------1··-------- ------·-··1··········1·········-·1 f 6. INTERNAL DELIVERIES (TOTAL) 16000 9990 I 80746 30220 I 28421 I 1400 I 3290 I 21237 197 i 14045 4950 I 103300 I 318796 I
A. COLLIERY PO\IER STATIONS 119 I 1970 3707 I I I I I I 5796 I B. PUSLIC PO\IER STATIONS 6515 9122 I 44463 22540 7210 I I 2010 I 10615 I 8715 3763 I 82100 I 197053 I c. COKE OVENS 7132 I 22541 4174 9495 I I I 8629 I 3870 377 I 10800 I 67018 I D. STEEL INDUSTRY 513 I 1874 326 1807 I 100 I 151 39 I 670 I 220 ~I 5700 I
(OF IJHICH PO\IER STATIONS) (·) (·) I 12 I (·) 69 I (-) I (-) (·) (·) I (·) (·) I (·) I 81 I l E. ~JHER INDUSTRIES 995 531 1 7601 1 }.~26 4017 1 noo 1 550 1401 158 1 200 809 1 nso ~1 27468 1
(OF IJHICH PO\IER STATIONS). (·) (·) I 5037 I ·:.:..(·) (·)''I (·) I (·) (·) (·) I (·) (·) .::1· (·) I ::-,.5037 I F. DO!-\EST IC SECTOR 704 I 639 I 384 1656 I I 730 1 I 1 I 4500 I 8615 I G. MISCELLANEOUS (TOTAL) OF 22 337 I 1658 I 170 529 I I 441 I 590 I 3400 I 7147 I
1/H I CH : 1. ISSUES TO IJORKERS 2 (-) I 117 I 80 34 I (.) I (.) (.) (.) I (-) (-) I 600 I 833 I 2. PATENT FUEL 5 (·) I 768 I (·) 383 I (·) I (·) (·) (·) I (·) (·.) I 1500 I 2656 I 3. 0\IN CONSUMPTION 15 (·) I 97 I 90 I 102 I {·) I (·) (·) (·) I (·) (·) I 100 I 404 I 4. GASIJORKS (.) (-) I 91 I (-) I {-) I (- ) I (-) (-) (.) I (.) {-) I (-) I 91 I 5. RAILIIAYS (·) (·) I 182 I (·) I (·) I (·) I (·) (·) (·) I (·) I (·) I (·) I 182 I
l 6. OTHERS (·) 337 I 403 I (·) I 10 I (·) I (·) 441 (·) I 590 I (·) I 1200 I 2981 I i· · ·- ·-- ·- ·- · ·--- · · · ·- ·- · · · · · ·- · · · · i · · · ·- · · · ·- · · ·--··--·I·-------- ·I·--······ ·I···-··-·· ·I····-·-·- ·I·-·-··---- ·- ······-·I·-------- -I------·-· ·I·······-- ·I·-----··· ·I··--·-·.·--· ·I i 7. DELIVERIES TO ECSC I 723 54 ., 4900 I I 483 ~I I 25 I I 2363 I I 1555 I 10103 I ! 8. EXPORTS TO NON HEM9£R I I ., 9l. I I 133 ., I I I I 146 I I 700 I 1073 I
COUHTR I ES I I I I I I I I I I I. I I I ! ··----- ----------·-------------···I·--·---·- ·1·-- ·- ··- --1-- ·· · ·-- --1----------1----------1--------- ·I·----··· --1- ·-·-----·I······--· ·I···-·-··- ·I--·------ -1----------1-----------1 I 9. TOTAL DELIVERIES (6+7+8) I 16723 I 10044 I 86006 I 30220 I 29037 I 1400 I 3315 I 21237 I 197 I 16554 I 4950 I 11055~ I 319869 I 1------- ......................... -·I··------ --1----------1----------1-------- --1-------·--1-- ···-----I··----- --·1- · ·-- ·- ···1----- ----·I--------- -1---- --·-- ·1----------1-·······-··1 I 10. HOVEHENTS OF PROOUCERS' AND I I I I I I I I I I I I I I ! IHPORTERS' STOCKS <5·9> I 394 I -99 I 2552 aj ·298 I 1549 I I 58 I ·629 I I 581 I ·1 I ·981 I 3216 I !··········-·················-------------------------··-----------·-·-····························-······················----------------------------··················------·--·-1
• Commission Forecasts a : Including repurchases from the Nationale Kohl_enreserve ~ CIJ

2'ZHARO TABLE-3 HARD COAL BALANCE SHEET FOR 1990
MARKET REPORT • MARCH 1991
T8·Jul·91- : ('000 TOHHES)
f································-----··································----·······································~·-·····---~·-·······: ....................................•.... 1
BELGIQUE I DANMARK I DEUTSCH· I ESPANA I FRANCE I HELLAS I IRELAND I ITALIA I LUXEM· I HEDER· I PORTUGAL I UHITED I _EUR • 12 I I I LAND I I I I I I BOURG I LAHD I I K I HGDOM I I
t' • • • • -• --• • • • • • • • • • • • • • --- • • • • • • • • - ---------• I · · · ---· · · · I· · · · · ---· · I· · · · · --·. · ~ I· · · · · · · · · · I· · --· · · · · · I · · ·- ----· · · I· · · · .. , · · · · I · --· -· · · · · I· · · · · · · -· · I --· · · · · · · · I : · · · · --· · -I· --· · · · · -· I ~ 1. PRODUCTION (t=t) 1025 I 0 I 76553 I 18?32 I 10800 I 0 35 0 I 0 I 0 I 280 I 92300 I 199925 I
2. RECOVERIES 1350 I 0 I 2687 bl 146 I 650 I 0 0 0 I 0 I 0 I 0 I 3000 I 7833 I 3. A:lRIVALS FROM ECSC COUNT'<!ES 1645 I 650 I 681 I 620 I 1700 I 0 573 901 I 1.3 I 1000 I 196 I 500 I 8_509 I 1.. IMPORTS FROM THIRD COUNl~IES 1211.5 I 9050 I 8638 I 9648 J 14950 I 1300 2765 20317 I 155 I 11.600 I 43T5 I 14500 I 112443 I
····-----···········--·----------- ----------1··········1··········1··----····1··········1·········· ----······ ··········1··········1··········1··········1·--·······1··.······--1· 5. AVAiLABILITIES (1•2•3•4) 16165 I 9700 I 88559 I 29346 I 28100 I 1300 3373 21218 I 198 I 15600 I 1.851 110300 I 320201 I
------· -· · · · · ----· · · · -· · · · -· · ----- -· · · · · · -· - I --· ·· · · · · · -I· ----· · · · · ----· · · · · · I · · · · · ._ ----I · · · -· · · · · · ----· · · · · · · · · -------I · · --· · · · · · I· · · · · -----I· · · · · · · · · · · · · · · · · ~ · · 1·- • • • • • • • • • I 6. I!ITERNAL DELIVERIES (TOTAL) 15555 I 9100 I 80655 291,94 I 25980 I 1300 3290 21444 I 198 I 12750 I 4851 108400 I 313017 I
A. COLLIERY PO'w'ER STATIONS 110 I 0 I 1835 0 I 3700 I 0 0 0 I 0 I 0 I 0 0 I 5645 I B. PUBLIC -PO'w'ER STATIONS 5860 I 8200 I 44598 22367 I 6600 I 0 2010 10217 I 0 I 7800 I 3642 82000 I 193294 ! c. COKE OVENS 7200 I 0 I 2254, 4048 I 8300 I 0 0 8783 I 0 I 4000 I 0 11000 I 65872 I D. STEEL INDUSTRY 500 I 0 I 1874 330 I 1500 I 80 0 151 I 37 I 600 I 377 220 *I 5669 I
(OF IJHICH PO'w'ER STATIONS) (·) I (·) .1 12 (·) I 50 I (·) (·) (·) I (·) I (·) I (·) (·) I 62 I E. OTHER !HOUSTRIES 1255 I 500 I 7601 2185 3700 I 1220 550 1223 I 160 ! 200 I 830 7280 .. 1 26704 I
(OF IJHICH PO'w'ER STATIONS) 6') I" (·) 1·- 5037 (-) (·) I (·) (·) (·) (·) I <.·> I (·) (·). I 5037 I F. DOMESTIC SECTOR 605 I 0 I 63? 394 ·1500 I 0 730 0 1 1- ---0 I 0 4500 I 8369 I G. HISCELLMIEOUS (TOTAL) OF 25 I 400 I 1567 170 680 I 0 0 1070 0 I 150 I 2 3400 I 7464 I
IJHICH : 1. ISSUES TO IJORKERS (·) I (·) I 117 80 20 I (-) (·) (·) (·) I (·) I (·) 800 I 1017 I 2. PATENT FUEL s 1 <-> 1 768 <·> soo 1 <·> <·> , <·> <·> 1 <·> 1 <·> 1soo 1 zn3 1 3. 0\J~ COHSUMPT I OH 20 I (.) I 97 90 160 I (-) (.) I (.) (.) I (.) I (.) 100 I . 467 I 4 • GA S\JOR KS ( • ) I ( . ) I ( . ) ( . ) I ( . ) ( -) I ( . ) ( . ) I ( . ) I ( . ) ( . ) I 0 I 5. RAIL\IAYS I (·) I (·) I 91 (·) (·) I (·) I (·) I (·) (·) I (·) I (·) (·) I 91 I 6. OTHERS I (·) I 400 I 494 (·) (·) I (-) I (·) I 1070 (·) I 150 I 2 1000 I 3116 I
i - ~- · · · · · .... -·--- --.... · · · · · ------ I· · · · · · · · · -I· --.. · · · · · I· --- --· · · -1- -----· · · · .. · .. -.... I· -· · ...... I· · ----· -· · I· · · .... · · · · ·· · -- --- · · 1-- .. · · · · .. I·· .... · · · · 1· · .. · .. ···I--· .... · --I I 7. DEliVERIES TO ECSC I 605 I 20 .. 1 4900 I 0 520 *I 0 I 25 I 0 0 I 2800 I 0 I 1600 I 10470 I 1 8. EXPORTS TO NOH MEMBER I 5 I 80 *I 360 cl 0 100 *I I I 0 0 I 50 I 0 I 1000 1 1595 1
CCIJII TRIEs I I I I I I I I I I I I I l·····················~---·········1······~···1··········1··········1··········1····-·····1··········1···------- 1-~---····· .......... 1--··-·····1··········1··········1··········1 I 9. TOTAL DELIVERIES (6+7+8) I 16165 ! 9200 I 85915 I 29494 I 26600 I 1300 I 3315 I 21444 198 I 15600 I 4851 I 111000 I 314612 I !·········----····················· 1··-------· 1··········1·······---1··········1·····--···1··········1···---···· I·········· ·········· 1··········1··········1··········1··-·······i I 10. MOVEMENTS OF PROOUCERS' AHD I I I I I . I I I . I I I I I I IMPORTERS' STOCKS (5·9) I 0 I 500 I 2644 a! -148 I 1500 I 0 I 58 I ·226 0 I 0 I 0 I ·700 1 5589 1 I·--- ............... ---........ ------- ........ --·- -....... ----- ........ ---............ -.. --- ---. -.... " ... -. ---... -........ -. . ......... ------. -... -...... ; ........................ ·I
• Commission Forecasts a : Including repurchases from the Hationole Kohlenreservc bOther supplies included c 266 T delivered to former GDR ' ~ .c

COK~012 iABLE 4
COKE . BALANCE SHEET FOR 1991
08·0ct·91 ( 1000 TONUES)
1·····--·--··----····:····:·····--- ··············-------------------······---------------··································································-··············-------1 I BELGIQUE I DANMARK I DEUTSCH· I ESPANA "T FRANCE I HELLAS I IRELAND I ITALIA I LUXEM· HEDER- I PORTUGAL I UNITED I EUR • 12 I I I I LAND I I I I I I BOURG LAND I I KINGDOM I I 1·--····-····--- --------··········· .......... ··········1··········1··········1··-----·-·1··········1··········1··········1·········· ---------·1··········1··········1··-------·1 I 1- PRODUCTION 5240 I 15900 I 3400 I 6500 I I I 5703 I 2800 I 230 I 7000 I 46773 I I I I I I I I I I I I I I 2. RECEIPTS FROM ECSC COJNTRIES 360 35 I 400 I 45 I 1160 I 10 I 5 I 90 I 1281 200 I 13 I 100 I 3699 I I I I I I I I I I I I I I 3. IMPORTS FROM THIRD COJNTRIES 440 I 200 I 50 I 130 I 20 I 5 I 110 I 88 100 I I 100 I 1243 I 1---------------------------------- -----····· ---······· 1---------- l··········l··········l·---------1···------- 1---------- 1·------··· ······-·-·1···-······1··········1··········1 I 4. AVAILABILITIES (1+2+3) 6040 35 I 16500 I 3495 I 7790 I 30 I 10 I 5903 I 1369 3100 I 243 I 7200 I 48016 I 1··········-------·-··············· ·--------~ ----------1·--------- I·········· I·········· I·········· I·········· I·---·----- 1---------- ----------1····-·····1··········1·······-··1 I 5. INLAND DELIVERIES (TOTAL) I 5140 35 I 15300 I 3495 I 7180 I 30 I 10 5726 I 1369 2300 I . 242 I 7000 47827 I I A. STEEL INDUSTRY I 4955 13600 I 3200 I 6250 I 20 I 8 5110 I 1368 2000 I 222 I 6100 42833 I 1 a. OTHER INDUSTRIEs 1 160 1 30 eoo 1 295 1 650 1 10 1 2 1 100 1 zo 1 zoo 2267 1 I c. DOMESTIC SECTOR. I 10 I 300 I I 120 I I I 1 I I 500 931 I I D. HISCELL,t,NEOUS OF \.IHICH : I 15 I 5 600 I I 160 I I 616 I 200 I I 200 1796 I I - ISSU.ES_,.TO ~RKERS I 10 I (·) 330 I (·) .;:f'· (·) I .! (·) I (·) (·) I (·) (·) I (·) I .:-c;;-) 340 .,.
I - O'WN CONSUMPTION I (·) I (·) 5 I (·) I (·) I (·) I (·) (·) I (·) (·) I (·) I (•) 5
I . OTHERS I 5 I 5 265 I {·) I 160 I {·) I (·) 616 I (·) I 200 I (·) I 200 1451
I·····················-············ I·········· I·········· ----------I·········· I·········· I·········· I·········· ···-·-····I·········· I·········· I·········· I··-------- ---······· I 6. DELIVERIES TO ECSC COJNTRIES I 820 I 1400 I I 189 I I 49 I I 750 I 2 I 100 3310
I 7. EXPORTS TO THIRD COUtHRIES I 80 I 150 I I 36 I I 97 I I I 9 I 100 472
1···························--·-··· 1----------1---------- ----------I·········· I·········· I·········· I·········· ---------- 1··········1··········1··········1···------· ·········· I 8. TOTAL DELIVERIES (5+6+7) I 6040 I 35 16850 I 3495 I 7405 I 30 I 10 5872 I 1369 I 3050 I 253 I 7200 48299
I·································· I·········· 1··········1··········1··········1··········1··········1··········1··········1·--·······1··········1··········1··········1·······---1 9. STOCK MOVEMEIIT AT PRCOUCTION I I I I I i I I I I I I I I AND IMPORTS (4·8) I I I ·350 I I 385 I I I 31 I I 50 I -10 I I ·283
1··-----·---~----------·-·············-~--------~----------·-·····--------·-------------------------······················································-------------------·--·-
, Sl.J c.ll
'

COKE012 --- TABLE 5
COKE BALANCE SHEET FOR 1990
19·Jul·91 ('000 TONNES) I· ... -- -.. ---.... -. ----.. --. --_ -... -.... --_- ----.... ------ -...... ---. --.. -. --. --.. -.... -.......... -.. --.- .......... ----.... : ..... -... -.. -.. -------................... -............ -·I I I BELGIQUE I DANMARK I DEUTSCH· I ESPMIA -, FRANCE I HELLAS I IRELAtiO I ITALIA I LUXEM- I liEDER· I PORTUGAL I UNITED I EUR • 12 I I 1- I I - LAND I I I - -- I I I BOURG I LAND I I K I NGDOH I I 1-- · · · ·------------------ · · ····---·I··-·-·--- ·I··:--···· ·I···----·· ·I·····---· ·I········· ·I··--····· ·I····--··· ·I······--- -I-----·-·- ·I········· ·I·------.-- ·I·--······ ·I······-_-· ·I I 1. PROOUCT ION I - 5420 I I 17853 I 3404 - I - 7198 I I I 6356 I I 2T36 I 230 I 7700 I 50897 I I I I I I I I I I I I I I I I I 2. RECEIPTS FROM ECSC COUNTRIES I 367 I 32 I 367 I 45 .I 967 I 10 I 7 I 85 I 1329 I 224 I 13 I 200 I 3646 I I - I _ I I I_ I I I I I I I. I I 3. IMPORTS FROM THI~D COUNTRIES 453 I 4 I 222 - I 130 I 11.2 I 20 I 4 I _30 I 118 I 136 I 100 I .1359 I 1···--·· --.:.···················- -- ...... -~ -- --1--~ .. -----1····---. ··1······'···1··-------·-1·· ....... -1-------···1---. -- ·--- i ........ --1----··---- ......... ·1----······1--········1 I 4. AVAILABILITIES (1+2+3) 6240 I 36 I 18442 I 3579 I 8307 I 30 I 11 I 6471 I 1447 I 3096 243 I . 8000 I 52256 I 1·----·········----------·········- ---------· -------·--l--------··l····----··l--·---····l··--·--···1··--------l··········l··········l·····----- ··········1-----·----1········--1 I 5. INLMID DELIVERIES (TOTAL) 5336 40 I 15972 I 3587 I 7663 I 30 I 11 I 6413 I 11.47 I 2260 235 I 7600 I 50594 I I A. STEEL INDUSTRY 5161 -I 14158 I 3112 I 6658 I 20 I 7 I 5888 I 1447 I 1960 211 I 6700 I 45322 I I B. OTHER INDUSTRIES 11.8 37 I 856 I 475 I 669 I 10 I 4 I I I 100 24 I 200 I 2523 I I c. Da-IESTIC SECTOR 11 ! 286 I I 148 I I I I 0 I I 500 I 945 I I D. MISCELLANEOJS OF IJIIICH : 16 3. I 672 I I 188 I I I 525 I I 200 I 200 I 1804 I I -ISSUES TO \.'ORKERS -. 9 (·) I 361 I (·) I (·) I (·) I (·) I (·) I (·) I (·) (·) I (·) I 370 I I . CNH CON SUMP T I ON - .. - ( • ) ( • ) I 6 I ( -) I ( -) I ( -) I ( -) I -. ( . ) I ' ( -) I ( -) ( . ) I ( . ) I 6 I I . OTHERS. 7 3 I 305 I (·) I 188 I (·) I (·) I 525 I (·) I 200 (•)' I 200 I 1428 I 1··----·--···-········--·---········ -------··· ········--1··········1··········1·------···1··········1··········1··········1··········1·········· ··········1·--·----·-1··········1 I 6. DELIVERIES TO ECSC COUNTRIES I 831 I 1628 I I 254 I I I 52 I I 7T3 2 I 91 I 3631 I I 7. EXPORTS TO THIRD CCONTRIES I 81. I 225 I I 132 I I I 149 I I 13 9 I 209 I 821 I I· · · ·- · -- · --- --· · · · · · · · · -_- ·-- · · -· · · I · · · ----- -- · -· · · · · · -·I···· · · · -· ·I·-- -· · · · · · I·-···-· --· I·· · · · · · · · · I· --- · · -- · · I· · -· · · · · ~·I· · · · · · ---· ! -- -· · ·-- · ·I· · · · · · · · · ·I·- ········I··--··---- I I 8. TOTAL DELIVERIES (5+6+7) I 6251 I 40 I 17894 I 3587 I 8049 I 30 I 11 I 6614 I 1447 I 3046 I 246 I 7900 I - 51415 I 1--·------------------------ ... ----1- ·-- · · · ·- ·1·------ ---1·-·------ ·1··········1--········1·---------1--· · · .. ·--1-·------- ·I·------ --·1·-- -------1------- ---1······----1-·········1 I 9. STOCK MOVEMENT AT PROOUCTION I I I I I I I I I I I I I I I AND IMPORTS (4·8) I ·11 I ·4 I 548 I ·8 I 258 I I I -143 I I 50 I -3 I 100 I 841 I 1···········----·······················----------····-······························--·--·--···········-----·----························-·-----···············.···········-----·-·l
' ,IU c----.
I

24COKE ·TABLE 6 : COKE BALANCE SHEET fOR 1990
HARKE T REPORT • MARCH 1991
__ 08·Jul·91 ( '000 TONHES)
1·································-·····························-···············-·································································································1 I I BELGIQUE I DAHMARK I DEUTSCH· I ESPAHA I fRAHCE I HELLAS I lRElAHD I ITALIA I LUXEM· I NEDER· I PORTUGAL UNITED I EUR • 12 I I I I I LAND I I I I I I BOURG I - LAHD I K I HGCCH I . I 1· · · · · · ·-- · · · · · · · · · · · · · · · · · · · · · · · · · I···- · · · · · · I·····--··· I·········· I·········· I·········· I······ ····I·········· I·········· I·········· I·········· I·········· · · · · · · · · · · · · ········I 1 1. PROOUCT ION 1 5450 I 0 I 17852 a I 3428 I 6600 I 0 I 0 I 6356 I 0 I 2900 I 260 8000 50846 1
1 I I I I I I I I I I I I "I 2. RECEIPTS FROM ECSC COONTRIES I 415 I 20 I 367 I 45 I 1015 I 10 I 7 I I 1319 I 300 I 12 100 3610 I 1 I I I I I I I I I I I I I 3. IMPORTS FROM THIRD COOHTRIES I 485 I 15 I 222 I 63 I 155 I 20 I 4 I 43 I 132 I 100 I 0 100 1339 I 1··································1··········1··········1··········1··········1··········1··········1··········1··········1··········1··········1·········· ····················I I '· AVAILABiliTIES (1+2+3) "I 6350 I 35 18441 I 3536 I 7770 I 30 I 11 I 6399 I 1451 I 3300 I 272 8200 52185 I 1·- · · · · · · · · · · · · · · · · · · · · · · · · · · · · · · · · 1- · · · · · · · · · I······-··- · · · · · · · · · · I·········· I· · · · · · · · · · I···· · · · · · · 1· · · · · · · · · · · · · · · · · · · · I·········· I···· · · · · · · I· · · · · · · · · · · · · · · · · · · · · · ········I I 5. IHLAND DEliVERIES (TOTAL) I 5450 I 35 15950 I 3521 I 7740 I 30 I 11 6407 I 1451 I 2500 272 I 7900 51267 I I A. STEEL IIIDUSTRY I 5265 I 14158 I 3165 I 6900 I 20 I 7 5900 I 1450 I 2200 260 7000 46325 I
"I B. OTHER I~DUSTRIES 145 I 30 856 I 356 I 680 I 10 I 4 I I 100 1i 200 2392 I I c. OOOESTIC SECTOR 10 286 I I 30 I I I 1 I 500 I 827 I I 0. MISCEllANEOUS Of \.IHICH : 30 5 650 I 0 I 130 I 0 I 0 507 I 0 I 200 1 200 I 1723 I I . ISSU~J TO \.'ORKERS 10 (·) 361 I (·) I 130 I (·) I (·) (·) I {·) I (·) (·) (·) I 501 I I • 0\./!l'COIISUI'Ii'TIOH ·" (•) {•) 6 I (•) I (·) .I :__,;~ (·) I (·_)r (•) I (•) I (•) (•) (•) I 6 I I . OTHERS 20 5 283 I (·) I (·) I (•) I (·) 507 I (·) I 200 1 200 I 1216:.:~-1
1· · · · · · · · · · · · · · · · · · · · · · · · · · · · · · · · · · · -- · · · · ·- · · · · · · · · · · · -· · · · · · · · · I·· · · · · · · · · I···-······ I····· · · · · · I· · · · · · ·- · · · · · ·- · · · · · I·· · · · · · · · · I···· · · · · · · -· · · · · · · · · · · ········I········· ·I I 6. DELIVERIES TO ECSC WJHTRIES 825 0 1628 I I 140 I 0 I 0 52 I I 750 100 I 3495 I I 7. EXPORTS TO THIRD COOIHRIES 75 0 294 bl I 140 I 0 I 0 149 I I so 100 I 808 I 1·- · · · · · · · · · · · · · · · · · · · · · · · · · · · · · · · · · · · · · · · · · · · · -· · · · · · · · · · · · · · · · · 1- · · · · · · · · · I·.-········ I···· · · · · · · I·········· · · · · · · · · · · I····· · · · · · 1· · · · · · · · · · · · · · · · · · · · · · ········I········· ·I I 8. TOTAL DELIVERIES (5+6+7) 6350 35 17872 I 3521 I 8020 I 30 I 11 6608 I 1451 I 3300 272 8100 I 52075 I 1· · · · · · · · · · · · · · · · · · · · · · · · · · · · · · · ·- - · · · · · · · · · · · · · · · · · · · · · · · · · · · · · · I··· · · · · · · · I····· · · · · · I·········· I········ · · · · · · · · · · · · I···· · · · · · · 1· · · · · · · · · · I·· · · · · · · · · · · · · · · · · · · I········· ·I I 9. STOCK MOVEMENT AT PROOUCT lOti I I I I I I I I I I AHD IMPORTS (4·6) 0 0 I 569 I 15 I ·250 I 0 I 0 ·209 I 0 I 0 I 0 100 l 110 I I·· · · · · · · · · · · ·- · ·- · · · · · · · · · · · · · · · · · · -· -· · · · · · · · · · --· · · · · · · · · · · · · · · · · · · · · · · · · · · · · · · . -· · · · · · · · · · · · · · · · · · · · .. · · · · · · · · · · · · · · · · · · · · · · · · · · · · · · · · · · · · · · · · · · · · · · · · · · · · · · · · · · · · ········I
a : other supplies (272 I) included b 69 I delivered to former CDR includ~
I )\.)
....:::}
I

!
CXJ rJ
Ll GN012 TABLE 7
LIGNITE AND PEAT BALANCE SHEET FOR 1991
08-0ct-91
1-- ............................ ~ ................ -... ---. ---------.- . -. -- -·.------------------ .. --.-.----- . -- .. -.. --. --. -. ----- -... -.. . . ------ -. -- .. --- .......... --- -~- ........ -•. ·I I I BELGIQUE I DANMARK I DEUTSCH- I ESPANA I FRANCE I HELLAS I IRELAND I ITALIA I LUXEM- NEDER- I PORTUGAL I UNITED I EUR - 12 I I I I I LAND I I I I I I BOURG LAND I I KINGDOM I I 1·····--········--····--··········- I·········· I··-·----·- 1----·-··-- 1--··--·-·-1----------1-------···1-----·-"-· 1·------·--1---------· --------··1---------- 1----~----·1····-····-1 I A. RA~ PRODUCT I I I I i I I I I I I I I I - AVAILABILITIES : I I I 295825 I 16000 I 2350 I 60000 I 8000 I 1525 I I I I 383700 I I PRODUCT ION I I I 293225 u I 16000 I . 2300 I 60000 I 8000 I 1500 I I I I 381025 I I IMPORTS I I I 2600 I I 50 I I I 25 I I I I 2675 -1 I I I I I I I I I I I I I I I . UTILIZATION : I I I 295825 I 16000 ! 2280 I 60000 I 7015 I 1525 I I I I 382645 I I BRIOUETTING PLANTS I I I 85410 bl I I 400 I 1300 I I I I I 67110 I I PO'o.'ER STATIONS I I I 178365 cl 16000 I 2000 I 58100 I 3500 I 1500 I I I I 259465 I I OTHERS I I I 32050 dl I 280 I 1500 I 2215 I 25 I I I I 36070 . I I I I I I I I I I I I I I I I B. BRIQUETTES I I I I I I I I I I I . I I 1 - AVAILABILITIES : 1 325 1 7 1 s:m 1 400 · ! so 1 150 1 40 1 100 1 15 1 1 1 6462 1 1 PRooucr1oN 1 1 r s32s ;<·. 1 1 15o 1 1 1 -1 ·~::: 1 s47s ! I ARRIVAL FROM ECSC COUNTRIES I 315 I 7 I 400 I 50 I I 40 I 100 I 15 I I I I 927 I I IMPORTS FROM NON-MEMBER I I I I I I I I I I I I I COUNTRIES 10 I I I I I I . I I I I 10 I I I I I I I I I I I I I I -UTILIZATION: 325 I I 5375 400 I 50 I I 40 I 100 I 15 -1 I I 6305-l
I PO'o.'ER STATIONS I I 650 400 I I I I 100 I I I I 1150 I I INDUSTRY 275 I I 2515 I I I I I 3 I I I . 2793 I I DOMESTIc 50 I . I 1300 I 50 I I 40 I I 12 I I I 14 52 I I SHIPMENTS TO OTHER ECSC I I I I I I I I I I _-. I I COUNTRIES I I -- 750 I I I I I . I I I 750 I I EXPORTSTONOfl-MEMBER I I I< I I I I I I I I I COUNTRIES I I 160 I I I I I I I I 160 I I I I I I I I I I I I I 1- · · -.- --· .· -· ---· -· -· ---· · -· · · · · · · · · · · · -· · · · · · I· · · · · · ---· I· -· · · · -· · · -- -- · · · -· · 1-- · · · -- · · ·I· · · · -· · ---I· · · · · · -- -· I· --------· I· · · · -· · · · - --· -· --· --I· · --· -· ---I· --·_- · · · -.·I· -·- ----· -· I
a: including_185 miot from OOR b: including 70 miot from DDR c: including 85 miot from ODR d: including 30.6 miot fr~" DDR

I !J ('\!
I
LIGN012 TABLE 8
LIGNITE AND PEAT BALANCE SHEET FOR 1990
17-0ct-91 ( •000 TOHNES)
1····················-------------- -----···········································-·-------------------------------------------------------------------------·-·················1 I BELGIQUE I DANMARK I DEUTSCH· I ESPANA I FRANCE I HELLAS I IRELAND I ITALIA I LUXEM- I HEDER- PORTUGAL I UN JTED I EUR • 12 I I I I LAND I I I I BOURG I LAND I KINGDOM I (") I 1·················----------------- ---------·1··········1··········1··········1··········1········--·---------- ----------1········-- ---------- ---------·1········-·1··········1 1 A. RA\J PRODUCT I I I I I I I I I I - AVAILABILITIES : 0 I 0 I 358563 I 16446 I 2404 I 55500 7623 1528 1 o o o 1 o 1 442064 1
I PRODUCTION I 0 I 356513 al 16446 I 2336 I 55500 7623 15oo 1 o o 1 o 1 439918 1
I IMPORTS I 0 I 2050 I 0 I 68 I 0 0 28 1 o o 1 o 1 2146 1 I I I I I I I I I - UTILIZATION : 0 I 0 I 358563 I 16605 I 2167 55000 69ao 1528 1 o o o 1 o 1 440843 1 I BRIQUETTING PLA!HS I 0 I 115943 bl I I PO\/ER STATIONS I 0 I 200337 cl 16605 I I OTHERS I I I 42283 dl 0 I I I I I I I B. BRIQUETTES I I I I I .... _,AVAILABILITIES : 324 I 7 I 44728 I - 331 I I PRODUCTION 0 I 0 I 44698 cl··· 0 I I ARRIVAL FROM ECSC COUNTRIES 315 I 6 I I 331 I I IMPORTS FROM NON-MEMBER I I COUNTRIES 9 I I I I - UTILIZATION : 324 I 0
I PO\/ER STATIONS 0 I I I t!::>USTRY 277 I I DOMESTIC 47 I I SHIPMENTS TO OTHER ECSC I I COUNTRIES 0 I I EXPORTS TO HON·MEMBER I I COUNTRIES 0 I I I I
30
44728
703
16189
25082 g
1038
1716
0
303
303
0
1···············-------············1··········1··----·····----------·-·········
0
1861
306
67 . ·a
63
4
67
0
0
67
400 53100
1500
13oo 1 o o 1 o 1 117643 1
35oo 15oo 1 o o 1 o 1 276903 1 218o 28 1 1 1 46297 1
I I I I ;;; I I I ! I I
15o 1 3o 1oo 1 19.8 o o 1 o 1 45i56.a 1
1so 1 o o 1 o o 1 · ·o 1 o ·l'' 44848 1 o 1 3o 1oo 1 19.8 1 1 864.8 1
I I I I I o 1 o o 1 o o o 1 o 1 44 1
I I I I I o 1 3o 1oo 1 19.8 o o 1 o 1 _45s7J.s 1
o 1 o 1 oo 1 o o 1 1 11 o6 1 o 1 o 1 9 o ! 1 16475 1
o 1 3o 1 1o.8 1 1 25236.8 1 I I I I .;' I
o 1 o 1 o 1 1 1 o3s 1
I I I I - I 1 o 1 o 1 1 1716 1
I I I I I I '. I _ ··-·-·····1··········1·········· ------·-··1··········1··-------- ··········1·····-····1···---··-·1
a: including 248924 kt from DDR b: inclt!ding 101341 kt from DDR
e: including 39495 kt from DDR f: including 12946 kt from DDR
c: including 106894 kt from DDR
g: incltlding 23843 kt frcim DDR
d: including 40727 kt from DOR

2!:LI GN TABLE 9 : LIGNITE AHO PEAT BALANCE SHEET FOR 1990
MARKET REPORT • MARCH 1991 08·Jul·91 (iOOO TOtltiES)
r •••••••••...•••••••••••••••••.•••••.••..•••..•••••••••••••.••• ; ..•.. :' ••••••••••••••••••••• -••• ~ •••• -••••••••••••••••••••••••••••••••••••••••••••••••• ·• -~ ••••••••••••••••••• •. ~ •••. ·I . I BELGIQUE I DANHARI( I DEUTSCH· I ESPANA I FRMICE I HELLAS I IRELAN(: I I TALl A I LUXEH· !!.~OER· I PORTUGAL I UNI iED I EU~ • 12 I . - - I I I LAND I I I .I I I BOURG LAND I I K 1 h'GOOH I (.) I 1·- · · · · · · · · · · · · · · · · · · · · · · · · · · · · · · · · 1 · · · · · · · · · · 1· · · · · · · · · · I··· · · · · · · · I···· · · · · · · I· · ········.I·· · · · · · · · · ·. · · · ······I·········· I··_···.-.··· · · · · · · · · · · I·········· I········· ·I········· ·J I A. ~AIJ PROOUC T I - I I I I I I I I I I ' I I . AVAILABILITIES : I I I . .35331-3 I 15411 ·I 2280 I 55500 7623 I 1600 I I ~ I .; I 435727 I
PROOUCTION I I I _3533-Wal 15411 I 2200 I 55500 ·?623 I 1600 I I 1 435M7 1 I M?OR T s I I - I I I 80 I I I ! I 80 I
• UTILIZAiiOH
BRIOU£TiiHG PLANTS
POVER STAT IOHS
OiHERS
5 , 9 R I OUE TT E S
• AVAILABiLITIES
PROOiJCT ION
ARRIVAL FR~ ~CSC COJHTRIES I HPORT S FROM .. NOH ·MEHSER
WJHiRIES
• U T I Ll ZA T I 011
PO'.IER STATIONS
INDUSTRY
DOMESTIC
SHIPMENTS TO OTHER ECSC
CCXJNTRIES
EXPORTS TO NOII·HEHBER
CCXJHTRIES
I I I I I I I I I ~ I 1 1 353313 1 15488 I· 2138 I 55soo 6980 I 1600 I 1 , 1 435019 1 1 I 113165 bl I I t.oo 1300 I I 1 1 114865 1 I I 189099 c I 15488 I 1900 53600 3500 I 1600 I I I I 265187 I 1 1 51049 dl I 238 15oo 21ao I I 1 1 54967 1
I I I I I I I I I I I I I I I I I I 1 275 5 1 6060 1 t.42 1 65 150 30 I 1 13 1 1 7ot.o 1 1 I 604 o I I I I o 1 1 60t. o 1
265 1 1 I 60 150 30 I I 13 1 1 518 1
10
275
250 25
I I I I I I I ~·· I 5 I 20 I 442 I 5 I I 1 1 482 j
I I I I I I I ,, I 1 6060 1 442 I 65 3o I 13 1 1 6885 1
I 775 1 t.4 2 I I 1 1 1211 1 I 2985 I I I 3 1 1 3238 1 1 1515 I I 65 3o I 10 1 1 1M5 1 I I I I I I I I 665 I I I 1 1 665 1 .
I I I I I I I I I 12o I I . I I ' I I 120 1
_ I I_ I I I I I I I . I 1···································1··········1··········.1··········1··········1··········1··········1··········1·········· ··········I·········· ··········1··········1··········1
a: including 243748000 t from DDR b: including 98715000 t from OOR c: including 95464000 t from OOR d: including 49569000 t from ODR
I w 0
)

ANNE034 TABLE 10
HARD COAL PRODUCTION BY AREA
08-0ct-91 (1 000 TONNES)
-------------------------------------------------------------------1989 1990 1991
KEMPEN 1893 1036 590
RUHR AACHEN IBBENBUREN SAAR + KLEINZECHEN
BELGIUM 1893
61271 4142 2135 9903
1036
60498 3866 2074
10115
590
57200 3500 2000 9850
------------ ------------ -----------·, GERMANY 77451 76553 72550
CENTRAL ASTURIANA BIERZO, VILLABLINO, NARCEA LEON', PALENCIA SUR -~GON,CATALUNA, BALEARES
·.NORD-PAS-DE-CALAIS LORRAINE CENTRE-MIDI
SPAIN
" : ··~
4609 5544 2443 1859 4722
19177
490 8816 2165
4437 5881 2427 1988 4579
19312
232 8360 1895
4433 5866 2264 1991 4540
19094
0 8400 1800
FRANCE 11471 10487 10200
SCOTLAND NORTH-EAST YORKSHIRE NORTH-WESTERN MIDLANDS-KENT SOUTH WALES BC OPENCAST
IRELAND 43 35 25
ITALIA 75 60 75
PORTUGAL 258 281 280
1900 NA
26572 7817
NA 3782
16799 :.
NA NA NA NA NA NA
LICENSED MINES + OPENCAST ,, 2891
2073 9519
23453 6390
26638 3238
16277 2861
16000 2800
UNITED KINGDOM 98300 91031 89500
E U R 1 2 ~~ 2 08 668 ., 198795 192314

IHP0012 TABLEAU IHPORTATIOU DE HOUILLE EN PROVEUAUCE DES PAYS TIERS TABLE 11 COAL IMPORTS FROH THIRD COUNTRIES 1991 TABELLE EINFUHR VON KOHLE AUS DRITTLAENDERN
18- Jul-91 < •ooo n 1---------------------------------------------------------------------------------------------------------------------I Origine/Origin/Hcrkunft I I I I I I I I I Other I All I
·1-------------------------·1 U.S.A J Canada IAustra- I South I Polard I URSS I China IColombiaj count- I count- I ·I pestination/Bestirrrwng I I I lia I Africa I I I I I tries I .tric5 I 1--------~----------------- j--------j--------j--------j--------1--------j-------- 1--------1--------j--------1--------
·I .A) Anthracite et maigres I I I I I I I I I I I Low ~olatile coal I I I I I I I I I I I Anthrazit und Magerkohle I I I I I l I I I I I BELGIQUE I 70 I I 5 I 140 I I 70 I 55 I I 35 I 375 I OANMARK I NA I NA I NA I NA I NA I NA I NA NA I NA I NA I DEUTSCHLAN6 (BR) I NA I NA I NA I .. NA I NA l IIA I NA NA I NA I NA
I ESPANA I I I I I I I I I I FRANCE I NA I NA I !lA I NA I NA I IIA I NA NA I NA I NA I HELLAS I I I I I I J I I I IRELAND I NA I UA I NA I IIA I NA I NA I NA NA I NA I NA I IT ALIA I I I I 298 I I 125 I I 10 I 433
;.·
I LUXEMBOURG I I I I 20 I I 80 I I I 100 I I:EOERLAHD I HA I IIA I Nl\ I NA I NA I NA I IIA IIA I I NA I PORTUGAL I I I I 10 I I I I I 10 I UNITED KINGDOH I I I I 100 I I I 200 I I 300 l E U R - 1 2 I NA I NA I NA I NA I NA I NA I NA NA I IIA I NA j------··-·-·-·------------j·-------J--------j--------j--------l--------1-------- 1-------- --------1--------1--------
il B) Charbori a coke/Coking I I I I I I I l I I coal/Kol:skohle I I I I I I I I I I BELGIQUE l 5290 I 230 I 1525 1 3470 I 335 I 185 I 285 115 I 15 I 11450 I OAHMARK l HA I NA I NA I NA I NA I NA I NA NA I NA I NA I I DEUTSCHLAND {BR) I NA I IIA I NA I IIA I NA I NA I NA IIA I NA I NA I ! ESPANA I 2800 I I 1oo 1 I 200 I I I I 37oo 1
I FRANCE I NA I NA I NA I NA I NA I NA I NA NA I NA I NA I I HELLAS I I I I I I I I I I I 'IRELAND I NA I NA I NA I NA I NA I NA I NA NA I NA I NA I I IT ALIA I 5738 I 305 1 1115 I I 141 I 55 I I 70 I 7424 I I LUXEMBOURG I I I I I I l I I I i
I NEDERLAND I NA I NA I NA I NA I NA I NA I NA NA I I NA I I PORTUGAL I 1300 I I I 11320 I I 80 I 350 I I 3550 I I UNITED KINGOOH I 3700 I 1000 I 3ooo 1· I 500 I I I I 8200 I I .E U R · 1 2 I NA I HA I NA I NA I NA I NA I NA I NA I NA I NA I I - - - -.- -- - - - - - - - - - -- - - - - - - - - 1-- --- - - -- 1- - - - - - - - 1- - - - - - - - 1- - - - - - - - 1- - - - - - - - I - - - - - - - - 1- - - - -- - - I - - - - - - - - 1- - - - - - - - I - - - - - - - - I
I C) Autres categories de I I I I I I I I I I I I houille/Others categories! I I I I I I I I I I I of coal/Sonstige Kohle I I I I ' ~; I I I I I 1 I I BELGIQUE I 525 I I I I I I I I I 525 I ;
I DANHARK I NA I NA I NA I NA I NA I NA I NA I NA I NA I NA I I DE~TSCHLAND (BR). I NA I NA I NA I NA I NA I NA I NA I NA I NA I NA 'I ' ' I ESPANA I 500 I I 200 I 4500 I I 300 I I I 400 I 590~ I I fRANCE 1 NA I NA I NA 1.\ NA I NA I NA I NA I NA I NA I NA I I llELLAS I I I l·> 1 I I I I I I I IRELf,HO · I HA I NA I NA I NA I NA I NA I NA I NA I NA I NA I I IT ALIA I '·230 I I 100 I 484/, I 589 I 489 I 300 I 300 l 1160 I 12012 I I LUXEMBOURG I I I' I 120 I I I I I 120 I l NEDERLAND I NA I NA I NA I NA I NA I NA NA I NA l I w·A I I PORTUGAL I 80 I 12o 1 I 80 I I I I I . 280 I I UNITED KlNGDOM I 33oo 1 I 500 I 900 I I 1000 I I 23oo 1 I 8000 I I .E u R - 1 2 I NA I NA I NA I NA I NA I NA I NA I NA I NA I NA I
1-------------------------- 1--------l--------l·-------l--------l--------l--------l--------l--------l--------l--------l .IEUR-12(A+O+C) I NAI HAl NA1 NA[ NAI NAI NAI HAl NAI NAI
. 1·---------;··------------- 1--------1--·----- 1·-------1--------1--------1------··1·------- 1·-------1--------1--------1

IHP0012
TABLEAU
TABLE
TABELLE
12
IMPORTATION DE HOUILLE EN PROVEWAIICE DES PAYS TIERS
COAL !HPORTS·FROK THIRD COUNTRIES
EIWFUHR VOW KOHLE AUS DRITTLAEWOERW
-3]-
1990
18-Jul-91 ('000 T)
1-"·--------------------------------------------------------------------------------·---------------------------------l Origine/Origin/Herk:unft I j I I I I I I I Other I All 1 1--------------------------1 U.S.A I Canada IAustra· I South I Poland URSS I China IColombial count· 1 count- 1 I Destination/Bestinmung I I I lia I Africa I I I tries I tries 1 l----~---------------------j--------l--------l--------l--------1---·---- -------· ···-···-1·--·····1·-------1--·-·-··1 I A) Anthracite et maigres I I I I I I I I I I Lo~o~volatilecoal I I I I I I I I I I Anthrazit und Hagerk:ohle I I I I I I I I I
I BELGIQUE I 70 I I 5 I 173 I 66 so I I 36 I 400 I I DANMARK I WA I NA I NA I NA I NA NA NA I NA I NA I NA I I DEUTSCHLAND (BR) I NA I NA I WA I NA I NA NA NA I NA I NA I HA I I ESPANA I I I I 11 I I I I 11 I I FRANCE I NA I NA I HA I NA I NA NA NA I NA I NA I NA I I HELLAS I I I I I I I I I I IRELAND I NA I NA I NA I 'i NA I NA NA NA I NA I WA I NA I I ITALIA I I I ., 168 I 114 I I I 282 I I LUXEMBOURG I I I 14.2 I 24 I I I 38.2 I I NEDERLAND I NA I NA I NA NA I NA llA NA I WA I I WA I I PORTUGAL I I I 5 I I I I 5 I I UNITED KINGDOM I I I 1DO I 100 I 100 I 300 I
., E u R - 1 2 I NA I . llA I NA :": NA I NA NA I WA NA NA NA I 1--------------------------1--·----·1-------· -----··- ------·-1···---·· -··-··-·1-------- ··--·--- -······- -·······1 I [].) Charbon a coke/Coking I I I I I I coal/Kokskohle I I I I I I BELGIQUE I 5243 I 302 1398 4348 I 347 169 I 242 170 17 12236 I I DANHARK I NA I NA NA NA I NA NA I WA NA NA NA I I DEUTSCHLAND ( BR) I NA I NA NA NA I NA NA I NA NA NA NA I I ESPANA . I 2898 I 672 I 233 I 3803 I I FRANCE I NA I NA NA NA I NA NA I NA NA NA NA I I HELLAS I I I I I I IRELAND I NA I NA NA HA I NA NA I NA NA NA NA I I nALIA I 6236 I 212 1045 I 158 131 I 15 I 35 7832 I I LUXEMBOURG I I I I I I I I NEDERLAND I NA I IIA IIA HA I NA NA I NA NA I I NA I I PORTUGAL I 1554 I 2107 I 54 I 390 I" I ... 4105 I I UNITED KINGDOM I 3800 I 1000 3000 I 800 100 I I I 8700
I E u R - , 2 I IIA I NA I NA I NA 1 NA I NA I NA I NA I NA I NA
1--------------------- · -·-- -1· ··-----I----·-· ·I---·--- -I-·--···· -·- · ·-- · 1-- · · · · ·- -·-- · ·- · I·-··-··· I· · ·--··-I-······· I C) Autres categories de I I I I I I I I I houille/Others categories! I I I I I I I I of coal/Sonstige Kohle I I. I I I I I
l BELGIQUE 565 I I I I I I I 5{>5
I DANHARK NA I HA I NA I HA NA I NA NA I NA I NA I NA
I DEUTSCHLAND (BR) NA I NA NA I NA NA I NA NA I NA I NA I NA
I ESPANA 275 I 272 I 4653 16 I 285 I 405 I 89 I 5995
I FRANCE PIA I NA NA 1~: NA HA I NA NA I NA I NA I NA
I HELLAS· I I I I I I I I RELAHD NA I NA NA I IIA HA I NA NA I NA I NA I NA
I ITALIA 4553 I I 4716 507 I 495 310 I 290 I 456 I 11327
I LUXEMBOURG I I 124 I I I I 124
I NEDERLAND NA I NA NA ,(, NA NA I NA NA I NA I I NA
I PORTUGAL 155 I 162 l' 40 I I I I 357
I UNITED KINGDOM 1600 I 100 I 3DO 200 I 500 100 I 900 I 200 I 3900
I E u R - 1 2 I NA I NA NA I NA NA I NA NA I NA I NA I NA
1----- ·----------- ---- ··-·-1··------1·-· ----- -· ------1-··----- ·--·----1--- · ---- ---·--··I· ·-·---·1-· ·-----1··--·--· I E u R - 1 2 (A+[I+C) I NJ\ I NA I NA I NA NA I NA I NA I NA I NA I NA
1------·--·--···-··········1·-······1····--··1·-······1········ ········1-·······1········1····-···i······--1········

IMP0012
TJI.BLEAU
TABLE
TABELLE
13
IMPORTATION DE HOUILLE EN PROVENANCE DES PAYS TIERS
COAL IMPORTS FROM THIRD COUNTRIES
EINFUHR VON KOHLE AUS ORITTLAEI<DERH
- 34-.
23-0ct-91 ( • OQO T>
1-------------------------- ------------------------------------------------------------------·····----------·"-----·· I Origine/Origin/Herkunft I I I I I I I I Other I All · I 1-------------------------- U.S.A I Canada IAustra- I South I Poland I URSS I China IColombial count- I count- I
I Oestination/BestillltlUng I I l ia I Africa I I I I I tries I tries I 1-------------------------- -----·-·l-·----·-l··------l-----···l·-····-·l·------·l--·-···-l--------l····----1-----·--l
I I I I I I I I I I I I 1 9 9 o I I I I I I I I I
I I I I I I I I BELGIQUE 5878 I 302 I 11.03 I 4521 I 347 235 I 292 I 170 I 53 13201 I DANMARK 3225 I 647 1129 I 0 I 972 1142 I 57 I 2078 I 97 9347 I
DEUTSCHLAND 665.1 45 414 I 4490 I 2229 ·282 I 0 I 0 I 513 8638 I
ESPANA 3173 I 0 944 I 4664 I 249 285 I 0 I 405 I 89 9809 I FRANCE 6604 I 6137 3550 I 863 I 395 777 I 1776 I 2033 I 636 17321 I
IIELLAS 0 I 0 0 I 1100 I 0 300 I 0 I 0 I 0 1400 I
IRELAND 1400 I 0 150 I 90 I 400 0 I 7 I 0 I 718 2765 I lTALIA 10789 I 212 1045 I 4884 I 665 740 I 310 I 305 I 491 19441 I
LUXEMBOURG 0 I 0 0 I 138 I 0 24 I 0 I 0 I 0 162 I NEDERLAND 6166 I 436 5562 I . 1194 I 1129 31 I 149 I 1498 I 201 16366 I
POJ'!TUGI\L 1709 I 162 0 I 2112 I 40 54 I 0 I 390 I 0 41,67 I
UII!TED KlllGDOM 5400 I lOOO 3100 I 400 I 1100 600 I 100 I 1000 [ 200 12900 I I I I I I I I I
--------------------------1~-------1---··:-- --------1-:------ -------- -----·-·1·····---1--------1-------- --------1 I ·E u R - 1 2 I 45009 I 3491 l 17297 I ,;/;24456 7526 4470 I 2691 I 7B79 I 2998 115817 I
1--------------------------1--~----- 1--------1--------1-------- -------- --------J--------1--------1-------- --------[ I I l I I 1 I 1 I I I 1 9 9 1 I I I I I I I I I I I I I I I I I I I I I I BELGIQUE I 5885 I 230 I 1530 I 3610 335 I 255 I 340 I 115 I 50 I 12350 I
·I.OANMARK. I 4514 I 815 I 1606 I D 573 I 1684 l 118 l 2419 I 424 l 12153 I I DEUTSCHLAND I 700 I 50 I 500 I . 4700 2500 I 300 I 0 I 0 I 550. I 9500* I I ESPANA I 3300 I 0 I 900 I 4500 200 I 300 I 0 I 0 I 400 I 960~ I
I FRA!ICE I 10400 I 500 I 3560 I 860 180 I 50 I 1550 I 1550 I 50 I 18700 I I HELLAS I 0 I 0 I 0 I 1200 0 I 300 I 0 I 0 I 0 I 1500 I I IRELAND I 1400 I 0 I 150 I 100 370 I 0 I 10 I 0 I 730 .1 2760 I
I ITALIA' I 99613 I ' 305 I 1215 I 5142 730 I 669 I 300 I 300 I 1240 I 19869 I
I LUXEMBOURG I 0 I 0 I 0 I 140 0 I 80 I 0 I 0 I 0 I 220 I
I NEDERLAND I 6100 I 400 I 5300 I 1250 900 I 0 I 150 I 1400 I 200 I 15700 I I PORTUGAL I 1380 I 120 I 0 I 1910 0 I 80 I 0 I 350 I 0 I 3840 I I UNITED KINGDOM I 7000 I 1000 I 3500 I 1000 500 I 1000 I 0 I 2500 I SOD I 17000 I I I . I I I I l I I I I I ·I--------------------------J--------I--------I--·--·-·I·-····--1·-····-·I···-~---r--~---··l··------ 1-------- 1···-----1
. I E u R - 1 2 I 50647 I 3420 I 18261 I 24412 I 6288 I 4718 I 24613 I 8634 I 4144 I 123192 I I 1·••·•··~·-•••••••••••••••••~•••••••••••••••••••••••••••••••••••••••••••••••••••••••••••••••••••••••••••••••••••••••••
* DISTRIBUTION BY COUNTRY OF ORIGIN UNKNOYN FOR 0.2 MT
* VENTILATION PAR PAYS D'ORIGINE INCONNUE POUR '0.2 MT
* DAVON 0.2 MT UNBEKANNTER liERKUNFT

TABLEAU TABLE TABELLE
08-0ct-91
14-
H 0 U I L l E C 0 A L S T E I N K 0 H L E
ECHANGES INTRA·COMMUNAUTAIRES INTRA-COMMUNITY EXCHANGES
ECHANGES INTRA·COMMUNAUTAIRES 1991
(I 000 TONNES)
1···------------- -------------------------------···· -------------------------------------------------------------------------------------------------------------------------1 I DE-FROM-VON BELGIQUE I DANMARK I DEUTSCH· ESPANA FRANCE HELLAS IRELAND ITALIA I LUXEM- I liEDER· I PORTUGAL I UNITED I RECEPTIONS I I I I LAND I BOURG I LAND I I KINGDOM I RECEIPT /BEZUG I I EN-TO-A I I I I I I I 1---------------- -----------1----------- ···········•···········•···········•·------·--···-·········•··---·-··--1-------···· ······-·--- -----······ ····--····-1--·······----1 1 BELGIQUE I
I I I DANMARK I I I I DEUTSCHLAND 65 I 1 13o 1 I ESPANA 40 I I 3o 1
I FRANCE 350 I I 1oo 1
t=:::;r
I HELLAS I I I I IRELAND I I 8 I I I TALl A I 5 I I I 5 I I LUXEMBOURG I 55
I I :.o I NEDERLAND I 170 I I 2oo I PORTUGAL I 5
I I UNITED KINGDOM I 5
I I 100
I EXPEDITIONS I I DELIVERIES I 695 so "I I LIEFERUNGEN I 613 I
800 1410
31
400 400
11oo 1
1095 "r
70 600 625
2
500 450
200 400
3600 4483
I I
20
380
20
45
91
s37 "I 556 1
20
20
1 45o 1 mo 1
1 45 11 o 1 1585 1
1 1oo 1 1oo 1
I 66 1 97 1
1 1<+oo 1 1465 1
I 1,0 150 I 700 I 1 1oo 1 s:.o 1
I 1so 1 6oo 1 1 2so 2oo 1 19oo 1 I 220 1 1415 1
I i I I I I 1 2oo 1 2oo 1 I so 4oo 1 573 1
I 1 6os 1 121 1
55 1 42 1
67o 1 65o 1
100 1o5 1 170. 110 1
250 47s 1
5oo 1
I 235o 1 1 7oo 1 7952 1
1 135 I 1 1266 1 7053 1
1---------------------------- ··········---·-···················--····-·-----------·····························------·-······----------------------------·-·····------------··1 lERE LIGNE/ 1ST LINE/ l.LINIE : EXPEOITEUR/SENDER/LIEFERLAND 2EME LIGNE/ 2NO LINE/ 2.LINIE : RECEPTION/RECEIVER/BEZUGSLAND
" Commission Forecasts
w U'j
I

TABLEI-U
TABLE
TABELLE
15
K 0 ·u I L L E
-C'OAL
S T E I H K 0 K L E
ECKANGES J_IHRA·COMXUtiAUTAIRES
INTRA-COMMUNITY EXCHANGES
ECHAtiGES IIITRA·COMMUHAUTAIRES
1990
18~Jul·9f ('000 TONNES)
!-···············I··············:·······················································-···········-·········································································· I I DE·FROM·VOH I BELGIQUE I DAHMARK I DEUTSCH· I ESPAt/A I FRANCE I HELLAS I IRELAND I ITALIA I LUXEM· I NEDER· I PORTUGAL I UIIITED I RECEPT!O!!S I
I I I I - LAND I I I I I I BOURG I LAND I I KIHGOOH IRECEIPT/BEZUGJ
I EN. TO· A I I I I I I I I I I I ' I - I I
1················1···········1···········1···········1···········1···········1···········1···········1···········1···········1·-·········1···········1········-··1·············1 I BELGIQUE I I - I 1174 I I 16 I I I I I 452 I I 103 I 1745 I 1 1 1 1 1411 1 1 19 I 1 1 I I 3o 1 1 99 1 1559 1 I DMIHARK I 1 I I 3 I I I I I 2 I I 366 I 372 I 1 I 1 I I 41 I I I I I I I 5s6 I s9e I I DEUTSCHLAND I 67 I I I I 355 I I I 1379 I I . 214 I 2015 I i 1 137 1 1 1 1 376 I I 29 I 1 139 I 681 1
I ESPANA I 43 I I 456 I I 10 I I 25 I I 138 I 672 I 1 1 s1 1 1 407 1 11 I I 13 I I 156 1 644 1
I FRANCE I 359 I I 1685 I I I 254 I I 271 I 2569 I 1 -: .. : 1 19.1 1 I 15 36 I I _ I I 31 I 311 1 2 o69 1 i HELL AS I I I I I I I I I ~I:. I I I I I I I I I I I I I RELANO I I I 5 I 40 I I 46 I I 248 I 339 I 1 1 8 1 1 7D 1 45 I I so I 1 4oo 1 s73 1
I IT All A I 5 I I 856 I 60 I I I I I 951 I 1 1 s ! I 913 I 1e9 I I I 1 1 1101 1 I . LUXEHSCXJRG I 61 I I 1 I I I I I 62 I 1 I 33- 1 I I 1. 3 I I I I I 35 I I NEDERLAND I 179 I I 486 I I I I 25 I 690 I 1 1 232 1 I 536 I 1 I I I 1 769 ! I PO~TUGAL I 4 I I I 1 I . I 3 I 190 I 198 I I I I I I 1 I I I 3 I 197 I 201 1 I UNITED KINGDOM I 4 I ! 204 I 1 I 25 I I . 202 I I 436 I 1 1 6o 1 3 I . 241 I 14 I 21 I I 11o4 1 1 2043 1 I EXPED I Tl ONS I I I I I I I I I I I I DELIVERIES I 723 I 54 *I 4900 I I 483 *! 25 I I 2363 I 1555 I 10103 I I LIEFERUNCEII I 724.7 I 3 I 5156.3 I I 656 I 21 I I 1829 31 I 1858 I 10279 I , ............................................................................................................................................................................ 1
1ERE LICNE/ 1ST LINE/ 1.LINIE : EXPEDJTEUR/SENDER/LIEFERLAND 2EME LICNE/ 2ND LINE/ 2.LINJE : RECEPTION/RECEIVER/BEZUGSLANO .
• Commission foreca5ts vv G\

TABLEAU
TABLE
lABELLE
16 HOUILLE c ·o A L STEIN-:OHLE
ECKANGES IIITRA·COHMUIIAUTAIRES
INTRA·COHMUIIITY EXCHANGES
ECHAHGES IIITRA·COHHUIIAUTAIRES
1990
08·Jul·91 MARKET REPORT • MARCH 1991 ( 1000 TOUUES)
1················1···············~··········································· ··························································· ···--···-····························1· I OE·fROH·VON I BELGIQUE I OANI-IARK I DEUTSCH· I ESPANA I FRANCE HELLAS I IRELAND I IT ALIA I LUXEM· liEDER· PORTUGAL I Ulll TEO I RECEPTIONS I I I . I I LAND I I I I I BOORG LAND I K IIIGDC*i I RECEIPT /BEZUG I I E!I·TO·A I I I I I I I I I I ~ I 1················1···········1···········1···-··'····1···········1··········· ···········1···········1···········1······-·-·- ······················I··········· ·············I I BELGIQUE I I I 1100 I I I I I 400 I 70 1570 I 1 1 1 1 14 75 I - I 2o I I I 6o I 90 161,5 1
OA~~AR)( I I I I I I I I I 500 500 I
DEUTSCHLAND
ESPANA
FR:..NC£
HELL AS
I RElA"'D
IT ALl A
lUXEHSOO~G
NEDERLAND
PORTUGAL
UNITED KINGDOH
EXPEDITIONS DELIVERIES
Ll EFERUHGEH
I I I I I I I I 650 650 I 65 I I I I I I I 18so 1 270 2185 1
100 1 1 I I 300 I I I so I 250 7oo 1 30 43
255
11,0
8 10
60 40
170 200
10
50
605
581
I I I I
I I I I
20 •I I
500 460
1600 1.380 ~...;:.-.-
70 1000 901
3 500
700
200 LSO
4900 5!.39
10
10
14
45
100
3 i I I I
520 .I 482 1
0
0
I I 110 640 1 I I 1o3 620 1 I 3oo 1 2so 2m 1
I I ___ 1 o I 110 1100 1
I I '"·' -"'- I :.~-- I I I I I -- I I I I 260 I 260 I I I so 1 4oo I 573 1
I I 1010 1 I I 901 I I I 60 I I I 43 I I 2o I 690 I I I 1000 1 I 90 I 100 I 1 1e3 1 196 1
25 250 I I 480 1
I I soo 1
I I I 25 I o I o I 2800 I o 1 1600 1 104 70 1
o I o I o I 170 1 o 1 1846 1 85 28 1
..... ················································ ..................... ·········· ....... ······. ··········-············1 !ERE LIGHE/ 1ST liHE/ 1.LIHIE : EXPEDITEUR/SEHDER/liEfERLAHO 2EME LIGHE/ 2ND LIHE/ 2.LIHIE : RECEPTION/RECEIVER/BEZUGSLAHO
• C~ission Forecasts j
(A)
-.j I

-TABLEAU TABLE TABELLE
17
COKE DE FOUR .--COKE OVEN COKE STEINKOHLEHKOKS
ECitANGES INTRA·COMHUNAUTAIRES ltlTRA·COMMUN ITY EXCHANGES
ECHANGES INTRA·COMMUHAUTAIRES
08-0ct-91
1--------~------- '··········:···--------------------- -----------------------------------1 DE-FROM-VON BELGIQUE I DANHARK I DEUTSCH· ESPANA I FRANCE I HELLAS IRELAND
I I I LAND .I - I I EN-TO-A I I I I 1---------------- ---~------- 1-----------1----------- -----------1-----------1··---------1 BELGIQUE I I 100 I I 1 1 1 110 1 15 1 I DANMARK 5 I I I I I 9 I I 2 , I I I DEUTSCHLAND 275 I I I I 1 19o 1 1 1 1 oo 1 I ESPANA I I I I 1 10 1 2o 1
.J fRANCE 280 I 100 I I I t 36o 1 51o 1 1 1 ,-,._,
I HEL LAS I I I I I I I I I I IRELAND I I I I I I 3 I I I I I liALIA 15 I 200 I I I
I I I I I I LUXE1~80URG 205 I 900 I I I 1 24o 1 1 ot,, . 1 1 1 I NEDERLAND 40 I 80 I I I 1 so 1 1oo 1 1 5o 1 I PORTUGAL I I I I I I I 6 I 6 I I UNITED KINGDOM I 20 I I I I I 75 I I I I EXPEDJTIOilS I I I I I DELIVERIES 820 I 1400 I I 189 al I LIEFERUNGEN 852 I 1848 I 7 I 191 I 1---------------- ------·---------------- -----------------------------------·-----·--·--
1991
( 1000 TOWNES) --·-- ·-------------- ----------------------------.--- ·-.- ·-.---.- --.--- .. ·I
ITALIA I LUXEM· I NEDER· I PORTUGAL I U~ITED I RECEPTIONS I I BOURG I LAND I I KINGDOM I RECEIPT /BEZUG I I I I I I I
----------- 1---········ I··········· I~---------- 1--~-------- -············I
3
7
35
4
10
49 10
I - I 3oo I I 4oo 1 I 235 1 1 36o 1 I I I s I I I I 23 35 1 1 1oo 1 1 378 1
100 I I 10 400 I
300 290
50
25
750
651
2 I 9 I
2
1 1s 45 1 I 715 I ·:: ... 1160
2
100 al 5o 1
4
10
5
215 90
1105
1281 120 200
13 70
100
3310 3699
1ERE LIGNE/ 1ST LINE/ l.L!NIE : EXPEOITEUR/SENDER/LIEFERLAND 2EME LIGNE/ 2ND LINE/ 2.LINIE : RECEPTION/RECEIVER/BEZUGSLAND * Commission Forecasts a : break down by country not available
I w c...lJ l

.·TABLEAU
TABLE -TABELLE .
18
·-COKE DE FOUR COKE OVEN COKE STEINKOHLENKOKS
ECHANGES INTRA·COMHUNAUTAIRES INTRA-COMMUNITY EXCHANGES
ECHANGES INTRA·COMHUNAUTAIRES 1990
08·0ct·91 ('000 TOWNES) I················ I···························································································································································-· I
I DE-FROM-VON I BELGIQUE I OANMARK I DEUTSCH· I ESPANA I FRANCE I I I I I LAND I I I I EN- TO- A I I I I I I I················ 1····-----··1··········· 1······-··-- 1--------·--1·----·--·-· I BELGIQUE I I I 107 I I 16 I I I I 114 I 1 1a I DANHARK I 8 I I 3 I I
9 I I 2 I 1 I DEUTSCHLAND I 278 I I I I 105
173 1 1 1 3 1 81 ESPANA I I I 4 I I 23
FRANCE
HELLAS
IRELAND
IT ALIA
LUXEMBOURG
NEDERLAND
PORTUGAL I I
I UNITED KINGDOM I
283 283
3
17
205 214 39 50
I I 24 I EXPEDITIONS I I DELIVERIES I 831 I LIEFERUNGEN I 756 I
8 I I 25
250 ·•;,·; .. : 435
1
95
1109 1107
58 92
2
102
1628 1861
9
46
0
38
61 5
6 1 6 20 21
254 19 I 212
I········································ 1ERE LIGNE/ 1ST LINE/ 1.LINIE : EXPEDITEUR/SENDER/LIEFERLANO
" Commission Forecasts a : break down by country not available
HELLAS IRELAND I ITALIA I LUXEM- I NEDER- I PORTUGAL I UNITED I RECEPTIONS I I I BOURG I LAND I I KINGDOM IRECEIPT/BEZUGI
I I I I I I I ----·-····· 1·---------- I··········· I··········· 1··-·····-··1··-········1·············1
I I 363 1 I 30 516 I I I 235 1 I 367 I I I I I 28 40 I I I I I 20 32 I I 3 I 1o3 1 I 3 492 I I 3 I 93 1 I 14 367 I I 7 I I 2 I 1 37 I I 6 I I 5 I 1 45 I
3s I 34 I
203 _J I 1 m I 2a6' .. ·"r I .-.· 967 I
7 I I I 1 9 I to I I I 10 I
I I I 1 1 I I 1 I I 2 7 I I 42 1 I 200 I
I I 85 I I I 1314 I
7 I I 1329 I I I 26 161 I I I 21 1 224 I I I I 6 I I I I 13 I
s6 1 I I 78 I 2 51 I I I 200 I
I I I I 52 773 1 2 I 91 al 3631 I
2 I 53 594 1 5 I 58 1 3646 I ······---··-··-········-··············-··········1
2EHE LIGNE/ 2ND LINE/ 2.LINIE : RECEPTION/RECEIVER/BEZUGSLAND ' w
-0

TABLEAU
TABLE
TABELLE
19
. COKE DE FOOR
COKE OVEN COKE
STEIHKOHLENKOKS
ECHA.HGES IHTRA·COP.MUHAUTAIRES I_HTRA·_CC«MUIIITY EXCHANGES
ECHAIIGES INTRA·COMHUNAUTAIRES
1990
08·Jul·91 ~A.RKt:T REPORT· HARCH 1991- _ ('000 TO!lllES) !················1·········································; ......................................................... · .......................................................... , I DE·fi1ai·VON I BELGIQUE OA.IIHARK I DEUTSCH· I ESPMIA I fRANCE I HELLAS I. IRELMID I ITALIA I LUXEH· I HEOER· I PORTUGAL I UHITtD I RECEPTIONS I I I I LAHO I I I" I I I SOORG I LAilO I I KIHGDa-1 IRECEIPT/OEZUGI
I EN. TO· A I I I I I ! I I I I I • I
1· ·· · · · · · ········I··········· · · · · · · · · · · ·1· · · ········I·········· ·I·········· ·I·····:··.-. ·I·········· ·I·········· ·I·········· ·I··········· · · ·········I········· ··I············ ·I BELGICU~ I I 100 I I I I i I I 300 I I 400 !
1 I 165 I I 2o I I I I I 230 I 1 415 1 OANHAi<K I I I I I I I I I I I o I
I I I I I I I I I I I 2o I i OEUT SCHLAHO I 295 I I I I I I 3 I I 100 I I 398 I 1 1 200 1 I 90 I I I. I I 1oo I 10 1 t.oo 1 I ESPANA I I I I I I 7 I I I I 7 I 1 I a I I 27 I I I a I I I 2 I t.5 I I fRANCE I 330 200 I I I I I 35 I I 300 I I 865 I
.I . I 320 "13 I I I I I I I 230 I ! 101s I 1 HELL(s I · I I · ·-'I· I I 7 I I I ,.J 7 L. I I I I I ! I 1o I I I .. I 10 Y I I RELAHD I I I I I I I I I I 0 I
I 3 I 1 I I I I I I 1 I I 2 I 7 I I TALl A I 20 1 oo I I I I I I I 1 120 1
I I I I I I I I o I LUXE~3CIJRG I 155 1100 I I I I I I I 1255 I
1 201 1110 I 1 I I I I 7 I 1 1319 1 HEOERLAHD I 2s eo I I I I i I 1 1 os 1
1 wo 1 100 I 1oo I I I I I 1 3oo 1 PORTUGAL I I I I I I I I I o I
I I 7 I s I I I I ·- · I I 12 I UN I TED (I HGOOH I I . 20 I I I I I 50 I I 70 I
I I I I I I I I I 100 I E XP E 0 I T I 011 s I I I I I I . I I I I
DELIVERIES I 825 0 I 1600 0 I 140 I 0 I 0 I 52 I 0 750 I 0 100 el 3467 1 LIEFERUHGEII I 824 0 I 1797 I 7 I 243 I 0 I 0 I 18 I 0 568 I 0 14 I 361,3 I
···························· ................. ············· ................................................................. ······················· ......................... , 1ERE L!GHE/ 1ST LIHE/ 1.Li IE : EXPEOITEUR/SEIIOER/LIEFERLAHO 2EHE :IU 21iD LIHE/ 2.L!NIE : RECEPTIOH/RECEIVER/BEZUGSLANO
• C~ission Forecasts a : break do~n by country not available
I + 0

TABLEAU TABLE TABELLE
08-0ct-91
20 CONSOMMATIONS EFFECTIV~S DES CENTP.ALES ELECTRIOUES
EFFECTIVE COtiSUMPTIOtl BY POUER STATIONS EFFEKTIVER VERBAUCH DER ELEKTRJZJTAETS~ERKE
('000-TONNES) l--------~---------------1------·-··-·················~---·············---·~--------·-----: -----------------------------------···-··-···---·----------············-·-··1 I I BELGIQUE I DANMARK I DEUTSCH· I ESPANA I FRANCE I HELLAS I I I I LAND I .I 1·······················-J··········I·········· ·o······-·1··--······1······-··· •·········· I 1990 LIVRAISONS I I I I I DELiVERIES I 6634 I 9122 1.61.33 I 22540 I 1Ci917 0
I LJEFERUNGEII I I I I 1·----------··-···-·-····1·····----·1·········- ·····-····1----------1----------·------·---1 I I I I I VARIATIONS STOCKS I 151. I 56 -310 I ·1118 I 1039 0
I I I ! I 1------------------------l----------l·--------- ----------1·--------- 1···--·----·--------·-1 CONSOMI1ATION I I I I I ~- CONSUMPTION ( 1) I 6480 I 9066 46743 I 23658 l, 9878 0
I VERBRAUCH
IRELAND I ITALIA I LUXEM· I NEDER-1 I BOURG I LAND
----------1----------l----------1-·--------1 I I
2010 1o615 1 o 1 8715
I -------·-·•··--------·----------1----------
105 NA 1
o .I I
NA
----------·----------·----------1----------1
1905 NA o I NA
I
PORTUGAL I UNITED I EUR - 12 I KINGDOM I I
-- --·-·--- '----------1 ~ ---------1 I I
3763 821oo 1 202849 I
I I ---------- '- ---------1----------1
I I 504 ·446 I NA I
I I ---------- '--------- -·1----------1
I I 3259 82546 I NA I
:c·./ . .' I -' 1·--------------------··· ··········· •·········· ---------- ··---------·-------~--·---------- ·----------·----------·~---------·---------- ·---------- ·----------1----------I 1991 LJVRAISONS I DELIVERIES 5795 11600 I LIEFERUNGEN 1··· ···••• ••••••·····••,. • I•'"' -•••••• • I •• • • ........ ••
I I I
VARIATIONS STOCKS ·57 -480
I··- ... ··----------------'----------'----------1 CONSOHMAT ION I CONSUMPTION (2) 5852 12080 I VERBRAUCH I· .......... -... • • ..... • • ............... " I ... "'"' .. • • • • • • I • """' • •,..,.. • •
I I DIFFERENCE (2) - (1) -628 3014
I 1·-·-··---------·--------
ANNE0129
1 47400 21694 14800 0 2070 10000 0 9000 3165 835oo 1 2o9o24
I ----------·----------·----------·---------- ·---------- ·----------·----------·---------- J----------1----------1----------
1 I I 150 -8964 NA 0 12 NA 0 NA I -400 I NA I . NA
I I I ----------,----------,----------~----------,----------,----------,---·------! ----------l----------1----------l----------
1 I I I I I I I I I t. 7250 I 30658 I NA I 0 I 2058 I NA I 0 I NA I 3565 I NA I IIA
I I I I I I I I I I ··········1·······-··l··········l···-······l········--j---·------l--········l··--------l----·---··l-·--------l----------
l I I I I I I I I I I 507 I 7000 I NA I 0 I 153 I NA I 0 I NA I 306 I NA I HA I
I I I I I I I I I I I ------------------------------······························------------------············---------------···············1
I J::