commercial viability of an upgraded koche, a traditional
TRANSCRIPT

COMMERCIAL VIABILITY OF AN UPGRADED KOCHE, A
TRADITIONAL MEAT PRODUCT PREPARED IN PASTORAL REGIONS
OF KENYA
BY
GRACE WERIKHE
Bsc. Food science and Technology (Hons), University of Nairobi)
A56/87986/2016
A THESIS SUBMITTED IN PARTIAL FULFILMENT OF THE
REQUIREMENTS FOR THE DEGREE OF MASTER OF SCIENCE IN
FOOD SCIENCE AND TECHNOLOGY OF THE UNIVERSITY OF
NAIROBI
DEPARTMENT OF FOOD SCIENCE, NUTRITION AND TECHNOLOGY
Faculty of Agriculture
2019

ii
DECLARATION
Student
I, Grace Werikhe, declare that this is my original work and has not been presented for a degree
award in any other University.
Signature……………………………….. Date:……………………………………..
This thesis has been submitted for examination with our approval as university supervisors.
Signature……………………………. Date:……………………………………..
Dr. Catherine.N. Kunyanga
Department of Food Science, Nutrition and Technology
Signature…………………………… Date:……………………………………..
Prof. Michael .W. Okoth
Department of Food Science, Nutrition and Technology
Signature……………………………. Date:……………………………………..
Dr. Hassan.G. Roba
Research Scientist, National Museums of Kenya.

iii
UNIVERSITY OF NAIROBI
COLLEGE OF AGRICULTURE AND VETERINARY SCIENCES ( CAVS)
PLAGIARISM DECLARATION FORM FOR STUDENTS
Name of Student: GRACE WERIKHE
Registration Number: A56/87986/2016
College: COLLEGE OF AGRICULTURE AND VETERINARY
SCIENCES
Faculty/School/Institute: AGRICULTURE
Department: FOOD SCIENCE, NUTRITION & TECHNOLOGY
Course Name: MASTERS OF SCIENCE IN FOOD SCIENCE & TECHNOLOGY
Title of the work : COMMERCIAL VIABILITY OF AN UPGRADED KOCHE, A
TRADITIONAL MEAT PRODUCT PREPARED IN PASTORAL REGIONS OF KENYA
DECLARATION
1. I understand what Plagiarism is and I am aware of the University’s policy in this regard
2. I declare that this thesis is my original work and has not been submitted elsewhere for
examination, award of a degree or publication. Where other people’s work or my own work has
been used, this has properly been acknowledged and referenced in accordance with the
University of Nairobi’s requirements.
3. I have not sought or used the services of any professional agencies to produce this work
4. I have not allowed, and shall not allow anyone to copy my work with the intention of passing
it off as his/her own work
5. I understand that any false claim in respect of this work shall result in disciplinary action, in
accordance with University Plagiarism Policy.
Signature ______________________________________Date: _________

iv
ACKNOWLEDGEMENT
It would not have been possible to complete this master’s thesis without the association of many
people. I therefore take this great opportunity to extend my appreciation to all who made it
possible. First I would like to thank the Almighty God for the good health and well-being that
were necessary to complete this thesis.
Secondly, I extend my sincere gratitude to my supervisor, Dr. Catherine .N. Kunyanga, for her
continuous support, dedicated help, advice and encouragement. Her enthusiasm, integral view
on research and mission for providing high quality work has made a deep impression on me.
During our course of interaction in the last two years, I have learnt extensively from her
including how to multi-task, data-driven decision making and approaching a problem with
systematic thinking. She has taught me another aspect of life, that, ‘goodness can never be
defied and good human-beings can never be denied’. Her friendly nature has always made me
feel at ease with her and could always look back for any support. My special words of thanks
also go to my co-supervisors, Prof. Michael.W.Okoth and Dr. Hassan .G. Roba for their great
and commendable inputs and valuable guidance that shaped this research work.
I am also greatly indebted to the German Ministry of Education and Research through the
RELOAD (Reducing losses adding value) for their financial support in my research. Without
their precious support it would not have been possible to conduct this research. I am also grateful
to my project coordinator, Peris Kariuki from National museums of Kenya for coordinating and
ensuring my field work activities ran smoothly.
I greatly appreciate the chemistry and microbiology lab technicians, Catherine Ngunju, James
Ouma, Edith Cherotich, Monica Kamau and Jared Omondi for their assistance during analysis
v
of the samples and Joshua Ombaka for his guidance and support during statistical data analysis.
He always helped me out whenever I got queries regarding data analysis.
A special mention of thanks to my classmates Jacque Namusalisi, Memory Chikondi Liomba,
Oliver Chanzu, Wilson Karibe and Isaac Maitha. Their friendship and untimely help shall always
be remembered.
My heartfelt thanks to my Aunty, Mwanamaka Amani Mabruki . Her constant motivation and
support will remain my inspiration throughout my life. It is impossible to appreciate everybody
who had an impact to this work, but there are those whose spiritual support is even very
important. I express my profound gratitude to my grandmother, Deborah Mutonyi and mother,
Martha Mlekwa who taught me the good things that really matter in life and formed the vision.
Last but not the least, a very special gratitude to my brothers, James, Victor, Cousin, Kora and
‘Sisters in love’, Catherine and Vicky for their love, encouragement and moral support….’I heart
you guys’
TO GOD BE THE GLORY

vi
DEDICATION
I dedicate this work to my loving mum, my eternal cheerleader and life coach. She worked
tirelessly to set me off in starting my academic journey and has remained my inspiration
enabling me to sustain my academic achievements to date. I owe it all to you ‘Mama’.

vii
LIST OF ACRONYMS
FAO- Food agriculture organization
KMC- Kenya meat commission
GDP- Gross domestic product
KNBS- Kenya bureau of statistics
FGD- Focus group discussion
KII- Key informant interview
MM- Marketing margin
CPP- Consumer paid price
PRP- Producer’s paid price
FAQ- Fair average quality

viii
TABLE OF CONTENTS
DECLARATION ............................................................................................................................ ii
PLAGIARISM DECLARATION FORM FOR STUDENTS ....................................................... iii
ACKNOWLEDGEMENT ............................................................................................................. iv
DEDICATION ............................................................................................................................... vi
LIST OF ACRONYMS ................................................................................................................ vii
LIST OF TABLES ....................................................................................................................... xiv
LIST OF FIGURES ...................................................................................................................... xv
LIST OF APPENDICES .............................................................................................................. xvi
GENERAL ABSTRACT ............................................................................................................ xvii
CHAPTER ONE: GENERAL INTRODUCTION ......................................................................... 1
1.1Background information ........................................................................................................ 1
1.2 Problem statement ................................................................................................................. 2
1.3 Justification ........................................................................................................................... 3
1.4 Study aim............................................................................................................................... 3
1.5 Study objectives .................................................................................................................... 3
1.5.1 Main objective ....................................................................................................................... 3
1.5.2 Specific objectives ................................................................................................................. 4
CHAPTER 2: LITERATURE REVIEW ........................................................................................ 5
2.1 Meat Value Chain.................................................................................................................. 5
2.1.1 Meat production ........................................................................................................... 5
2.1.2 Traders ......................................................................................................................... 6
2.1.3 Slaughterhouses/ abattoirs ........................................................................................... 7
2.1.4 Processors .................................................................................................................... 8

ix
2.1.5 Markets ........................................................................................................................ 8
2.1.6 Consumers....................................................................................................................... 9
2.2 Losses reduction through meat value addition ...................................................................... 9
2.3 Indigenous meat products...................................................................................................... 9
2.3.1 Biltong......................................................................................................................... 10
2.3.2 Kilishi ........................................................................................................................... 10
2.3.3 Suya .............................................................................................................................. 10
2.3.4 Koche ........................................................................................................................... 11
2.3.5 Enyas ............................................................................................................................ 11
2.3.6 Olpurda ......................................................................................................................... 11
2.3.7 Fonn tumma .................................................................................................................. 12
2.3.8 Guba .............................................................................................................................. 12
2.3.9 Kataweel ........................................................................................................................ 12
2.3.10 Fonnqadabbe ............................................................................................................... 13
2.4 Indigenous meat product packaging ................................................................................... 13
2.5 Informal markets ................................................................................................................. 14
2.5.1 Street Food vending ..................................................................................................... 14
2.6 Formal markets. ................................................................................................................... 14
2.6.1 Supermarkets............................................................................................................... 15
2.7 Conceptual framework of Commercialization of food products. ........................................... 15
2.8 Cost benefit analysis of a food product ............................................................................... 16
2.9 Challenges in commercialization of indigenous meat products .......................................... 16
2.9.1 Poor quality and hygiene ........................................................................................... 16
2.9.2 Lack of standardization ............................................................................................... 17

x
2.9.3 Lack of knowledge in good packaging material ......................................................... 17
2.9.4 Lack of branding and trademark ................................................................................. 17
2.9.5 Inadequate resources by processors to expand production ......................................... 18
2.9.6 Lack of competitiveness in the formal market ............................................................ 18
CHAPTER THREE: STATUS AND PROCESS ANALYSIS OF KOCHE, A TRADITIONAL
PASTORAL MEAT PRODUCT IN KENYA. ............................................................................. 19
3.1 Abstract ................................................................................................................................... 19
3.2 Introduction ............................................................................................................................. 20
3.3 Materials and methods ............................................................................................................ 21
3.3.1 Study Area ........................................................................................................................ 21
3.3.2 Study design ..................................................................................................................... 23
3.3.3 Sampling and data collection ........................................................................................... 23
3.3.4 Data Analysis ................................................................................................................... 23
3.3.4.1 Gross margin model ................................................................................................ 24
3.3.4.2 Marketing Margin Analysis .................................................................................... 24
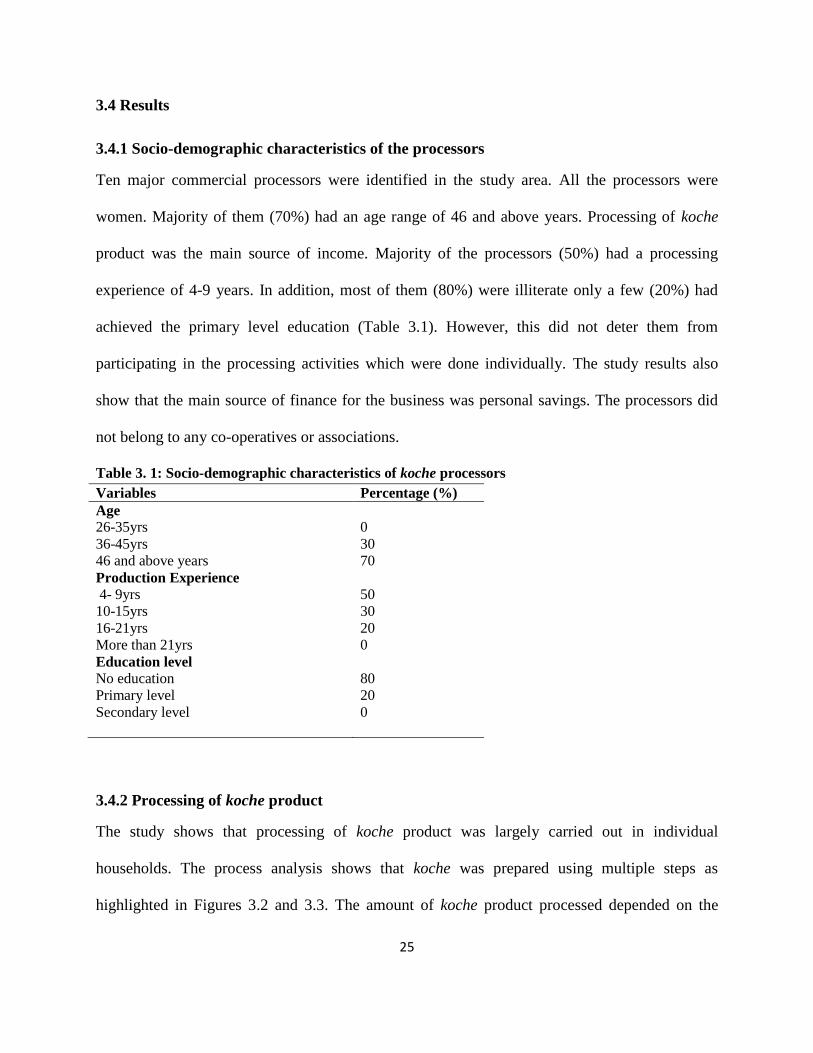
3.4 Results ..................................................................................................................................... 25
3.4.1 Socio-demographic characteristics of the processors ..................................................... 25
3.4.2 Processing of koche product ............................................................................................. 25
3.4.3 Labour division for processing Koche product ................................................................ 28
3.4.4 Costs and returns of Koche product ................................................................................. 28
3.4.5 Challenges faced by koche processors ............................................................................. 30
3.5 Discussion ............................................................................................................................... 30
3.6 Conclusion .............................................................................................................................. 32
CHAPTER FOUR: EVALUATION OF MARKET POTENTIAL OF KOCHE, A
TRADITIONAL PASTORAL MEAT PRODUCT FOR COMMERCIALIZATION IN KENYA
....................................................................................................................................................... 33

xi
4.1Abstract .................................................................................................................................... 33
4.2 Introduction ............................................................................................................................. 34
4.3 Materials and Methods ............................................................................................................ 35
4.3.1 Study Area ........................................................................................................................ 35
4.3.2 Study design ..................................................................................................................... 36
4.3.3 Sampling........................................................................................................................... 36
4.3.3.1 Consumer survey .................................................................................................... 36
4.3.3.2 Sample size determination ..................................................................................... 36
4.3.3.3 Traders survey ........................................................................................................ 37
4.3.4 Method of data collection ................................................................................................. 37
4.3.5 Data Analysis ................................................................................................................... 37
4.4 Results ..................................................................................................................................... 38
4.4.1 Socio-economic characteristics of the traders. ................................................................. 38
4.4.2 Marketing channel of Koche product ............................................................................... 40
4.4.3 Pricing and economics of koche marketing...................................................................... 40
4.4.4 Challenges faced by koche traders ................................................................................... 41
4.4.5 Association between Socio-demographic characteristics of consumers. ........................ 43
4.4.6 Reasons for consumption of koche .................................................................................. 45
4.4.7 Purchase points for koche . ............................................................................................... 46
4.4.8 Quantity of koche purchased by consumers. ................................................................... 47
4.4.9 Frequency of purchase of koche by consumers ................................................................ 48
4.4.10 Quality criteria used by consumers to purchase koche .................................................. 49
4.4.11 Factors influencing consumers likelihood to purchase different quantities of koche .... 50
4.4.12 Factors affecting purchase decisions by consumers. ...................................................... 52

xii
4.5 Discussion ............................................................................................................................... 52
4.6 Conclusion .............................................................................................................................. 54
CHAPTER FIVE: OPTIMIZATION AND UPGRADING OF KOCHE, A TRADITIONAL
MEAT PRODUCT PROCESSED BY PASTORAL COMMUNITIES IN KENYA. ................. 55
5.1Abstract .................................................................................................................................... 55
5.2 Introduction ............................................................................................................................. 55
5.3 Research design and Methodology ..................................................................................... 57
5.3.1 Experimental design .................................................................................................... 57
5.3.2 Sample collection and preparation. ............................................................................. 57
5.3.3 Processing.................................................................................................................... 58
5.3.4 Packaging .................................................................................................................... 60
5.3.5 Analytical methods ...................................................................................................... 60
5.3.5.1Chemical composition .......................................................................................... 60
5.3.6 Instrumental methods ....................................................................................................... 63
5.3.6.1 Determination of color ............................................................................................ 63
5.3.6.2 Determination of texture ......................................................................................... 63
5.3.7 Determination of microbiological quality ........................................................................ 64
5.3.8 Sensory Evaluation ........................................................................................................... 64
5.3.9 Accelerated shelf life analysis .......................................................................................... 64
5.3.10 Cost Analysis.................................................................................................................. 65
5.3.11 Statistical Analysis ......................................................................................................... 65
5.4 Results ..................................................................................................................................... 65
5.4.1 Nutritional composition.................................................................................................... 65
5.4.2 Consumer acceptability .................................................................................................... 66
5.4.3 Shelf life analysis. ............................................................................................................ 68

xiii
5.4.3.1 Effect of packaging and storage time on microbial quality of upgraded koche
product ....................................................................................................................................... 68
5.4.3.2 Effect of packaging and storage time on the chemical quality of upgraded koche
product ............................................................................................................................................ 69
5.4.3.3 Effect of packaging and storage time on the physical quality of upgraded koche
product ............................................................................................................................................ 70
5.4.4 Cost Analysis.................................................................................................................... 72
5.5 Discussion ............................................................................................................................... 72
5.5.1 Nutritional quality ............................................................................................................ 72
5.5.2 Consumer acceptability .................................................................................................... 73
5.5.3 Shelf life analysis ............................................................................................................. 74
5.5.3.1 Effect of packaging and storage time on the microbial quality of upgraded koche
product. ........................................................................................................................................... 74
5.5.3.2 Effect of packaging and storage time on the physicochemical quality of upgraded
koche product. ................................................................................................................................ 74
5.6 Conclusion .............................................................................................................................. 77
CHAPTER SIX: GENERAL CONCLUSIONS AND RECOMMENDATIONS ........................ 78
6.1 General conclusions ................................................................................................................ 78
6.2 General recommendations ...................................................................................................... 78
REFERENCES ............................................................................................................................. 79

xiv
LIST OF TABLES
Table 2. 1: Kenya statistics for livestock numbers in millions of animals. .................................... 6
Table 2. 2: Licensed local abattoirs ................................................................................................ 7
Table 3. 1: Socio-demographic characteristics of Koche processors ............................................ 25
Table 3. 2: Labour division and time required for processing 50kg of Koche product. ............... 28
Table 3. 3: Average costs and returns of Koche product processed from camel meat. ................ 29
Table 3. 4: Challenges faced by Koche processors ....................................................................... 30
Table 4. 1: Socio-demographic characteristics of traders in Koche marketing ............................ 38
Table 4. 2: Channel of Koche product during marketing.............................................................. 40
Table 4. 3: Challenges faced by Koche traders ............................................................................. 41
Table 4. 4: Association between selling place and challenges facing Koche traders .................. 42
Table 4. 5: Association between demographics and monthly profit obtained by the traders ...... 43
Table 4. 6 : Association between age groups and Socio-demographic characteristics of
consumers ..................................................................................................................................... 44
Table 4. 7: Predictor factors of quantity of Koche purchased by consumers .............................. 51
Table 5. 1: Salts and spices per kg of raw meat ............................................................................ 57
Table 5. 2: Nutritional composition of raw meat samples (control) and Upgraded Koche samples
....................................................................................................................................................... 66
Table 5. 3: Sensory scores of Koche ............................................................................................. 67
Table 5. 4: Effect of packaging and storage time on the microbial quality of upgraded koche
product. ......................................................................................................................................... 69
Table 5. 5: Effect of packaging and storage time on the chemical quality of upgraded Koche
product. ......................................................................................................................................... 70
Table 5. 6: Effect of packaging and storage time on the physical quality of upgraded Koche
product .......................................................................................................................................... 71
Table 5. 7: Variable costs involved in producing koche product ................................................. 72
Table 5. 8 : Fixed Asset Costs involved in producing koche product .......................................... 72
xv
LIST OF FIGURES
Figure 2. 1: Wooden containers ................................................................................................. 13
Figure 2. 2: Metallic container ...................................................................................................... 13
Figure 3. 1: Map of Kenya showing the study areas..................................................................... 22
Figure 3. 2: Flow chart for Koche processing ............................................................................... 27
Figure 3. 3: Pictorial representation of traditional processing of koche product. ......................... 27
Figure 4. 1: Study regions for Koche market potential ................................................................. 35
Figure 4. 2: Distribution of Koche traders by age ( years) ........................................................... 39
Figure 4. 3: Distribution of the traders based on their experience in years. ................................. 39
Figure 4. 4: Monthly profit declared by the traders interviewed .................................................. 41
Figure 4. 5: Income distribution of Koche consumers .................................................................. 45
Figure 4. 6: Reasons for consumption of Koche. .......................................................................... 46
Figure 4. 7: Purchase points of Koche. ......................................................................................... 47
Figure 4. 8: Quantity of Koche purchased by consumers. ............................................................ 48
Figure 4. 9: Frequency of purchase of Koche. .............................................................................. 49
Figure 4. 10: Quality criterion used by consumers at the point of purchase of Koche. ................ 49
Figure 4. 11: Factors affecting purchase decisions by consumers. ............................................... 52
Figure 5. 1: Steps laboratory scale upgraded Koche processing ................................................... 59
Figure 5. 2: upgraded Koche product ............................................................................................ 59

xvi
LIST OF APPENDICES
Appendix 1: Focus group discussion guide ( processors) ............................................................ 96
Appendix 2: Key informant interview guide ............................................................................... 97
Appendix 3: Questionaire (trader survey).................................................................................... 98
Appendix 4: Questionaire (consumer survey) .......................................................................... 101
Appendix 5: Sensory evaluation score sheet. ............................................................................ 104
Appendix 6: Consent form ......................................................................................................... 105

xvii
GENERAL ABSTRACT
Commercialization of indigenous meat products is one of the major strategies for promoting and
preserving indigenous knowledge. Commercialization of indigenous meat products can
contribute to increased incomes and non-income benefits for processors and marketers. However
indigenous meat products lack a competitive advantage along the formal meat value chains due
to challenges in regards to processing, handling and storage. Koche is an indigenous ready to eat
meat snack prepared from beef, camel or goat meat by the Borana community in Northern
Kenya. The potential commercialization of Koche is largely dependent on the processing and
market development. It was against this background that the project was conceptualized. The
main objective was to determine the commercial viability of Koche with a view of
mainstreaming the product into the formal meat chains. To accomplish this, the study was
designed to assess the current status of processing and process analysis of Koche . This study
also sought to evaluate the market potential of Koche. Focus group discussions and key
informant interviews were used to collect data from 10 processors. Structured questionnaire
interviews were also used to collect data from 196 consumers and 30 traders. The findings show
that the processing of Koche relies largely on traditional techniques often with low
competitiveness. Lack of equipment to ease processing of Koche (100%), lack of credit facilities
(100%), insufficient capital (90%) and high cost of inputs (90%) were some of the main
challenges facing Koche processors. Analysis of Koche returns to labour and variable cost were
Kshs 12.1 and Kshs 0.92 respectively. The market outlets for Koche include sale in stalls (20%),
street vending (73.3%) and Hotels (6.7%). Strict regulations by city council (30%), poor product
quality (60%), and poor packaging material (46.7%) affected the marketability of Koche.
According to the traders, the average number of consumers buying Koche was 5 to 10 per day.

xviii
The pastoral communities (89.3%) were the main consumers. At the same time other
communities were reported to consume Koche. Koche was mainly bought since it was a cultural
food and also due its health benefits. Significant predictors (p< 0.05) in the quantity of Koche
purchased included income, ethnicity and household size. The process analysis of Koche was
used to upgrade the indigenous meat product to a commercial level. The physicochemical and
microbial qualities of Koche were within the acceptable limit up to day 5 of accelerated storage
at 55oC. Koche packed in glass jars exhibited better keeping quality. The study concludes that
promoting commercial Koche processing and marketing is one of the most important approaches
for increasing the market share of Koche . This can support sustainable development of Koche
through increased incomes for processors and marketers thus improved livelihoods. It can also
ensure the enhancement and conservation of indigenous knowledge. However, to augment these
objectives the challenges facing processors and traders should be seriously addressed.

1
CHAPTER ONE: GENERAL INTRODUCTION
1.1Background information
Food and Nutrition Security is global concern. It is a challenge to the human welfare and
economic growth. Food losses have an impact on food and nutrition security. Globally, around
one third of the food is lost. In Sub-Saharan Africa, the estimate is 37 percent or 120-170kg/ year
per capita (FAO, 2011). Food losses may occur during production, processing stages and post –
harvest. Losses are a result of inappropriate post-harvest handling, processing and preservation
(Parfitt et al., 2010).
The valuable contributions of indigenous knowledge to food security cannot be ignored. In
Africa, people have utilized indigenous knowledge to ensure food security (Oniango et al.,
2006). Indigenous knowledge is accumulated knowledge of the local people through interaction
with the local environment (Mapara, 2009). This knowledge often relies on intuition and is
passed down from one generation to the next (Awour, 2011). In a community, women are
particularly one group who hold enormous indigenous knowledge and play a significant role to
ensure food security (Brown, 2011).
In sub-Saharan Africa, there are about 20 million pastoralists. About 6 million of them are in
Kenya’s ASALS. The pastoralists include the Somali, Maasai, Borana, Turkana, Rendille,
Samburu and Pokot (KNBS, 2009). Their economic activities and main diets depend entirely on
livestock and livestock products (Wellard-dyer, 2012; Kirkbride and Grahn, 2008). The pastoral
communities overtime have relied on indigenous knowledge of food processing with a view of
preventing meat loss and ensuring its stability. Sun-drying ,deep frying ,salting and use of spices

2
are some of the techniques that have been practised. The oldest technique used is sun-drying
(FAO, 1995).This has led to development of different meat products (Gichure et al., 2014).
Previous studies on indigenous meat products produced by the pastoral communities indicated
that majority are made for home consumption with little in the way of commercialization
(Gichure et al., 2017). Women who are the main processors lack enough resources and
knowledge on good manufacturing practices. In addition, chances of product contamination are
high since the meat is suspended on ropes to dry under the sun. Other challenges include
presence of too much oil in the products, improper packaging system and quality variation. As a
result, the products lack a competitive advantage thus not able to access the formal markets
(Gichure et al., 2017).
1.2 Problem statement
Koche product is an appropriate functional food when viewed in terms of nutritional content.
Koche product can provide the much needed source of protein and other nutrients. Being a
dehydrated food product it makes handling and marketing convenient for consumers and retailers
(Dabaso et al., 2018). Despite this potential, most of the households in the ASALs do not view
Koche processing as a commercial undertaking and as such practice it for home consumption
(Dabaso et al., 2018) .Therefore, they do not harness the commercial benefits associated with it.
In addition, studies have documented a number of challenges hindering commercialization of
koche product including poor quality and hygiene, lack of standardization, lack of knowledge in
good packaging material, lack of branding and trademark, inadequate resources by processors
and lack of competitiveness in the formal market. Hence the product only dominates the informal
markets (Gichure et al., 2014).

3
1.3 Justification
Meat is important in the human diet. It contributes valuable nutrients required for growth and
maintenance for health (Apata et al., 2013). Consumption of meat and meat products is higher
especially in developing countries (Anjaneyulu et al., 2007). Hence this study seeks to determine
the commercial viability of koche product to enable product mainstream into the formal market
for increased incomes by processors thus improved livelihoods. Commercialization of koche
product and adequate marketing can cater the pallete of this population and address the huge
demand. It will help in converting the local industry into global industry thus generate
employment opportunities and self-sustainability. It will also enhance entrepreneurship
development and ensure quality ethnic products to the consumers. Commercialization of koche
product may also serve as an incentive to the younger generation and help in preservation of
indigenous knowledge. Finally, the study findings may be used to formulate policies by relevant
policy makers.
1.4 Study aim
The aim of the study is to contribute to the reduction of postharvest losses in the meat value
chain and to wealth creation through commercialization of koche by value addition.
1.5 Study objectives
1.5.1 Main objective
The main objective is to evaluate the commercial viability of koche, a traditional pastoral meat
product prepared in Kenya.

4
1.5.2 Specific objectives
1. To assess current status of processing and analysis of koche product to understand
challenges and opportunities for commercialization.
2. To evaluate market potential of koche product for commercialization in Kenya.
3. To optimize the production of koche under ideal processing conditions for its
commercialization.
5
CHAPTER 2: LITERATURE REVIEW
2.1 Meat value chain
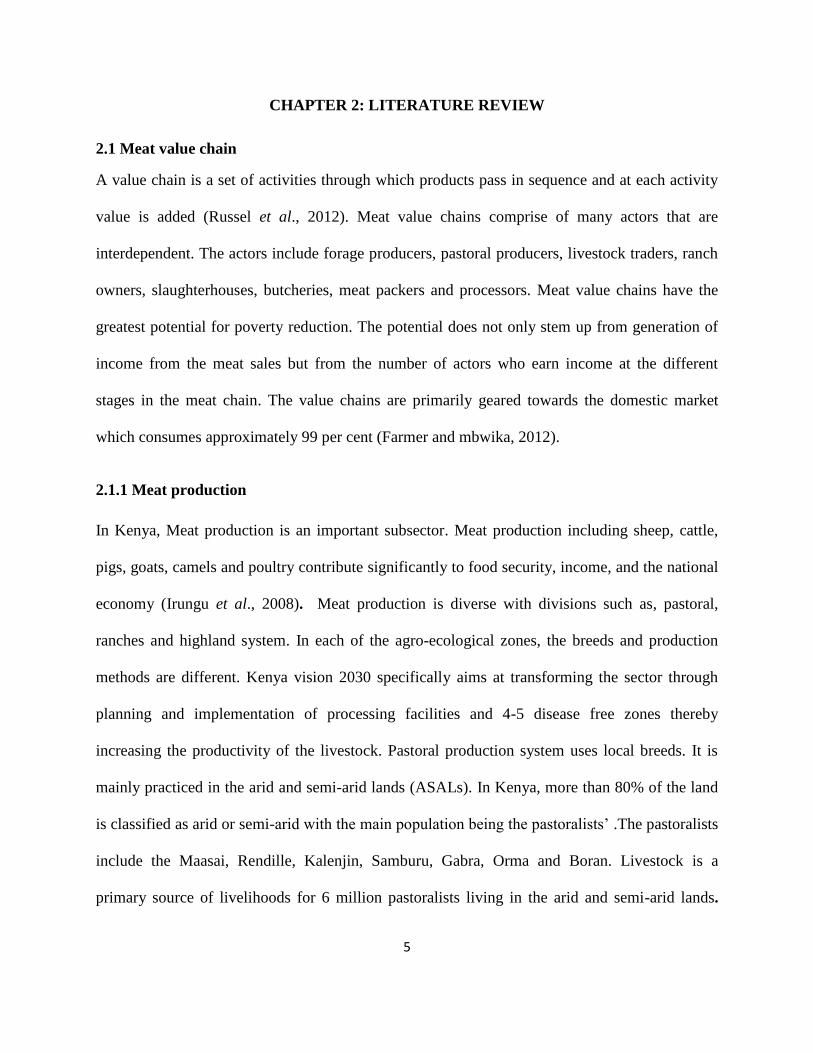
A value chain is a set of activities through which products pass in sequence and at each activity
value is added (Russel et al., 2012). Meat value chains comprise of many actors that are
interdependent. The actors include forage producers, pastoral producers, livestock traders, ranch
owners, slaughterhouses, butcheries, meat packers and processors. Meat value chains have the
greatest potential for poverty reduction. The potential does not only stem up from generation of
income from the meat sales but from the number of actors who earn income at the different
stages in the meat chain. The value chains are primarily geared towards the domestic market
which consumes approximately 99 per cent (Farmer and mbwika, 2012).
2.1.1 Meat production
In Kenya, Meat production is an important subsector. Meat production including sheep, cattle,
pigs, goats, camels and poultry contribute significantly to food security, income, and the national
economy (Irungu et al., 2008). Meat production is diverse with divisions such as, pastoral,
ranches and highland system. In each of the agro-ecological zones, the breeds and production
methods are different. Kenya vision 2030 specifically aims at transforming the sector through
planning and implementation of processing facilities and 4-5 disease free zones thereby
increasing the productivity of the livestock. Pastoral production system uses local breeds. It is
mainly practiced in the arid and semi-arid lands (ASALs). In Kenya, more than 80% of the land
is classified as arid or semi-arid with the main population being the pastoralists’ .The pastoralists
include the Maasai, Rendille, Kalenjin, Samburu, Gabra, Orma and Boran. Livestock is a
primary source of livelihoods for 6 million pastoralists living in the arid and semi-arid lands.

6
Statistics show that the largest share of the ruminant in the country is from the arid and semi-arid
informal sector. Ownership of livestock depends on the pastoral groups with the Kalenjin,Maasai
and Samburu owning mostly cattle and Turkana and Rendille mostly camels. However,
pastoralists especially from the northern zone are exposed to droughts causing them to lose about
50% of their livestock. Thus most of the livestock sales often occur during the dry seasons.
Cattle ranching are mainly practiced in the Laikipia plateau. Most of the ranches are owned by
settlers but now they are in the hands of the local elite. Some of the ranches such as olpejata,
loisaka, sosian, el karama are owned by the government. The ranches play both role of a
producer and fattener. The cattle produced are usually of high quality and safety. The highland
production system is mainly based on british beef and dairy breed. The highland cattle are
estimated at 5,311,800 with an estimated off-take rate of 7.9% (Farmer and Mbwika, 2012).
Table 2. 1: Kenya statistics for livestock numbers in millions of animals.
Year 2000 2005 2010 2012
Cattle and buffaloes 11.44 13.02 17.86 19.13
Sheep and goats 17.74 23.92 45.74 47.58
Poultry birds 26.29 26.86 30.40 32.87
Pigs 0.31 0.32 0.35 0.35
Source FAO, Statistics
2.1.2 Traders
Traders are either primary or secondary. Primary traders purchase animals in small scale from
the producers and re-sale to large traders, exporters, butchery owners, while secondary traders
buy larger numbers of livestock from producers as well as primary traders and sell in terminal
markets. Trucks are used in transportation of the animals. The market concentration of secondary
traders is higher compared to primary traders. Most of the secondary traders form partnerships to
7
share costs. However most of the traders buying in primary markets face a number of constraints
such as high capital requirements, limited business skills, illiteracy and weak legal back up
(Farmer and Mbwika, 2012).
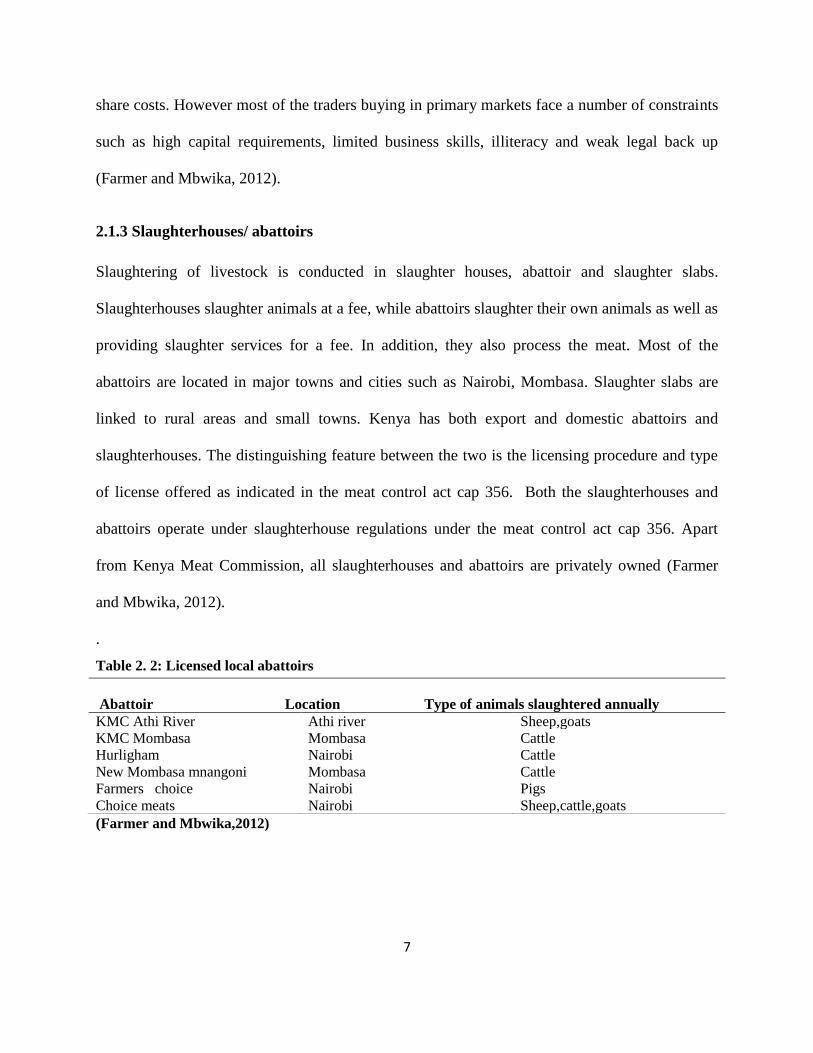
2.1.3 Slaughterhouses/ abattoirs
Slaughtering of livestock is conducted in slaughter houses, abattoir and slaughter slabs.
Slaughterhouses slaughter animals at a fee, while abattoirs slaughter their own animals as well as
providing slaughter services for a fee. In addition, they also process the meat. Most of the
abattoirs are located in major towns and cities such as Nairobi, Mombasa. Slaughter slabs are
linked to rural areas and small towns. Kenya has both export and domestic abattoirs and
slaughterhouses. The distinguishing feature between the two is the licensing procedure and type
of license offered as indicated in the meat control act cap 356. Both the slaughterhouses and
abattoirs operate under slaughterhouse regulations under the meat control act cap 356. Apart
from Kenya Meat Commission, all slaughterhouses and abattoirs are privately owned (Farmer
and Mbwika, 2012).
.
Table 2. 2: Licensed local abattoirs
(Farmer and Mbwika,2012)
Abattoir Location Type of animals slaughtered annually
KMC Athi River Athi river Sheep,goats
KMC Mombasa Mombasa Cattle
Hurligham Nairobi Cattle
New Mombasa mnangoni Mombasa Cattle
Farmers choice Nairobi Pigs
Choice meats Nairobi Sheep,cattle,goats

8
2.1.4 Processors
Many of the abattoirs such as Kenya Meat commission (KMC), Farmers choice and choice meats
are also processors. KMC was established by an act of parliament, CAP 363 laws of Kenya in
1950. Its mandate is to provide a ready market for livestock farmers and process meat and meat
products for local and export markets (Kenya Meat Commission Audit Report, 2008). Some of
the products processed include corned beef, corned ox-tongue and bone meal. They also grade
the meat into grades such as commercial, prime, standard, choice and fair average quality (FAQ).
The commercial grade is the lowest and used for canning and manufacture of sausages. Farmer’s
choice is private meat processor specializing in pork and pork products such as sausages,
burgers, bacon and ham. Choice meat is a subsidiary of Farmer choice specializing in processing
of cattle, goat and sheep of high quality (Farmer and Mbwika, 2012).
2.1.5 Markets
Retailing of meat and meat products is done in local markets, butcher shops, supermarkets and
cooked meat outlets (Farmer and Mbwika, 2012). Local markets represent the largest share of
meat market. Meat on bone, green and white offal is mainly displayed without refrigeration
(Gichure et al., 2014). Middle market is mainly patronized by medium income group. It mainly
offers steak and meat on bone. Refrigeration and chilling is occasionally done to extend the
shelflife (Gichure et al., 2014). High end markets are characterized by high quality meat grades
such as choice and Fair average quality (FAQ). The meat is supplied fresh and displayed under
refrigeration facilities. High end markets charge a premium for their meat since their source of
supply is mainly the ranches and their buyers include the high income consumers (Gichure et al.,
2014).

9
2.1.6 Consumers
In Kenya, 44.6 million people have a strong culture of meat consumption (Kenya Market trust,
2014). More than 80% of the meat consumed is from cattle, chicken, goat, sheep and camel.
However beef represents the most consumed meat. For red and white meat, consumption is
estimated at 10.8kg and 1.1kg (MAL and F, 2015). An average of 16kg to 19kg per capita/year is
consumed in urban low and low income areas respectively (USAID, 2012). Nairobi and
Mombasa largely consume estimated total volumes of 17% (Kenya Market trust, 2014).
Consumers buy different cuts such as meat on bone, boneless, minced, offals, liver and head.
2.2 Losses reduction through meat value addition
The issue of food loss is of great concern. Food loss refers to reduction of the edible mass of
food throughout the supply chain (Parfit et al., 2010). Food loss results in food insecurity. It is a
waste of resources such as water, and also loss in economic value of food .In developing and
industrialized countries more than 40% of food losses occur at post-harvest and consumer levels
respectively. In general, post-harvest losses in meat account for 29.7% (FAO, 2011). In the arid
and semi-arid lands of Kenya, post slaughter losses occur due to lack of technical facilities,
technical skills for processing, packaging and storage ,capacity for new product development and
diversification as well as information on postharvest losses (Pavahello, 2010; Gichure et al.,
2014). Strategies such as use of sanitary procedures and value addition can be used to reduce the
meat losses (Mathi et al., 2016)
2.3 Indigenous meat products
Meat is highly perishable at ambient temperature thus the importance of its preservation (Apata
et al., 2013). Traditionally, preservation of meat has been practiced using techniques such as sun

10
drying, deep frying, smoking, spicing and under oil preservation (FAO, 2007). As a result
different dried, salted, smoked and fried meat products have been developed and are widely
found in Africa (FNISF, T2008). Some of the indigenous meat products include the following;
2.3.1 Biltong
Biltong is a traditional meat product prepared from beef, ostrich or game meat in South Africa.
The popular muscles used are thick flank (rectus abdominus), eye of round (semitendinosus), top
side (semimembranosus), fillet (psoas) and silverside (biceps femoris) (CSIR, 2001; Van Wyk,
2007; Strydom and Zondagh, 2014). The meat is cut into long strips. Salt, spices and vinegar is
then added. The meat strips are hung on hooks and air dried for one or two weeks. After drying,
the biltong is packed and stored (Jones et al., 2017).
2.3.2 Kilishi
Kilishi is an indigenous meat product prepared from beef or goat in Nigeria. Meat is cut into
slices and dried for six hours. Semi-dried meat slices are soaked in marinades that contain water,
garlic, onions and spices. After immersion, the wet meat products are heat treated by roasting for
5 mins (FAO, 1990).
2.3.3 Suya
Suya is roasted indigenous meat product of Nigeria prepared from mutton, beef or goat meat.
The meat is seasoned with powdered groundnut cake, spices, vegetable oil, salt, flavours and
then roasted around a glowing smokeless fire. (Omojola, 2008).

11
2.3.4 Koche
Koche is a traditional deep fried meat product made from particular/specific muscles of sirloin or
silverside steak of beef, camel or goat carcass by women among the Borana community in
Kenya. It resembles nyirinyiri in appearance. First step in preparation involves removal of fat
from the meat. Lean meat is stripped. The meat strips are mixed with salt and suspended on
ropes to dry. According to the processors, the inclusion of fatty meat does not make the best
koche. After drying, the meat strips are comminuted into small cubes and deep fried in oil.
Cardamom spice is added during frying to impart flavor. It is then cooled and stored in the oil
used for frying (Dabasso et al., 2018).
2.3.5 Enyas
Enyas is a deep fried fibrous meat product prepared from beef or goat meat by the Turkana
community in Kenya. During preparation, fresh beef or goat meat steak is sliced into several
strands, mixed with salt and sun-dried on wooden sticks. After drying, the strands are cut in to
cubes. The meat cubes are deep fried in ghee for 90 mins. After frying, it is cooled and stored
(Gichure et al ., 2014).
2.3.6 Olpurda
Olpurda is an indigenous meat product prepared from beef or goat meat by the Maasai
community in Kenya. Fresh beef or goat meat steak is cut into small cubes ranging from 4mm*
to 10mm in size. The meat cubes are then boiled in water for 120 minutes. After boiling, the
water is drained off and the cubes deep fried in kneaded animal fat (Gichure et al., 2014).

12
2.3.7 Fonn tumma.
Fonn tumma is a traditional pounded meat product of Kenya. It is prepared from beef or goat
meat by women among the Borana community. Fresh beef or goat meat is cut into strips, mixed
with salt and suspended on ropes to dry under the sun. After drying, the meat strips are roasted
and pounded with addition of barley then deep fried in oil. The product is cooled and stored
(Dabasso et al., 2018).
2.3.8 Guba
Guba is a deep fried and fatty meat product prepared from beef or goat by the Borana
community in Kenya. It is similar to koche in preparation. However, fatty meat is not trimmed
off. Meat from the hind legs is cut into strips. Amount of salt is added on the strips. The meat
strips are then suspended to dry on ropes. The dried meat strips are cut into small pieces and
deep fried in oil. Spices such as cardamom are added during frying and the product finally stored
in fat (Dabasso et al., 2018).
2.3.9 Kataweel
Kataweel is a shallow fried meat product prepared from beef or goat meat by the Borana
community in Kenya. Meat from the hind legs is cut into strips. Fatty meat is removed. Amount
of salt is added on the strips. The meat strips are suspended on ropes to dry. After drying, they
are cut into small cubes and shallow fried. Cardamom spice is added to impart flavor. After
frying, the product is cooled and stored in fat (Dabasso et al., 2018).
13
2.3.10 Fonnqadabbe
Fonnqadabe is a traditional dried meat product prepared from beef or goat meat steak by the
Borana community in Kenya. The meat is cut into strips and mixed with salt. The meat strips are
then roasted over charcoal fire. After roasting, the product is cooled and stored in fat (Dabasso
et al., 2018).
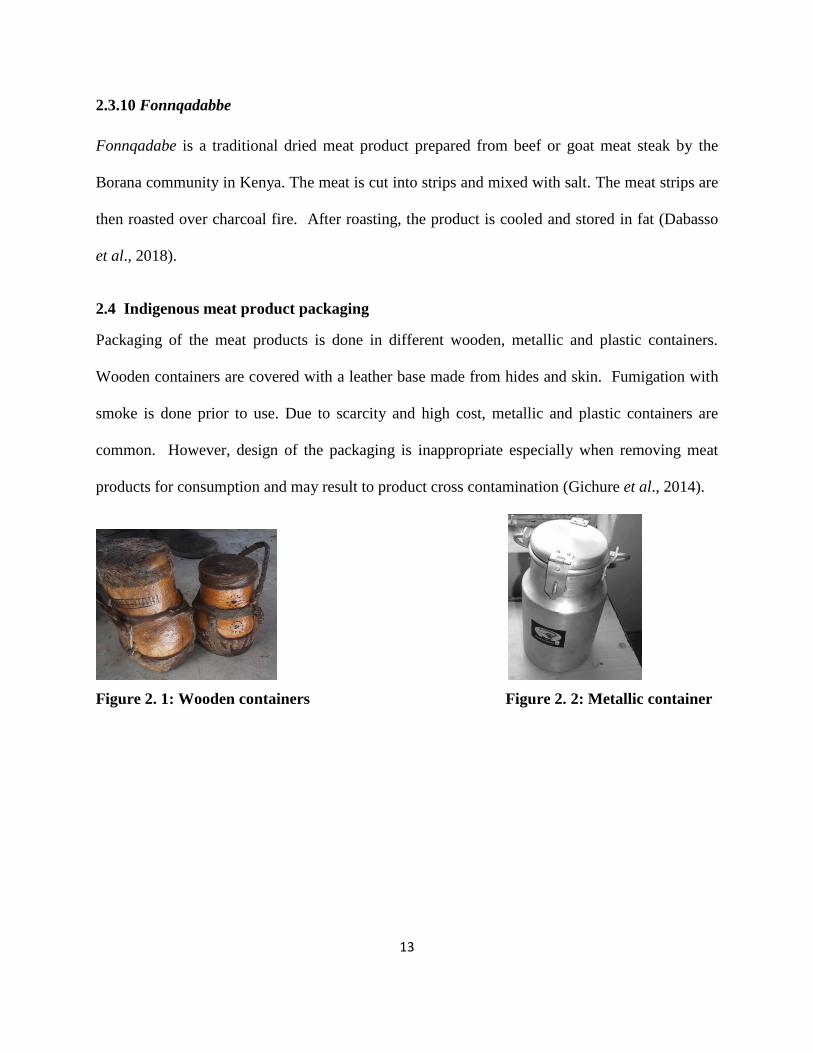
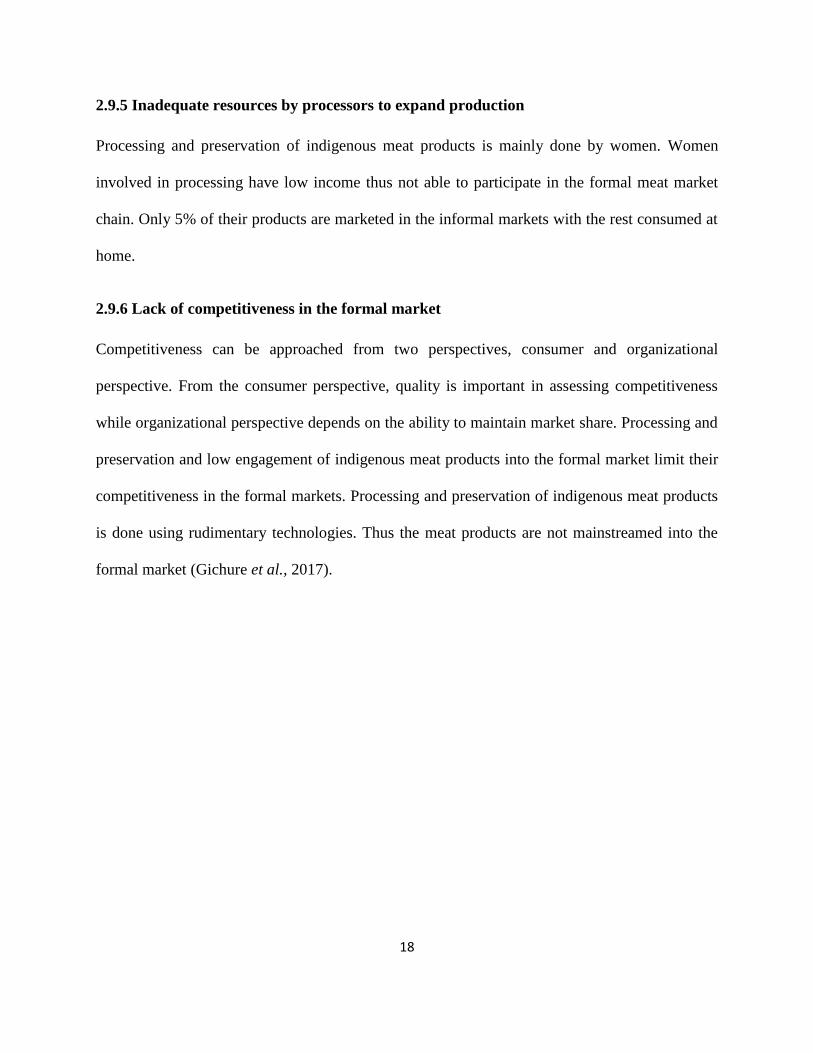
2.4 Indigenous meat product packaging
Packaging of the meat products is done in different wooden, metallic and plastic containers.
Wooden containers are covered with a leather base made from hides and skin. Fumigation with
smoke is done prior to use. Due to scarcity and high cost, metallic and plastic containers are
common. However, design of the packaging is inappropriate especially when removing meat
products for consumption and may result to product cross contamination (Gichure et al., 2014).
Figure 2. 1: Wooden containers Figure 2. 2: Metallic container

14
2.5 Informal markets
Rapid urbanization has led to the rise of the informal sector. Informal markets are common in
developing countries. They consist of small producers, traders and service providers involved in
legal as well as illegal activities (FAO, 2007). The informal market is a survival strategy used by
the urban poor in a bid to survive in difficult economic circumstances (FAO, 2007). Informal
markets are large making a significant contribution of about 39% to the GDP. Limited work
opportunities in the formal sector have resulted in the expansion of the informal markets (Gadaga
et al., 2014). They are characterized by many actors, easy entry and traditional products are
predominantly sold (Makita et al., 2010).
2.5.1 Street Food vending
Street food vending is significant part of the informal sector. It includes selling from fixed
kiosks, carts, mobile stands and cloth put on the streets (Walsh et al., 2010). It is an easy entry
business due to the small capital outlay required and most of the vendors are female (Iyenda,
2001; Acho-chi, 2002; Muyanja et al., 2011) .Street food vending contributes significantly to the
economy (Iyenda, 2001; Acho-chi, 2002). In Kenya, about 70% of the population in urban areas
depends on street foods (World Bank Report, 2005). Street food vendors are often found in
commercial areas of the city such as outside bus terminal and shopping centers where there are
ready and numerous customers (Roever, 2007). This exposes them to contamination thus are
normally associated with food containing hazards (Makita and Kangethe, 2010).
2.6 Formal markets.
In developing countries, market formalization has become a reality. However, small holder
integration into formal market requires investments and pro-active policies (World Bank, 2005).

15
Interventions such as effective policies, creation of suitable environment can help reduce market
barriers to market participation.
2.6.1 Supermarkets.
Supermarket industry is the most developed growing at a rate of 18% per annum (Neven and
Reardon, 2004). The emergence of supermarkets and hypermarkets culture has greatly increased
(Wells et al., 2007). They reflect a change in the way food products are supplied to consumers
(Omiti et al., 2005). Supermarkets have an attractive shopping atmosphere; products are well
packaged, premises are very clean and consumers willingly pay a premium for these attributes
(FAO, 2013). However, high income consumers are the major buyers. A study by Gichure and
others (2014) discovered a great variety of meat products in supermarkets. Meat products
arrangement on the fridge shelf depends on the preservation and processing technique employed
during production.
2.7 Conceptual framework of commercialization of food products.
Based on literature review commercialization is a complex process. However, they are certain
pathways when adopted success is guaranteed (Ismael et al.,2015). According to Amran and
Aslan, (2012) success will depend on the type of products commercialized. Commercialization
pathway should be identified at the onset of research and development. Creation of value through
commercialization will depend before product development (Hamzah et al., 2011). Idea creation
is the first stage. Idea generated should have a strong demand in the market. Market analysis will
generate information regarding existing problems and demand of the product, target market
segments and potential areas for growth of market and consumers. Lack of understanding of
local markets may compromise the effectiveness of commercialization. During product

16
development, technical skills, use of appropriate facilities and relevant technology is important to
ensure products of good quality are developed and subsequently commercialized. Product should
be able to compete well with existing products in the market. Product packaging and promotion
is also an important element to be considered before commercialization. Suitable packaging will
prevent contamination of the product whereas promotions will create awareness to the target
consumers in the market thus ensuring successful commercialization (Ismael et al., 2015).
2.8 Cost benefit analysis of a food product
Cost benefit analysis is a systematic approach to estimate the strengths and weaknesses of project
investments. (Rodreck et al., 2013). It is done to determine whether an investment is worth by
verifying its benefits against the costs involved. It also provides a basis for comparison of
projects. It is related to cost effective analysis. However, in cost benefit analysis, benefits and
costs are expressed in monetary value and adjusted for the time value money so that all flows of
benefits and project costs overtime are expressed in terms of their net present value (Weimer et
al., 2005).
2.9 Challenges in commercialization of indigenous meat products
Indigenous meat products are a significant element and heritage of a country. In recent years,
consumers’ interest in traditional meat products has increased (Kardivel et al., 2017). However,
commercialization of indigenous meat products is constrained by a number of factors such as;
2.9.1 Poor quality and hygiene
Quality and hygiene is an important primary factor for commercialization (Kardivel et al.,
2017).However, Traditional meat handlers are ignorant about maintenance of quality and
hygiene requirements in the preparation of indigenous meat products. Several authors (Kisembe

17
et al., 2015; Gichure et al., 2014) have identified poor hygiene in processing of traditional meat
products.
2.9.2 Lack of standardization
Standardization of indigenous meat products is a step forward towards commercialization.
Standardized procedure can help the indigenous meat products to access markets (Kardivel et al.,
2017). However, indigenous meat products lack standardization in product quality thus not
properly mainstreamed into the formal markets (Gichure et al., 2017).
2.9.3 Lack of knowledge in good packaging material
Packaging is an essential component of a food system. Packaging helps to ensure quality and
safety of the food product. Packaging is also an important marketing strategy. It is used as a
competitive tool to bring about competitive advantage during marketing of a food product.
(Kardivel et al.,2017). However, packaging of indigenous meat products is not attractive and it
exposes the product to vagaries of the weather.
2.9.4 Lack of branding and trademark
Branding is a strategy for market segmentation and product differentiation (Kapferer, 2004). A
brand is a bundle of intangible and tangible features which makes the product attractive beyond
its functional value. Branding instills confidence in the consumer. Therefore, it is imperative
that indigenous meat products are branded so as to make them more competitive. And also help
in the development of the product image in the minds of the consumer thus deeper penetration
into the market (Kardivel et al., 2018).
18
2.9.5 Inadequate resources by processors to expand production
Processing and preservation of indigenous meat products is mainly done by women. Women
involved in processing have low income thus not able to participate in the formal meat market
chain. Only 5% of their products are marketed in the informal markets with the rest consumed at
home.
2.9.6 Lack of competitiveness in the formal market
Competitiveness can be approached from two perspectives, consumer and organizational
perspective. From the consumer perspective, quality is important in assessing competitiveness
while organizational perspective depends on the ability to maintain market share. Processing and
preservation and low engagement of indigenous meat products into the formal market limit their
competitiveness in the formal markets. Processing and preservation of indigenous meat products
is done using rudimentary technologies. Thus the meat products are not mainstreamed into the
formal market (Gichure et al., 2017).

19
CHAPTER THREE: STATUS AND PROCESS ANALYSIS OF KOCHE, A
TRADITIONAL PASTORAL MEAT PRODUCT IN KENYA.
3.1 Abstract
Meat is an important dietary component of the pastoral communities living in marginalized
regions of Kenya. Indigenous meat processing and in particular koche processing plays a
significant role in economic and social life of the borana community. It contributes to animal
source protein as well as income generation as a livelihood activity by the borana community.
However, traditional processors face a number of challenges hindering further conventional
development. The study was designed to assess the status and process analysis of koche, costs
and returns of koche production and constraints limiting koche processors. A cross-sectional
survey was therefore carried out in Isiolo and Marsabit towns to assess and analyse processing of
koche product. Purposive sampling of all koche processors was used to identify study cohorts.
Qualitative data were collected using key informant interviews and focus group discussions.
Results revealed that all processors were women who largely relied on traditional techniques
often with low competitiveness and poor efficiency. The major constraints facing processors
were lack of equipment to ease processing (100%), lack of credit facilities (100%), insufficient
capital (90%) and high costs of inputs (90%). The return to labour and variable costs was Kshs
12.1 and Kshs 0.92 respectively while the marketing margin was estimated as 20.8%. Based on
the findings of the gross margin and analysis of returns, processing of koche product is a
profitable business thus a good investment opportunity. However, there is need to overcome the
challenges to enable the expansion of koche processing for better commercialization. Besides,
addressing the challenges will help reduce post-production losses and remove market barriers of

20
koche product. This will expand the market access of koche product and thereby increase
incomes of pastoral communities.
Key words: indigenous meat products, commercial viability, processing, profitability
Article published as: Werikhe,G., Kunyanga, C.N., Okoth, M.W.,and Roba, H.G. (2019). Status
and process analysis of koche,a traditional pastoral meat product in Kenya. Pastoralism,9 (6).
3.2 Introduction
Pastoralism is an economic activity that is based on animal production. It is largely practiced in
the arid and semi-arid lands (ASALs) and has shaped livelihoods for millennia. Livestock,
labour, access to grazing areas and water resources are key requirements for pastoralist
production (Homewood et al., 2012). In Kenya, pastoralism is a way of life for about 6 million
people living in the ASALs. The pastoral communities include the Somali, Maasai, Borana,
Rendille, Gabra and Turkana with an estimated livestock worth of US$ 800 million per year
(Lindqvist and Verba, 2009). Pastoral systems contribute significantly to the economy. About
70% of beef cattle in Kenya are from the ASALs under pastoral production systems (EPZA,
2005).
Overtime, pastoralists have relied on indigenous knowledge to add value to beef and beef
products. Local preservation techniques such as drying, salting, use of spices, deep frying were
employed for the sole purpose of increasing shelf life, prevent spoilage and enhance flavor and
taste (Rai et al., 2009; Bora and Bam, 2014 ; Gichure et al., 2014). As a result, a variety of
indigenous meat products have been developed including enyas, olpurda, nyirinyiri and koche.
The indigenous meat products are region specific and have unique substrates and preparations.
21
Preparations depend on culture, climate, process and availability of materials (Gichure et al.,
2014).
Koche, is a dried traditional meat product which undergoes various stages of processing. It is
made from beef, camel or goat muscle particular from the sirloin or the silverside steak. It is a
dehydrated food product as moisture is reduced in different ways during processing. As a way of
preservation, women among the borana community cut meat into thin strips to dry under the sun
for two or three days. Additionally, they deep fry the meat to evaporate more moisture (Dabasso
et al., 2018).
In the context of human nutrition, food processing is important. Food processing adds variety
and convenience in order to meet various lifestyle requirements. It also plays an important role in
the national economic development (Sharma and Kondaiah, 2005). However, current research
has shown that indigenous meat processing by the pastoral communities faces a number of
constraints hindering further development. Though many of the traditional meat products have
great potential they are made only for human consumption with little in the way of
commercialization (Gichure et al., 2014). This study was hence conducted with the ultimate aim
of assessing the status of processing of koche product to highlight challenges and opportunities
for the industry’s development and prosperity.
3.3 Materials and methods
3.3.1 Study Area
The study was conducted in Marsabit and Isiolo counties. The two counties were purposively
selected since majority of the residents are of pastoral origin and depend largely on meat and

22
milk products for their basic food needs (Homewood et al., 2012). Marsabit County has a
population density of about 291,166 people. The area receives an annual rainfall range of 200mm
to 1000mm. Temperature ranges from a minimum of 10oC to a maximum of 30oC with an
average of 20oC (KNBS, 2009). Isiolo County has a population density of about 143,294 people
(KNBS 2009).The area is typical semi-arid. It receives an annual rainfall of 418mm (Mati et al.,
2005). The area receives annual rainfall of 418mm (Mati et al., 2005). The rainfall pattern is
bimodal and erratic in distribution. Average annual temperatures range from 24oC to 30oC
(Herlocker et al., 1993). Figure 3.1 shows the counties and towns visited.
Figure 3. 1: Map of Kenya showing the study areas.
23
3.3.2 Study design
The design was cross sectional consisting of a survey in the two counties.
3.3.3 Sampling and data collection
A total of 10 processors were purposively identified as study cohorts. The selection of the
processors was based on knowledge of indigenous meat processing and those involved in
commercial processing. Focus group discussions were conducted with processors to assess the
current status of processing of koche product. The focus group discussions had eight to ten
participants. A checklist guide was used to guide the data collection. The questions focused on
traditional processing and preservation, challenges and benefits. To triangulate data received
from (FGDs), Key informant interviews (KIIs) were conducted with the processors. Unstructured
interview guides were used to guide the data collection. The questions in the guide were focused
on socio-economic characteristics of koche processors, traditional processing and preservation,
inputs used in koche processing, quantities used, unit prices, production output, challenges and
opportunities. Observations of processing and hygiene was also done and recorded in the field
notebook.
3.3.4 Data Analysis
Qualitative data collected through (FGDs) and (KIIs) were entered in Nvivo application, grouped
and analysed to bring about the proportions and narratives. Observations were also recorded in
the application and summarized in paragraphs. Inferential statistics such as gross margin analysis
and marketing margin analysis were used. Descriptive statistics such as percentages was used to
represent the input variables used and returns obtained.

24
3.3.4.1 Gross margin model
Gross margin analysis was used to determine the profitability of koche processing in the study
area. It was expressed as follows:
GM = GR – TVC
Where: GM = Gross margin of meat used (Kshs)
GR = Gross revenue (Kshs)
TVC = Total variable costs of meat used (Kshs) (Iliyasu et al., 2013)
Gross margin was used because the fixed costs of processing of koche product are negligible
(Iheanacho and Philip, 2002).
3.3.4.2 Marketing Margin Analysis
Percentage marketing margin is the difference between the sales revenue and the cost price
divided by the cost price and multiplied by 100 (Iliyasu et al., 2013).
The formula is expressed as follows:
MM= CPP – PRP X 100
CPP
Where MM = Marketing margin
CPP = Consumers paid price
PRP= Producer’s received price (Iliyasu et al., 2013)
25
3.4 Results
3.4.1 Socio-demographic characteristics of the processors
Ten major commercial processors were identified in the study area. All the processors were
women. Majority of them (70%) had an age range of 46 and above years. Processing of koche
product was the main source of income. Majority of the processors (50%) had a processing
experience of 4-9 years. In addition, most of them (80%) were illiterate only a few (20%) had
achieved the primary level education (Table 3.1). However, this did not deter them from
participating in the processing activities which were done individually. The study results also
show that the main source of finance for the business was personal savings. The processors did
not belong to any co-operatives or associations.
Table 3. 1: Socio-demographic characteristics of koche processors
Variables Percentage (%)
Age
26-35yrs
36-45yrs
46 and above years
Production Experience
4- 9yrs
10-15yrs
16-21yrs
More than 21yrs
Education level
No education
Primary level
Secondary level
0
30
70
50
30
20
0
80
20
0
3.4.2 Processing of koche product
The study shows that processing of koche product was largely carried out in individual
households. The process analysis shows that koche was prepared using multiple steps as
highlighted in Figures 3.2 and 3.3. The amount of koche product processed depended on the

26
orders received from traders. The average quantity processed per day was 50 kg. The raw
material used was camel or beef meat sourced from the butchery establishments. Salting was a
technique used with ingredients such as sodium chloride added (0.25%). Salting was done prior
to drying. Salting is a method of preservation that acts by reducing the water activity so there is
less water available for microbial growth thus increased shelf life. Drying allows the migration
of water from the product to the external environment leading to a decrease in water activity and
distribution of salts and other compounds in the product. Deep frying was done at 1000C oil
temperature for 30mins to further reduce the water activity. Addition of spice such as cardamom
(0.045%) was done during deep frying to impart flavor. After deep-frying, the product was
finally cooled and the quality evaluated based on taste and color only.
However, processors did not observe good manufacturing practices, often there was no running
water at the processing sites, and personnel involved in processing did not wear appropriate
protective clothing. Additionally, during drying of the product chances of contamination from
flies and dust was very high.

27
Meat (Camel or beef)
Trimming (to remove visible fat)
Addition of salt (0.25%) Size reduction (cutting into strips 20mm thickness size)
Drip-drying (3 hours)
Size reduction (Cutting into cubes 1cm x 1cmx1cm)
Addition of cardamon Deep frying ( 1000C, 30mins)
(0.045%)
Air cooling (6hours)
Packaging (in plastic buckets)
Figure 3. 2: Process analysis of koche, a traditional pastoral meat snack
A B
C D
Figure 3. 3: Pictorial representation of traditional processing of koche product. a Size
reduction(cutting meat strips).b Drip-drying of meat strips. c Size reduction (cutting of
meat strips into cubes). d Deep-frying of meat cubes.

28
3.4.3 Labour division for processing Koche product
Depending on the amount of koche product processed, processors employed workers on a daily
basis to assist in processing. The daily wage paid was 400-500 Kshs per laborer. (Table 3.2)
shows the labour division for processing 50 kg of koche product. Majority (71%) of the
employed personnel were involved in the cutting process. According to the processors
interviewed, cutting of meat into strips is a tedious process thus requires a lot of personnel
(Figure 3.3: part 1).
Table 3. 2: Labour division and time required for processing 50kg of koche product
Activities Number of
personnel required
Percentage
(%) of
personnel
Time
spent/day
Cutting
Drying
Frying
5
1
1
71%
14%
14%
4hrs
5hrs
2hrs
3.4.4 Costs and returns of Koche product
The results of the study presented in Table 3.3 show that the costs of the major variable inputs
used in koche processing included the cost of meat (71.7%), ingredients (0.354%), cooking oil
(13.34%), transport (1.77%), firewood (2.66%), labour (7.56%) and packaging material (0.03%).
The cost of meat constituted the highest cost of processing. The findings also show that for 20kg
of meat processed, 18kg of koche product was produced and the total revenue of 18kg of koche
product was Kshs 21,600. The total gross margin was Kshs 10,360. Analysis of the returns to
show that for every shilling invested on variable inputs in producing koche product, a gross
margin of Kshs 0.92 was realized, while the return to labour was Kshs 12.1. The study revealed
that the producers’ received price for koche product was Kshs 950, while the consumers’ paid

29
price for Koche product was Kshs 1200. Thus the marketing margin for koche product was
estimated as 20.8%.
Table 3. 3: Average costs and returns of processing 20kg of camel meat into koche product
Category Quantity Unit price Value Value Percentage ( %) of the
(Kg) (per kg) (Kshs) ( USD) total cost
Returns 18 1200 21600 216
Koche produced
Variable costs
Meat 20 400 8000 80 71.17
Ingredients
Salt 0.05 10 0.1
0.088
Cardamom ( spice) 0.09 30 0.3 0.266
Cooking oil 10 1500 15 13.34
Transport 200 2 1.77
Firewood 300 3 2.66
Labour 850 8.5 7.56
Packaging material 350 3.5 0.03
Total Variable costs 11240 112.4 100
Gross Margin 10360 103.6
Marketing margin % 20.8
Return to variable costs 0.92 0.0092
Return to labour 12.1 0.121

30
3.4.5 Challenges faced by koche processors
The problems facing koche processors in the study area are presented by multiple responses in
(Table 3.4). Challenges were related to capital, transport, equipment, market, payment, inputs
and credit facilities. The major constraints identified were lack of equipment to ease processing
(100%), lack of credit facilities (100%), insufficient capital (90%) and high costs of inputs
(90%).
Table 3. 4: Challenges faced by koche processors
Challenges Number of processors reporting
the problem Percentage%
Insufficient capital 9 90
Poor transport system 5 50
Poor market access 7 70
Delayed payment upon supply. 6 60
Lack of equipment to ease processing 10 100
Lack of credit facilities 10 100
High cost of inputs 9 90
3.5 Discussion
The present study provides evidence that processing of koche product is a source of livelihood
for the women processors. The socio-economic characteristics of the processors clearly showed
that processing was mostly done by older women with the majority lacking formal education.
Similar observations were made by Madete et al., in Kenya (2015) who found out that most
actors involved in indigenous meat product nyirinyiri processing had an age bracket of 40-60
years with no formal education. Survey of processing techniques employed showed that
processors used simple indigenous knowledge in processing of koche product. This reflects the
women’s skills and creativity but also their capability to sustain the dynamics of life and
ecosystem. In fact, Asogwa and Okoye (2017) noted that women in Africa have used indigenous
knowledge in processing of food, thus generating income and employment opportunities.

31
However, the existing level of processing hygiene was poor. This corroborates the results of
Kardivel and others (2018) who reported similar observations in India in regard to hygiene and
quality practices of traditional processors.
In addition, several authors (Kisembe et al., 2017; Gichure et al., 2014) in Kenya have identified
poor hygiene of indigenous meat products as a major concern. Therefore, the subjective
assessment of safety and quality of the final product based on taste and colour was inadequate in
addressing the hygiene issues observed in processing and unlikely to meet the quality and safety
requirements of consumers.
According to Hudson and Hite (2003), socio demographic factors such as educational level, age
and poverty are important predictors in the understanding of food quality and safety. Therefore,
the low levels of education of the processors influenced lack of adoption of food quality and
safety standards. Nevertheless, Khan (2005) reported that effective communication strategies and
access to institutional services and input supply markets can facilitate adoption of food safety
and quality standards by processors, thus improving on hygiene.
The findings on gross margin analysis indicate that koche processing is a profitable business
mainly influenced by the cost of meat, as in Nigeria (Ahmadu et al., 2004 and Ahmadu et al.,
2008a; Iliyasu et al., 2013). According to the findings, the processors strongly agreed that lack of
credit facility was a major challenge which consequently had an adverse effect on the capital. As
a result, the processors were constrained to expand production. The high costs of inputs were
attributed to the high cost of meat. Poor market access was highly attributed to insufficient
product and market promotion. These findings therefore concur with other studies that reported
similar challenges in small scale meat production enterprises (Ahmadu et al., 2004; Ahmadu et
al., 2008b).

32
3.6 Conclusion
Based on the results presented, koche processing is still in extremely infant stages despite the
potential. Being labour intensive, it can be a tool for poverty eradication and economic
empowerment for women and youth as ascribed in Kenya Vision 2030 (GoK, 2007).

33
CHAPTER FOUR: EVALUATION OF MARKET POTENTIAL OF KOCHE, A
TRADITIONAL PASTORAL MEAT PRODUCT FOR COMMERCIALIZATION IN
KENYA
4.1Abstract
The goal of this objective was to guide koche processors with an assessment of market
opportunities for koche product. Pre-tested semi-structured questionnaires were administered to
traders (n=30) and consumers (n=196) to establish their perception on koche product. Descriptive
statistics such as percentages, frequencies and logit model were used for data analysis. The
findings indicate that the market outlets for koche product included sale in stalls (20%), hotels
(6.7%) and street vending (73.3%). Street vending represented the highest percentage (73.3%).
The main constraints affecting koche product marketability were poor product quality (60%),
strict regulations by city council (30%), and poor packaging material (46.7%). The results also
revealed that majority (87%) of the households consume koche product while only 13% did not
consume koche product. Taste (90.8%) was the most important quality criterion used by
consumers at the point of purchase. Age, ethnicity and household size were found to be
significant predictors (p<0.05) in the quantity of koche product purchased. It was concluded that
consumers’ preferences associated with consumption patterns is affected by disposable income,
cultural background and household size. Therefore, to enhance marketing of koche product,
processors and traders must target individuals with a higher propensity to consume koche
product.
Key words: Commercialization, Market potential, Pastoral meat products.

34
Article published as: Werikhe,G.,Kunyanga, C.N., Okoth, M.W.,and Roba, H.G. (2018).
Evaluation of market potential of koche, a traditional pastoral meat product for
Commercialization in Kenya. International Journal of Science and Research, 7 (11)
4.2 Introduction
Koche processing is widespread among the borana communities in Northern Kenya and is
regarded as a way of poverty alleviation especially among the rural households. Koche has been
prepared using local knowledge and therefore linked to it. Culturally, it is most valuable food
product. Previous research has shown that based on chemical and sensory parameters, it can be
processed into snack like product both at commercial or household level (Gichure et al., 2015;
Gichure et al., 2016). Currently, it is sold as a ready to eat meat snack by street vendors.
(Gichure et al., 2014 ; Dabasso et al., 2018).
Street food vending is a livelihood strategy especially for the urban poor. Actors in this market
do not comply with legal standards, requirements and procedures similar in formal markets
(Chambwera, 2012). In addition, processors/ marketers sell their products at unprofitable and
low prices (Soinaya, 1992). It is, however, important to ensure product mainstream into the
formal market since over the decades the demand for processed and convenience food has
increased considerably (Kardivel et al., 2018). A change in socio-economic status has
contributed to consumption of convenience meat products presenting an opportunity for
commercialization of Koche.
However, today’s food market has become buyer market rather than seller market. Research has
shown a positive relationship between market orientation and business performance.
Technological advancements have triggered the need for a shift of food industry sectors
orientation from production to market. Understanding market information is effective in product

35
development process. Market information combined with technical knowledge can help generate
successful products with a competitive advantage (Grunert et al., 1996; Slater and Narver, 2000).
To ensure product mainstream into the formal market, it is of outmost importance to evaluate its
potential in the market. Therefore the main objective of this study is to evaluate market potential
of koche for commercialization in Kenya.
4.3 Materials and Methods
4.3.1 Study Area
The study was conducted in Nairobi County. Nairobi County has 17 sub-counties. Kamukunji
sub-county was selected and the study focused on Eastleigh North as depicted in Fig.4.1
Eastleigh North has a population size of about 98,277 (KNBS 2009).
Figure 4. 1: Study regions for koche market potential

36
4.3.2 Study design
A cross-sectional design with random and purposive sampling was used to select consumers and
traders respectively.
4.3.3 Sampling
4.3.3.1 Consumer survey
A stratified random sampling was used to divide the suburb into low and high density suburb.
Ten percent of consumers shopping per day at the shopping center close to the picked suburb
were selected by interviewing every tenth person coming to shop.
4.3.3.2 Sample size determination
The desired sample size for the consumers was determined using the formula of Fischer et al.,
1991):
n= z2pq
d2 Where;n= the desired sample size (assuming the population is greater than 10000)
z= the standard normal deviation, set at 1.96, which corresponds to 95% confidence interval
p= Proportion in the target population estimated to have a particular characteristic. In this study,
the proportion was calculated according to the following assumptions; expected Koche
consumption rate of 85% obtained from pre-tested questionnaires; sampling error of 5% and
95% confidence interval (Ören and Biçkes, 2011; Rodriguez del Aguila and Gonzalez-Ramirez,
2013)
q= 1-p
d= degree of accuracy desired, here set at 0.05, corresponding to the 1.96
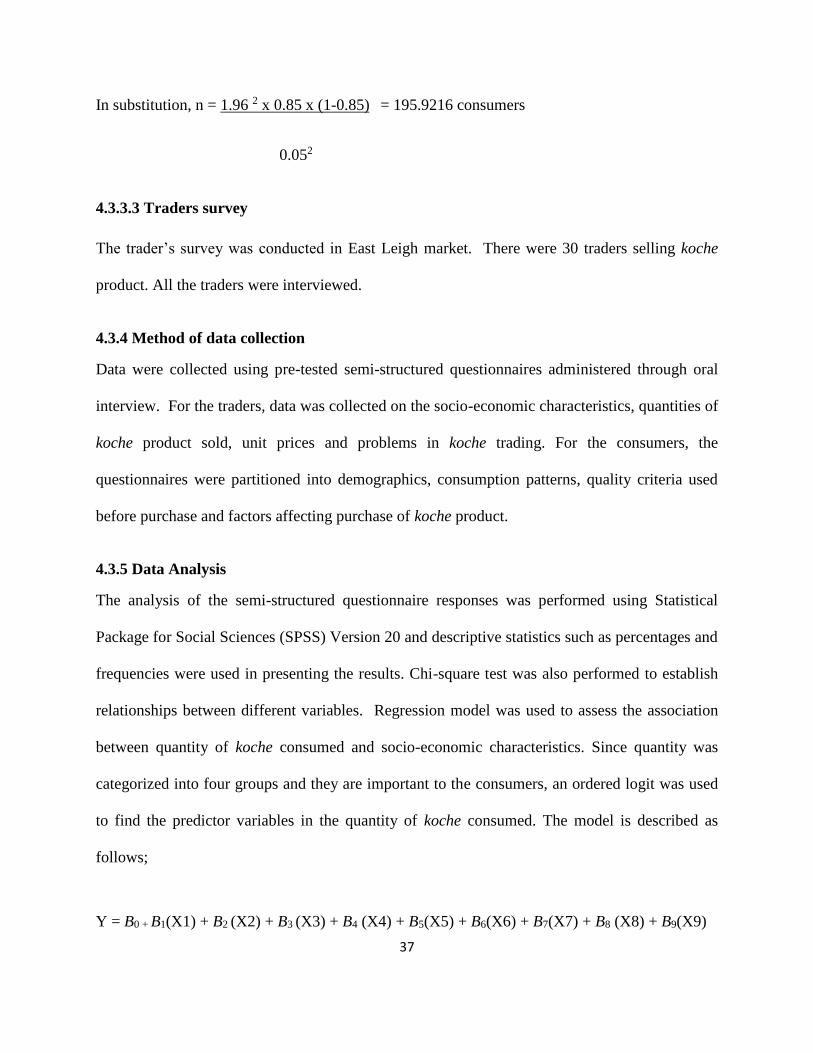
37
In substitution, n = 1.96 2 x 0.85 x (1-0.85) = 195.9216 consumers
0.052
4.3.3.3 Traders survey
The trader’s survey was conducted in East Leigh market. There were 30 traders selling koche
product. All the traders were interviewed.
4.3.4 Method of data collection
Data were collected using pre-tested semi-structured questionnaires administered through oral
interview. For the traders, data was collected on the socio-economic characteristics, quantities of
koche product sold, unit prices and problems in koche trading. For the consumers, the
questionnaires were partitioned into demographics, consumption patterns, quality criteria used
before purchase and factors affecting purchase of koche product.
4.3.5 Data Analysis
The analysis of the semi-structured questionnaire responses was performed using Statistical
Package for Social Sciences (SPSS) Version 20 and descriptive statistics such as percentages and
frequencies were used in presenting the results. Chi-square test was also performed to establish
relationships between different variables. Regression model was used to assess the association
between quantity of koche consumed and socio-economic characteristics. Since quantity was
categorized into four groups and they are important to the consumers, an ordered logit was used
to find the predictor variables in the quantity of koche consumed. The model is described as
follows;
Y = B0 + B1(X1) + B2 (X2) + B3 (X3) + B4 (X4) + B5(X5) + B6(X6) + B7(X7) + B8 (X8) + B9(X9)

38
Y= Response variable= Quantity of Koche consumed.
X (1-9) = Explanatory Variables= Socio economic characteristics
4.4 Results
4.4.1 Socio-economic characteristics of the traders.
Table 4.1 shows the socio-economic characteristics of the traders in koche marketing. Traders
interviewed were female. Forty percent had primary education and also (40%) had no formal
education. Very few (20%) had secondary education. Sixty three percent of the traders were
married, (17%) were divorced, (13%) were widowed and (7%) were single.
Table 4. 1: Socio-demographic characteristics of traders in koche marketing
Figure 4.2 shows distribution of the traders based on age. The findings show that (50%) were
aged 46 and above years, whereas (26.7%) were aged 36-45 years and (20%) were aged 26-
35years. Only (3.3%) were aged 18-25years.
Variables Frequency (n=30) Percentage (%)
Sex
Male 0 0
Female 30 100
Education
No education 12 40
Primary 12 40
Secondary 6 20
Marital status
Single 2 7
Married 19 63
Divorced 5 17
Widowed 4 13

39
3%
20%
27%
50%
18-25 yrs
26-35yrs
36-45yrs
46 and above yrs
Figure 4. 2: Distribution of koche traders by age ( years)
Figure 4.3 shows distribution of traders based on experience in the activity. The highest
proportion (33.3%) had an experience of 3 to 5 years, and (26.7%) and (16.7%) had an
experience of 9 to 10 years and 6 to 8 years respectively. About (13.3%) had an experience of
less than 3 years and a few (10%) had an experience of more than 10 years.
Figure 4. 3: Distribution of the traders based on their experience in years.

40
4.4.2 Marketing channel of Koche product
Table 4.2 shows the channel of koche product during marketing. Majority of the traders (76.7%)
were supplied with koche product from Isiolo and (23.3%) of the traders were supplied with
Koche product from Garissa. Most of the traders (73.3%) sold koche product on the streets.
About (20%) sold koche product in stalls/shops and only (6.7%) sold in hotels. Majority of
buyers (100%) were household consumers.
Table 4. 2: Channel of koche product during marketing
Factors Variables Frequency (n=30) Percentage (%)
Suppliers Isiolo 23 76.7
Garissa 5 16.7
Other (process on their own) 2 6.7
Selling place Stalls/shops 6 20
On the streets 22 73.3
Hotels 2 6.7
4.4.3 Pricing and economics of koche marketing.
Analyses of the marketing characteristics of koche product revealed that a kg of koche product
was sold at 1200Kshs. However, the price varied among the traders from 1200 to 1400Kshs. The
monthly profit obtained from the sales of koche product also varied from one trader to another.
Ten percent of the traders made a monthly profit of less than 5000Kshs, (33.3%) made a monthly
profit of 5000-10000Kshs, (33.3%) made a monthly profit of 10000-15000Kshs while only
(23.3 %) made a monthly profit of more than 15000Kshs (Figure 4.4).

41
10%
33.3% 33.3%
23.3%
0
5
10
15
20
25
30
35
Less than5000kshs
5000-10000kshs 10000-15000kshs More than15000kshs
pe
rce
nt
trad
ers
Monthly income in Kenyan Shillings
Figure 4. 4: Monthly profit declared by the traders interviewed
4.4.4 Challenges faced by koche traders.
Despite the socio-economic importance of trading of koche product, the traders were faced by
various challenges. Table 4.3 summarizes the importance of the challenges. The most important
challenges specified by the traders were inadequate market and storage space (73.3%), harsh
climatic conditions (73.3%) and strict regulations by city council (70%).
Table 4. 3: Challenges faced by koche traders
Challenges Most important Least important
Frequency Percentage Frequency Percentage
Inadequate market and 22 73.3 8 26.7
storage space
Hot climate 22 73.3 8 26.7
Strict regulations by city council 21 70 9 30
Poor packaging material 16 53.3 14 46.7
Poor product quality 12 40 18 60

42
Table 4.4 shows association between selling place of koche product and the type of challenge
experienced. Significant differences (p< 0.05) were found between selling place and inadequate
market and storage space, hot climate and strict regulations by city council. No significant
difference (p > 0.05) was observed between selling place and poor packaging material and poor
product quality.
Table 4.4: Association between selling place and challenges facing koche traders
Challenges Selling place( percentage % )
Stalls On the streets Hotels p-Value
Inadequate market and storage space
Most important 0 100 0 < 0.05
Least important 75 0 25
Hot climate
Most important 0 100 0
Least important 75 0 25 < 0.05
Strict regulations by city council
Most important 0 100 0
Least important 66.7 11.1 22.2 < 0.05
Poor packaging material
Most important 12.5 75 12.5 > 0.05
Least important 28.6 71.4 0
Poor product quality
Most important 25 75 0 > 0.05
Least important 16 72.2 11.1
Significant at p < 0.05
Table 4.5 shows association between demographic characteristics and monthly profit obtained. A
significant association (p<0.05) was observed between monthly profit and trading experience.
However, no significant association (p >0.05) was observed between monthly profit and the age
groups, education groups and marital statuses.
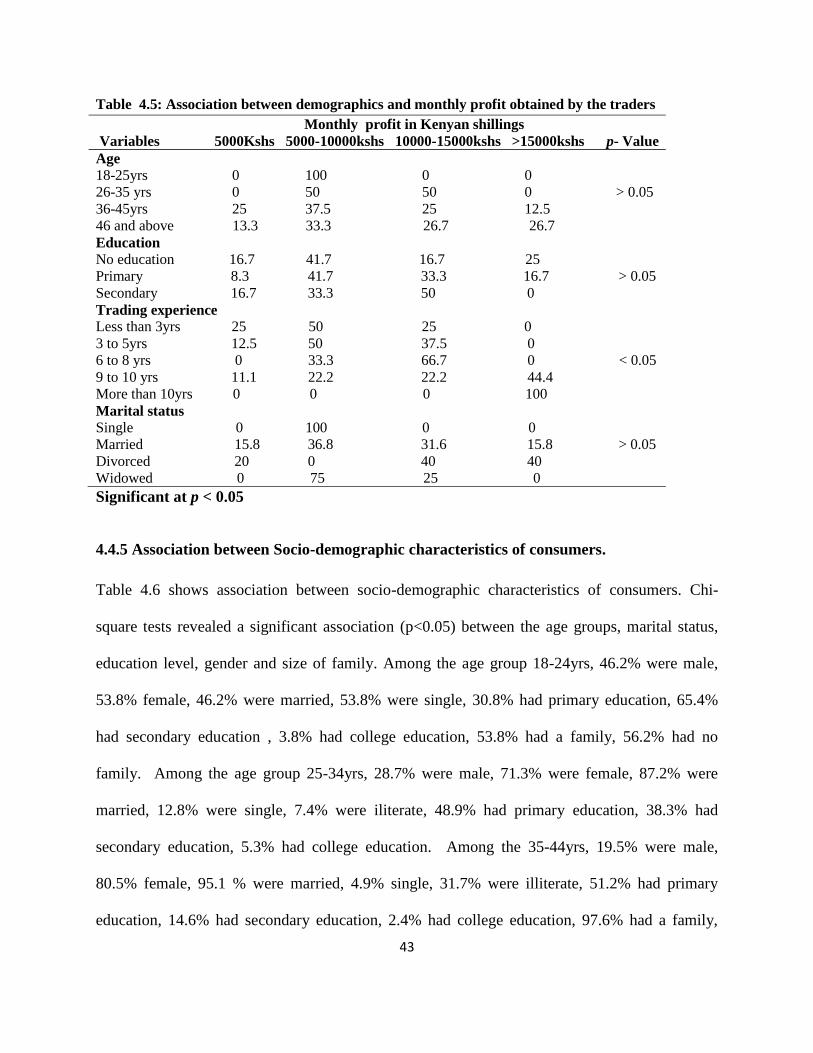
43
Table 4.5: Association between demographics and monthly profit obtained by the traders
Monthly profit in Kenyan shillings
Variables 5000Kshs 5000-10000kshs 10000-15000kshs >15000kshs p- Value
Age
18-25yrs 0 100 0 0
26-35 yrs 0 50 50 0 > 0.05
36-45yrs 25 37.5 25 12.5
46 and above 13.3 33.3 26.7 26.7
Education
No education 16.7 41.7 16.7 25
Primary 8.3 41.7 33.3 16.7 > 0.05
Secondary 16.7 33.3 50 0
Trading experience
Less than 3yrs 25 50 25 0
3 to 5yrs 12.5 50 37.5 0
6 to 8 yrs 0 33.3 66.7 0 < 0.05
9 to 10 yrs 11.1 22.2 22.2 44.4
More than 10yrs 0 0 0 100
Marital status
Single 0 100 0 0
Married 15.8 36.8 31.6 15.8 > 0.05
Divorced 20 0 40 40
Widowed 0 75 25 0
Significant at p < 0.05
4.4.5 Association between Socio-demographic characteristics of consumers.
Table 4.6 shows association between socio-demographic characteristics of consumers. Chi-
square tests revealed a significant association (p<0.05) between the age groups, marital status,
education level, gender and size of family. Among the age group 18-24yrs, 46.2% were male,
53.8% female, 46.2% were married, 53.8% were single, 30.8% had primary education, 65.4%
had secondary education , 3.8% had college education, 53.8% had a family, 56.2% had no
family. Among the age group 25-34yrs, 28.7% were male, 71.3% were female, 87.2% were
married, 12.8% were single, 7.4% were iliterate, 48.9% had primary education, 38.3% had
secondary education, 5.3% had college education. Among the 35-44yrs, 19.5% were male,
80.5% female, 95.1 % were married, 4.9% single, 31.7% were illiterate, 51.2% had primary
education, 14.6% had secondary education, 2.4% had college education, 97.6% had a family,
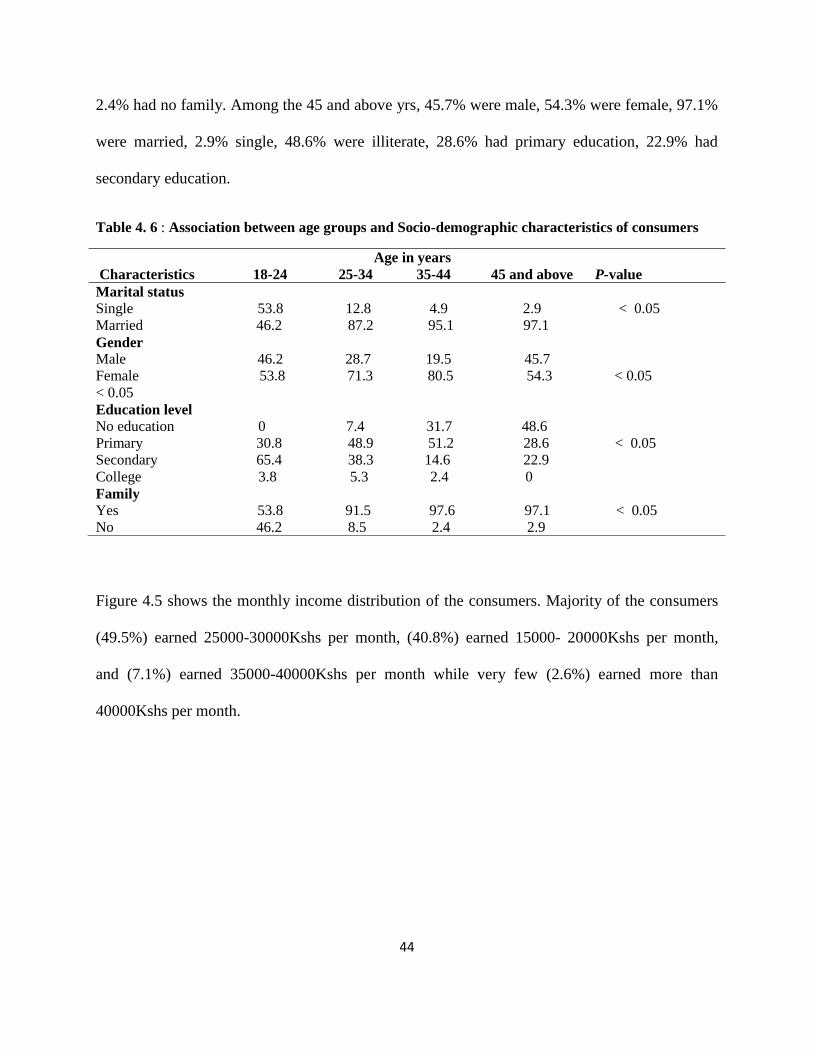
44
2.4% had no family. Among the 45 and above yrs, 45.7% were male, 54.3% were female, 97.1%
were married, 2.9% single, 48.6% were illiterate, 28.6% had primary education, 22.9% had
secondary education.
Table 4. 6 : Association between age groups and Socio-demographic characteristics of consumers
Figure 4.5 shows the monthly income distribution of the consumers. Majority of the consumers
(49.5%) earned 25000-30000Kshs per month, (40.8%) earned 15000- 20000Kshs per month,
and (7.1%) earned 35000-40000Kshs per month while very few (2.6%) earned more than
40000Kshs per month.
Age in years
Characteristics 18-24 25-34 35-44 45 and above P-value
Marital status
Single 53.8 12.8 4.9 2.9 < 0.05
Married 46.2 87.2 95.1 97.1
Gender
Male 46.2 28.7 19.5 45.7
Female 53.8 71.3 80.5 54.3 < 0.05
< 0.05
Education level
No education 0 7.4 31.7 48.6
Primary 30.8 48.9 51.2 28.6 < 0.05
Secondary 65.4 38.3 14.6 22.9
College 3.8 5.3 2.4 0
Family
Yes 53.8 91.5 97.6 97.1 < 0.05
No 46.2 8.5 2.4 2.9

45
Figure 4. 5: Income distribution of koche consumers
4.4.6 Reasons for consumption of koche .
Figure 4.6 shows the reasons of consumption of koche. Majority of the consumers (54%)
indicated that they consumed koche since it was their cultural food. Twenty-one percent
indicated that they consumed koche due to health benefits, (6%) indicated that they consumed
koche since it was ready to eat, (10%) indicated that they consumed due to good taste and (9%)
were indifferent.

46
21%
54%
6%
10%
9%
Health benefits
Cultural food
Ready to eat
Good taste
Indifferent
Figure 4. 6: Reasons for consumption of koche.
4.4.7 Purchase points for koche .
Figure 4.7 shows the purchase points in the study area. Majority of the consumers purchased on
the streets (64.8%). The reason given was that street vending was the dominant market outlet for
koche . However, (20.8%) of the consumers purchased in the stalls, (4.4%) purchased in hotels
and (10%) prepared at home.
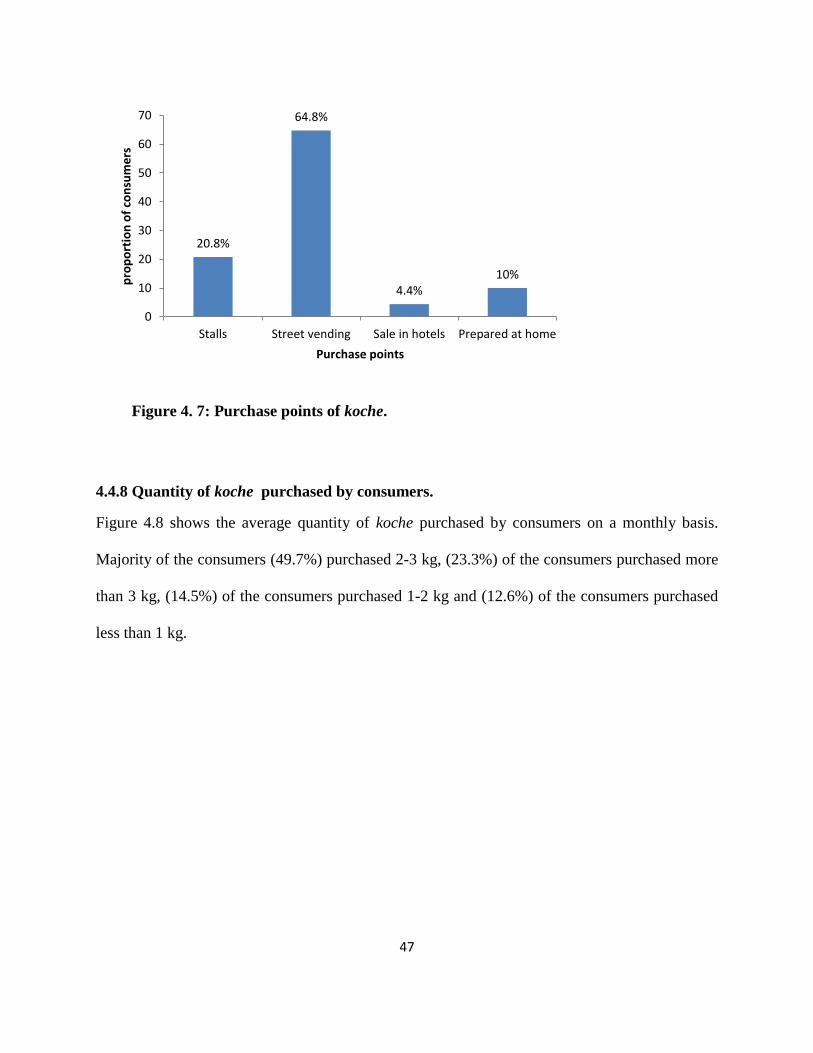
47
20.8%
64.8%
4.4%10%
0
10
20
30
40
50
60
70
Stalls Street vending Sale in hotels Prepared at home
pro
po
rtio
n o
f co
nsu
me
rs
Purchase points
Figure 4. 7: Purchase points of koche.
4.4.8 Quantity of koche purchased by consumers.
Figure 4.8 shows the average quantity of koche purchased by consumers on a monthly basis.
Majority of the consumers (49.7%) purchased 2-3 kg, (23.3%) of the consumers purchased more
than 3 kg, (14.5%) of the consumers purchased 1-2 kg and (12.6%) of the consumers purchased
less than 1 kg.

48
Figure 4. 8: Quantity of koche purchased by consumers.
4.4.9 Frequency of purchase of koche by consumers
Figure 4.9 shows the frequency of purchase of koche by consumers. Majority of the consumers
(33.3%) purchased once a month, (24.5%) of the consumers purchased 1 to 3 times a month,
(16.4%) of the consumers purchased more than once a week, (22%) of the consumers purchased
once a week and only (3.8%) purchased every day.

49
Figure 4. 9: Frequency of purchase of koche.
4.4.10 Quality criteria used by consumers to purchase koche
Majority of the consumers (90.8%) used taste as the most important quality attribute at the point
of purchase. However, (83.2%) used flavor, 73.2%) used fat content, (61.3%) used chewiness,
(61.3%) used appearance and (22.4%) used size of meat chunks (Figure 4.10).
Figure 4. 10: Quality criterion used by consumers at the point of purchase of koche.
50
4.4.11 Factors influencing consumers likelihood to purchase different quantities of koche
Table 4.7 shows the predictor factors of the quantity of koche purchased. Age, household size
and ethnicity were found to be statistically significant (p< 0.05) in influencing the probability of
a certain consumer being in a particular koche purchase category. The odds of 18-24 yrs age
consumers group compared to 44yrs and above age group was 0.15times less likely to have an
increasing purchase of koche. The odds of 24-35yrs consumers compared to 44yrs were 0.3times
less likely to have an increasing koche purchase. The odds of household size of 1-3 consumers
compared to above 6 was 0.03times less likely to have an increasing purchase of koche. The odds
of household size of 4-6 consumers compared to above 6 was 0.05times less likely to have an
increasing purchase of koche. The odds of Rendille consumers compared with other tribes were
5times more likely to have increasing purchase of koche. The odds of Borana consumers
compared to other tribes were 6.7times more likely to have an increasing purchase of koche. The
odds of Somali consumers compared to other tribes were 100 times more likely to have an
increasing purchase of koche
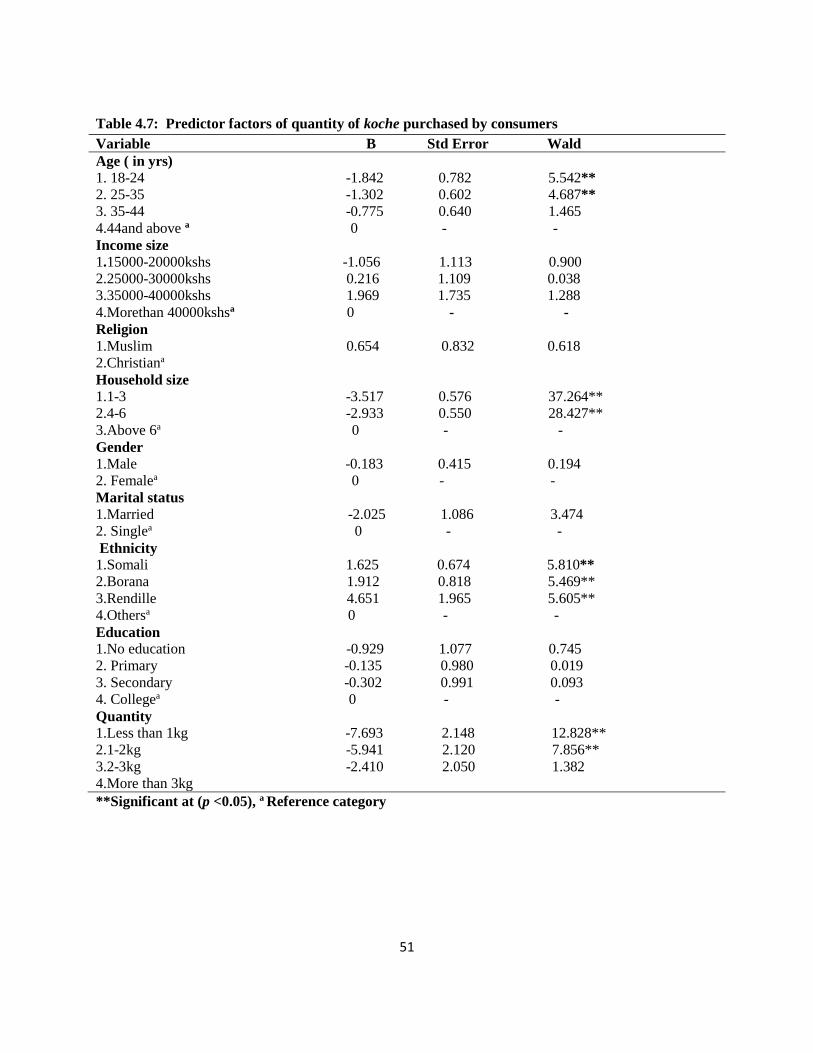
51
Table 4.7: Predictor factors of quantity of koche purchased by consumers
Variable B Std Error Wald
Age ( in yrs)
1. 18-24 -1.842 0.782 5.542**
2. 25-35 -1.302 0.602 4.687**
3. 35-44 -0.775 0.640 1.465
4.44and above a 0 - -
Income size
1.15000-20000kshs -1.056 1.113 0.900
2.25000-30000kshs 0.216 1.109 0.038
3.35000-40000kshs 1.969 1.735 1.288
4.Morethan 40000kshsa 0 - -
Religion
1.Muslim 0.654 0.832 0.618
2.Christiana
Household size
1.1-3 -3.517 0.576 37.264**
2.4-6 -2.933 0.550 28.427**
3.Above 6a 0 - -
Gender
1.Male -0.183 0.415 0.194
2. Femalea 0 - -
Marital status
1.Married -2.025 1.086 3.474
2. Singlea 0 - -
Ethnicity
1.Somali 1.625 0.674 5.810**
2.Borana 1.912 0.818 5.469**
3.Rendille 4.651 1.965 5.605**
4.Othersa 0 - -
Education
1.No education -0.929 1.077 0.745
2. Primary -0.135 0.980 0.019
3. Secondary -0.302 0.991 0.093
4. Collegea 0 - -
Quantity
1.Less than 1kg -7.693 2.148 12.828**
2.1-2kg -5.941 2.120 7.856**
3.2-3kg -2.410 2.050 1.382
4.More than 3kg
**Significant at (p <0.05), a Reference category

52
4.4.12 Factors affecting purchase decisions by consumers.
Figure 4.11 shows factors affecting purchase decisions by consumers. Majority of the consumers
(29%) identified price as an impediment towards purchase of koche. Twenty seven percent
identified poor product quality, (21%) identified poor hygiene of traders involved in selling
koche, (19%) indicated proximity to the market outlet and (4%) identified lack of consumer
information.
Figure 4. 11: Factors affecting purchase decisions by consumers.
4.5 Discussion
The present study provides greater evidence of trading of koche mainly in Eastleigh Town,
Nairobi. This reflects a shift towards a market oriented production objective. However, Koche
marketing system found in the studied areas was dominantly informal marketing. Street vending
represented the highest percentage (73.3%) with all the traders interviewed being women. This
is in line with the study of (Muyanja et al., 2011; Gadaga et al., 2014) who reported that in any
street food activity women pre-dominate. Majority of the traders (50%) were aged 40 and above
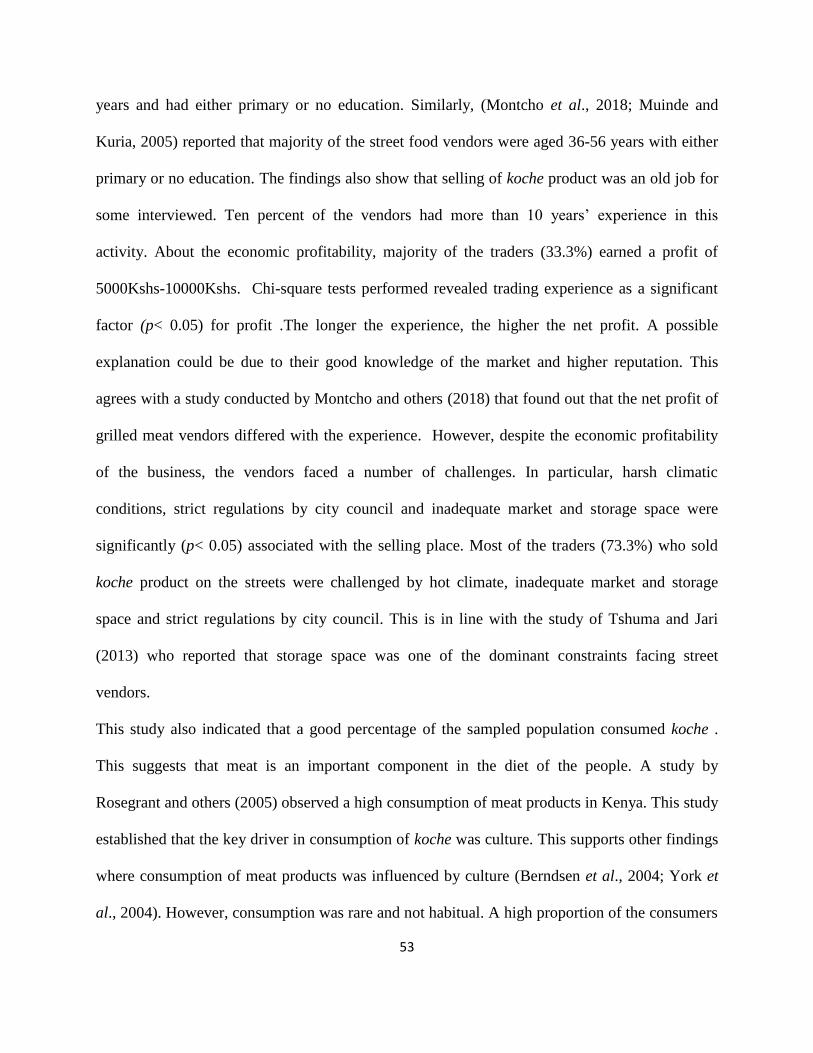
53
years and had either primary or no education. Similarly, (Montcho et al., 2018; Muinde and
Kuria, 2005) reported that majority of the street food vendors were aged 36-56 years with either
primary or no education. The findings also show that selling of koche product was an old job for
some interviewed. Ten percent of the vendors had more than 10 years’ experience in this
activity. About the economic profitability, majority of the traders (33.3%) earned a profit of
5000Kshs-10000Kshs. Chi-square tests performed revealed trading experience as a significant
factor (p< 0.05) for profit .The longer the experience, the higher the net profit. A possible
explanation could be due to their good knowledge of the market and higher reputation. This
agrees with a study conducted by Montcho and others (2018) that found out that the net profit of
grilled meat vendors differed with the experience. However, despite the economic profitability
of the business, the vendors faced a number of challenges. In particular, harsh climatic
conditions, strict regulations by city council and inadequate market and storage space were
significantly (p< 0.05) associated with the selling place. Most of the traders (73.3%) who sold
koche product on the streets were challenged by hot climate, inadequate market and storage
space and strict regulations by city council. This is in line with the study of Tshuma and Jari
(2013) who reported that storage space was one of the dominant constraints facing street
vendors.
This study also indicated that a good percentage of the sampled population consumed koche .
This suggests that meat is an important component in the diet of the people. A study by
Rosegrant and others (2005) observed a high consumption of meat products in Kenya. This study
established that the key driver in consumption of koche was culture. This supports other findings
where consumption of meat products was influenced by culture (Berndsen et al., 2004; York et
al., 2004). However, consumption was rare and not habitual. A high proportion of the consumers

54
(33.3%) indicated that they purchased koche once every month and the reason was that it was
expensive. The consumers associated the quality of koche with taste, size of meat chunks, flavor,
appearance and fat content. However, taste was regarded as the most important quality attribute
when purchasing. This supports the findings of Rodriguez, (2006) who reported that consumer’s
perceived quality is influenced mostly by taste. However, it contradicts the findings of Troy and
others (2010) who reported that consumer acceptability is mostly influenced by product color.
Consumer’ purchase decisions were influenced by income, ethnicity and household size. In
regards to income and household size, these findings were consistent with the results of (Amao
and Ayantoye, 2014; Mafimisebi, 2012; Musaba and Namukwambi, 2011) that income and
household size is related to the amount of fish consumed. However, it contradicts the findings of
Cengiz Sayin and others (2010) who found insignificant relationship between household and
income size with the amount of fish consumed. Among the factors affecting purchase, price was
considered the most important. This agrees with the findings of Vimiso and others (2012) who
observed that most purchases are determined by the amount of cash available. However, it
contradicts earlier consumer studies by (Montcho et al., 2018; Rheinlander et al., 2018) who
reported that personal trust in vendors was the most important factor affecting purchase.
4.6 Conclusion
The study reveals a great market potential for koche product. A high population of the sampled
population consume koche product. However, the market is still underexploited since majority of
the consumers were pastoral communities.

55
CHAPTER FIVE: OPTIMIZATION AND UPGRADING OF KOCHE, A TRADITIONAL
MEAT PRODUCT PROCESSED BY PASTORAL COMMUNITIES IN KENYA.
5.1Abstract
Koche product has potential commercial value since it is a traditional ready to eat product.
However, commercialization of koche product is possible if challenges in regards to processing
are taken into account. This study aimed at optimizing koche product made from camel, beef and
goat to meet today’s consumers’ convenience evaluating its nutrient profile and shelf life
stability. Results show that moisture content of the upgraded koche product ranged from 32.65 to
33.44%, crude protein ranged from 30.58 to 36.56%, Crude fat ranged from 22.29 to 31.05%,
crude ash ranged from 4.58 to 6.92% and energy values ranged from 346.1 to 402.8. From the
study, the sensory quality attributes i.e. overall acceptability (4.2) Appearance (4.2) and color
(4.2) had the highest mean scores. Overall acceptability of upgraded koche product made from,
beef, camel and goat was the same. T he physicochemical properties and microbial quality were
within the acceptable limit up to 5th day of accelerated storage at 55oC. Hence, upgraded koche
product has the potential for commercialization.
Key words: Commercial viability, new product development, Ready to eat meat product
5.2 Introduction
Demand for quality and safety food products with extended shelf-life is mounting. Participants
along the production chain must ensure production of completely safe and quality food. Food
quality is a term that includes in addition to safety other intrinsic features such as appearance,

56
texture, color, flavor, and other extrinsic features such as labelling and certification (Ripol et al.,
2018). An achievement of food quality and safety is an important marketing strategy. Quality
and safety influences consumer’s perception and decision making in regards to choice of food
(Grunert et al., 2007).
The role of meat processing and preservation is to enhance quality and extend shelf life of meat
products (Malik et al., 2011). Over the years, traditional meat processing has been practiced
manifesting in different ways and localities. Different regions have devised technologies to suit
the prevailing environmental conditions in that area. In the pastoral regions of Kenya, a
combination of drying (generally in the sun) with processes such as salting, smoking, deep frying
have been used in preservation of meat since it is highly perishable (Ayanwale et al., 2007).
Current research has shown a wide range of products such as Koche, Enyas, Olpurda,
Fonntumma, Kochegarbu processed (Gichure et al., 2014; Dabasso et al., 2018). These meat
products are highly valued and formed part of the culture of the people (Asogwa and Okoye,
2017). They are prepared mainly for social events such as weddings, and showcased in cultural
festivals with some marketed informally. However, these processing technologies have neither
been optimized nor standardized to mainstream products into formal markets (Gichure et al.,
2014).
Koche is made from strips of sundried beef or camel which is salted then deep fried in oil. The
moisture content varies from 3.3 to 6.1% (wet basis). Traditionally, it is a common food among
the Borana pastoralists. It is stored without special packaging and eaten as a snack. Research on
koche product has shown that women carry out the processing activities. Despite the dawn of
science and technology, production is still craft based. The techniques employed are labor
intensive, time consuming and low productivities. One of the challenges of the processing

57
methods is unoptimized and unstandardized product quality (Gichure et al., 2014; Dabasso et al.,
2018).
To mainstream the product into the formal markets, it is of utmost importance to enhance the
quality and consumer acceptability. Contemporary food technology offers many processing
methods and tools alongside scientific packaging that can be used to improve the quality and
shelf-life of the product thus raising its standards (Andree et al., 2010). Some successes have
been recorded in upgrading of traditional technologies (Obadina et al., 2013). The objective of
this research work was to optimize the production of koche product through addition of curing
salts and modern packaging to further improve the quality, utilization and acceptance.
5.3 Research design and Methodology
5.3.1 Experimental design
A Completely randomized design was used.
5.3.2 Sample collection and preparation.
Semi-membranous muscles of cattle, camel and goat (3kg each) were obtained at local
slaughterhouse which has the authorization in regards to hygiene and health practices. The other
ingredients were obtained from an authorized supplier in Nairobi. Sub-cutaneous fat and visible
connective tissue were removed from the muscles.
Table 5.1: Salts and spices per kg of raw meat
Ingredients Percentage ( %)
Sodium chloride
Sodium tripolyphosphate
Sodium Nitrite
Monosodium glutamate
Ascorbic acid
Ginger
Nutmeg
Coriander
0.2
0.3
0.015
0.05
0.03
0.03
0.03
0.02
Gichure et al., 2017

58
5.3.3 Processing
The meat was cut into strips (10mm width size) using a meat slicer. The meat strips were then
cured in a curing solution containing salts and spices. The ratio of meat to curing solution was
1:3. After curing, the meat was strips were uniformly massaged and kept in a cold room for 24
hours at 4oC after which they were dried using a cabinet dryer (Innotech model,
ngenieursgescellschaft mbH, Germany). The drying temperature was set at 400C for 120
minutes. After drying, the meat strips were cut into 10 mm cube size using a meat cube cutter.
The meat cubes were deep fried in palm oil at 1700C for 5mins using an electric fryer (Caterina
model, EFIO1CT/109, China). After deep frying, excess oil from the meat cubes was drained off
using a stainless sieve for 2 minutes (Fig 5.1). The final product was then cooled to room
temperature. Standard methods were used to analyze the physico-chemical, sensory
characteristics and shelflife stability (Gichure et al., 2017).

59
Fresh meat (Removal of visible fat)
Size reduction (cutting meat into strips 10mm width size)
(Meat slicer)
Curing Addition of salts& spices
Drying
(Solar drier, at 400C, 2hrs)
Size reduction (Cutting into 1cm* 1cm* 1cm, cube size)
(Meat cube cutter)
Deep frying
(Electric fryer, 1700C, 5mins)
Draining
Cooling
Packaging
(Plastic & glass containers)
Figure 5. 1: Steps in laboratory scale upgraded koche processing
Figure 5. 2: Upgraded koche product

60
5.3.4 Packaging
Glass and plastic jars were used.
5.3.5 Analytical methods
5.3.5.1Chemical composition
5.3.5.1.1 Determination of moisture content
The AOAC standard method 950.46 (AOAC, 2005) was used. Approximately 5g of the sample
was weighed in aluminium made dish which was placed in an oven at 105ºC for approximately 5
hours. Cooling followed and both the dish and the residue were weighed. The difference in
weight between the original fresh sample weight and the dried sample gave the moisture content.
This was expressed as per cent moisture content.
5.3.5.1.2 Determination of crude fat
The soxhlet method as per AOAC standard method954.02 (AOAC, 2005) was used. 5g of
pounded sample was weighed into an extraction thimble containing cotton wool which was then
transferred into the sohxlet extractor and extraction of the fat done in a tared flask for 8hours
using petroleum ether (B.P. 40-60oC). Evaporation of the fat was done in a rotary evaporator.
The drying of the residue was done in an air oven at 105ºC for approximately 1 hour and
weighed. Determination of the fat content was done and values expressed in form of percentage
of the sample dry matter content.
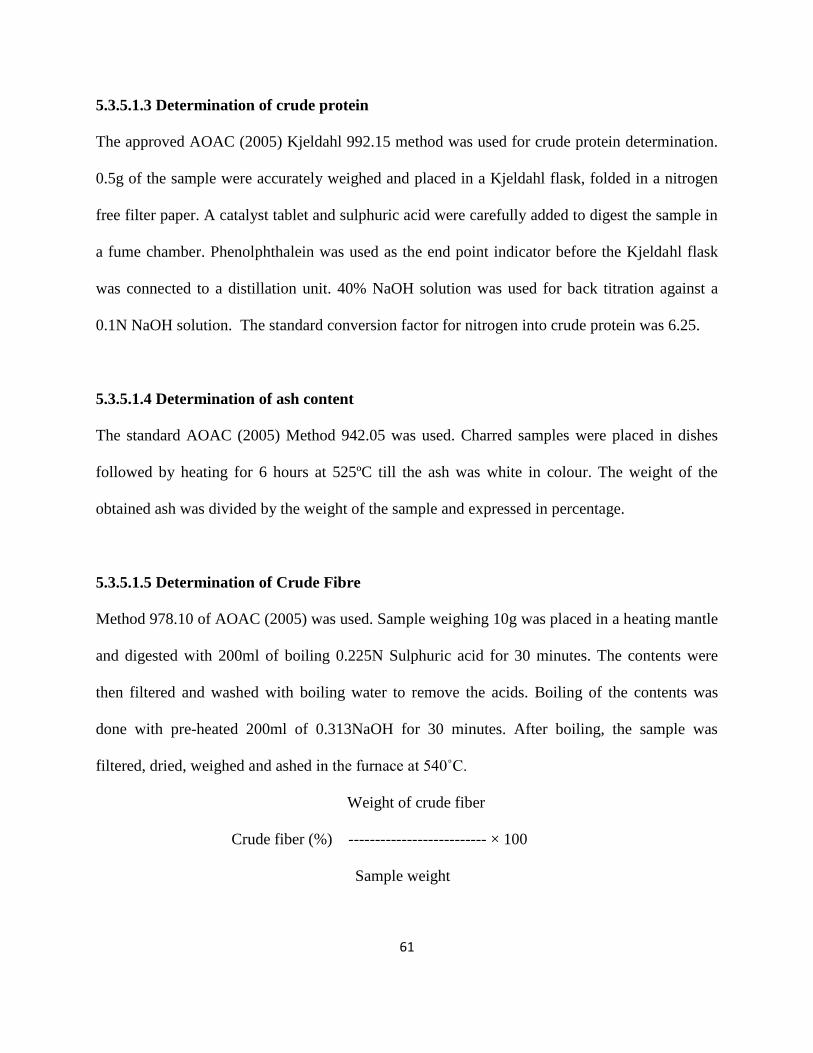
61
5.3.5.1.3 Determination of crude protein
The approved AOAC (2005) Kjeldahl 992.15 method was used for crude protein determination.
0.5g of the sample were accurately weighed and placed in a Kjeldahl flask, folded in a nitrogen
free filter paper. A catalyst tablet and sulphuric acid were carefully added to digest the sample in
a fume chamber. Phenolphthalein was used as the end point indicator before the Kjeldahl flask
was connected to a distillation unit. 40% NaOH solution was used for back titration against a
0.1N NaOH solution. The standard conversion factor for nitrogen into crude protein was 6.25.
5.3.5.1.4 Determination of ash content
The standard AOAC (2005) Method 942.05 was used. Charred samples were placed in dishes
followed by heating for 6 hours at 525ºC till the ash was white in colour. The weight of the
obtained ash was divided by the weight of the sample and expressed in percentage.
5.3.5.1.5 Determination of Crude Fibre
Method 978.10 of AOAC (2005) was used. Sample weighing 10g was placed in a heating mantle
and digested with 200ml of boiling 0.225N Sulphuric acid for 30 minutes. The contents were
then filtered and washed with boiling water to remove the acids. Boiling of the contents was
done with pre-heated 200ml of 0.313NaOH for 30 minutes. After boiling, the sample was
filtered, dried, weighed and ashed in the furnace at 540˚C.
Weight of crude fiber
Crude fiber (%) -------------------------- × 100
Sample weight

62
5.3.5.1.6 Determination of Energy
The energy value of the samples was determined by multiplying the protein content by 4,
carbohydrate content by 4 and fat content by 9. (AOAC, 2005)
Energy Value = (Crude protein × 4) + (Total carbohydrate ×4) + (Crude fat × 9)
5.3.5.1.7 Determination of peroxide value
The method (AOAC, 2008 – Method 965.33) was used to determine the peroxide value of the
samples. Approximately 5g of the sample was weighed and mixed with 30ml of the mixture
glacial acetic acid: chloroform (3:1) in a conical flask and the fat dissolved by careful swirling.
0.5ml of fresh saturated aqueous potassium iodide solution was added and the flask stoppered.
The contents were shaken for 1 minute and the flask placed in darkness for 1 minute. 30ml of
distilled water was added and mixed well with the flask contents. Titration of the iodine with
0.002M or 0.01M sodium thiosulphate solution using 1% starch solution as an indicator then
followed. A reagent blank determination (V0) was carried out using 0.5ml of 0.01M thiosulphate
solution.
5.3.5.1.8 Determination of free fatty acids value
The free fatty acids were determined based on (ISO 660:2009 method). Twenty five millimeters
of diethyl ether and 25Ml of ethanol were mixed. The solution was neutralized with 0.1N sodium
hydroxide solution. About 5g of the sample was weighed and placed into the neutral solution and
titrated with 0.1N Sodium Hydroxide solution. Phenolphthalein was used as indicator. Free fatty
acids were expressed as the g of sodium hydroxide required to neutralize free acid in 100g of
sample.

63
5.3.6 Instrumental methods
5.3.6.1 Determination of color
A hand held colorimeter (CR -200 model Japan 75043055) with an 8mmm diameter measuring
area was used. Before the readings were taken, samples were placed on the flat surface. Care was
taken to ensure there was no gap between sample and surface. The lens of the colorimeter was
put against the plate. Three consecutive readings were taken and averaged. L*, a* and b* values
were determined. The hue angle ( h0) and Chroma ( C*) which represents the color and
brightness respectively were calculated using the following equation 1 & 2 (kayaardi and Gok,
2003).
h0= tan-1 (b*)
a* ………………… (1)
C*= a*2 + b*2 ……………………… (2)
5.3.6.2 Determination of texture
Texture measurements for the upgraded Koche product were done using a Texture analyzer
TA.XT plus Texture analyzer ( Stable microsystems, surrey, UK) with volodkevich bite jaws
(HDP/VB*) fixture (Hansen, Hansen, Aaslyng & Bryne, 2004). The deformation rate was
performed at 300mm/min to give the maximum shear force (N). The pre-test speed, test speed
and post speed were set at 5.0mm/s, 5.0mm/ and 2.0mm/s respectively, while the compression
distance was set at 25%. Height was calibrated as 10mm above the sample. Samples were put
parallel to the surface of the compression plate and compressed using a 50kg load cell.
64
5.3.7 Determination of microbiological quality
The microbiological analysis was performed to determine the time period for detectable changes
in microbial quality during storage. Listeria monocytogenes was analysed using ISO 11290-
1:2004 methodology, staphyloccus aureus using ISO 6888-1: 1999 methodology, total aerobic
count using ISO 4833-2: 2013 methodology, Yeasts and moulds using ISO 21527-2:2008 and
Lactic acid bacteria using ISO 15214: 1998. Approximately 25g of the meat product was
aseptically mixed with 225ml of saline water for 2 minutes. Serial dilutions were made using
saline water. For each dilution, two replicate plates were prepared. Pour plating was done for
yeasts and moulds and total aerobic count while spread plating was done for Listeria
monocytogenes, staphylococcus aureus and Lactic acid bacteria. The microbiological data were
expressed as Log CFU g-1.
5.3.8 Sensory Evaluation
Sensory evaluation was done by ten untrained assessors in the sensory evaluation laboratory.
Koche product was randomly coded and served to each assessor. Rinsing water was provided
between the samples tasting for mouth rinsing. Eight attributes, color, appearance, taste, aroma,
chewiness, oiliness, size of meat chunks and overall acceptability were evaluated. The
interpretation of the attributes was done among the assessors prior to tasting. A five point
hedonic scale was used for scoring. The scale ranged from 1(Dislike extremely) to 5 (Like
extremely).
5.3.9 Accelerated shelf life analysis
To estimate the shelf-life of the product, accelerated shelf life testing according to the method of
Fu and Labuza, (1997) with slight modification was done. The upgraded Koche product was
65
packed in two types of packaging material, glass and plastic jars stored at 55oC in an incubator
for 6 days (1day=1month). Physicochemical and microbiological characteristics were used to
quantify the quality of the upgraded Koche product during the storage time.
5.3.10 Cost Analysis
The cost analysis of production of Koche was done by listing down the variable and fixed costs
involved. The variable costs considered included; raw material, ingredient, labour, packaging,
electricity, water and transport, while the fixed costs included; Machines, Licenses, Taxation and
Marketing. It was assumed that facilities such as building, machines are already available.
However, the depreciation cost was calculated using the straight line method (Konstantinos and
Dimitrios, 2015);
Annual Depreciation = Cost of the asset – Residual value / Useful life of the asset
5.3.11 Statistical Analysis
The data obtained from the various experiments were subjected to analysis of variance (Anova),
least significant differences (p<0.05) and Duncan multiple test for comparing means using
Statistical software (Genstat Version 15).
5.4 Results
5.4.1 Nutritional composition
The data pertaining to nutritional composition of raw meat samples (control) and upgraded koche
samples made from camel, goat and beef are presented in Table 5.2. The nutritional composition
showed significant differences (p< 0.05) between the raw meat samples. Moisture content was
the most abundant corresponding in average to 63.61 and 67.81 %. Protein fraction varied
significantly between 27.79 and 28.30 %, fat content between 1.18 and 1.52%, ash content

66
between 2.815 and 3.06%, carbohydrate content between 0 and 7.995% and energy values
between 121.83 and 153.18%. In upgraded koche samples significant differences ( p<0.05) were
observed in the moisture content, protein content, fat content, ash content and energy values. The
protein fraction was the most abundant with values between 31.87 and 36.57%. Moisture content
varied between 32.90 and 34.42%, ash content between 4.69 and 6.95%, energy values between
346.32 and 404.19%. However, there were no significant differences (p > 0.05) in the
carbohydrate content.
Table 5. 2: Nutritional composition of raw meat samples (control) and upgraded koche samples
Values with different superscript letters within a column are statistically different (p < 0.05) according to
Duncan test.
5.4.2 Consumer acceptability.
From the study significant differences (p<0.05) existed in the products taste, color, oiliness,
appearance, chewiness and overall acceptability. However, there was no significant difference (p
>0.05) in oiliness and size of meat cubes.
Raw meat samples Beef Goat Camel
Moisture 63.61 +0.42 a 67.19+ 0.02b 67.81+ 0.10b
Protein 25.76+ 0.18a 28.28 +0.02b 27.61+0.18 c
Fat 1.27+ 0.15a 1.5+ 0.02 c 1.17+0.01 b
Ash 2.755+0.06b 3.03+ 0.03a 3.225+ 0.04a
CHO 7.995+1.52b 0a 0.15+ 0.21 a
Crude fibre Nil Nil Nil
Energy 146.5+ 6.68b 126.7+ 0.08a 121+0.83a
Upgraded koche samples
Moisture 33.44+ 0.30a 32.65 + 0.25b 34.41 + 0.01c
Protein 30.58+0.29a 36.12+ 0.89b 36.56+0.01b
Fat 31.05+0.03c 27.07+ 0.07a 22.29+0.03b
Ash 4.91+0.01b 4.58+ 0.11c 6.92+ 0.03a
CHO 0.015+0.02a 0a 0.01a
Crude fibre Nil Nil Nil
Energy 402.8+1.39c 388.1+4.23a 346.1+0.22b
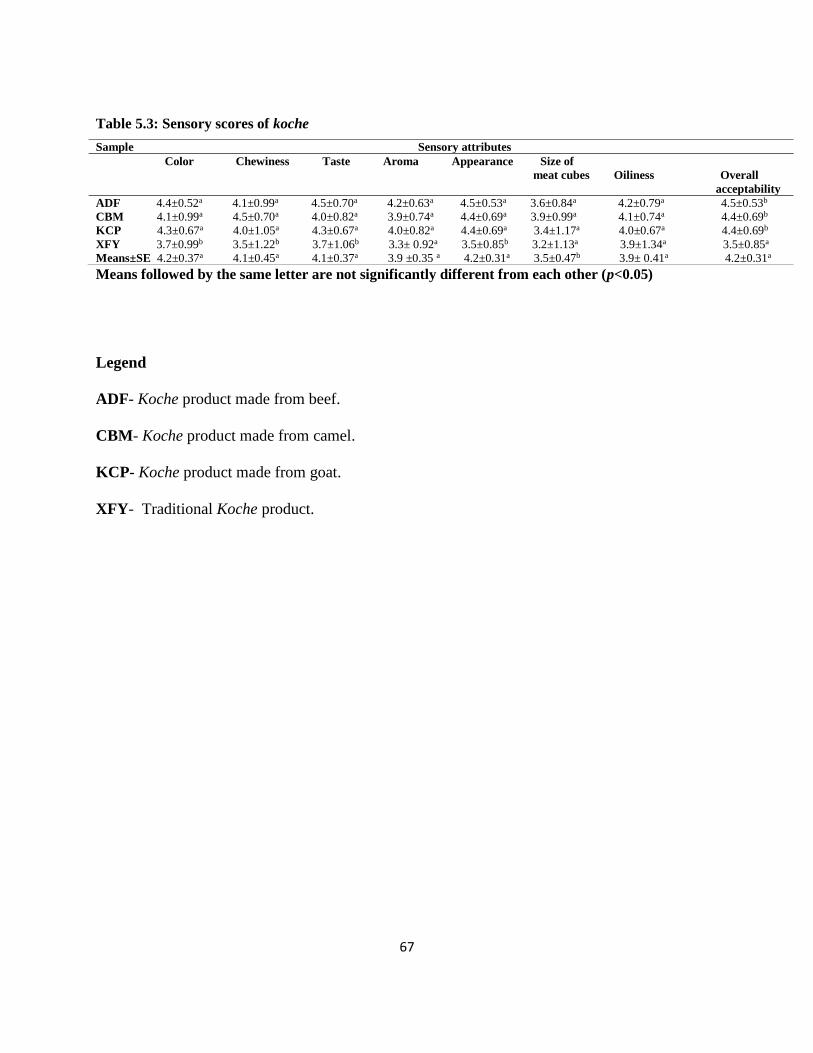
67
Table 5.3: Sensory scores of koche
Means followed by the same letter are not significantly different from each other (p<0.05)
Legend
ADF- Koche product made from beef.
CBM- Koche product made from camel.
KCP- Koche product made from goat.
XFY- Traditional Koche product.
Sample Sensory attributes
Color Chewiness Taste Aroma Appearance Size of
meat cubes Oiliness Overall
acceptability
ADF 4.4±0.52a 4.1±0.99a 4.5±0.70a 4.2±0.63a 4.5±0.53a 3.6±0.84a 4.2±0.79a 4.5±0.53b
CBM 4.1±0.99a 4.5±0.70a 4.0±0.82a 3.9±0.74a 4.4±0.69a 3.9±0.99a 4.1±0.74a 4.4±0.69b
KCP 4.3±0.67a 4.0±1.05a 4.3±0.67a 4.0±0.82a 4.4±0.69a 3.4±1.17a 4.0±0.67a 4.4±0.69b
XFY 3.7±0.99b 3.5±1.22b 3.7±1.06b 3.3± 0.92a 3.5±0.85b 3.2±1.13a 3.9±1.34a 3.5±0.85a
Means±SE 4.2±0.37a 4.1±0.45a 4.1±0.37a 3.9 ±0.35 a 4.2±0.31a 3.5±0.47b 3.9± 0.41a 4.2±0.31a

68
5.4.3 Shelf life analysis.
5.4.3.1 Effect of packaging and storage time on microbial quality of upgraded koche
product
Table 5.4 shows the results of microbial quality of upgraded koche product packed in plastic jars
and glass jars. Total aerobic count showed an increase from log 2.23 to 6.64 during the entire
accelerated storage period from day 0 to 6 days. Listeria monocytogene increased from log 1.26
to log 2.20. Similarly, staphylococcus aureus showed an increase from log 1.53 to log 2.19.
Lactic acid bacteria were not detected on day 0 but there was an increase from day 1 to day 6
with values ranging from 1.48 to 2.19 respectively. Yeasts and moulds were not detected on day
0 but showed an increase from day 1 to day 6 of accelerated storage with values ranging from log
1.67 to log 2.22 respectively.

69
Table 5.4: Effect of packaging and storage time on the microbial quality of upgraded koche product
Type of packaging Period of storage (Days) Means
0 1 2 3 4 5 6
Total viable count
Plastic jars 2.23±0.11a 2.73±0.04b 3.70±0.05c 4.16+0.21c 4.75±0.05cd 6.58±0.09d 6.64±0.02d 4.39±1.66A
Glass jars 2.23±0.11a 3.48±0.08b 3.8 ±0.03b 3.82±0.03c 4.17±0.06c 5.58±0.04c 6.41±0.05c 4.04±1.45A
Staphylococcus Aureus
Plastic jars 1.53±0.02a 1.59±0.04b 1.70±0.04c 1.74±0.04d 1.83±0.04de 1.90±0.06de 2.19±0.10e 1.78±0.22B
Glass jars 1.55±0.06a 1.56±0.02b 1.61±0.01b 1.66±0.01c 1.87±0.05cd 1.87±0.01d 2.14±0.02d 1.75±0.21B
Listeria Monocytogenes
Plastic jars 1.26±0.04a 1.34±0.04b 1.40±0.01c 1.51±0.08cd 1.7±0.06d 1.88±0.04de 2.20±0.01e 1.61±0.32C
Glass jars 1.26±0.04a 1.33±0.06b 1.34±0.06b 1.41±0.01d 1.67±0.03de 1.72±0.01d 2.04±0.03e 1.54±0.27C
Lactic acid bacteria
Plastic jars ND 1.48±0.04a 1.66±0.06b 1.72±0.01cd 1.98±0.06d 2.08±0.08de 2.19±0.16c 1.57±0.72E
Glass jars ND 1.26±0.08a 1.53±0.11b 1.70±0.01c 1.73±0.04de 1.85±0.07d 2.02±0.03c 1.44±0.65E
Yeasts and moulds
Plastic jars ND 1.67±0.04a 1.69±0.01b 1.71 ±0.01c 1.79±0.04c 1.94±0.05cd 2.22±0.04d 1.57±0.69D
Glass jars ND 1.55±0.06a 1.65±0.04b 1.75±0.03c 1.71±0.01cd 1.83 ±0.04d 2.11±0.09e 1.51±0.66D
Values with different superscripts, lower case along a row and uppercase along a column, are statistically different at p<0.05.
5.4.3.2 Effect of packaging and storage time on the chemical quality of upgraded koche product
Table 5.5 shows the effect of packaging and storage time on the quality of upgraded koche during storage. ANOVA indicated a
significant effect (p<0.05) of packaging and storage time on the moisture content, peroxide value and free fatty acids. Moisture
content values ranged from 28.10 to 34.42, free fatty acid value ranged from 0.85 to 1.65. Peroxide value ranged from 0.64 to 3.48
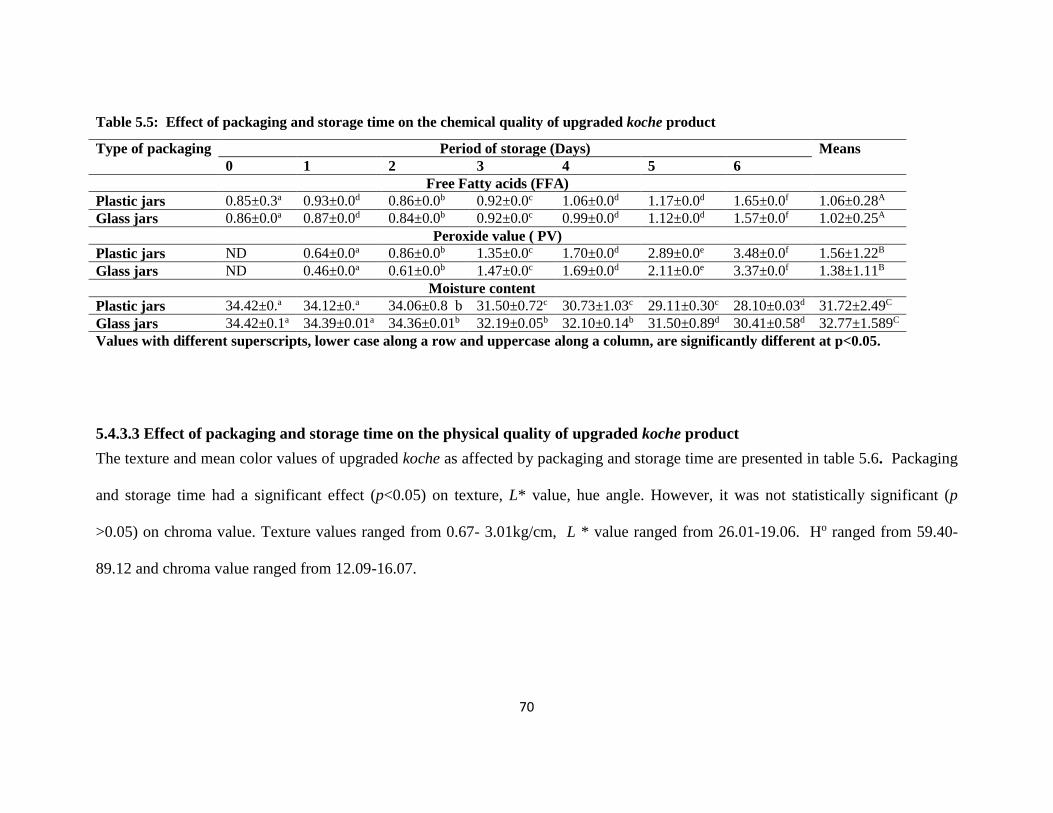
70
Table 5.5: Effect of packaging and storage time on the chemical quality of upgraded koche product
5.4.3.3 Effect of packaging and storage time on the physical quality of upgraded koche product
The texture and mean color values of upgraded koche as affected by packaging and storage time are presented in table 5.6. Packaging
and storage time had a significant effect (p<0.05) on texture, L* value, hue angle. However, it was not statistically significant (p
>0.05) on chroma value. Texture values ranged from 0.67- 3.01kg/cm, L * value ranged from 26.01-19.06. Ho ranged from 59.40-
89.12 and chroma value ranged from 12.09-16.07.
Type of packaging Period of storage (Days) Means
0 1 2 3 4 5 6
Free Fatty acids (FFA)
Plastic jars 0.85±0.3a 0.93±0.0d 0.86±0.0b 0.92±0.0c 1.06±0.0d 1.17±0.0d 1.65±0.0f 1.06±0.28A
Glass jars 0.86±0.0a 0.87±0.0d 0.84±0.0b 0.92±0.0c 0.99±0.0d 1.12±0.0d 1.57±0.0f 1.02±0.25A
Peroxide value ( PV)
Plastic jars ND 0.64±0.0a 0.86±0.0b 1.35±0.0c 1.70±0.0d 2.89±0.0e 3.48±0.0f 1.56±1.22B
Glass jars ND 0.46±0.0a 0.61±0.0b 1.47±0.0c 1.69±0.0d 2.11±0.0e 3.37±0.0f 1.38±1.11B
Moisture content
Plastic jars 34.42±0.a 34.12±0.a 34.06±0.8 b 31.50±0.72c 30.73±1.03c 29.11±0.30c 28.10±0.03d 31.72±2.49C
Glass jars 34.42±0.1a 34.39±0.01a 34.36±0.01b 32.19±0.05b 32.10±0.14b 31.50±0.89d 30.41±0.58d 32.77±1.589C
Values with different superscripts, lower case along a row and uppercase along a column, are significantly different at p<0.05.

71
Table 5.6: Effect of packaging and storage time on the physical quality of upgraded koche product
Type of packaging Period of storage (Days) Means
0 1 2 3 4 5 6
Texture
Plastic jars 0.67±0.01a 1.10±0.01b 2.49±0.03b 2.55±0.01b 2.57±0.01b 2.98±0.01b 3.01±0.01a 2.19±0.89A
Glass jars 0.67±0.01a 0.74±0.00a 0.95±0.10a 1.17±0.18a 1.29±0.23a 1.45±0.07a 1.48±0.05b 1.11±0.33A
L*
Plastic jars 26.01±0.01a 24.20±0.17b 23.30±0.42b 22.93±0.38b 21.33±0.47b 20.66±0.08b 19.39±0.55b 22.55±2.18B
Glass jars 26.01±0.01a 21.00±0.57a 22.93£±0.3 b 20.34±0.33a 20.52±0.25a 19.47±0.38a 19.06±0.09a 21.10±2.23A
Hue
Plastic jars 59.42±0.00a 63.43±1.06a 70.79±1.48a 79.89±1.09a 87.99±0.80a 89.31±0.27a 89.12±0.13a 76.71±12.87A
Glass jars 59.42±0.00a 61.81±0.19a 67.31±1.13b 71.43±0.57b 79.23±0.10b 84.00±0.16b 89.10±0.10b 73.18±10.91B
Chroma
Plastic jars 16.07±2.01a 14.32±0.69a 13.23±0.11a 12.88±0.04a 12.43±0.00a 12.28±0.00a 12.21±0.00a 13.35±1.48A
Glass jars 1.65±0.00a 13.65±0.13a 12.93±0.12a 12.40±0.04a 12.22±0.01a 12.21±0.00a 12.21±0.00a 12.90±0.90A
Values with different superscripts, lower case along a row and uppercase along a column, are statistically different at p<0.05.
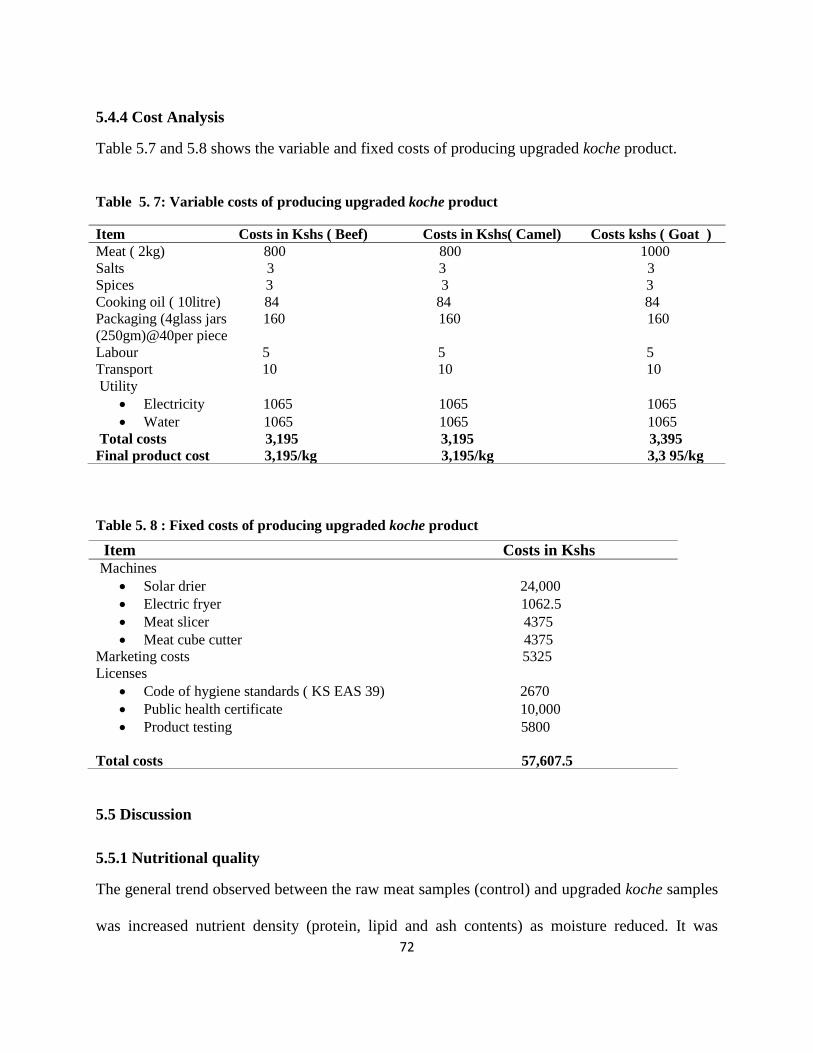
72
5.4.4 Cost Analysis
Table 5.7 and 5.8 shows the variable and fixed costs of producing upgraded koche product. Table 5. 7: Variable costs of producing upgraded koche product
Table 5. 8 : Fixed costs of producing upgraded koche product
5.5 Discussion
5.5.1 Nutritional quality
The general trend observed between the raw meat samples (control) and upgraded koche samples
was increased nutrient density (protein, lipid and ash contents) as moisture reduced. It was
Item Costs in Kshs ( Beef) Costs in Kshs( Camel) Costs kshs ( Goat )
Meat ( 2kg) 800 800 1000
Salts 3 3 3
Spices 3 3 3
Cooking oil ( 10litre) 84 84 84
Packaging (4glass jars 160 160 160
(250gm)@40per piece
Labour 5 5 5
Transport 10 10 10
Utility
Electricity 1065 1065 1065
Water 1065 1065 1065
Total costs 3,195 3,195 3,395
Final product cost 3,195/kg 3,195/kg 3,3 95/kg
Item Costs in Kshs Machines
Solar drier 24,000
Electric fryer 1062.5
Meat slicer 4375
Meat cube cutter 4375
Marketing costs 5325
Licenses
Code of hygiene standards ( KS EAS 39) 2670
Public health certificate 10,000
Product testing 5800
Total costs 57,607.5

73
similar to data reported by Fernandez-Gines and others (2005).The high moisture content in
koche samples was attributed to curing and spicing. Similarly, Pinero and others (2008) reported
that use of spices reduces moisture loss during deep frying by increasing the water ability of the
meat tissues. Therefore, the cooked upgraded koche samples would satisfy the today’s
consumers’ preferences for more tender, less dehydrated koche product. The fat content in
upgraded koche samples was considerably high. This may be due to oil absorption during deep
frying. As reported by Aprajeeta and others (2015), drying and subsequent deep frying of foods
such as meat chunks causes porosity changes thereby increasing oil absorption. Protein content
reported an apparent increase after deep frying. During deep frying, water is extracted increasing
the dry matter of the final product. The protein content demonstrates the potential value of
upgraded koche product as a source of high protein food. The ash levels of the koche samples
were high as compared to the fresh meat samples a reflection of the added salts used in
processing. As reported by (Huda et al., 2012; Bourne, 2002) addition salts such as sodium
chloride, phosphates during processing increases ash content of a product and influences the
textural properties of food. A reduction in carbohydrates and fibres was due to the high
temperatures employed during deep frying of the product. Chloe and Min, (2007) reported that
high temperatures result in loss of nutritional components.
5.5.2 Consumer acceptability
Consumer acceptability and perception of quality is influenced by sensory characteristics
(Simela, 2005).Sensory characteristics are thus pivotal. In this study, deep frying contributed to
the sensory characteristics (Saguy and Dana, 2003). Palatability of the deep fried products was
influenced by texture, flavor, colour, and appearance, size of meat cubes, oiliness, chewiness and
taste. Upgraded koche samples made from camel, beef and goat scored highly in regards to
74
colour, taste, appearance and overall acceptability. Overall acceptability of upgraded koche
product made from camel, beef and goat was the same.
5.5.3 Shelf life analysis
5.5.3.1 Effect of packaging and storage time on the microbial quality of upgraded koche
product.
Total aerobic count, yeasts and moulds, listeria monocytogenes, staphylococcus aureus and
lactic acid bacteria were able to grow in the upgraded koche samples. Curing increased the water
binding ability thus making the environment conducive for microbial growth (Veronique, 2008).
Packaging did not have a significant difference (p>0.05) in the total aerobic count, listeria
monocytogenes, staphylococcus aureus, lactic acid bacteria and yeasts and moulds. Similar
findings have been reported by Gichure and others (2017) in deep fried beef chunks packed in
glass and plastic jars stored at 370 C for 15 days. In both packaging systems the values were
within the range specified for ready to eat meat products by Kenya bureau of standards (KEBS)
upto 5th day of accelerated storage. According to Kenya bureau of standards (KEBS) (KS 2455:
2013, KSS59-2:2013) the legal limits for TVC, staphylococcus aureus, listeria monocytogenes ,
yeasts and moulds, lactic acid bacteria are 6.0 log10cfu/g, 2.0log10cfu/g, 2.0log10cfu/g,2.0
log10cfu/g, 2.0log10cfu/g respectively.
5.5.3.2 Effect of packaging and storage time on the physicochemical quality of upgraded
koche product.
5.5.3.2.1 Moisture content
Packaging did not have a significant effect on moisture content (p > 0.05). Moisture content in
both packaging conditions showed a declining trend. However, product packed in glass jars had
high moisture content than product packed in plastic jars.

75
5.5.3.2.2 Free Fatty acids (%)
Free fatty acids increased significantly during storage an indication of lipolysis. Packaging did
not have a significant effect (p > 0.05) on the level of free fatty acid in the product. This is in
line with a study by Malik and others (2014) where he found out free fatty acids percent was not
significantly affected by the type of packaging. However, product packed in plastic jars had a
high level of free fatty acids than product packed in glass jars. From day 1 to day 5 of accelerated
storage, the free fatty acid levels in the product were within the acceptable limit of less than 1%
(Tiwari et al., 2011). The low level of free fatty acids points out minimal hydrolysis of
triglycerides, as high deep frying temperatures denatures most lipase enzymes as suggested by
Camire and others (1990). However, on day 6, the level of free fatty acids in the product
exceeded the allowable limits.
5.5.3.2.3 Peroxide value
Detection of peroxide value in meat products indicates rancidity (Jin et al., 2009). At day 0,
peroxide values were low. Similarly, Charbia and others (2002) reported that at the beginning of
shelf life of foods peroxide values are low. However, peroxide values increased significantly
throughout the storage period regardless of the type of packaging used. As observed, product
packed in glass jars yielded lower scores than product packed in plastic jars. But the difference
was not significant (p>0.05). In both packaging systems, the peroxide value levels were within
the recommended values of between 3- 20meq/kg (Tiwari et al., 2011).
5.5.3.2.4 Texture
Texture is the sensory characteristic of food detected through the senses of vision, hearing, touch
and Kinesthetics. Its components include toughness/ fibrousness, mealiness /grittness, firmness/

76
softness, crispness, juiceness (Szczesniak, 2002). The firmness values increased with storage
time. Packaging had an influence on (p < 0.05) the firmness values of upgraded koche product.
Upgraded koche product packed in plastic jar recorded high firmness values than the one packed
in glass jars.
5.5.3.2.5 Color values
Color of meat is an important quality attribute (Feiner, 2006). The L*, a* and b* values indicate
the source of light variation in light scattering from the surface of meat and degree of browning
(Van oeckel, Warnants and Boucque, 1999). The H* and C* values were calculated since they
provide greater sensitivity than a* and b* values alone. Packaging significantly affected the color
values ( p<0.05) except the chroma value. The L* values showed a declining trend during storage
irrespective of the packaging type. The lowest L* Value occurred on day 6 of storage. This
supports the findings of Aksu and Kaya (2001a, 2001b) where he reported a similar trend in the
L* values. Hue angle is the description of color in language (red, yellow, green, blue) (AMSA,
2012). Hue color of upgraded koche product in plastic jars was significantly (p<0.05) higher
than in glass jars. Larger hue values indicate more metmyoglobin formation (Howe, Gullet and
Usborne, 1982).
5.5.3.2.6 Cost analysis
The comparative production for the upgraded koche made from camel, beef and goat shows
benefit to the processor. All the variable costs were the same, only the cost of meat varied.

77
5.6 Conclusion
Upgraded koche has a high shelf-life and can be conveniently packed in glass jars and stored for
5months at room temperature. The cost of production is also affordable. It is thus possible to
upgrade koche product for commercialization thus increased incomes.
78
CHAPTER SIX: GENERAL CONCLUSIONS AND RECOMMENDATIONS
6.1 General Conclusions
From this research, commercial viability of upgraded koche product exists. The study established
that koche processing is a profitable business evidenced by the gross margin values. However, it
is still done on small scale by few processors. Several challenges face the processors making the
product unable to tap into new market opportunities. The study revealed a great market potential.
A high proportion of the study population purchased koche product. Upgraded koche product
exhibited better quality in terms of nutrition and storability thus potential for commercialization.
6.2 General Recommendations
1. Processing of koche product as a commercial activity is recommended.
2. Adoption of the optimized and upgraded koche processing is much more beneficial to the
small scale processors in terms of market positioning and enhancing consumer
acceptability of the product.
3. Processors should progressively be trained and equipped with good quality control
measures during processing.
4. In addition, any development programs or government policy directed towards improving
livestock production to increase meat supply will increase the profit from koche
processing and lead to the advancement of koche industry since the profit realized from
koche processing is mainly affected by the cost of meat.
5. Promotion should also be done to non-conventional consumers to increase consumption.

79
REFERENCES
Abou-Charbia, H.A., Shehata, A. A., and Shadidi, F. (2002) .Effect of processing on oxidative
stability and lipid classes of sesame oil . Food research international ; 33:331-340.
Acho-chi, C. (2002). The mobile street food service practice in the urban economy of Kumba,
Cameroon. Singapore Journal of Tropical Geography; 23: 131-148.
Ahmadu, J., Erhabor,P.O., Orewa,S.I., and Igene,J.O . (2008 b). Resource use efficiency in
traditional Kilishi production in Bauchi and Kaduna States of Nigeria. Journal of
Agricultural Research and policies ; 3 (2): 51 –64.
Ahmadu, J., Alufohai, G.O. Erhabor,P.O. Igene, J.O. (2008 a). Profitability of Kilishi Production
under traditional and modern technologies in Nigeria. Journal of Sustainable Tropical
Agricultural Research ; 28:14-21.
Ahmadu,J., Igene,J.O.Ada-Okungbowa,C.I.,and Agboola,H.A. (2004). Economics of kilishi
production in Nigeria. Applied Tropical Agriculture: An International Journal; 9 : 25-
33.
Amao. J.O., and Ayantoye, K. (2014). Consumer Preference and Consumption Pattern for
selected forms of Fish in Oyo State, Nigeria. International Journal of Science,
Environment and Technology; 3 (3):841 – 860.
Amran, H. L., and Aslan, A. (2012). Knowledge Determinant in University Commercialization.
A case study of Malaysia Public University, Asia. Pacific Business Innovation and
Technology Management ; 251-257.
80
Andree, S., Jira,W., Schwind,K.H., Wagner,H., and Schwagele, F. (2010). Chemical safety of
meat and meat products. Meat science ; 86 (1) : 38-48.
AOAC. (2005).Official methods of analysis of AOAC International. 18th edition. Published by
the association of Analytical communities international . Gaithersburg,MD.
Apata, E.S., Osidibo,O.O., Apata,O.C., and Okubanjo,A.O. ( 2013). Effects of different solar
drying methods on quality attributes of dried meat production (kilishi). Journal of
Food Research ; 2(1): 80-86.
Aprajeeta,J., Gopirajah,.R., and Anandharamakrishnan, C. (2015) . Shrinkage and porosity
effects on heat and mass transfer during potato drying. Journal of Food Engineering ;
144: 119-128
Asogwa, I .S., and Okoye,J.I. (2017). Promotion of indigenous food preservation and
processing knowledge and the challenge of food security in Africa. Journal of Food
Security; 3:75-87.
Awuor, A, Integrating Indigenous Knowledge for Food Security: Perspectives from the
Millennium Village Project at Bar-Sauri in Nyanza Province in Kenya. A Paper
presented to the African Research and Resource Forum (ARRF) and the Economic
Policy Research Centre (EPRC) for held Kampala, Uganda on 16-17, November 2011.
Ayanwale, B.A., Ocheme, O.B., and Oloyede, O.O. (2007). The effect of sun-drying and oven-
drying on the nutritive value of meat pieces in hot humid environment. Pakistan
Journal of Nutrition. 6(4): 370-374.

81
Behnke, R., and Muthami, D. (2011). The contribution of livestock to the kenyan economy.
IGAD, Livestock Policy Initiative working paper, (03-11).
Bender Arnold. Meat and meat products in human nutrition in developing countries. Italy:
FAO Food and Nutrition Paper; 1993.
Berndsen,M., and Pligt, J.V.D “Ambivalence towards meat,” . Appetite; 42(1): 71-78.
Bora, L., and J. Bam. 2014. Traditional milk, meat processing and preservation techniques of the
yak pastoralists of Arunachal Pradesh. Indian Journal of Traditional Knowledge 131
(1): 216–221.
Bourne, M. (1992). Calibration of rheological techniques used for foods. Journal of Food
Engineering ; 16: 151- 163.
Brown, L, (2011). Women and food security; roles, constraints and missed opportunities .In: The
role of food, agriculture, forestry and fisheries in human nutrition .Squires, V.R
edunesco-eolss e-book. 2011.
Camire,M.E., Camire, A.L., and Krumhar,K. ( 1990). Chemical and nutritional changes in foods
during extrusion. Critical reviews in Food Science and Nutrition ; 29: 35-57.
Cengiz, S., Yilmaz, E., Mencet, M.N., Suleyman, K. and Yavuz, T. (2010). Analysis of Factors
Affecting Fish Purchasing Decisions of the Household: Antalya District Case. Journal
of Animal and Veterinary Advance; 9(12):1689-1695.
Chambwera, M. (2012). The informal economy: A threat or driver for the green economy?
82
Choe, E., and Min, D.B. (2007). Chemistry of Deep –Fat Frying oils. Journal of Food Science;
72(5): 77-86.
CSIR, 2001. Investigations on the preparations of biltong. CSIR Food Biological and Chemical
Technologies, Pretoria
Dabasso, B.G., Roba, H.G., Makokha, A., Onyango, A., and Maina, J. (2018). Understanding
traditional meat processing knowledge among the Borana pastoralist of Northern
Kenya. Journal of Food Research ; 7: (4) : 30-40.
Delgado, C. L. (2003). “Rising consumption of meat and milk in developing countries has
created a new food revolution.” Journal of Nutrition; 133(11): 3907S-3910S.
EPZA (2005), Meat Production in Kenya. Kenya Export Processing Zones Authority. Nairobi,
Kenya. Retrieved from http://www.epzakenya.com/UserFiles/File/MeatIndustry.pdf
last accessed on 30/05/2018.
FAO (2007). Manual on meat cold store operations and management. Agriculture and
consumer protection . FAO Corporate Document Repository FAO, Rome.
FAO (1995). Development and promotion of value added products. Project Document, FAO,
Rome.
FAO (2011). Global Food Losses and Food Waste - extent, causes and prevention. Rome, Food
and Agriculture Organization of the United Nations. Accessed March 2017.

83
FAO, The State of Food and Agriculture 2010-11, Livestock in a balance, Electronic Publishing
Policy and Support Branch Communication Division-FAO, Rome, Italy, 2009.
Accessed April 2018.
FAO. (2013). Small holder integration into changing food markets. Food and Agriculture
Organization. Accessed on march 2017.
FAO. 2001. Improved meat drying in Asia and Pacific, FAO Rome. Accessed July 2018.
FAOSTAT (2011), “FAO Statistical Database”. Retrieved from http://faostat.fao.org/, accessed
March 2017.
Farmer, E., and Mbwika, J. (2012). End market Analysis of kenyan livestock and meat. Usa:
USAID.
Feiner, G. (2006). Colour in fresh meat and in cured meat products. Meat products handbook:
Practical science and technology. Cambridge, England: Woodhead Publishing
Limited.
Fernandez-Gines, J.M., Fernandez-Lopez, J., Sayas-Barbera,E., and Perez-Alvarez, J.A. ( 2005).
Meat products as functional foods. Journal of Food Science ; 70: R37-R43.
Fnifst,O.C.A.P ( 2008). The role of traditional food processing technologies in National
development: the West African experience. Retrieved from https://
www.researchgate.net /publication/237218596

84
Gadaga, T.H., Ntisike,M.M., and Ntuli,V . (2011). Socio-economic and hygienic aspects of
street food vending in Maseru City, Lesotho. USWA Research Journal of Agriculture,
Science and Technology; 15: 28-39.
Gichure, J. N., Kunyanga, C. N., and Imungi, J. K. (2017). Standardization of cut size and pre-
drying time to mainstream pastoral beef farming. Pastoralism,Research,policy and
Practice ; 7: 1-2.
Gichure, J.N.,Kunyanga,C.N.,Mathi,P.M.,and Imungi,J.K. (2014). Present status of
meatprocessing and preservation in the pastoral regions of kenya. Food Science and
Quality Management; 34:42-50
Gichure, J.N.,Kunyanga,C.N.,Mathi,P.M.,and Imungi,J.K. (2016). Chemical and sensory
Attributes of selected meat products from Kenyan pastoral communities: Case of
Nyirinyiri, Enyas, Ng’amorumoru, and Olpurda. In press.
Gichure,J.N.,Kunyanga,C.N.,Mathi,P.M.,and Imungi,J.K.(2015). Meat preservation technologies
in Kenya’s Pastoral Areas with Potential for Market Competitiveness Improvement.
Paper presented at Conference on Policies For Competitive Smallholder Livestock
Production. Gaborone, Botswana,4-6 March 2015.
Government of Republic of Kenya. 2007. Kenya Vision 2030. Ministry of Devolution and
planning. Nairobi; Government printer.
Grunert KG ( 1997) What’s in a steak? A cross-cultural study on the quality perception of beef.
Food Quality and Preference, 8(3): 157-173.
85
Hansen, S., Hansen, T., Aaslyng, M. D. and Byrne, D. V. (2004). Sensory and
instrumentalanalysis of longitudinal and transverse textural variation in pork
longissimus dorsi. Meat Science, 68, 611-629.
Herlocker, D.J., Shaaban, S.B., and Wilkes, S. (1993). Range management handbook of Kenya.
Volume II, 5: Isiolo District. Nairobi: Ministry of Agriculture, Livestock Development
and Marketing .
Homewood, K.M., P.C. Trench, and D. Brockington. (2012). Pastoralist livelihoods and wildlife
revenues in East Africa: A case for coexistence? Pastoralism, Policy and Research
Journal 2: 19.
Howe, J. L., Gullett, E. A. & Usborne, W. R. (1982). Development of pink color in cooked
pork.Canadian Institute of Food Science and Technology, 15, 19.
http://www.greeneconomycoalition.org/know-how/informal-economy-threat-or-driver-green-
economy. Accessed on May 2018.
Huda, N., Alistair, T.L.J., Lim, H.W., and Nopianti, R. (2012) Some quality characteristics of
Malaysian commercial fish sausage. Pakistan Journal of Nutrition; 11(8):700–705.
Hudson, D., and Hite,D. (2003). Willingness to Pay for Water Quality Improvements: The Case
of Precision Application Technology. Journal of Agricultural Resource Economics ;
27:433-449.
86
Iheanacho, A.C., and D.O.A. Philips. (2002). Costs and Returns of Millet-Based Crop Mixtures
in the Arid zone of Nigeria. A case study of Borno state, Nigeria. Journal of Arid
Agricutural, 12: 131–135.
Iliyasu, A., A.C. Iheanacho, and S.I. Mshelia. (2013). Profitability analysis of three methods of
suya production and marketing in Maiduguri Metropolitan Council, Borno State,
Nigeria. Nigerian Journal of Basic and Applied Sciences 16 (2): 257–262. Available
online at https://www.ajol.info.
Irungu P, (2008). Contribution of the livestock sector to Kenya’s GDP: A consultancy report to
Agriculture Sector Coordinating Unit (ASCU), Ministry of Agriculture and Livestock
Development, Nairobi, Kenya.
Ismael, N., Mohd, J. N., and Safiah, S. (2015). A Framework for a Successful Research Products
Commercialization: A case of Malaysian Academic Researchers.
ISO ( 2009). Animal andVegetable fats and oils – Determination of acid value and acidity. ISO
660:2009
ISO (2006). International Organization for Standardization. Sensory analysis- Methodology-
Ranking. EN ISO,8587,2006.
Iyenda, G. (2001). Street food and income generation for poor households in Kinshasa.
Environment and Urbanisation 13: 233-241.
87
Jin, S. K., Kim, I. S., Choi, Y. J., Kim, B. G., and Hur, S. J. (2009). The development of
imitation crab sticks containing chicken breast surimi. LWT-Food Science and
Technology ; 42: 150-156.
Jones,M., Arnaud, E, Gouws,P., and Hoffman.L.C. (2017). Processing of South African Biltong-
A Review. South African Journal of Animal Science, 47: 6
Kapferer, J.N. (2004). The New Strategic Brand Management: Creating and Sustaining Brand
Equity Long Term. London: Kogan Page.
Kardivel, G., Banerjee,B.B., Meitei,S., Doley,S., Sen,A., and Muthukumar, A. (2018). Market
potential and opportunities for commercialization of traditional meat products in North
East hill region of India, Veterinary World; 11 (2): 118-124.
Kenya Market Trust (KMT), (2014). Kenya Livestock & Meat Market Analysis for Cattle ,Goat
&Sheep.http://www.kenyamarkets.org/download/get/kenya-livestock-meat-
analysis1/35.
Khan, S. A. (2005). Introduction to extension education in Memon, R. A. and E. Bashir (eds.).
Extension Methods (3rded.). National Book Found, Islamabad, Pakistan.
Kirkbride, M and Grahn, R. 2008. Survival of the fittest: Pastoralism and climate change in
Africa. Oxfam policy and practice: Agriculture, Food and Land ; 8 ( 3) : 174-220.
Kisembe, S.W., Muliro, P.S., Matofari, J.W., and Bebe, B.O. ( 2017). An evaluation of
nutritional quality of traditionally processed camel meat (Nyirinyiri): Value chain

88
assessment and recommendations. International Journal of Nutrition and Food
Sciences ; 6 (4): 172-174.
KNBS (Kenya National Bureau of Statistics): 2009. Population and housing census. Kenya
National Bureau of Statistics; 2010.
Konstantinos, J., and Dimitrios,D.K . 2015. Depreciation methods and life cycle costing
methodology; Procedia Economics and Finance 19: 314-324
Lin, L.C., and Huang, K.Y. (2004) Comparing of vacuum shrink packaging and vacuum
packaging with vacuum shrink packing treatment process on storage properties of
Taiwan country chicken during chilled storage. Journal of Agriculture and Forestry;
53(3): 251-260.
Lindqvist, A.K., and T. Verba. 2009. Overview of drylands development communication
initiatives in Africa. Chicago. http://pubs.iied.org/pdfs/G02494.pdf
Madete, S.K. P., Bebe,B.O., Matofari, J.W., Muliro,P.S., and Mangeni,E.B. (2015).
Communicating food quality and safety in the informal market outlets of pastoral
suusa and nyirinyiri products in Kenya. Agriculture,Forestry and Fisheries;.4: 216-
221.
Mafimisebi, T. 2012. Comparative Analysis of Fresh and Dried Fish Consumption in Rural and
Urban Households in Ondo State, Nigeria, IIFET 2012 Tanzania Proceedings.
Available
at:https://ir.library.oregonstate.edu/xmlui/bitstream/handle/1957/35117/Mafimisebi.pd
f?sequence =4 Accessed on 27th March, 2018.

89
Makita,D.G., Kangethe, E. K., and Bonfoh, B. (2010). Safe Food Fair Food Participatory Risk
Analysis For Improving the Safety of Informally Produced and Marketted Food in
Sub-Saharan Africa. Revue Africaine de Santé et de Productions Animales 8 (2): 3-11.
Malik .A. H and Sharma,B.D. (2014). Shelf life study of hurdle treated ready-to-eat spiced
buffalo meat product stored at 30±3 °C for 7 weeks under vacuum and aerobic
packaging. Journal of Food Science and Technology ;51(5):832–844.
Mathi, P.M, Kunyanga, C. N. , Gichure, J. N., and Imungi, J. K. (2016). Utilization of beef
slaughter by-products among the Kenyan Pastoral communities. Food Science and
Quality Management ; 53: 80-81.
Mati, B.M., J.M. Muchiri, K. Njenga, F. Penning de Vries, and D.J. Merrey. 2005. Assessing
water availability under pastoral livestock sytems in drought prone Isiolo District,
Kenya. Working paper 106. Colombo, Sri-lanka international water management
institute ( IWM).
Ministry of Agriculture, Livestock and Fisheries (MAL&F), (2015). Strategic Plan 20312017
.http://www.kilimo.go.ke/wpcontent/uploads/2015/05/MoALF_Strategic-Plan_2013-
2017.pdf.
Montcho, M., Babataounde,S.,Yamego,V.B., Aboh, A.B., and Mensah, G.A. (2018). Socio-
economic determinants of away from home grilled meat consumption and typology of
grilled meat actors in bobo-Dioulassa, West Burkina Faso. Journal of Fisheries and
Livestock Production ; 5 (4) : 3-9.

90
Muinde, O.K., and Kuria,E. (2005). Hygienic and sanitary practices of vendors of street foods in
Nairobi, Kenya. African Journal of Food, Agriculture and Nutrition Development ; 5:
1-13.
Musaba, E. C. and Namukwambi, M. (2011). Socio-economic determinants of consumer fish
purchase in Windhoek, Namibia. African Journal of Agricultural Research ;
6(6):1483-1488.
Muthee, A. M. (2006). Kenya Livestock sector study ; An analysis of pastoralist livestock
products market value chains and potential external markets for live animals and
meat. AU-IBAR& NEPDP, consultancy report : Deloitte consulting ltd .
Muyanja, C., Nayiga,L., Namugumya, B., and Nasinyama,G. (2011). Practices, knowledge and
risk factors of street food vendors in Uganda. Food Control; 22: 1551-1558.
Neven, D., and Reardon, T. ( 2004). The Rise of Kenyan Supermarkets and the Evolution of their
Horticulture Product Procurement Systems. Development Policy Review, 22(6): 669-
699
Obadina, A.O, Oyewole, B.O., and Williams,E.O.( 2013). Improvement in the traditional
processing method and nutritional quality of traditional extruded cassava-based snack
(modified Ajogun). Food Science and Nutrition, 1(4): 350-356.
Olsen, S.O. (2001). Consumer involvement in seafood as family meals in Norway: an application
of the expectancy-value approach. Appetite ; 36: 173-186.

91
Omiti, J., and Irungu, P., (2002). Institutional and policy issues relevant to pastoral
development in Kenya. Discussion paper No. 031, Institute of Policy Analysis and
Research (IPAR), Nairobi.
Omojola, A. B. (2008). Yield and organoleptic characteristics of suya (an intermediate moisture
meat) prepared from three different muscles of a matured bull. African Journal of
Biotechnology 7 (13): 2254 – 2257.
Oniang’o , R ., Allotey, J., and Malaba, S.J. (2006). Contribution of indigenous knowledge
and practices in Food Technology to the attainment of Food Security in Africa.
Journal of Food Science.
Ören, K., and Biçkes, M. (2011). Effects of personality traits on entrepreneurship potential: A
study on higher education students in Nevşehir. The Journal of Faculty of Economics
and Administrative Sciences ; 16(3), 67-86.
Parfitt, J., Barthel, M., Macnaughton, S. (2010). Food waste within food supply chains:
quantification and potential for change to 2050. Philosophical Transactions of the
Royal Society; Biological Sciences; 365(1554): 3065-3081.
Pavanello, S. (2010). Livestock marketting in Kenya-Ethiopia Boarder Areas : A baseline study
Humanitarian Policy Group ( HPG), Overseas Development institute ( ODI).
Piñero, M.P., Parra, K., Huerta-Leidenz, N., Arenas de Moreno, L., Ferrer, M., Araujo, S. and
Barboza, Y.2008. Effect of oat’s soluble fibre (β-glucan) as a fat replacer on physical,
chemical, microbiological and sensory properties of low-fat beef patties. Meat Science
; 80(3): 675-680.

92
Rai, A., and U. Palni. 2009. Traditional knowledge of the Himalayan people on production of
indigenous meat products. Indian Journal of Traditional Knowledge 08 (1): 104–109.
Rheinlander, T., Olsen, M., Bakang, J.A., Takyi, H., and Konradsen, F. (2008) .Keeping up
appearances, perceptions of street food safety in urban Kumasi, Ghana. Journal of
Urban Health; 85: 952-964.
Rodriguez del Águila, M. M., and González-Ramírez, A. R. (2013). Sample size calculation.
Allergologia et immunopathologia ; 42(5): 485-492.
Roever, S. (2007). Women, Gender, Development:‘Women and workplace Insecurity’.
Development Issues,9 (1) June.
Rosegrant M. W., S Cline. A., Li, W., Sulser, T.B., and Valmonte-Santos, R.A. (2005). Looking
Ahead: Long-Term Prospects for Africa’s Agricultural Development and Food
Security.2020 Discussion Paper No. 41, International Food Policy Research Institute,
Washington, DC, USA.
Russell, B.C., McAlister,G.,Ross,I.S.,and Pethick,D.W. ( 2005). Lamb and sheep meat eating
quality-industry and scientific issues and the need for integrated research. Australian
Journal of Experimental Agriculture ; 45: 465-467.
Saguy, I.S., and Dana, D. 2003. Integrated approach to deep fat frying: engineering, nutrition,
health and consumer aspects. Journal of Food engineering; 56(2): 143-152.

93
Satterwaite, D., Mc Granahan, G., and Tacoli,C. (2010). Urbanization and its implication on food
and farming. Philosophical transactions of the royal society of London : Biological
Sciences; 365(1554): 2809-2820.
Sharma, B.D., and N. Kondaiah. 2005. Development of Buffalo meat samosa and evaluation of
its storage in low vacuum family park under frozen condition. Journal of Veterinary
Public Health 2 (3): 59–62.
Simela, L. (2005). Meat characteristics and acceptability of chevon from South African
Indigenous goat. P.h.D. Thesis, University of Pretoria.
Slater, S. and Narver, J.C. (2000), “The positive effect of a market orientation on business
profitability: a balanced replication”, Journal of Business Research, Vol. 48 No. 1, pp.
69-73.
Sonaiya, E.B. (1992). A development strategy for improving sustainable small-holder rural
poultry production. Proceedings XIX World’s Poultry Congress, Amsterdam, The
Netherlands, 20–24 Sept, 1992.
Strydom, P.E. and Zondagh, B. (2014). Biltong: A major South African ethnic meat product.
In: Encyclopaedia of meat sciences, volume 1, second edition.
Szczesniak, A.S. (2002). Texture is a sensory property. Food quality and Preference; 13: 215-
225.
Thornton, P. K. (2010). “Livestock production: recent trends, future prospects,”. Philosophical
Transactions of the Royal Society ; 365(1554): 2853- 2867.

94
Tiwari,U., Gunasekaran,M., Jaganmohan, R., Alagusundaram,K., and Tiwari,B.K. (2011).
Quality characteristic and shelf life studies of deep fried snack prepared from rice
brokens and legume by-product . Food and bio-process technology ; 4( 7 ) : 1172-
1178.
Troy, D.J and Kerry,J.P. (2010). Consumer Perception and the role of Science in the meat
industry, Meat Science , 86,214-226.
Tshuma, M., and B. Jari. (2013). The Informal Sector as a Source of household Income: Journal
of African Studies and Development.
USAID (2012), End Market Analysis of Kenyan Livestock and Meat– A desk study. Micro
Report#184.https://www.microlinks.org/sites/microlinks/files/resource/files/Kenya_Li
vestock_End_Market_Study.pdf .
Van Wyk, M., (2007). The complete South African cookbook, Third Edition. Struik, Cape
Town. 107-108.
Van Oeckel, M. J., Warnants, U., and Boucque, V. (1999). Measurement and prediction ofpork
color. Meat Science ; 52, 347–354.
Veronique,C. (2008). Bioactive packaging technologies for extended shelf-life of meat- based
products. Meat Science, 78 (1),90-103.
Vimiso, P., V. Muchenje, U. Marume, and R. Chiruka. 2012. Preliminary study on consumers
and meat traders perceptions of beef quality and how the beef quality is affected by
animal welfare practices. Sci. Res. Essays 7:2037-2048.
95
Walsh, J. (2010). The street vendors of Bangkok: Alternatives to indoor retailers at a time of
economic crisis. American Journal of Economics and Business Administration, 2(2).
185-8.
Wellard-Dyer, K. 2012. Pastoralism in the Horn of Africa: Diverse livelihood pathways. Future
Agricultures Consortium Secretariat, University of Sussex, Brighton.
York,R., and Gossard,M.H. (2004). “Cross-national meat and fish consumption: exploring the
effects of modernization and ecological context,”. Ecological Economics; 48 (3): 293–
302.

96
APPENDICES
APPENDIX 1: FOCUS GROUP DISCUSSION GUIDE ( PROCESSORS)
1. As commercial processors,what challenges do you experience?
2. What do you think can be done to address these challenges?
3. What are the main operational costs involved in processing?
4. What are the main equipments required in processing?
5. How do you determine the selling price of already processed koche?
6. What is your monthly /daily volume of production?
7. Do you slaughter or buy meat?
8. Where is your end market?
9. In what volumes do you dispense?
10. How do you transport your produce and what are the charges?
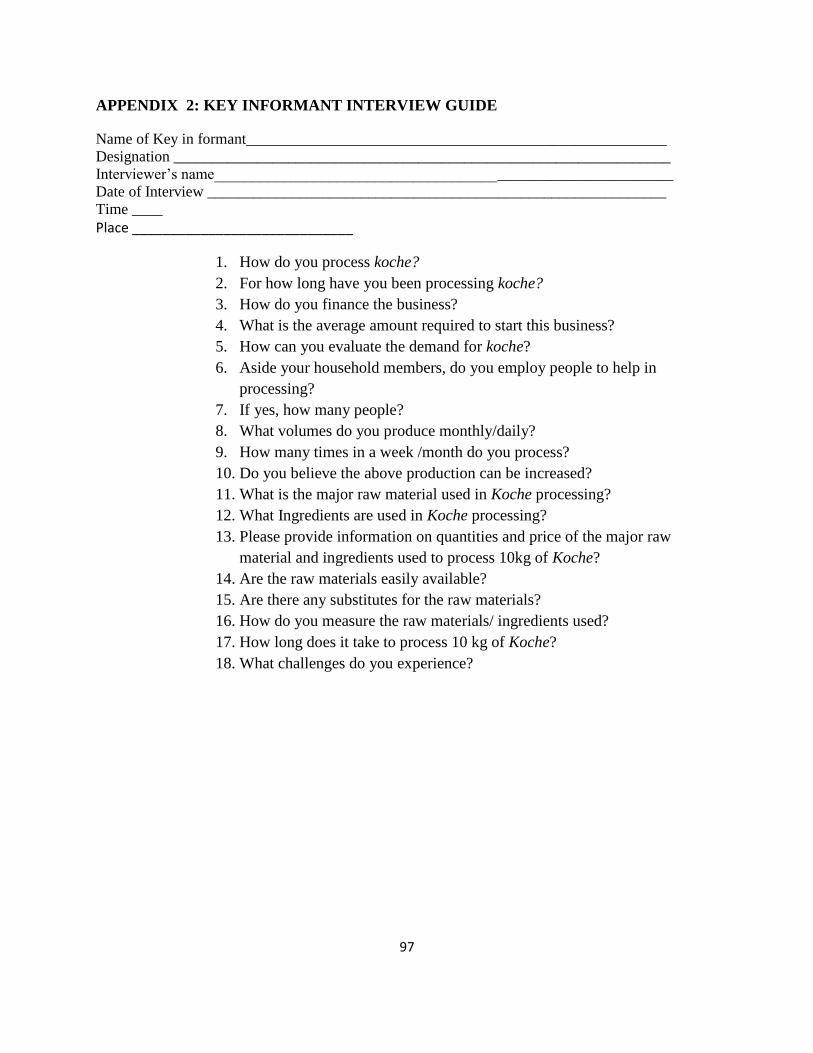
97
APPENDIX 2: KEY INFORMANT INTERVIEW GUIDE
Name of Key in formant_______________________________________________________
Designation _________________________________________________________________
Interviewer’s name____________________________________________________________
Date of Interview ____________________________________________________________
Time ____
Place _____________________________
1. How do you process koche?
2. For how long have you been processing koche?
3. How do you finance the business?
4. What is the average amount required to start this business?
5. How can you evaluate the demand for koche?
6. Aside your household members, do you employ people to help in
processing?
7. If yes, how many people?
8. What volumes do you produce monthly/daily?
9. How many times in a week /month do you process?
10. Do you believe the above production can be increased?
11. What is the major raw material used in Koche processing?
12. What Ingredients are used in Koche processing?
13. Please provide information on quantities and price of the major raw
material and ingredients used to process 10kg of Koche?
14. Are the raw materials easily available?
15. Are there any substitutes for the raw materials?
16. How do you measure the raw materials/ ingredients used?
17. How long does it take to process 10 kg of Koche?
18. What challenges do you experience?

98
APPENDIX 3: QUESTIONAIRE (ASSESSMENT OF THE CURRENT STATUS OF
MARKETING OF KOCHE PRODUCT IN EAST LEIGH TOWN IN NAIROBI)
Name of seller______________________________________________________
Interviewer’s name____________________________________________________________
Date of Interview ____________________________________________________________
Time ____
Town _____________________________
General introduction of researcher/recorder. Introduce topic. Inform of intention to record.
Section 1: Socio- demographic Characteristics
1. Age of seller in years. 1. 20- 25 [ ] 2. 30 -35 [ ] 3.35-40 [ ] 4.40 and above [ ]
2 .Marital status. 1 Single [ ] 2. Married [ ] 3. Divorced [ ] 4. Widowed [
3. Level of Education. 1. Primary [ ] 2. Secondary [ ] 3. College [ ] 4. No education [ ]
Section 2: Marketing Potential
4. For how long have you been selling Koche Product? 1. Less than 3yrs [ ] 2. 3 to 5yrs [ ]
3.6 to 8yrs [ ] 4.9 to 10 yrs [ ] 5.More than 10 yrs [ ]
5. How is the sell method? 1. On contract basis [ ] 2. On daily sell basis [ ] 3. Both [ ]
6. Where is the selling place? 1. Stalls/shops [ ] 2.On the streets [ ] 3. Restaurants/hotels
4. Others [ ]
7. How has been the demand of Koche over the years? 1. Increasing [ ] 2.Decreasing [ ]
3.Fluctuating [ ]
8. Who are your main buyers? 1. Individual customers [ ]. 2. Retailers [ ] 3.Others [ ]
9. What is the most important market outlet selection criterion? 1. Price [ ] 2.Product quality and
safety [ ] 3.Market reliability [ ] 4.Distance of Market for Indigenous meat products.
10. Tick your reasons for engaging in selling Koche product using a scale of 1-4 where 4= to a
very great extent, 3= to a great extent, 2=low extent and 1= not a reason.

99
e Reasons 1 2 3 4
1 Major source of income
2 Supplementary income
3 Others ( specify)
11. Who are your main suppliers? 1. From Isiolo [ ] 2.From Garissa [ ] 3.Others please specify [
12 .Do you buy on informal contractual arrangement from the supplier? 1 .Yes [ ] 2 NO [ ]
13. How many buckets of Koche do you sell in a month? 1. Less than 5 buckets [ ] 2. 5- 10
buckets [ ] 3. 10-15 buckets [ ] 4.15- 20 buckets [ ] 5. More than 20 buckets. [ ]
14. In what proportions/weights do you sale Koche?
15. What is the price of 1kg of Koche?
16. How do you determine the unit selling price of Koche? 1. I cost the raw materials/
ingredients and decide how much to sell [ ] 2. Price is set by the processors [ ] 3. I accept the
price offered by the consumer [ ] 4. Others (specify)
17. How much profit do you earn----------------- on average per month? 1. 5000 kshs [ ]. 2.
5000-10000 kshs [ ] 3.10000- 15000kshs [ ] 4. More than 15000 kshs [ ]
18. Indicate the needs met in the household with the profit generated from selling Koche using a
scale of 1-4 where 4 = to a very a great extent, 3= to a great extent, 2= to a low extent, 1= not a
reason.
S/No Needs Met 1 2 3 4
1 Feeding
2 School Fees
3 House rent
4 Expanded business
5 Buying land

100
6 Building houses
7 Others ( specify)
19. Indicate the challenges you face as a seller of Koche using the a scale of 1-4 where 4- to a
very great extent, 3- to a great extent, 2- to a low extent , 1- not a reason.
S/No Challenges faced 1 2 3 4
1 Financial Constraints
2 Few customers.
3 Market space.
4 Others ( please specify)
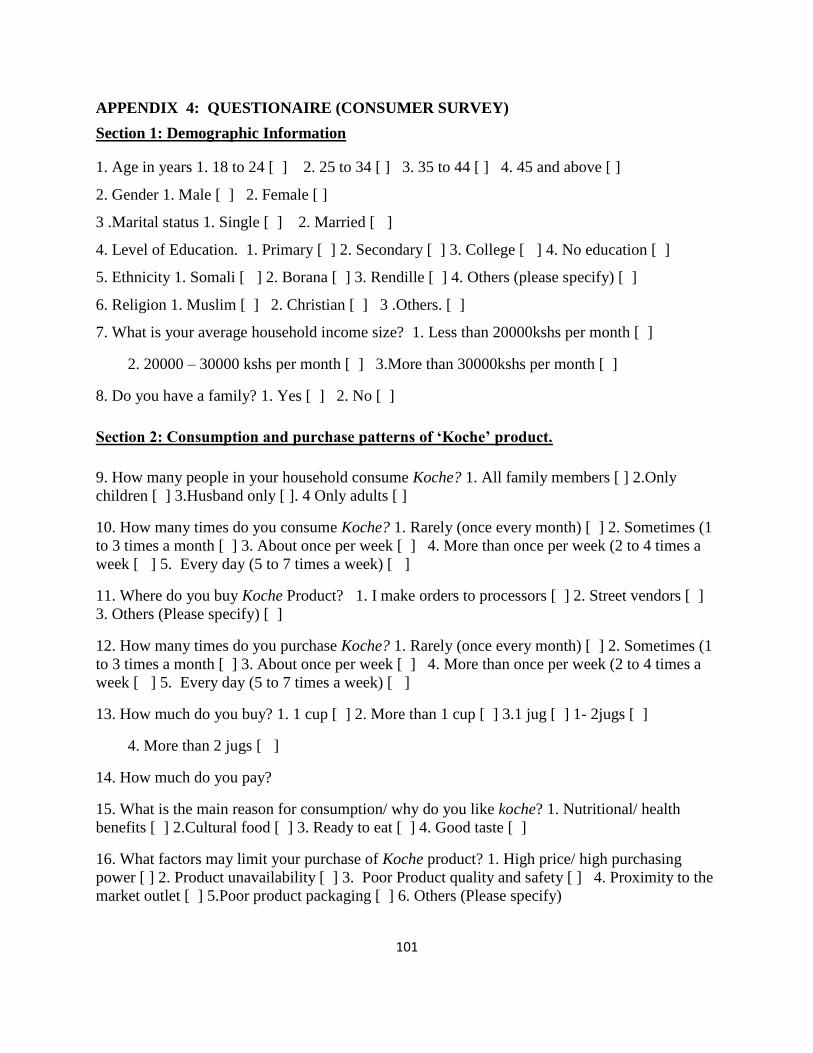
101
APPENDIX 4: QUESTIONAIRE (CONSUMER SURVEY)
Section 1: Demographic Information
1. Age in years 1. 18 to 24 [ ] 2. 25 to 34 [ ] 3. 35 to 44 [ ] 4. 45 and above [ ]
2. Gender 1. Male [ ] 2. Female [ ]
3 .Marital status 1. Single [ ] 2. Married [ ]
4. Level of Education. 1. Primary [ ] 2. Secondary [ ] 3. College [ ] 4. No education [ ]
5. Ethnicity 1. Somali [ ] 2. Borana [ ] 3. Rendille [ ] 4. Others (please specify) [ ]
6. Religion 1. Muslim [ ] 2. Christian [ ] 3 .Others. [ ]
7. What is your average household income size? 1. Less than 20000kshs per month [ ]
2. 20000 – 30000 kshs per month [ ] 3.More than 30000kshs per month [ ]
8. Do you have a family? 1. Yes [ ] 2. No [ ]
Section 2: Consumption and purchase patterns of ‘Koche’ product.
9. How many people in your household consume Koche? 1. All family members [ ] 2.Only
children [ ] 3.Husband only [ ]. 4 Only adults [ ]
10. How many times do you consume Koche? 1. Rarely (once every month) [ ] 2. Sometimes (1
to 3 times a month [ ] 3. About once per week [ ] 4. More than once per week (2 to 4 times a
week [ ] 5. Every day (5 to 7 times a week) [ ]
11. Where do you buy Koche Product? 1. I make orders to processors [ ] 2. Street vendors [ ]
3. Others (Please specify) [ ]
12. How many times do you purchase Koche? 1. Rarely (once every month) [ ] 2. Sometimes (1
to 3 times a month [ ] 3. About once per week [ ] 4. More than once per week (2 to 4 times a
week [ ] 5. Every day (5 to 7 times a week) [ ]
13. How much do you buy? 1. 1 cup [ ] 2. More than 1 cup [ ] 3.1 jug [ ] 1- 2jugs [ ]
4. More than 2 jugs [ ]
14. How much do you pay?
15. What is the main reason for consumption/ why do you like koche? 1. Nutritional/ health
benefits [ ] 2.Cultural food [ ] 3. Ready to eat [ ] 4. Good taste [ ]
16. What factors may limit your purchase of Koche product? 1. High price/ high purchasing
power [ ] 2. Product unavailability [ ] 3. Poor Product quality and safety [ ] 4. Proximity to the
market outlet [ ] 5.Poor product packaging [ ] 6. Others (Please specify)

102
17 .When you make a decision to purchase Koche you may take several things into consideration
such as trust in the seller, proximity to the market outlet , product quality and safety
considerations ,cleanliness of the premise .Please evaluate how important are these factors in
your decision to purchase Koche Product?.
Importance scale:
1 = of no importance (no)
2 = of little importance (li)
3 = Important (Im)
4 = Very important (Vi)
Importance
Factors No Li Lm Vi Response
Know/Trust
in the seller
1 2 3 4
Proximity to the
market outlet
1 2 3 4
Product quality
and safety
considerations
1 2 3 4
Clean premises 1 2 3 4
18.How important are the following sensory attributes fat content, taste, appearance, Chewiness,
size of meat chunks, flavour in your choice, use and acceptability of Koche Product?
Importance scale:
1 = of no importance (no)
2 = of little importance (li)
3 = Important (Im)
4 = Very important (Vi)
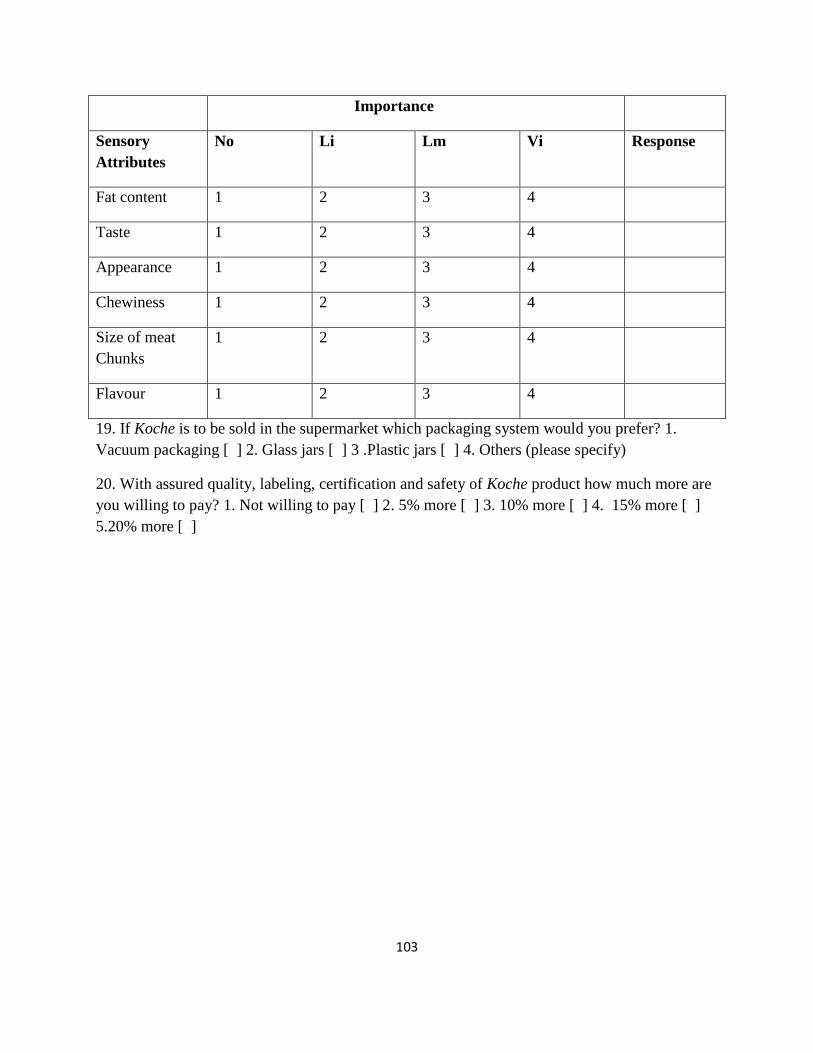
103
Importance
Sensory
Attributes
No Li Lm Vi Response
Fat content 1 2 3 4
Taste 1 2 3 4
Appearance 1 2 3 4
Chewiness 1 2 3 4
Size of meat
Chunks
1 2 3 4
Flavour 1 2 3 4
19. If Koche is to be sold in the supermarket which packaging system would you prefer? 1.
Vacuum packaging [ ] 2. Glass jars [ ] 3 .Plastic jars [ ] 4. Others (please specify)
20. With assured quality, labeling, certification and safety of Koche product how much more are
you willing to pay? 1. Not willing to pay [ ] 2. 5% more [ ] 3. 10% more [ ] 4. 15% more [ ]
5.20% more [ ]

104
APPENDIX 5: SENSORY EVALUATION SCORE SHEET.
Score sheet number …………………………………………
Date of analysis………………………………………………
You are provided with coded samples of Koche product. Please evaluate the samples presented
to you for the following sensory attributes namely: Colour, texture, taste, oiliness, size of meat
chunks,aroma, appearance and overall acceptability using the hedonic scale provided.
1- Dislike extremely
2- Dislike very much
3- Neither like nor dislike
4- Like very much
5- Like extremely
Samples Colour Texture Taste Aroma Appearance Size of
meat
chunks
Oilness Overall
acceptability
ADF
CBM
KCP
xyF
Comments……………………………………………………………………………
…………………….
Thank you!!!!!!!

105
APPENDIX 6: CONSENT FORM
I am …………………………………………. a student at the University of Nairobi studying
MSc in Food Science and Technology. In order to have a commercially viable product based
koche processing, generate information that may benefit the processors to better meet the
preferences/ requirements of consumers, development of marketing strategies that can increase
the demand of Koche, I am conducting this survey in Marsabit, Isiolo and Nairobi County among
the processors, marketers and consumers of Koche as well as potential consumers and I am
pleased to have you take part in the study.All information you give is confidential. The
information will aid in the preparation of a general report but no names will be included. There
will therefore be no way to identify that you are the source of information. I encourage you to
participate in the study and your cooperation will be highly appreciated.
If it is okay with you, may I proceed to ask you some questions related to processing of Koche
I accept to take part in the study: Yes…………. No………………
Name of the interviewer……………………………………
Signature of interviewer ……………………………………
Date………………………………………….........