commercial vehicle aerodynamic drag reduction:...
TRANSCRIPT

Commercial Vehicle Aerodynamic Drag Reduction:Historical Perspective as a Guide
Kevin R. Cooper
National Research Council of Canada
Ottawa, Canada
Introduction
The aerodynamics development of commercial vehicles has evolved over manyyears. Sixty-five years ago, the Labatt Brewing Company developed astreamlined truck for advertising purposes and to provide larger capacity andhigher cruising speeds, Figure 1. The success of this effort is demonstrated bythe fact that while trucks of the day travelled at 35 mi/h, the Labatt truckcould cruise at 50 mi/h with a fifty percent larger load. The focus today is nolonger on speed, but on energy conservation. It is beneficial for a country tominimise its energy utilisation and equally beneficial for its trucking industryto make money while doing so.
The opportunity offered by aerodynamic drag reduction was successfullyexploited by North American industry twenty-five years ago and is beingrevisited in a second effort by industry and government. The previousSAE/DOT Voluntary Truck and Bus Fuel Economy Program had an
Fig. 1: 1947 Labatt Streamliner
10 K.R. Cooper
important impact on the implementation of fuel-saving aerodynamics. Thecurrent DOE program might do the same.
The SAE/DOT program had the benefit of being first and thus beingable to utilise the large gains obtained from reshaping the front ends of thetrucks, which were relatively easy to deal with and gave the largest dragreductions. Much of the work focussed on the tractor, since only one truckneeded to be modified, no matter how many trailers were in the fleet. At thesame time, trailer mounted devices or trailer modifications also found wideacceptance, and rounded-edged truck bodies have become the standard.
Many other areas were investigated, including: tractor-trailer gap seals,trailer skirts, trailer boat-tailing and tractor-trailer integration. These have notbeen successful in the marketplace, due to operational difficulties, due to theirsmall return on investment, or due to the complexity of fleet-wide integration.It has been known for many decades that more integrated tractor-trailercombinations were beneficial aerodynamically, but the complexities of doingso have precluded development in this area, except for demonstration vehicles.
Steady increases in fuel prices over the years now make some of theunused technology economically viable. A major new initiative to improvetruck fuel economy seems appropriate. The important question is how to doso? We have the option of seeking to further hone the aerodynamics of thetruck. Much of this work has been done and so we face the law ofdiminishing returns – a greater and greater effort to provide a smaller andsmaller gain.
A more effective scenario would be to apply what is already known in theshort term and to work toward more integrated configurations in the longerterm. The latter task is a major challenge, even though it can be shown tooffer considerable benefit, because of the importance of not compromising theinvestment in current fleet hardware and warehousing. The issue is not howto lower the drag coefficient by a further 0.002, but rather to work with fleets,manufacturers, researchers and legislators to apply what we already know.Without appropriate legislation, the acceptance of the operators andcollaboration between the OEMs, no real improvements will be made. Weneed to find solutions by implementing our existing and substantial body ofknowledge. We do not need to study the problem much more.
A new effort, sponsored by the DOE, is being mounted now to furtherimprove truck aerodynamics, primarily based on CFD calculation and someexperiment. This paper provides a review of previous aerodynamic researchand technology-transfer initiatives as a way of placing the new program inperspective. It seeks to ensure that the existing, rich aerodynamic history isnot ignored and that lessons learned previously in technology transfer are notlost.

Commercial Vehicle Aerodynamic Drag Reduction 11
Prior Art
In the 1950’s, a serious effort to improve truck fuel consumption wasundertaken at the University of Maryland [1,2,3] through an examination ofthe aerodynamics of tractors and trailers, funded by Trailmobile. This workprovided an early, detailed look at truck aerodynamics and may have triggeredthe development of the air deflector in the 1960’s by Seldon Saunders andChet Wiley of Airshield – the first successful add-on aerodynamic device.These studies also presaged the advent of trailer streamlining, by looking atedge rounding, rounded trailer front faces, skirts and boat-tailing. At aboutthe same time that Airshield was developing the cab-mounted deflector, JoeFitzgerald, working at Thermoking, had realised that their refrigeration unitsreduced truck fuel consumption. He decided to take this concept a stepfurther and developed the Nose Cone trailer streamlining fairing. Thus, themodern truck aerodynamic age was born.
The first years were difficult. Fuel was cheap and truckers did not wantthose gadgets on their rigs. However, the 1970’s energy crunch arrived andthe new devices were rapidly accepted. They saved fuel and made profit forthe trucker. They also reduced direct operating cost and strengthened thecompetitive position of the trucking industry with the railroads.
Standard tractor-trailer Equipped with deflector
Standard straight truck Equipped with Nose Cone
Fig. 2: Smoke Flow Over Standard and Modified Trucks

12 K.R. Cooper
In the late 1970s, the National Research Council of Canada (NRC) tookon the task of comparing the commercial devices of the day [4], with theintention of convincing truckers of the benefit they provided and helpingthem choose the best type of device for their operation. Smoke pictures likethose in Figure 2 made a lot of believers, as did a growing body of roadmeasurements of fuel savings. When truckers saw the two pairs ofphotographs, they had no difficulty in making a choice.
The growing activity attracted the attention of the SAE and the USDOT, leading to the SAE/DOT Voluntary Bus and Truck Fuel Economystudy of the late 1970s and early 1980s [5]. By this time, OEM’s and after-market suppliers in North America and Europe were actively improving fuelconsumption through aerodynamic means, resulting in the reduced-drag fleetof today.
The SAE/DOT study was a major government/industry cooperativeventure. Its goal was to demonstrate that truck fuel consumption could besignificantly reduced. The study was centred on a set of four pairs of trucks,two tractor-trailer combinations and two straight trucks. Each pair consistedof a standard truck for the time and an identical partner fitted with anaerodynamic package, advanced tyres, a fuel-saver motor, improved lubricantsetc. These trucks were track and road tested, and run in fleet service. Thetrucks are shown in Figure 3.
Fig. 3: SAE/DOT Demonstration Trucks

The study was multi-faceted, developing test technology for thelaboratory and for the fleet. It was also applied and practical, in that it had alarge component of on-road testing and user involvement. A series of SAERecommended Practices were developed that are still in use today, includingthose for wind tunnel testing [6], coast-down testing [7} and on-road fuelmeasurement [8, 9]. They were verified by wind tunnel and road trials. Thisprogram involved fleets, trucking associations, equipment manufacturers, theSAE, legislators, government laboratories and university researchers. It was ahands-on project that had great impact on the acceptance of the newtechnologies. The trucking industry believed the findings because they werepart of the process.
Early Aerodynamic Development
Considerable wind tunnel aerodynamic development of commercial vehicleshas occurred over the past 50 years. The University of Maryland study is ofparticular historical importance because it was an early piece of work and itwas well done. In fact, it provides most of the answers required to develop theyear 2010 aerodynamic truck. Other authors have also published widely andagain, have shown the way. Notable is the work of Buckley et al [8], Mason &Beebe [9, 10] and that of various European authors, including Hans Gotz ofDaimler-Benz [11] and Alfons Gilhaus of Ford Cologne [12]. Their surveypapers provide a wealth of material on the aerodynamics of heavy commercialvehicles. The combination of the three groups of authors provides a broadoverview of significant past developments.
The NRC was active in this program also, taking on the task ofcomparing commercially available, drag reducing devices to advise truckers ofthe best choices for their equipment and operations. The NRC was deeplyinvolved in the SAE/DOT Voluntary program. It built 1:10-scale models ofthe four vehicle pairs that were road tested in this program. These models cost$160,000.00 (1980 dollars) to design and build, and were used to support theroad tests and to demonstrate the effectiveness of the SAE RecommendedPractice for the Wind Tunnel Testing of Trucks and Buses, J1252 [13]. In all,the models were tested in up to 11 wind tunnels world wide [9, 10].TheAerodynamics Laboratory of the NRC actively worked with several OEM’sand many aerodynamic-device manufacturers to calibrate and improve theirproducts [14, 15, 16] and did research on basic concepts, including edgerounding and base-drag reduction [17], and trailer skirts [18].
The body of work from these sources easily permits very low drag vehiclesto be designed now.
We know most of the answers; we need to apply them.
Commercial Vehicle Aerodynamic Drag Reduction 13
14 K.R. Cooper
The University of Maryland Study
As a demonstration of this point, I have summarised the most pertinent datafrom the second of the University of Maryland Trailmobile studies [2]. Theconfiguration chosen was the COE tractor with the Model A van trailer. Themodel was built at 1:6 scale and was tested at 150 mi/h, giving a Reynoldsnumber that was 42% of full scale at 60 mi/h road speed. The variousconfigurations are shown in the photographs of Figure 4.
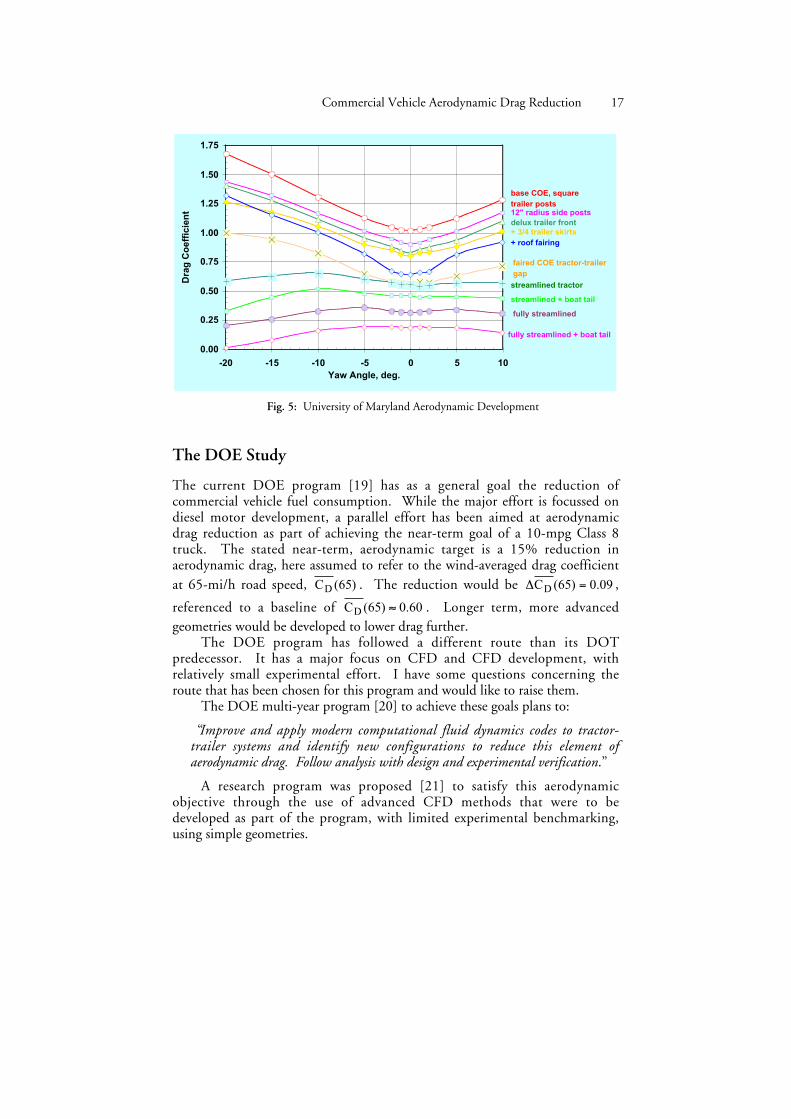
The build-up of the low-drag model is given in Table 1. The first twodata columns present the measured drag data at the yaw angles indicated. Thebarred drag-coefficients in the next two columns are wind-averaged values [13]at a road speed of 65 mi/h, as indicated. The drag coefficient curves areplotted in Figure 4. While the initial configuration was not up to today’sstyling and performance standards, the aerodynamic characteristics of themodified configurations certainly are. The results show the capability of anintegrated tractor/skirted-trailer combination. The antique tractor, with afairing merging the tractor and skirted trailer, could compete with the best oftoday’s combinations.
Case 2 is taken as the baseline since it is closer to today’s trailergeometries. Each increment in wind-averaged drag coefficient, )65(CDD , isthe difference between the line item and the preceding configuration. Thus, itis the result of the underlined, italic description that defines the change fromthe preceding case. While the drag levels of the COE tractor are higher thanwould be measured today, due to the cab design, the differences due to themodifications are close to those measured more recently. For example: theskirts give a drag increment close to that measured at the NRC [18], the rooffairing gave a result between that for the original curved-plate deflector and thecurrent cab fairing, closing the gap has a similar gain to that found today andthe drag reduction due to the boat tail on the fully skirted and streamlinedconfiguration represents close to the total base drag. Rounded trailer rear sideposts were also tried and showed a small gain that was consistent with thesmall radius employed. Some of these configurations are unusable on theroad, but they do define the range possible.
Interestingly, although this data set has been available for decades, not allof the practical techniques it exposes are utilized today. In particular, skirtsand gap closure are not in widespread use and boat tailing is seen only onsome buses and as an add-on device on some trailers. This data set wouldpermit the design of a low-drag truck without further research.
More interesting information can be gleaned from the drag curves.Closing the gap is beneficial, especially at large yaw angles. The addition of awell-streamlined tractor with no gap shows little gain over the faired COEtractor at small yaw angles, but has much better performance at yaw anglemagnitudes greater than 5 degree. This trend continues as the truck becomesmore closed and integrated, until it is seen to have decreasing drag with yaw

angle with the most streamlined configurations - the truck is beginning to sail.With the exception of the full-height skirts and streamlined tail, all themodifications could be implemented. Even the seemingly impractical changescan be utilized in a less extreme fashion. Partial-height skirts and simple boattailing can recover a significant fraction of the potential shown above.
Case 1 - COE tractor, square-cornered trailer Case 3 - COE tractor, trailer with deluxe front
Case 4 - COE tractor, skirts (without bumper) Case 5 – COE tractor with roof fairing
Case 6 – COE +3/4 skirts, gap fairing Case 7 – Streamlined tractor, 3/4 straight skirts(without bumber)
Case 8 –-Streamlined tractor, straight skirts, Case 10 – Fully-streamlined and skirtedboat tail tractor-trailer, boat tail
Fig. 4: Trailmobile models
Commercial Vehicle Aerodynamic Drag Reduction 15

16 K.R. Cooper
Table 1: Summary of the Trailmobile Study
Ca
seConfiguration
CD(0º)#
CD(1
0º)/mi65(CD mi65(CDDD
1COE tractor, van trailer, square
front posts1.017 1.503 1.169 -
2COE tractor, 12” radius front side
posts0.900 1.167 1.056 0.113
3 COE tractor, deluxe front on trailer 0.828 1.118 0.994 0.062
4COE, deluxe front, _ height trailer
skirts0.803 1.052 0.944 0.050
5 COE, _ skirts, roof fairing 0.641 1.007 0.842 0.102
6COE, _ skirts, faired gap from
tractor to trailer0.558 0.825 0.689 0.153
7Streamlined tractor closing gap, _
skirts0.555 0.653 0.624 0.065
8Streamlined tractor, _ skirts, boat
tail0.460 0.520 0.503 0.121
9Fully-skirted streamlined tractor
and trailer0.317 0.329 0.351 0.152
10Fully-skirted streamlined tractor
and trailer, boat tail0.184 0.160 0.189 0.169
# Drag coefficients based on reference area equal to trailer roof height times trailer width.
0.00
0.25
0.50
0.75
1.00
1.25
1.50
1.75
-20 -15 -10 -5 0 5 10
Yaw Angle, deg.
Dra
g C
oe
ffic
ien
tbase COE, square
trailer posts
fully streamlined
fully streamlined + boat tail
streamlined tractor
faired COE tractor-trailer
gap
+ roof fairing
+ 3/4 trailer skirts
delux trailer front
12" radius side posts
streamlined + boat tail
Fig. 5: University of Maryland Aerodynamic Development
The DOE Study
The current DOE program [19] has as a general goal the reduction ofcommercial vehicle fuel consumption. While the major effort is focussed ondiesel motor development, a parallel effort has been aimed at aerodynamicdrag reduction as part of achieving the near-term goal of a 10-mpg Class 8truck. The stated near-term, aerodynamic target is a 15% reduction inaerodynamic drag, here assumed to refer to the wind-averaged drag coefficientat 65-mi/h road speed, )65(CD . The reduction would be 09.0)65(CD =D ,
referenced to a baseline of 60.0)65(CD ª . Longer term, more advancedgeometries would be developed to lower drag further.
The DOE program has followed a different route than its DOTpredecessor. It has a major focus on CFD and CFD development, withrelatively small experimental effort. I have some questions concerning theroute that has been chosen for this program and would like to raise them.
The DOE multi-year program [20] to achieve these goals plans to:
“Improve and apply modern computational fluid dynamics codes to tractor-trailer systems and identify new configurations to reduce this element ofaerodynamic drag. Follow analysis with design and experimental verification.”
A research program was proposed [21] to satisfy this aerodynamicobjective through the use of advanced CFD methods that were to bedeveloped as part of the program, with limited experimental benchmarking,using simple geometries.
Commercial Vehicle Aerodynamic Drag Reduction 17

18 K.R. Cooper
The chosen technical approach appears to be founded on the followingcommentary, quoted directly from [21].
“At present the aerodynamic design of heavy trucks is based largely upon windtunnel estimation of forces and moments, and upon qualitative streamlinevisualization of flow fields. No better methods have been availabletraditionally, and the designer/aerodynamicists are to be commended forachieving significant design improvements over the past several decades on thebasis of limited quantitative information.
The trucking industry has not yet tapped into advanced design approaches usingstate-of-the-art computational simulations to predict optimum aerodynamicvehicles. Computational analysis tools can reduce the number of prototype tests,cut manufacturing costs, and reduce overall time to market.”
These two paragraphs are worth careful analysis. A direct reading of thefirst paragraph would intimate that experimental aerodynamicists were luckyto have had any useful results. The opposite, of course, is true.
The wind tunnel permits the measurement, not the estimation, ofaerodynamic forces and the aerodynamicist has had exceptional success atoptimizing the commercial vehicle. Thousands of hours of development havelead to effective add-on aerodynamic devices and the aerodynamic tractors thatwe have today. A major part of the success has come because the physics ofthe fluid flow in the wind tunnel is correct. Detailed flow measurement hasnot been widely used in the wind tunnel because it does not provide an answerto the question: “What is the drag?”.
Certainly, wake flow measurements can be and have been used tomeasure vehicle drag, but a force balance is much faster and more accurate.The wind tunnel has shown a remarkable correlation with the road and is afast, cost-effective and reliable tool. I am not sure how CFD cutsmanufacturing costs, although if used wisely with experiment it will acceleratethe development cycle.
The second paragraph suggests that CFD can do the optimization better.It may one day, but cannot now. Firstly, the flow physics are approximated,resulting in uncertainty in the result. Secondly, the large number of cases thathave to be computed would take much longer than a typical experimentaloptimization.
As an example, consider the optimization of a cab-mounted deflector thatwas performed in the NRC 2m x 3m wind tunnel. The task was to develop amap of optimum deflector angle as functions of tractor-trailer gap and heightdifference. The test program made 180 measurements over an array of sixgaps and six height differences between the cab roof and the trailer roof. Thedeflector angle was adjusted to five values at each combination of separationand height differential while seeking the best angle. Figure 6 shows theresulting design table, giving the pin setting that provides the optimumdeflector angle for a selected of tractor-trailer separation and height
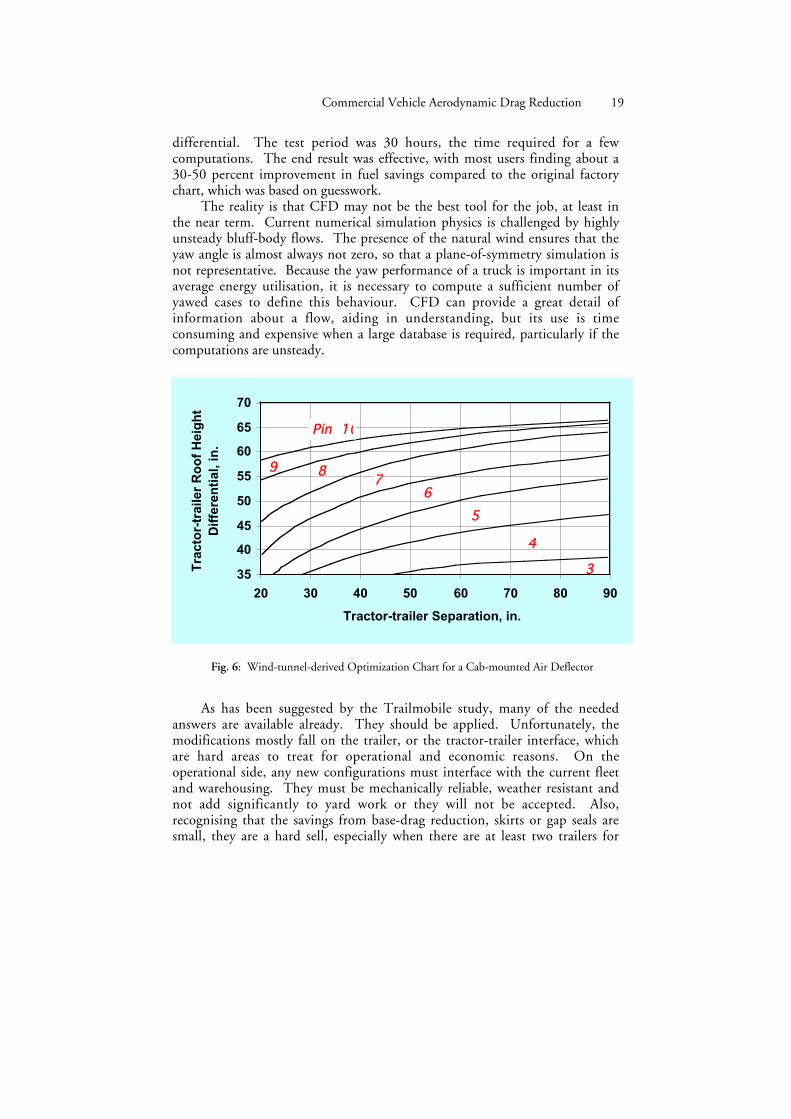
differential. The test period was 30 hours, the time required for a fewcomputations. The end result was effective, with most users finding about a30-50 percent improvement in fuel savings compared to the original factorychart, which was based on guesswork.
The reality is that CFD may not be the best tool for the job, at least inthe near term. Current numerical simulation physics is challenged by highlyunsteady bluff-body flows. The presence of the natural wind ensures that theyaw angle is almost always not zero, so that a plane-of-symmetry simulation isnot representative. Because the yaw performance of a truck is important in itsaverage energy utilisation, it is necessary to compute a sufficient number ofyawed cases to define this behaviour. CFD can provide a great detail ofinformation about a flow, aiding in understanding, but its use is timeconsuming and expensive when a large database is required, particularly if thecomputations are unsteady.
As has been suggested by the Trailmobile study, many of the neededanswers are available already. They should be applied. Unfortunately, themodifications mostly fall on the trailer, or the tractor-trailer interface, whichare hard areas to treat for operational and economic reasons. On theoperational side, any new configurations must interface with the current fleetand warehousing. They must be mechanically reliable, weather resistant andnot add significantly to yard work or they will not be accepted. Also,recognising that the savings from base-drag reduction, skirts or gap seals aresmall, they are a hard sell, especially when there are at least two trailers for
35
40
45
50
55
60
65
70
20 30 40 50 60 70 80 90
Tractor-trailer Separation, in.
Tra
cto
r-tr
ail
er
Ro
of
He
igh
t
Dif
fere
nti
al,
in.
33
PPiinn 1100
99 8877
66
55
44
Fig. 6: Wind-tunnel-derived Optimization Chart for a Cab-mounted Air Deflector
Commercial Vehicle Aerodynamic Drag Reduction 19
20 K.R. Cooper
every tractor. The marginal economic advantage is then divided by a factor oftwo or more.
The challenge is not to squeeze a fraction more out of a bottle shrunk bythe law of diminishing returns, not to invent a slightly better gadget, but totransfer current knowledge to industry in a profitable manner. The issue is todesign light, reliable components and encourage industry to use them.Government can certainly have a role here through encouraging productdevelopment, through education and by providing tax incentives.
It is possible to study problems without solving them. The currentapproach seems to do too much studying and too little solving. What hasbeen achieved to date? It is my opinion that enough is known now to providea useful gain in aerodynamic efficiency immediately and that the basis for theadvanced truck exists. Let’s get on with it.
A Case Study – the Future Truck
Three weeks before this conference, I decided that a demonstration projectwould serve to emphasise my arguments. As I have stated, a two-prongedattack – near term and long term - seems like a good idea. I chose to tacklewhat might be done in the near term to improve fuel consumption, byperforming a quick test in the NRC 2m x 3m wind tunnel. The projectstarted with an existing White Road Boss II tractor and 40-foot Dorsey trailer– a 1:10-scale model of the combination shown in the upper-left photographof Figure 3. The plan was to bring this old truck to a higher state ofaerodynamic development using technology that could be applied now. Theresults are proffered as a challenge for the DOE CFD program to equal.
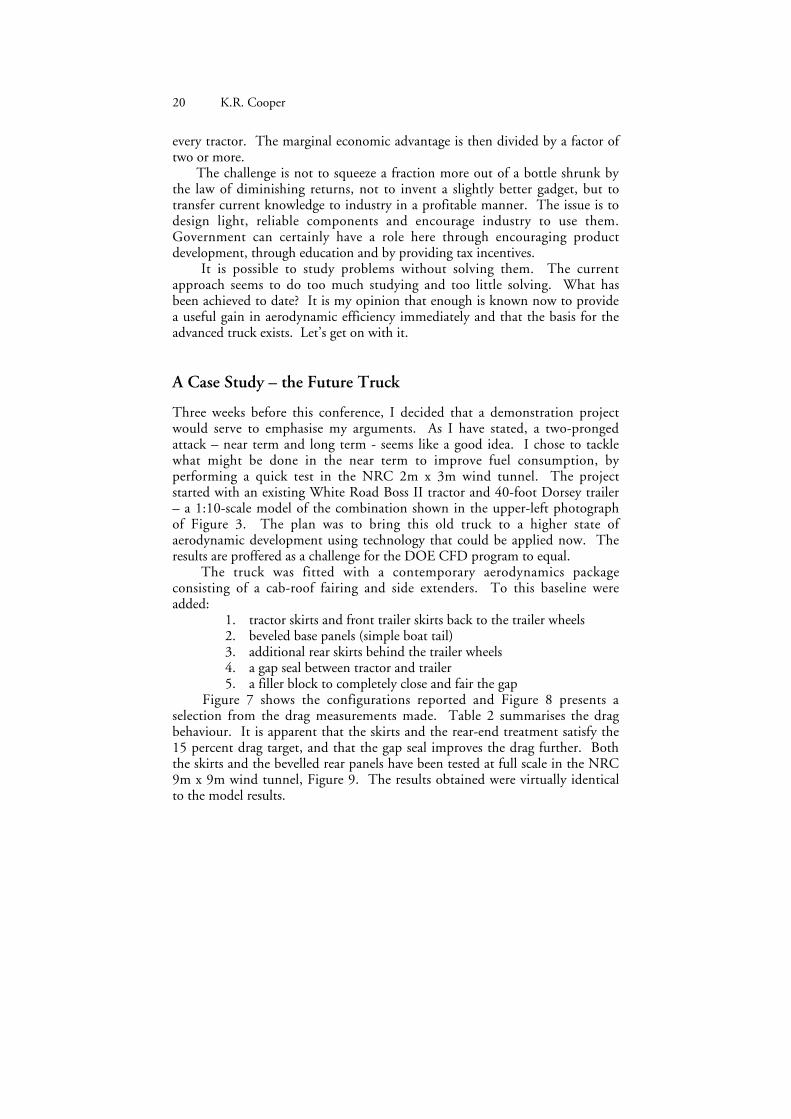
The truck was fitted with a contemporary aerodynamics packageconsisting of a cab-roof fairing and side extenders. To this baseline wereadded:
1. tractor skirts and front trailer skirts back to the trailer wheels2. beveled base panels (simple boat tail)3. additional rear skirts behind the trailer wheels4. a gap seal between tractor and trailer5. a filler block to completely close and fair the gap
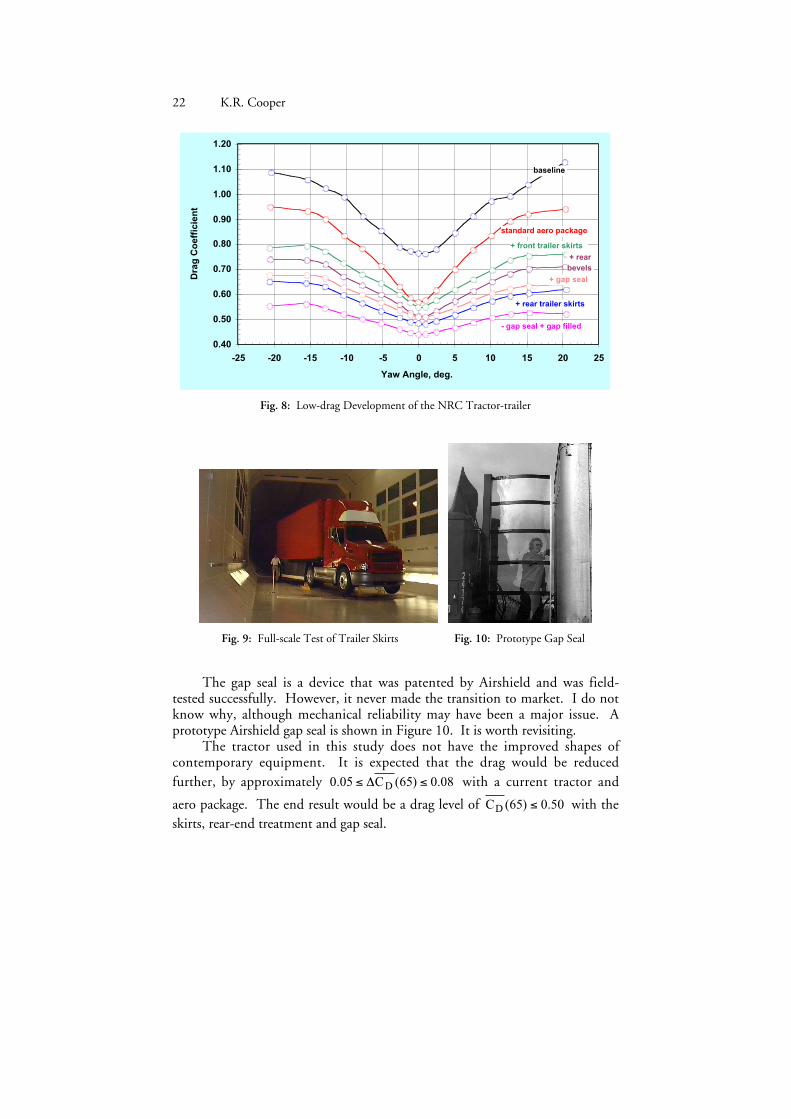
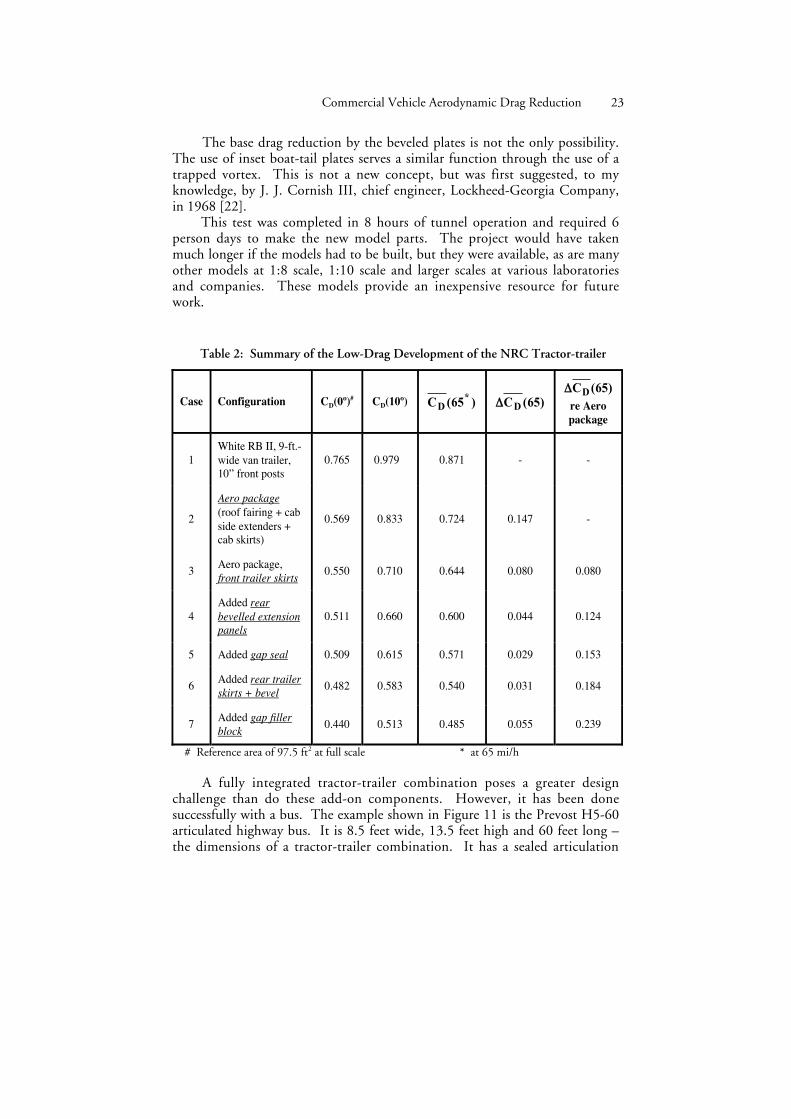
Figure 7 shows the configurations reported and Figure 8 presents aselection from the drag measurements made. Table 2 summarises the dragbehaviour. It is apparent that the skirts and the rear-end treatment satisfy the15 percent drag target, and that the gap seal improves the drag further. Boththe skirts and the bevelled rear panels have been tested at full scale in the NRC9m x 9m wind tunnel, Figure 9. The results obtained were virtually identicalto the model results.

Fully modified truck with full gap fairing, skirts and bevelled rear panels
A view of the 15º bevelled extension panels
The gap seal
Fig. 7: Model Configurations Tested
Commercial Vehicle Aerodynamic Drag Reduction 21
22 K.R. Cooper
0.40
0.50
0.60
0.70
0.80
0.90
1.00
1.10
1.20
-25 -20 -15 -10 -5 0 5 10 15 20 25
Yaw Angle, deg.
Dra
gC
oe
ffic
ien
t
baseline
- gap seal + gap filled
+ rear trailer skirts
+ gap seal
+ rear
bevels
+ front trailer skirts
standard aero package
Fig. 8: Low-drag Development of the NRC Tractor-trailer
Fig. 9: Full-scale Test of Trailer Skirts Fig. 10: Prototype Gap Seal
The gap seal is a device that was patented by Airshield and was field-tested successfully. However, it never made the transition to market. I do notknow why, although mechanical reliability may have been a major issue. Aprototype Airshield gap seal is shown in Figure 10. It is worth revisiting.
The tractor used in this study does not have the improved shapes ofcontemporary equipment. It is expected that the drag would be reducedfurther, by approximately 08.0)65(C05.0 D £D£ with a current tractor and
aero package. The end result would be a drag level of 50.0)65(CD £ with theskirts, rear-end treatment and gap seal.
The base drag reduction by the beveled plates is not the only possibility.The use of inset boat-tail plates serves a similar function through the use of atrapped vortex. This is not a new concept, but was first suggested, to myknowledge, by J. J. Cornish III, chief engineer, Lockheed-Georgia Company,in 1968 [22].
This test was completed in 8 hours of tunnel operation and required 6person days to make the new model parts. The project would have takenmuch longer if the models had to be built, but they were available, as are manyother models at 1:8 scale, 1:10 scale and larger scales at various laboratoriesand companies. These models provide an inexpensive resource for futurework.
Table 2: Summary of the Low-Drag Development of the NRC Tractor-trailer
Case Configuration CD(0º)# CD(10º) )65(C*
D )65(CDDD)65(CDDD
re Aero
package
1
White RB II, 9-ft.-
wide van trailer,
10” front posts
0.765 0.979 0.871 - -
2
Aero package
(roof fairing + cab
side extenders +
cab skirts)
0.569 0.833 0.724 0.147 -
3Aero package,
front trailer skirts0.550 0.710 0.644 0.080 0.080
4
Added rear
bevelled extension
panels
0.511 0.660 0.600 0.044 0.124
5 Added gap seal 0.509 0.615 0.571 0.029 0.153
6Added rear trailer
skirts + bevel0.482 0.583 0.540 0.031 0.184
7Added gap filler
block0.440 0.513 0.485 0.055 0.239
# Reference area of 97.5 ft2 at full scale * at 65 mi/h
A fully integrated tractor-trailer combination poses a greater designchallenge than do these add-on components. However, it has been donesuccessfully with a bus. The example shown in Figure 11 is the Prevost H5-60articulated highway bus. It is 8.5 feet wide, 13.5 feet high and 60 feet long –the dimensions of a tractor-trailer combination. It has a sealed articulation
Commercial Vehicle Aerodynamic Drag Reduction 23

24 K.R. Cooper
and quite low drag. Wind tunnel measurements from a 1:10-scale model ofare presented in Figure 12 and Table 3, courtesy of Prevost Car Inc. Data fortwo other configurations of the articulated bus are shown also, as is the datafrom Case 6 of Table 2 for comparison. In one bus configuration, the mirrorshave been removed and in another, a more streamlined, but practical, nose andbevelled rear have been fitted. The single bus is the front unit from thearticulated bus.
Of note is the fact that the articulated bus is 50 percent longer than theidentically shaped single bus but has only 9 percent higher drag. This pointwill be revisited in the next section. The advanced articulated bus has very lowdrag that is nearly constant with yaw angle and may be near a practical limitfor passive aerodynamics for a geometry having a blunt base. It is apparentthat the articulated bus is superior to the developed tractor-trailer. However,the difference would diminish with a more rounded cab, and would diminishfurther with full cab-trailer integration and skirting. At the limit, the twovehicles should be identical.
0.2
0.3
0.4
0.5
0.6
0.7
0.8
-20 -15 -10 -5 0 5 10 15 20
Yaw Angle, deg.
Dra
gC
oe
ffic
ien
t
production Prevost H5-60
articulated bus
articulated bus, streamlined front + boat tail
Prevost H5-60
no mirrors
White RB II
skirts, bevels, gap seal
Fig. 11: Low-drag Articulated Bus, Fig. 12: Drag Characteristics of the Prevost H5-60the Prevost H5-60 Compared to a Tractor-Trailer
Table 3: Bus Drag measurements
Case Configuration CD(0º) )h/mi65(CD
1Aero RB II, all skirts + rear bevelled panels + gap
seal0.482 0.540
2 Single Prevost Bus 0.351 0.384
3 Articulated Prevost H5-60 bus 0.378 0.418
4 Articulated Prevost H5-60 bus, no mirrors 0.315 0.344
5 Advanced articulated bus 0.293 0.311
Another Concept
As a final thought, the concept of vehicle platoons [23] applies very well totrucks. The simplest way to decrease the aerodynamic drag of a tractor-traileris to add one or two more trailers. This follows the result for the single andarticulated buses just discussed. Truck trains made up of two or three trailershave been run on selected freeways in some states and provinces. However,the practice is not widespread. The question is, “Should it be?”. There aremany safety and infrastructure issues to deal with but the returns could belarge, both from energy and road capacity points of view.
When a second trailer is added to increase capacity by a factor of two, theweight does not double and aerodynamic drag increases by about 40 percent.Thus the aerodynamic drag per ton-mile is decreased by 30 percent. It isunlikely that any other aerodynamic technique with a single trailer will be aseffective.
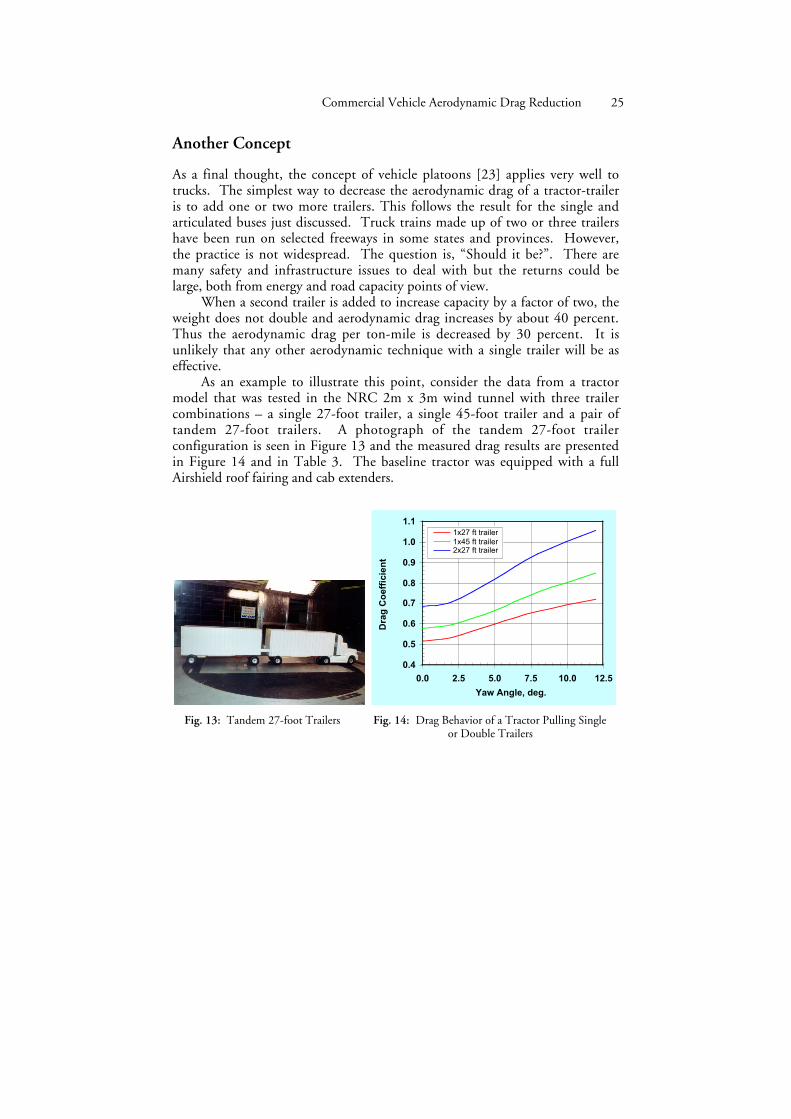
As an example to illustrate this point, consider the data from a tractormodel that was tested in the NRC 2m x 3m wind tunnel with three trailercombinations – a single 27-foot trailer, a single 45-foot trailer and a pair oftandem 27-foot trailers. A photograph of the tandem 27-foot trailerconfiguration is seen in Figure 13 and the measured drag results are presentedin Figure 14 and in Table 3. The baseline tractor was equipped with a fullAirshield roof fairing and cab extenders.
0.4
0.5
0.6
0.7
0.8
0.9
1.0
1.1
0.0 2.5 5.0 7.5 10.0 12.5
Yaw Angle, deg.
Dra
g C
oe
ffic
ien
t
1x27 ft trailer
1x45 ft trailer
2x27 ft trailer
Fig. 13: Tandem 27-foot Trailers Fig. 14: Drag Behavior of a Tractor Pulling Singleor Double Trailers
Commercial Vehicle Aerodynamic Drag Reduction 25

26 K.R. Cooper
Table 3: Aerodynamic Performance of Truck Trains
Case Configuration CD(0º) CD(8º) )65(CD)65(CD /unit
cargo
1Conventional tractor,
single 27-ft. trailer0.515 0.659 0.591 0.591
2Conventional tractor,
single 45-ft. trailer0.576 0.752 0.660 0.396
3Conventional tractor,
two 27-ft. trailers0.685 0.939 0.805 0.403
The drag-coefficient/unit-cargo for the larger capacity trailercombinations were found by dividing their measured wind-averaged dragcoefficients by the ratios of the modified trailer lengths to the 27-foot length.A second 45-foot trailer would provide an even greater reduction thanobtained from the two 27-foot trailers.
Closing remarks
This paper turned out differently than the one that was first planned, whichwas a discussion of past technology. As the paper progressed, it became moreand more apparent that most of the required aerodynamic knowledge was inhand. It also seemed that most of this work was being ignored and that theeffort to advance CFD was retarding the application of known aerodynamictechnology to trucking.
The goal of reducing the aerodynamic drag of commercial vehicles is aworthy one. It is economically and socially valuable. The development ofadvanced CFD is also technically useful and will be of benefit in vehiculardevelopment. However, delaying the introduction of new hardware andconcepts into the fleet while waiting for the evolution of these new CFD toolsis counterproductive, especially since the major issues are not aerodynamic,but are those of operational effectiveness and mechanical design.
Many of the major tractor and trailer manufacturers have builtdemonstration vehicles that incorporate advanced aerodynamic technologyincluding aerodynamic cabs, completely integrated tractors and trailers, skirtsand rear-end treatment. They all had low fuel consumption. And none ofthem are on the market. Why? It must be because they were noteconomically viable and because they offered too many impediments toefficient operation. These are the issues of importance. Economics will take

care of itself through a steady rise in fuel prices. It would be aided by thedesign of effective, operationally effective and inexpensive components,perhaps encouraged by tax incentive. The operational issues can best beresolved by industry-wide collaboration.
A two-pronged approach to the problem of introducing improvedaerodynamics might be beneficial. CFD can be developed for long-termapplication while a parallel development of existing technology for near-termimplementation, based on present knowledge and some experiment, ispursued.
In the latter case, the effort required is that of mechanical design done inclose cooperation with industry. The target would be to select the most likelycandidate technologies for development and, using clever design and modernmaterials, produce reliable, cost-effective hardware that will benefit truckersnow, and that will be acceptable to the end users. The designs would have tocapture the necessary aerodynamic benefits without causing operationaldifficulties. The answers are out there; neither CFD nor the wind tunnel willtell us how to apply them.
References
1. DOT/SAE Truck and Bus Fuel Economy Measurement Study ReportP59A. Report No. DOT/TSC – 1007, October, 1976.
2. A. Wiley Sherwood - Wind Tunnel test of Trailmobile Trailers.University of Maryland Wind Tunnel Report No. 85. College Park, MD,April 1974.
3. A. Wiley Sherwood - Wind Tunnel test of Trailmobile Trailers, 2nd Series.University of Maryland Wind Tunnel Report No. 85. College Park, MD,April 1974.
4. A. Wiley Sherwood - Wind Tunnel test of Trailmobile Trailers, 3rd Series.University of Maryland Wind Tunnel Report No. 85. College Park, MD,April 1974.
5. K. R. Cooper - A Wind Tunnel Investigation into the Fuel SavingsAvailable from the Aerodynamic Drag Reduction of Trucks. Article fromDME/NAE Quarterly Bulletin No. 1976(3), NRC, Ottawa, Canada,1976.
6. SAE Wind Tunnel Test Procedure for Trucks and Buses. RecommendedPractice, SAE J1252, August 1979.
7. Road Load Measurement and Dynamometer Simulation UsingCoastdown Techniques. SAE Recommended Practice J1263, approvedJune 1979.
8. Joint Rccc/SAE Fuel Consumption Test Procedure (Short Term-in-serviceVehicle) - Type I – SAE J1264. SAE Recommended Practice, approvedApril 1979.
9. Joint Rccc/SAE Fuel Consumption Test Procedure - Type II – SAEJ1321. SAE Recommended Practice, approved April 1979.
Commercial Vehicle Aerodynamic Drag Reduction 27
28 K.R. Cooper
10. F. T. Buckley, Jr, C. H. Marks, W. H. Walston – A Study ofAerodynamic Methods for Improving Truck Fuel Economy. Universityof Maryland, College Park, MD, December, 1978.
11. W. T. Mason, P. S. Beebe – The Drag Related Flow field Characteristicsof Trucks and Buses. Aerodynamic Drag Mechanisms of Bluff Bodies andRoad Vehicles. Symposium Held at the General Motors ResearchLaboratories. Plenum Press, 1978.
12. H. Götz – Present and Future Trends in Automotive Aerodynamics. VKIFluid Dynamics Vehicle Aerodynamics Short Course 1984-01. Rhode-St.-Genese, Belgium, 1984.
13. A. Gilhaus – Aerodynamics of Heavy Commercial Vehicles. VKI FluidDynamics Vehicle Aerodynamics Short Course 1984-01. Rhode-St.-Genese, Belgium, 1984.
14. K. R. Cooper, W. T. Mason Jr., W. H. Bettes - Correlation Experiencewith the SAE Wind Tunnel Test Procedure for Trucks and Buses. SAE820375, Int’l Congress & Exposition, Detroit, Michigan, Feb. 22-26,1982.
15. K. R. Cooper - Wind Tunnel Measurements on the Nose Cone - Tests 1and 2. LTR-LA-249, NRC, Ottawa, Canada, October 1981.
16. Cooper, K.R. - Wind Tunnel Investigation of the Royal-Air TrailerFairing. LTR-LA-256, November 1981.
17. K. R. Cooper - The Wind Tunnel Testing of Heavy Trucks to ReduceFuel Consumption. SAE 821285, Indianapolis, November 1982.
18. K. R. Cooper - The Effect of Front-Edge Rounding and Rear-EdgeShaping on the Aerodynamic Drag of Bluff Vehicles in GroundProximity. SAE 850288, Detroit, USA, February 1985.
19. K. R. Cooper - Truck Fuel Savings Through the Use of Trailer Skirts andTrailer Rear-Corner Rounding. LTR-LA-224, May 1978.
20. Multiyear Program Plan for 1998-2002. Office of Heavy VehicleTechnologies and Heavy Vehicle Industry Partners. DOE/ORO-2071,August 1998.
21. A Multi-Year Program Plan for the Aerodynamic Design of HeavyVehicles. http://en-env.llnl.gov/aerodrag/
22. J. J. Cornish III - Trapped Vortex Flow Control for Automobiles.Proceedings of the Second AIAA Symposium on the Aerodynamics ofSports & Competition Automobiles. Los Angeles, CA, May 1974.
23. M. Hammache, F. Browand – Aerodynamic Forces on Truck Models,Including Two Trucks in Tandem. SAE 2002-01-0530, SAE 2002World Congress, Detroit, MI, March 2002.