commercial revitalization and community...
TRANSCRIPT

Transit Oriented Commercial Revitalization in Crotona East, The Bronx
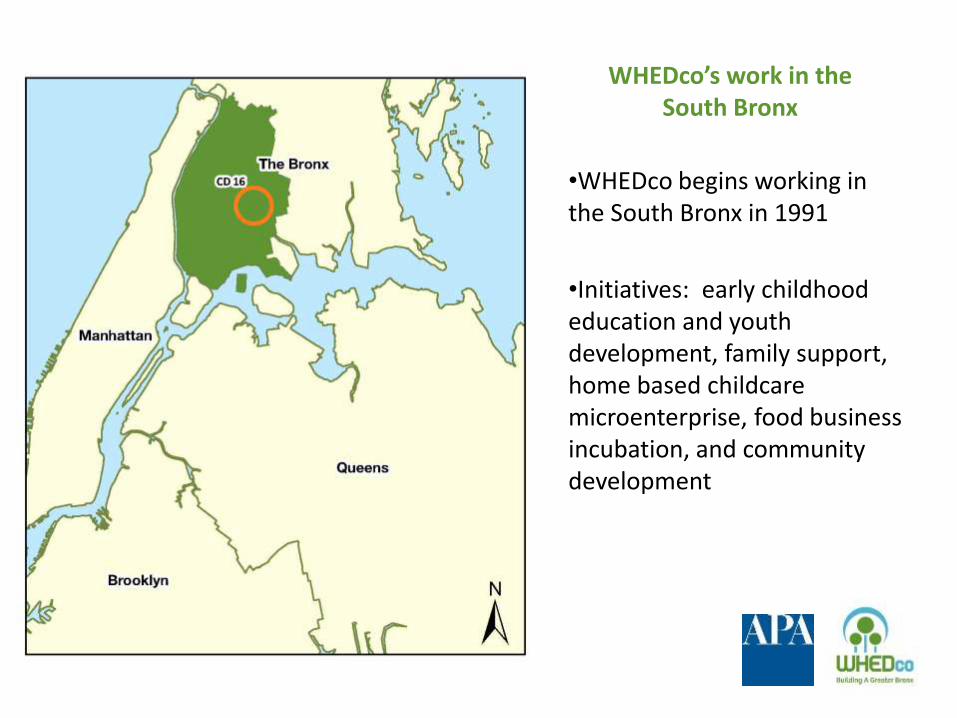
WHEDco’s work in the South Bronx
•WHEDco begins working in the South Bronx in 1991
•Initiatives: early childhood education and youth development, family support, home based childcare microenterprise, food business incubation, and community development
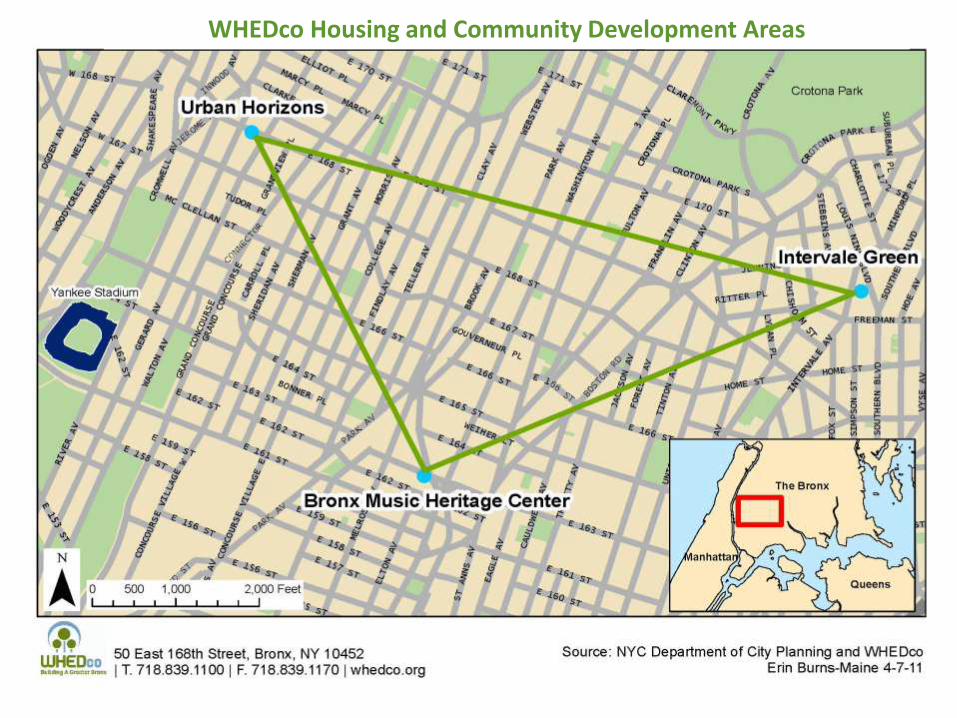
WHEDco Housing and Community Development Areas
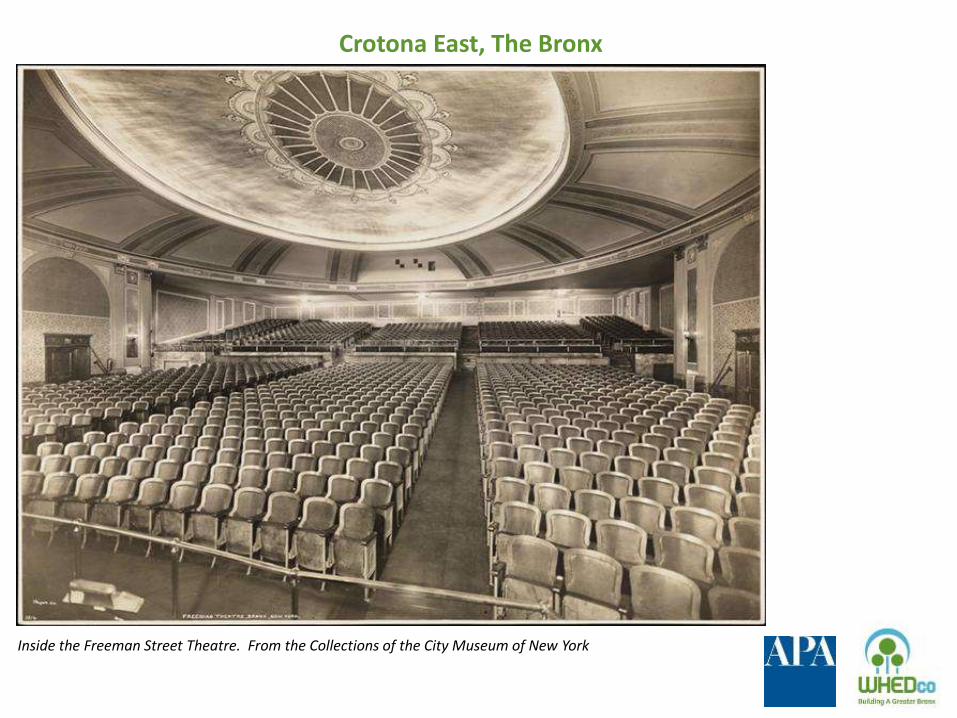
Inside the Freeman Street Theatre. From the Collections of the City Museum of New York
Crotona East, The Bronx
Crotona East, The Bronx
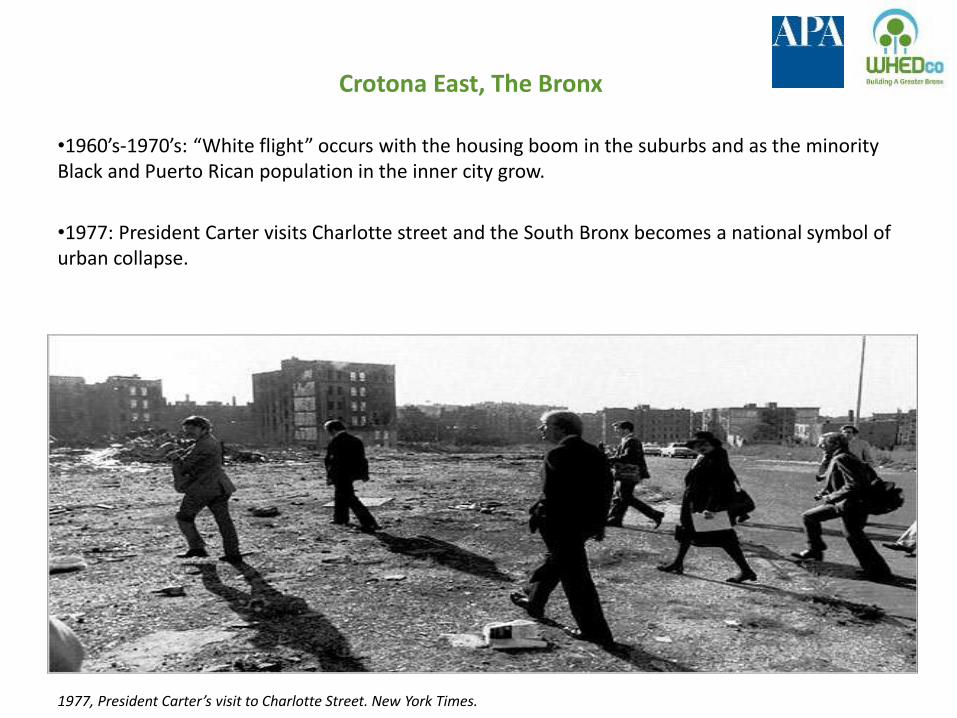
1977, President Carter’s visit to Charlotte Street. New York Times.
•1960’s-1970’s: “White flight” occurs with the housing boom in the suburbs and as the minority Black and Puerto Rican population in the inner city grow.
•1977: President Carter visits Charlotte street and the South Bronx becomes a national symbol of urban collapse.
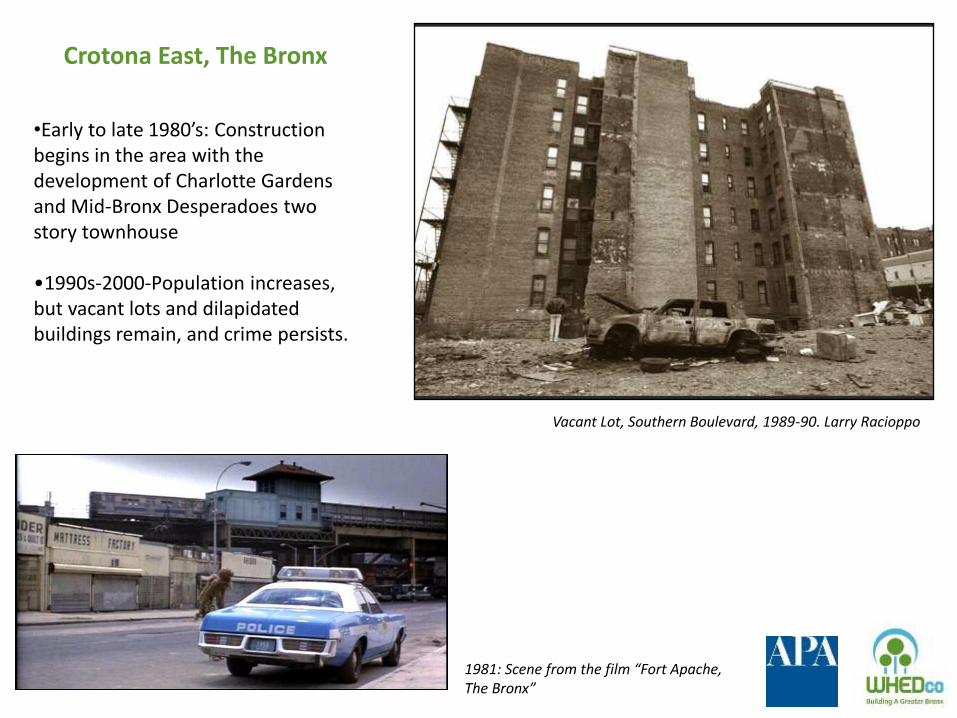
1981: Scene from the film “Fort Apache, The Bronx”
•Early to late 1980’s: Construction begins in the area with the development of Charlotte Gardens and Mid-Bronx Desperadoes two story townhouse
•1990s-2000-Population increases, but vacant lots and dilapidated buildings remain, and crime persists.
Crotona East, The Bronx
Vacant Lot, Southern Boulevard, 1989-90. Larry Racioppo
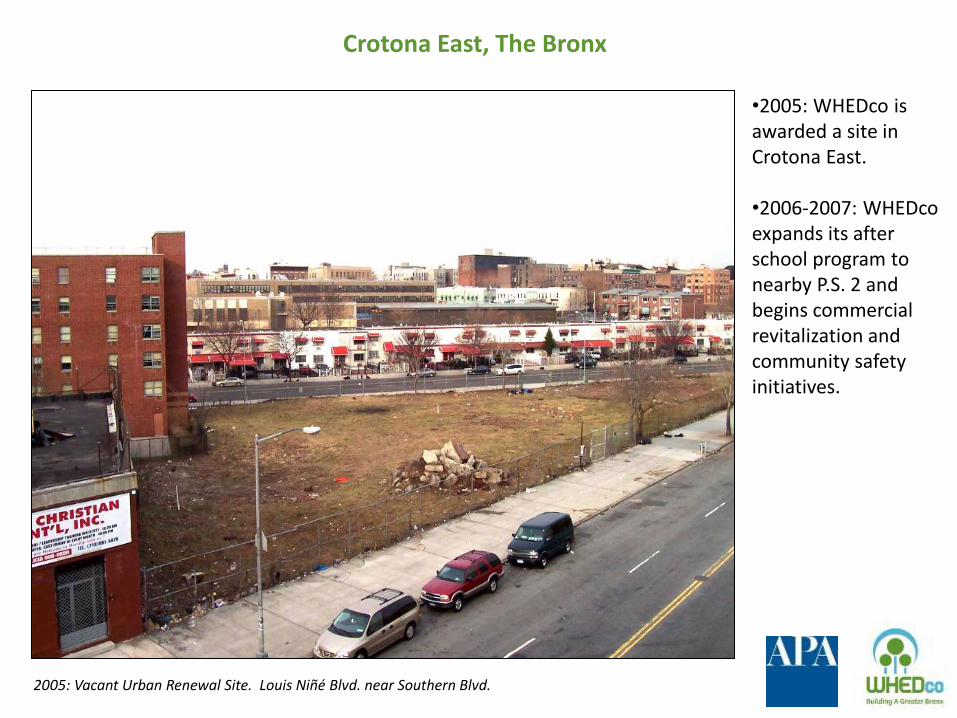
2005: Vacant Urban Renewal Site. Louis Niñé Blvd. near Southern Blvd.
Crotona East, The Bronx
•2005: WHEDco is awarded a site in Crotona East. •2006-2007: WHEDco expands its after school program to nearby P.S. 2 and begins commercial revitalization and community safety initiatives.

Why Commercial Revitalization?
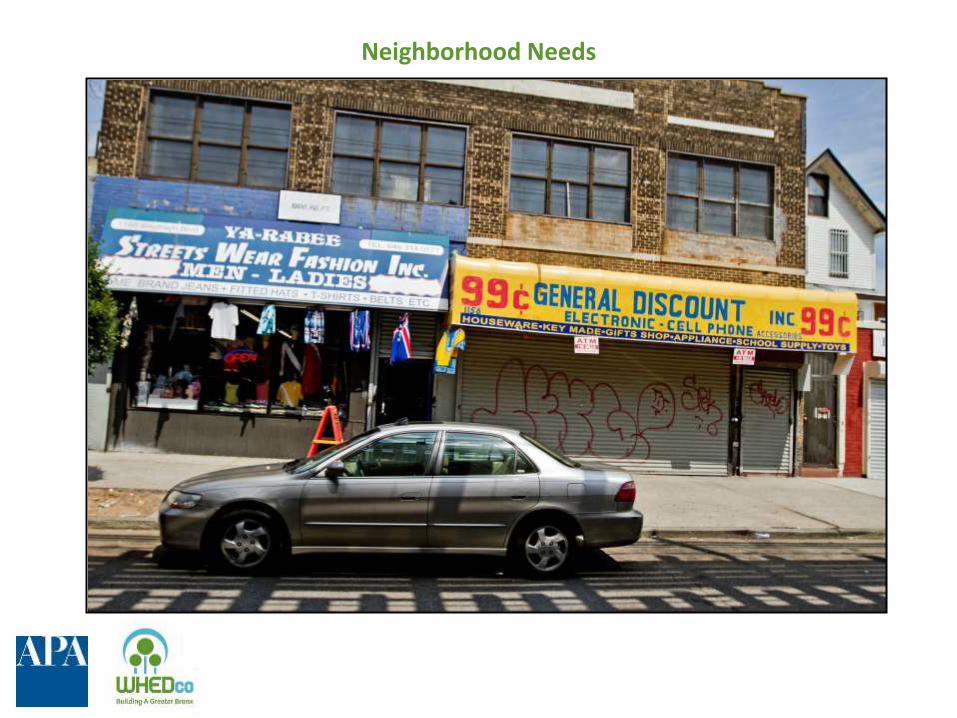
Neighborhood Needs
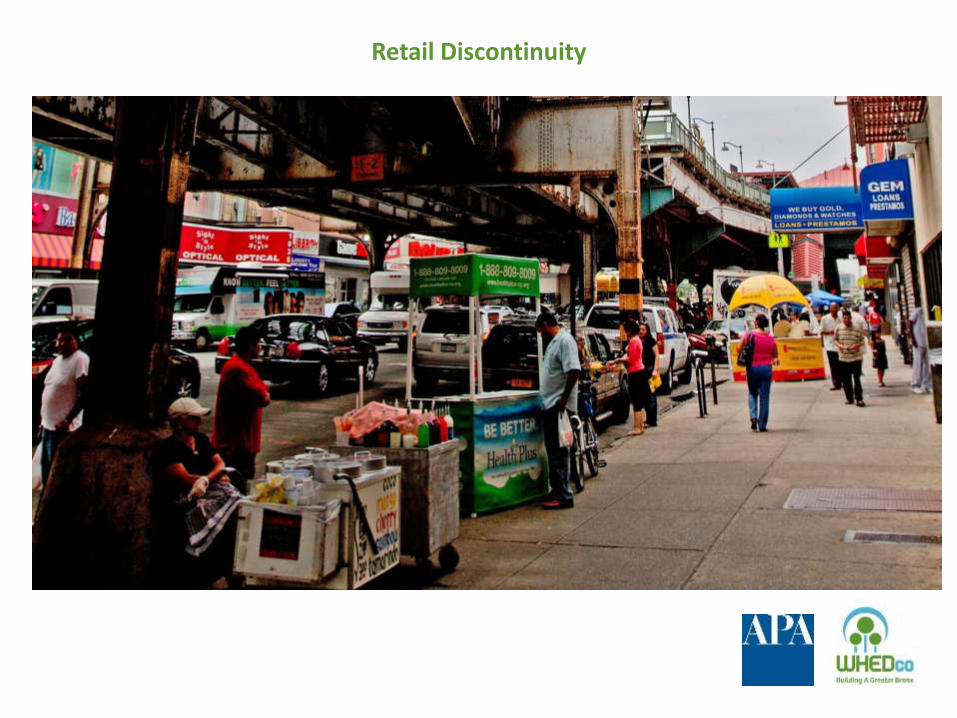
Retail Discontinuity
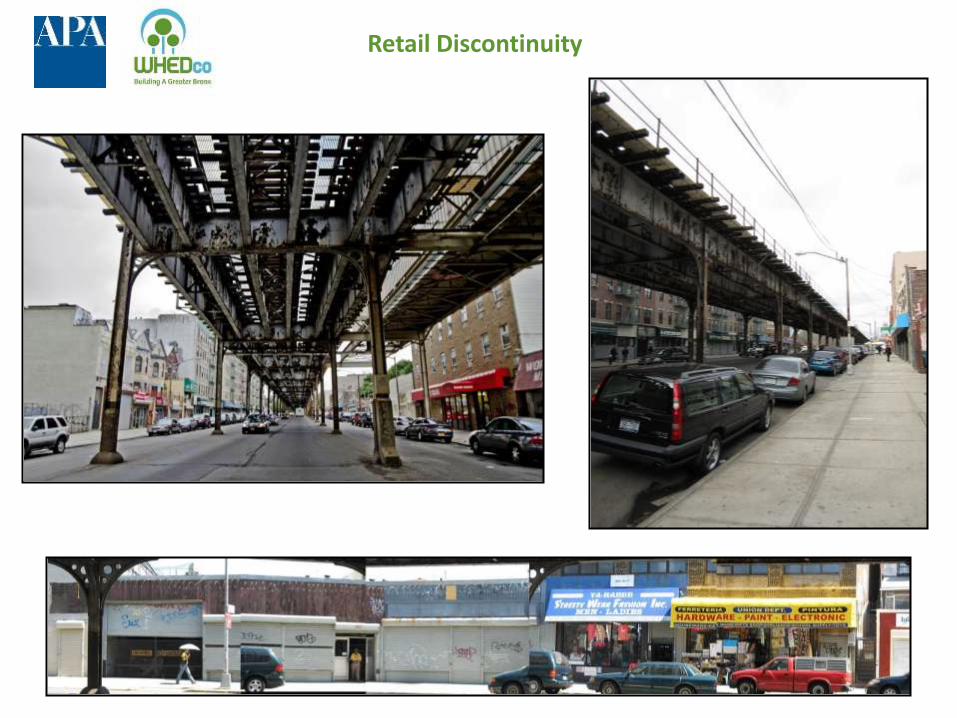
Retail Discontinuity
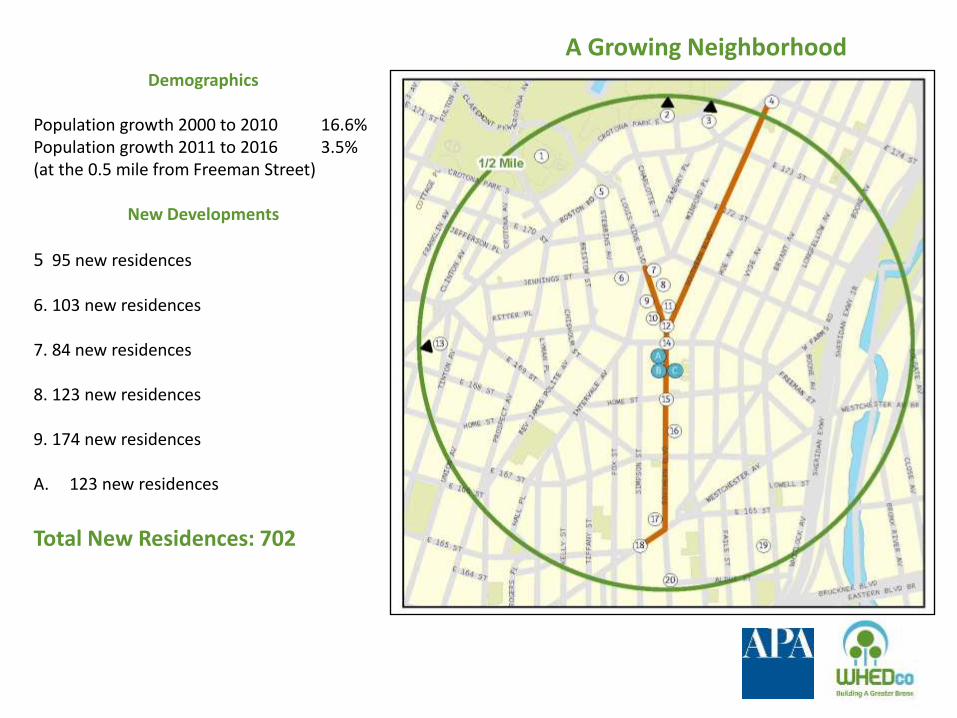
A Growing Neighborhood Demographics
Population growth 2000 to 2010 16.6% Population growth 2011 to 2016 3.5% (at the 0.5 mile from Freeman Street)
New Developments
5 95 new residences 6. 103 new residences 7. 84 new residences 8. 123 new residences 9. 174 new residences A. 123 new residences
Total New Residences: 702
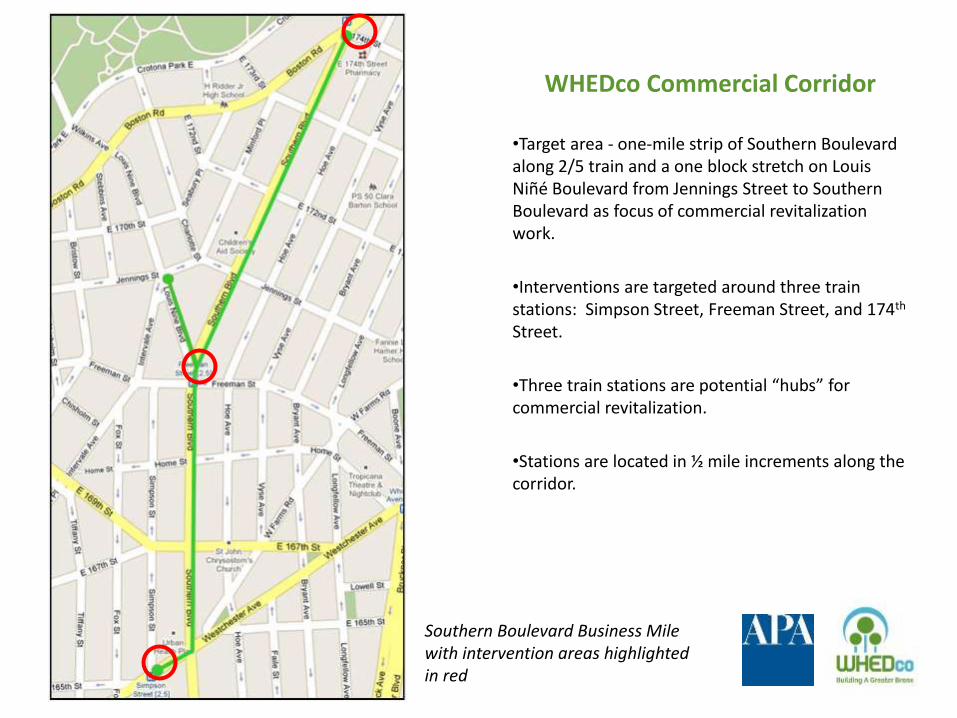
WHEDco Commercial Corridor
•Target area - one-mile strip of Southern Boulevard along 2/5 train and a one block stretch on Louis Niñé Boulevard from Jennings Street to Southern Boulevard as focus of commercial revitalization work.
•Interventions are targeted around three train stations: Simpson Street, Freeman Street, and 174th Street.
•Three train stations are potential “hubs” for commercial revitalization.
•Stations are located in ½ mile increments along the corridor.
Southern Boulevard Business Mile with intervention areas highlighted in red

Transportation, Access and Pedestrian Counts
•174th St. Subway ( train), 7,049 weekday boardings
•Southern Blvd. & Freeman St., 1,981 pedestrians/hr (am peak)
•Southern Blvd. & Louis Niñé Blvd., 6,600 vehicles/day
•Freeman St. Subway ( train), 4,832 weekday boardings
•Bx19 bus along Southern Blvd., 29,000 riders/day
•Simpson St. Subway, 9,421 weekday boardings
•Southern Blvd. & Aldus St., 11,200 vehicles/day
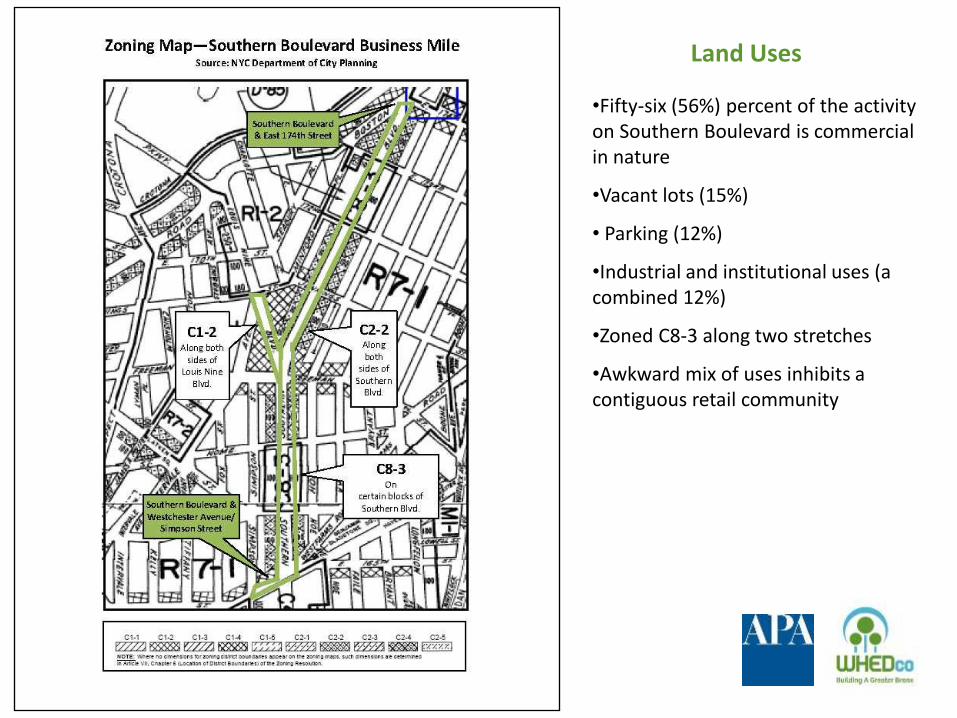
Land Uses
•Fifty-six (56%) percent of the activity on Southern Boulevard is commercial in nature
•Vacant lots (15%)
• Parking (12%)
•Industrial and institutional uses (a combined 12%)
•Zoned C8-3 along two stretches
•Awkward mix of uses inhibits a contiguous retail community

Crotona East Community Planning Meetings
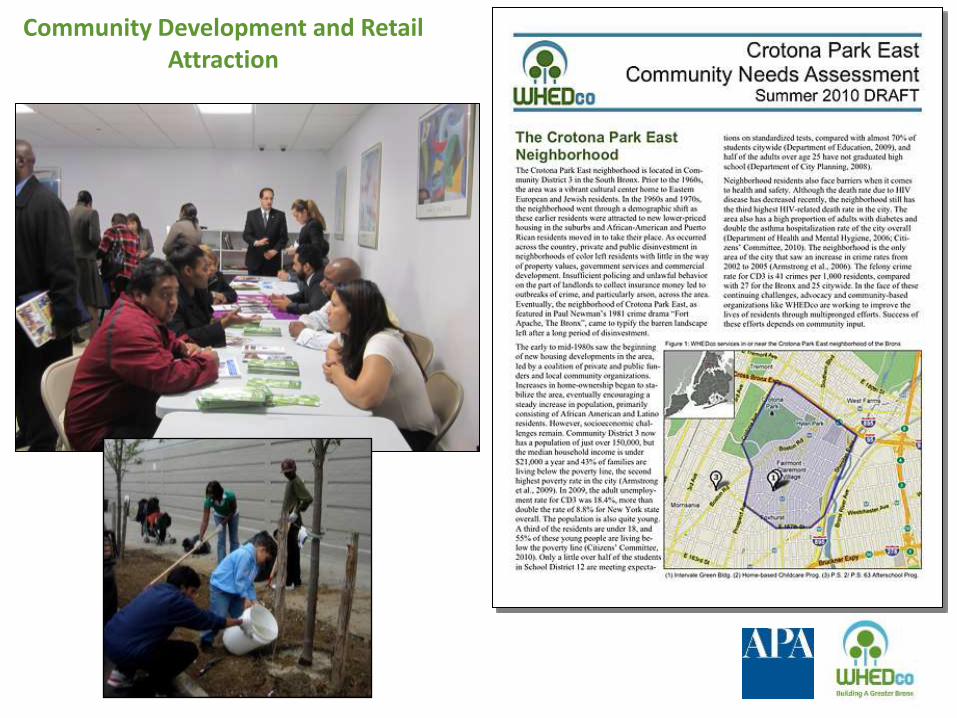
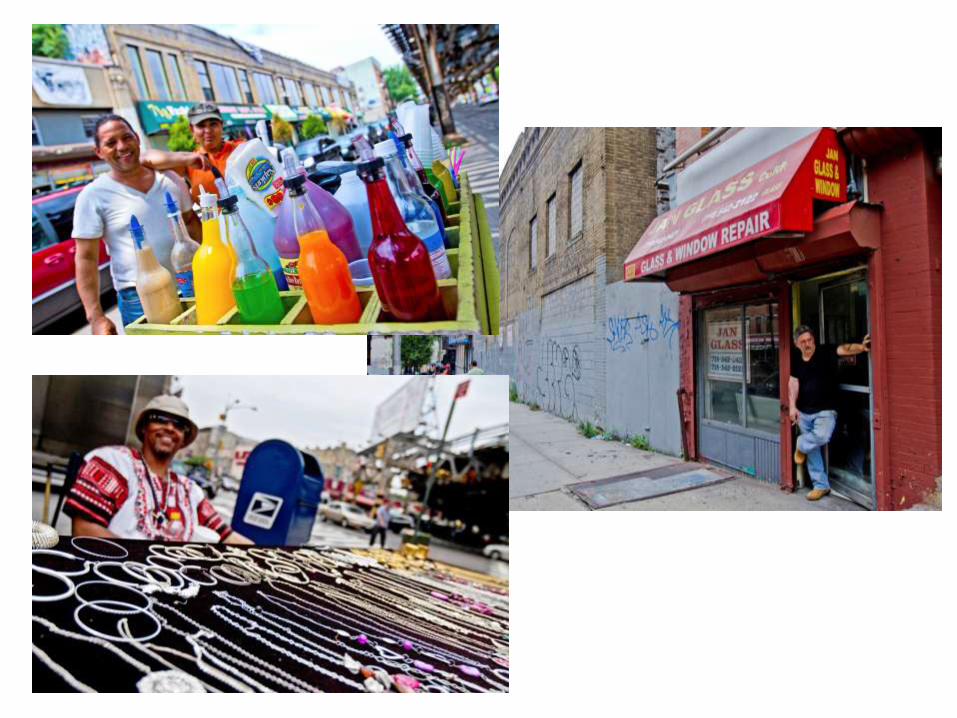
Community Development and Retail Attraction

Community Development and Retail Attraction
Rolling Up the Gates Retail Tour, 2011
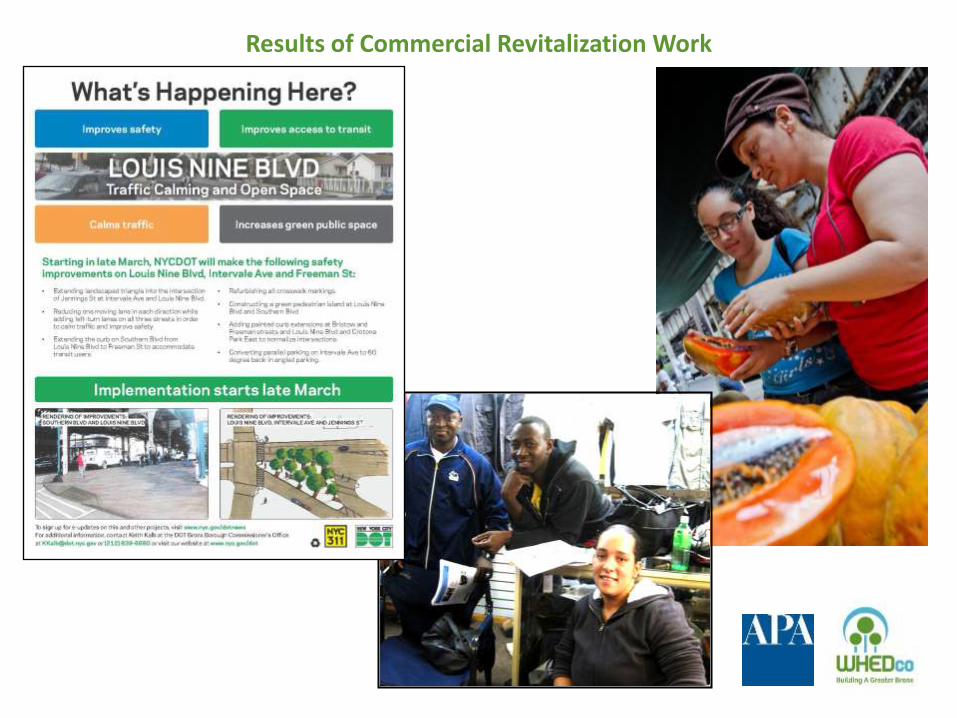
Results of Commercial Revitalization Work
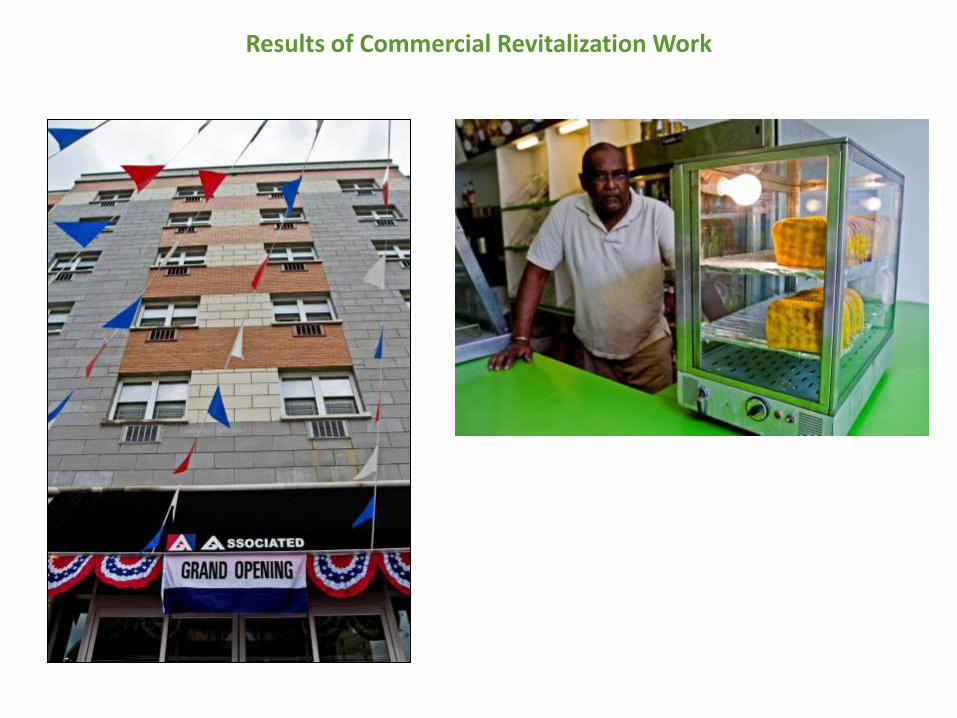
Results of Commercial Revitalization Work

Results of Commercial Revitalization Work
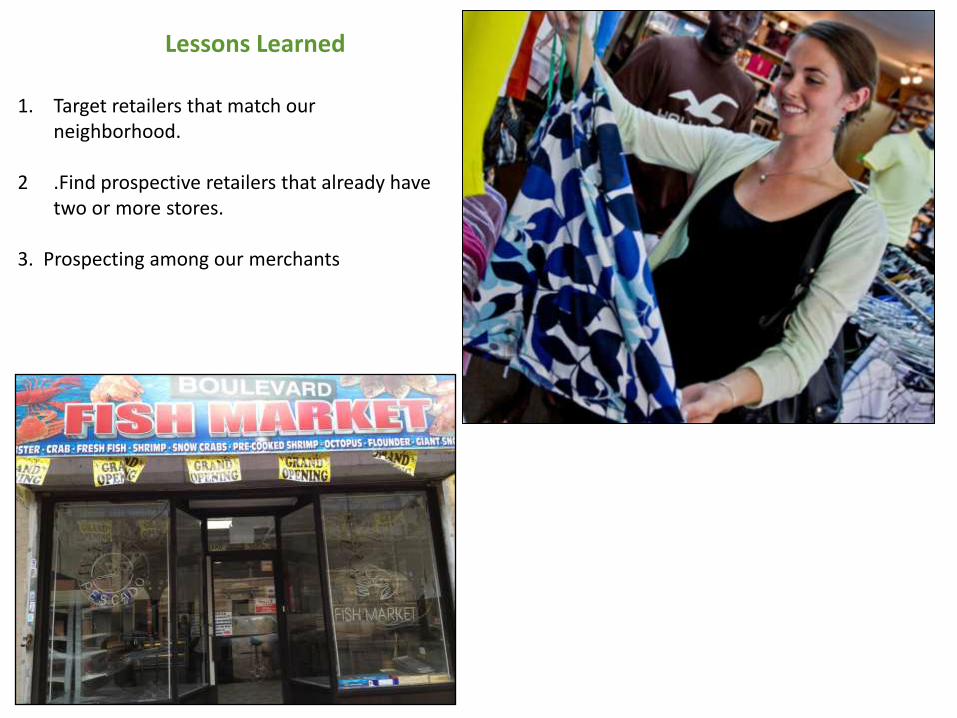
Lessons Learned
1. Target retailers that match our neighborhood.
2 .Find prospective retailers that already have
two or more stores. 3. Prospecting among our merchants

What’s Next?

FTA’s New Starts Program and the Livability Initiative: Updates from
the Federal Perspective
2012 APA National Conference - Los Angeles S-505: Transit-Focused Community Revitalization and
Retail Development
James J. Garland New Starts Team Leader, FTA Office of Planning
Washington, D.C.
Presentation Overview
• The New Starts Program
• Brief overview of the New Starts and Small
Starts Notice of Proposed Rule Making
(NPRM)
• DOT/HUD/EPA Livability Program- Highlights
and Accomplishments
2
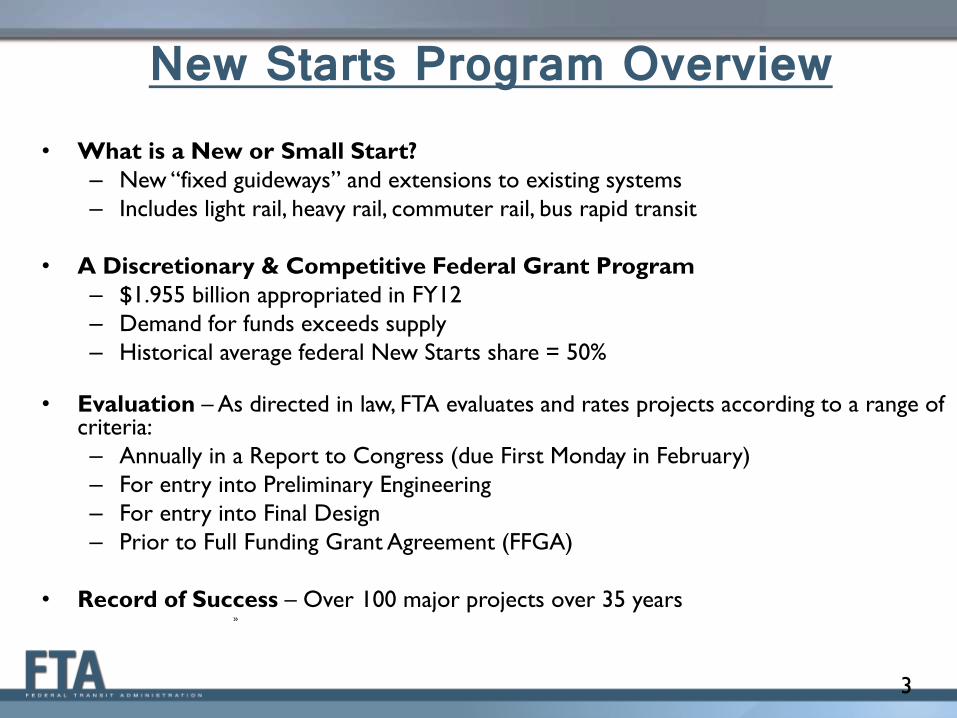
New Starts Program Overview • What is a New or Small Start?
– New “fixed guideways” and extensions to existing systems
– Includes light rail, heavy rail, commuter rail, bus rapid transit
• A Discretionary & Competitive Federal Grant Program
– $1.955 billion appropriated in FY12
– Demand for funds exceeds supply
– Historical average federal New Starts share = 50%
• Evaluation – As directed in law, FTA evaluates and rates projects according to a range of criteria:
– Annually in a Report to Congress (due First Monday in February)
– For entry into Preliminary Engineering
– For entry into Final Design
– Prior to Full Funding Grant Agreement (FFGA)
• Record of Success – Over 100 major projects over 35 years »
3
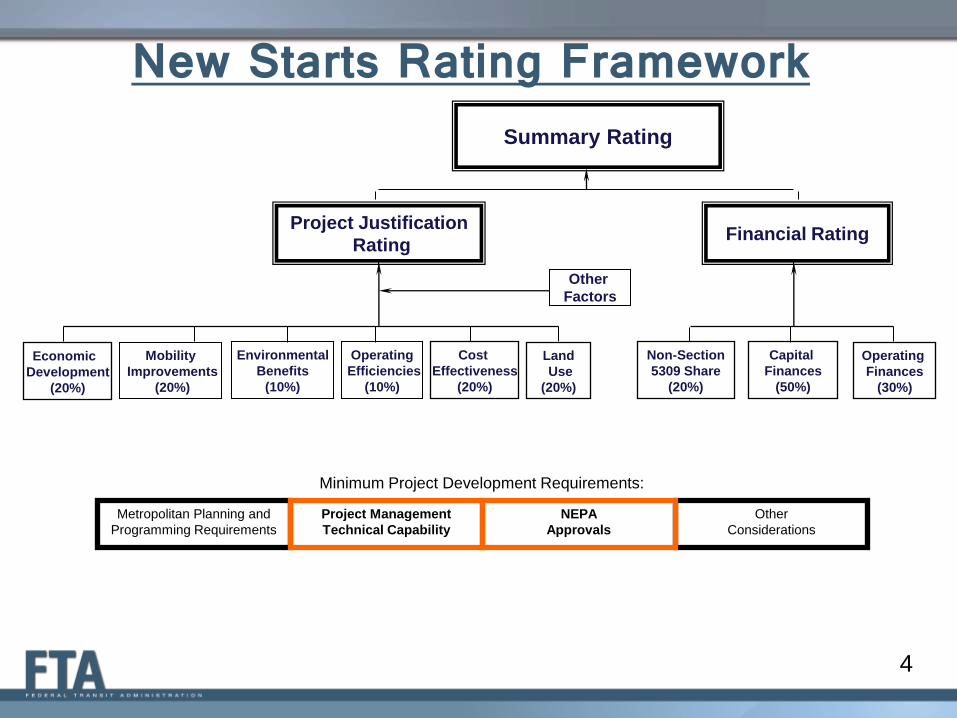
4
Capital
Finances
(50%)
Operating
Efficiencies
(10%)
Environmental
Benefits
(10%)
New Starts Rating Framework Summary Rating
Project Justification
Rating Financial Rating
Non-Section
5309 Share
(20%)
Operating
Finances
(30%)
Other
Factors
Mobility
Improvements
(20%)
Cost
Effectiveness
(20%)
Land
Use
(20%)
Economic
Development
(20%)
Minimum Project Development Requirements:
Metropolitan Planning and
Programming Requirements
Project Management
Technical Capability
Other
Considerations
NEPA
Approvals

FTA’s Land Use and Economic Development Criteria
• Land Use – Existing population and employment within ½ mile of
station areas
• Economic Development – Transit Supportive Plans and Policies
• Growth Management
• Transit Supportive Corridor Policies
– Performance and Impact of Plans and Policies • Demonstrated cases of TOD
• Station area development proposals and status
5
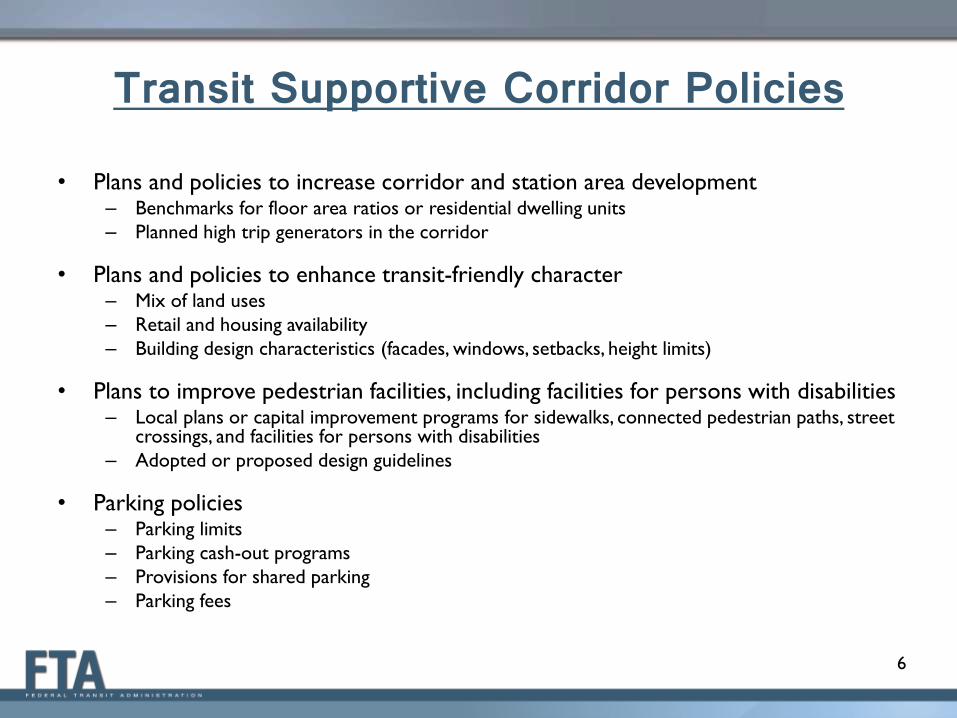
Transit Supportive Corridor Policies • Plans and policies to increase corridor and station area development
– Benchmarks for floor area ratios or residential dwelling units
– Planned high trip generators in the corridor
• Plans and policies to enhance transit-friendly character – Mix of land uses
– Retail and housing availability
– Building design characteristics (facades, windows, setbacks, height limits)
• Plans to improve pedestrian facilities, including facilities for persons with disabilities – Local plans or capital improvement programs for sidewalks, connected pedestrian paths, street
crossings, and facilities for persons with disabilities
– Adopted or proposed design guidelines
• Parking policies – Parking limits
– Parking cash-out programs
– Provisions for shared parking
– Parking fees
6

Challenge
• New Starts project sponsors are typically
transit agencies that have no defined role in
local land use planning
• Land use and economic development plans
and policies are critical to a successful project
rating and receipt of Federal funding
7
FTA’S NOTICE OF PROPOSED RULE MAKING (NPRM)
8
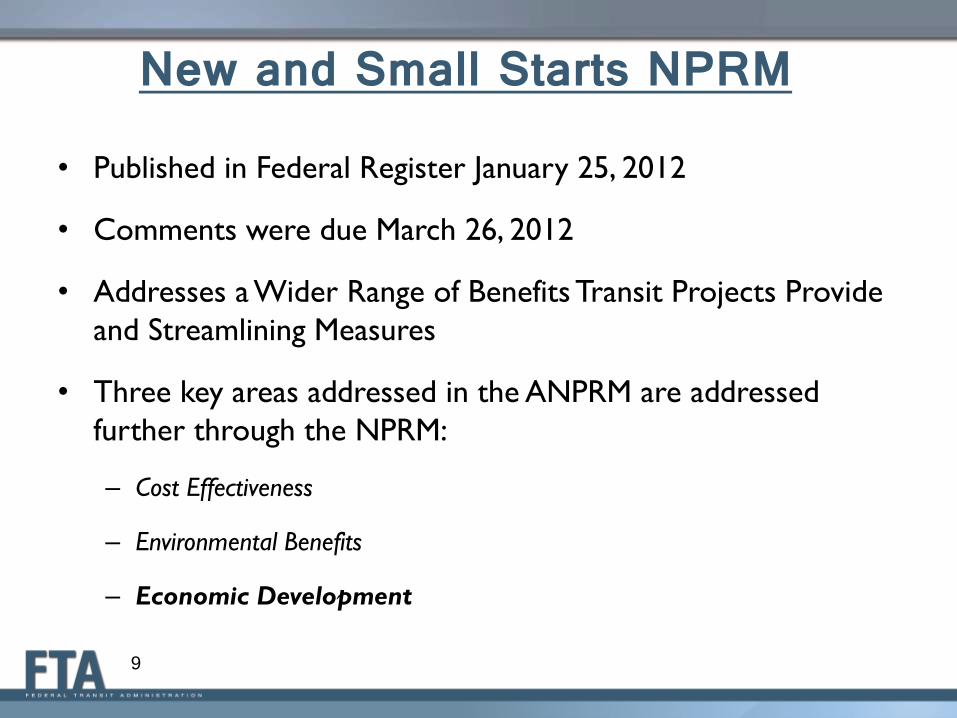
New and Small Starts NPRM • Published in Federal Register January 25, 2012
• Comments were due March 26, 2012
• Addresses a Wider Range of Benefits Transit Projects Provide
and Streamlining Measures
• Three key areas addressed in the ANPRM are addressed
further through the NPRM:
– Cost Effectiveness
– Environmental Benefits
– Economic Development
9
Proposed Policy Guidance • Published concurrently with NPRM
• Provides more details and specifics on the measures
and weights
• Comments received on policy guidance will be
considered in conjunction with those provided on
the NPRM
• Can be found on FTA website at
http://fta.dot.gov/grants/12304.html
10
Goals for NPRM • Capture a wider range of transit benefits
• Develop clear, understandable measures to support
streamlining
• Maintain data driven approach with quantitative
measures wherever possible
• Utilize simplified analytical methods
• Retain ability to identify investment-worthy projects
11

Economic Development Current Measure
• FTA rates the economic development effects of major transit
investments on the basis of transit-supportive plans and
policies
Proposed Measure
• Continue this measure and add consideration of the SOCIAL
EQUITY impacts of the proposed investment by assessing the
degree to which policies maintain or increase AFFORDABLE
HOUSING are in place
12
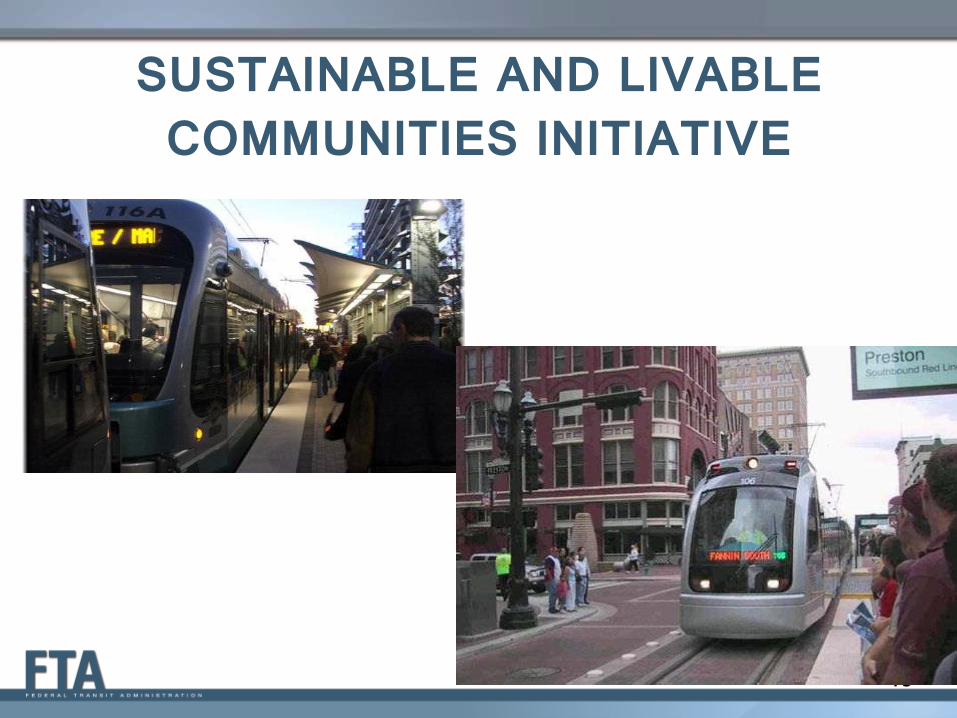
SUSTAINABLE AND LIVABLE COMMUNITIES INITIATIVE
13

14
Partnership for Sustainable Communities Principles Guiding the Partnership’s Work
1. Provide more transportation choices.
Develop safe, reliable and economical transportation choices to decrease household
transportation costs, reduce our nation’s dependence on foreign oil, improve air quality, reduce
greenhouse gas emissions and promote public health.
2. Promote equitable, affordable housing. Expand location- and energy-efficient housing choices for people of all ages, incomes, races and
ethnicities to increase mobility and lower the combined cost of housing and transportation.
3. Enhance economic competitiveness. Improve economic competitiveness through reliable and timely access to employment centers,
educational opportunities, services and other basic needs by workers as well as expanded
business access to markets.
15
Partnership for Sustainable Communities Principles Guiding the Partnership’s Work
4. Support existing communities. Target federal funding toward existing communities – through such strategies as transit-oriented,
mixed-use development and land recycling – to increase community revitalization, improve the
efficiency of public works investments, and safeguard rural landscapes.
5. Coordinate policies and leverage investment. Align federal policies and funding to remove barriers to collaboration, leverage funding and
increase the accountability and effectiveness of all levels of government to plan for future
growth, including making smart energy choices such as locally generated renewable energy.
6. Value communities and neighborhoods. Enhance the unique characteristics of all communities by investing in healthy, safe and walkable
neighborhoods – rural, urban or suburban.

Livability Focused Funding Opportunities
16
FY12 Notices of Funding Availability
Amount Available (millions)
Notice Published
Application Deadline
State of Good Repair (Bus and Bus Facilities) $ 650.0 2/7/2012 3/22/2012
Livability Expansion Initiative Alternatives Analysis $ 25.0 3/12/2012 4/19/2012
Bus and Bus Facilities $ 125.0 2/7/2012 3/29/2012
Sustainability Programs
Clean Fuels $ 51.5 2/7/2012 4/5/2012
Veteran's Initiative $ 30.0 2/7/2012 4/19/2012
Other
Transit in the Parks $ 26.8 3/10/2011 5/9/2011
Tribal Transit $ 15.0 3/9/2012 5/10/2012
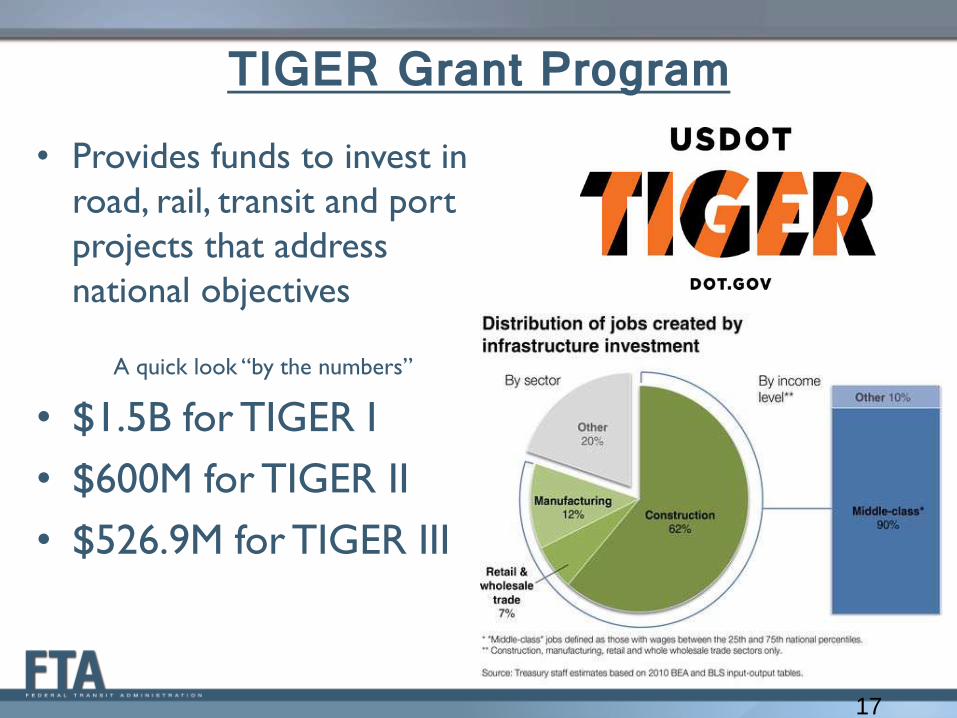
TIGER Grant Program • Provides funds to invest in
road, rail, transit and port
projects that address
national objectives
A quick look “by the numbers”
• $1.5B for TIGER I
• $600M for TIGER II
• $526.9M for TIGER III
17
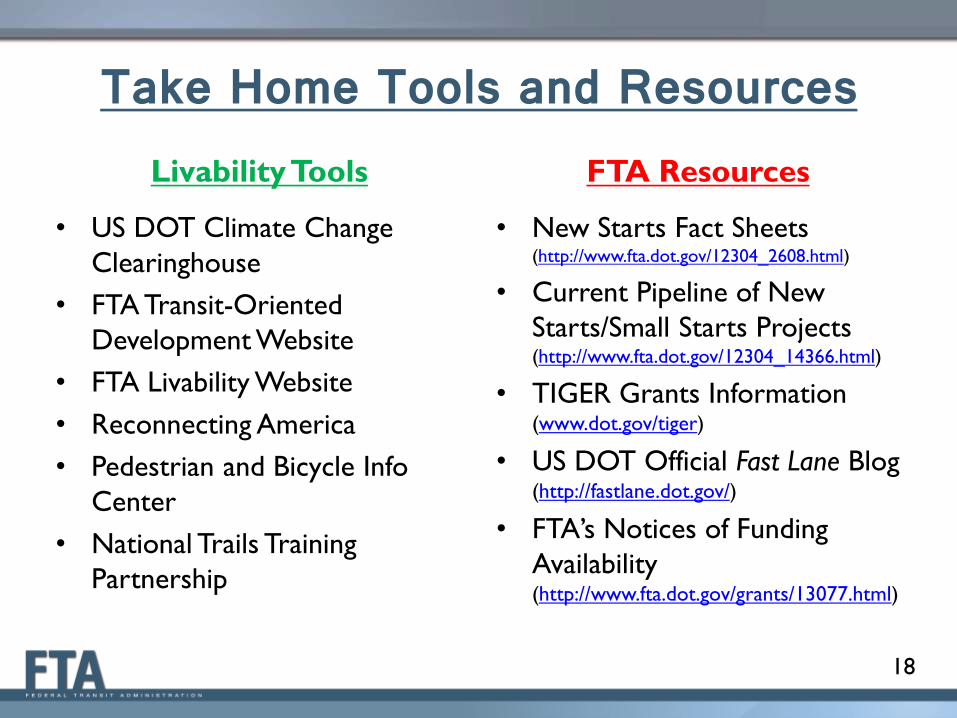
Take Home Tools and Resources Livability Tools
• US DOT Climate Change
Clearinghouse
• FTA Transit-Oriented
Development Website
• FTA Livability Website
• Reconnecting America
• Pedestrian and Bicycle Info
Center
• National Trails Training
Partnership
FTA Resources
• New Starts Fact Sheets (http://www.fta.dot.gov/12304_2608.html)
• Current Pipeline of New
Starts/Small Starts Projects (http://www.fta.dot.gov/12304_14366.html)
• TIGER Grants Information (www.dot.gov/tiger)
• US DOT Official Fast Lane Blog (http://fastlane.dot.gov/)
• FTA’s Notices of Funding
Availability (http://www.fta.dot.gov/grants/13077.html)
18
Federal Transit Administration
www.fta.dot.gov
19
TRANSIT-FOCUSED COMMUNITY REVITALIZATION
AND RETAIL DEVELOPMENT
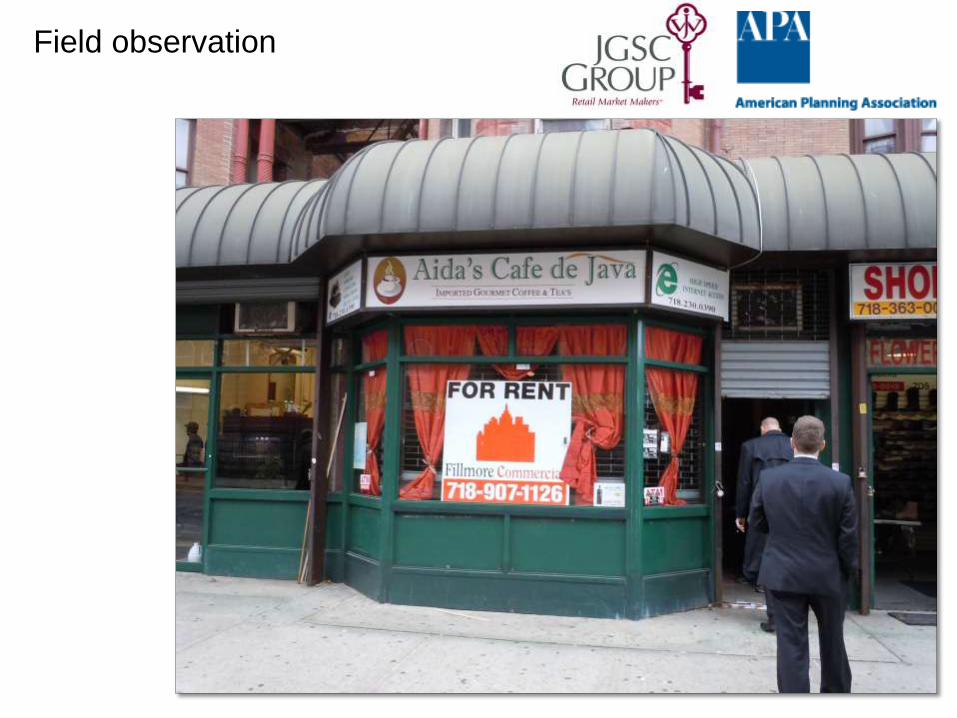
Field observation

Trade area
70%
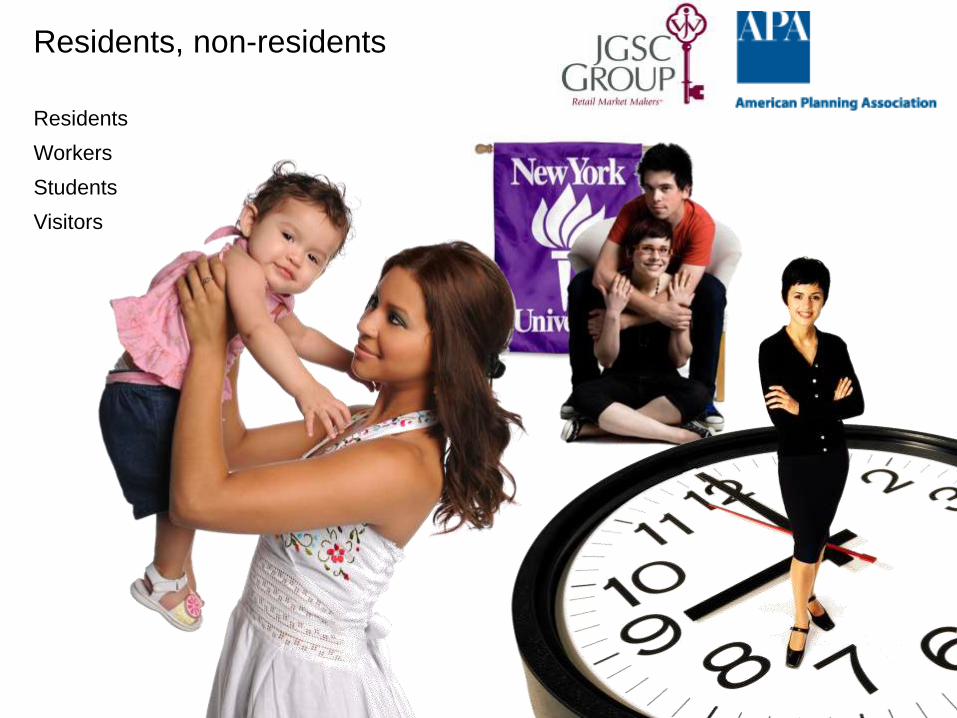
Residents, non-residents
Residents
Workers
Students
Visitors
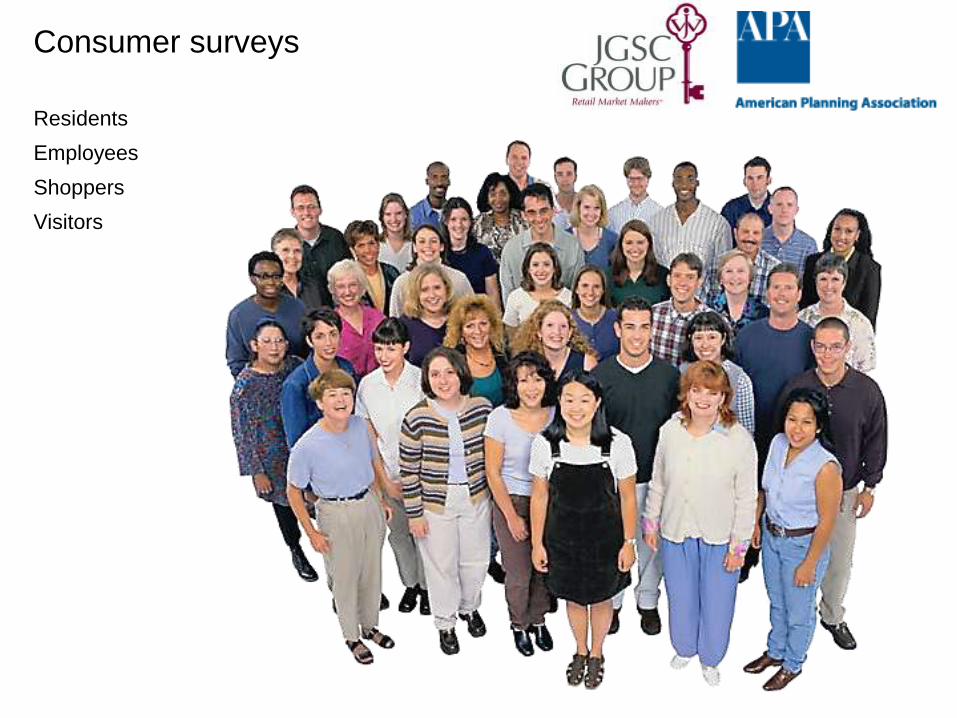
Consumer surveys
Residents
Employees
Shoppers
Visitors
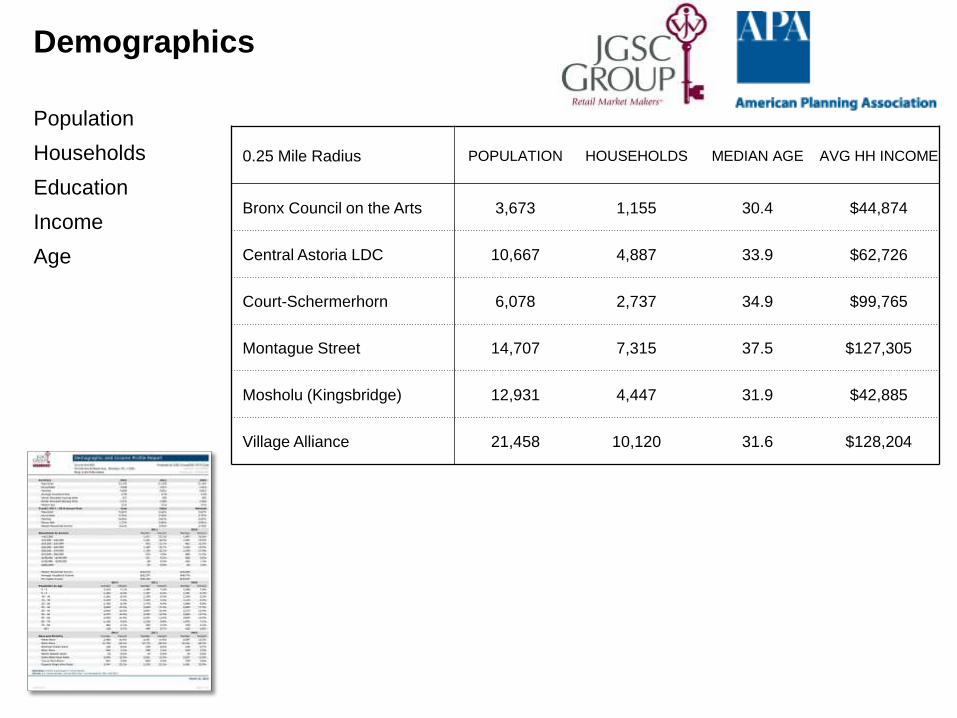
Demographics
Population
Households
Education
Income
Age
0.25 Mile Radius POPULATION HOUSEHOLDS MEDIAN AGE AVG HH INCOME
Bronx Council on the Arts 3,673 1,155 30.4 $44,874
Central Astoria LDC 10,667 4,887 33.9 $62,726
Court-Schermerhorn 6,078 2,737 34.9 $99,765
Montague Street 14,707 7,315 37.5 $127,305
Mosholu (Kingsbridge) 12,931 4,447 31.9 $42,885
Village Alliance 21,458 10,120 31.6 $128,204
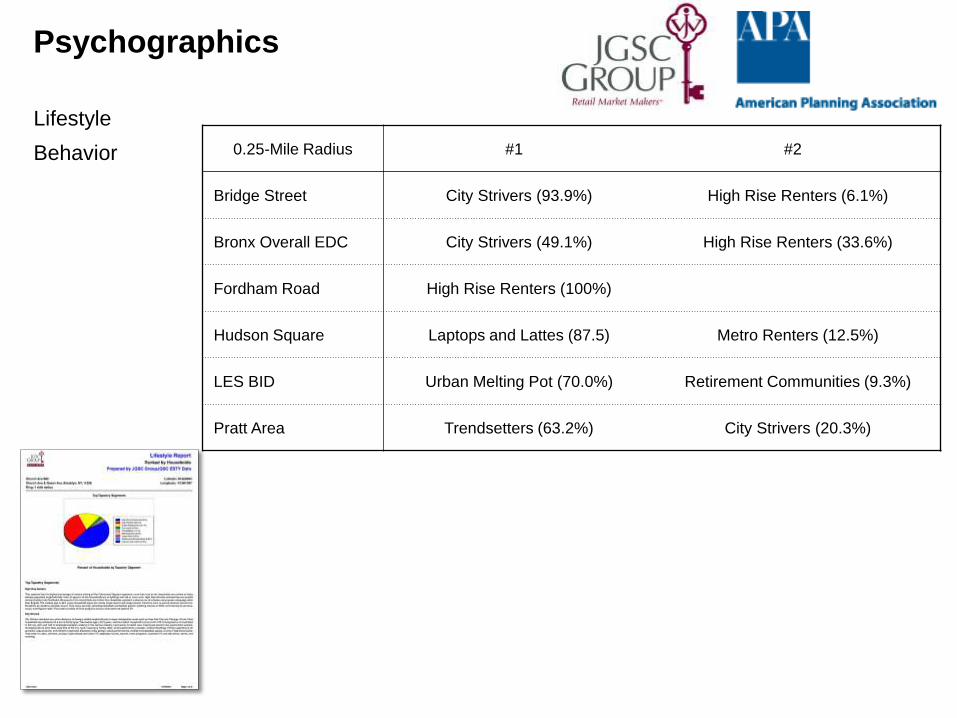
Psychographics
Lifestyle
Behavior 0.25-Mile Radius #1 #2
Bridge Street City Strivers (93.9%) High Rise Renters (6.1%)
Bronx Overall EDC City Strivers (49.1%) High Rise Renters (33.6%)
Fordham Road High Rise Renters (100%)
Hudson Square Laptops and Lattes (87.5) Metro Renters (12.5%)
LES BID Urban Melting Pot (70.0%) Retirement Communities (9.3%)
Pratt Area Trendsetters (63.2%) City Strivers (20.3%)
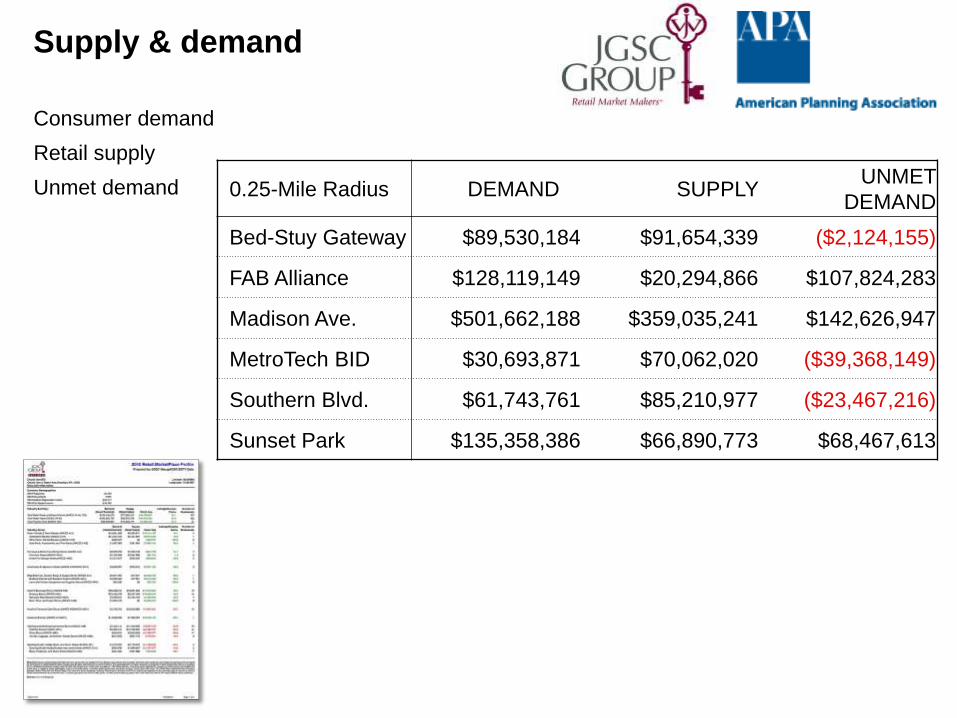
Supply & demand
Consumer demand
Retail supply
Unmet demand 0.25-Mile Radius DEMAND SUPPLY UNMET
DEMAND
Bed-Stuy Gateway $89,530,184 $91,654,339 ($2,124,155)
FAB Alliance $128,119,149 $20,294,866 $107,824,283
Madison Ave. $501,662,188 $359,035,241 $142,626,947
MetroTech BID $30,693,871 $70,062,020 ($39,368,149)
Southern Blvd. $61,743,761 $85,210,977 ($23,467,216)
Sunset Park $135,358,386 $66,890,773 $68,467,613
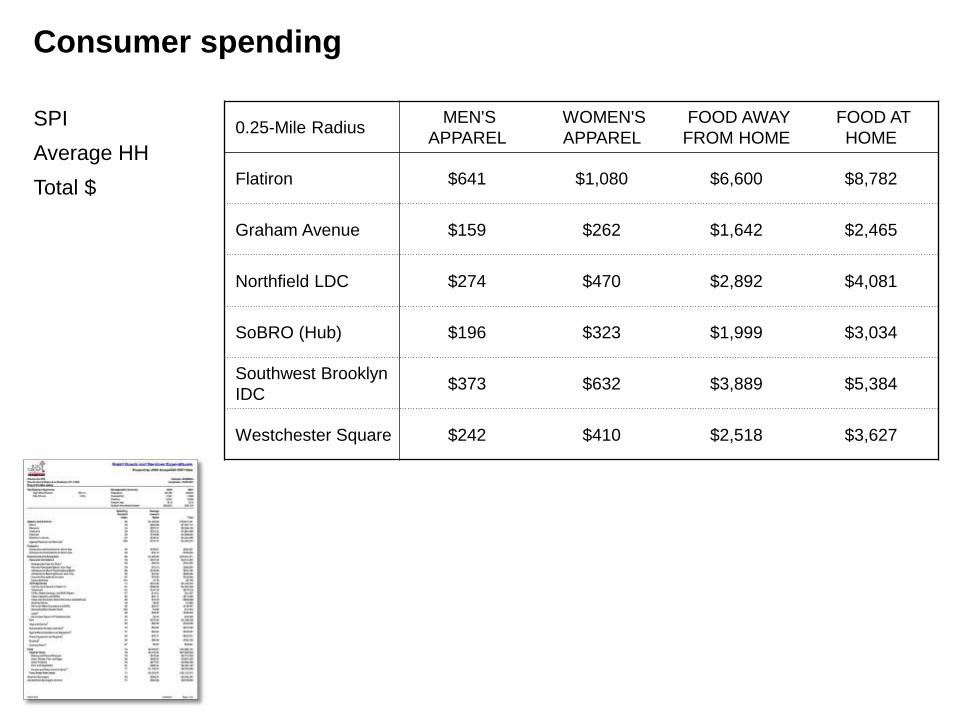
Consumer spending
SPI
Average HH
Total $
0.25-Mile Radius MEN'S
APPAREL
WOMEN'S
APPAREL
FOOD AWAY
FROM HOME
FOOD AT
HOME
Flatiron $641 $1,080 $6,600 $8,782
Graham Avenue $159 $262 $1,642 $2,465
Northfield LDC $274 $470 $2,892 $4,081
SoBRO (Hub) $196 $323 $1,999 $3,034
Southwest Brooklyn
IDC $373 $632 $3,889 $5,384
Westchester Square $242 $410 $2,518 $3,627
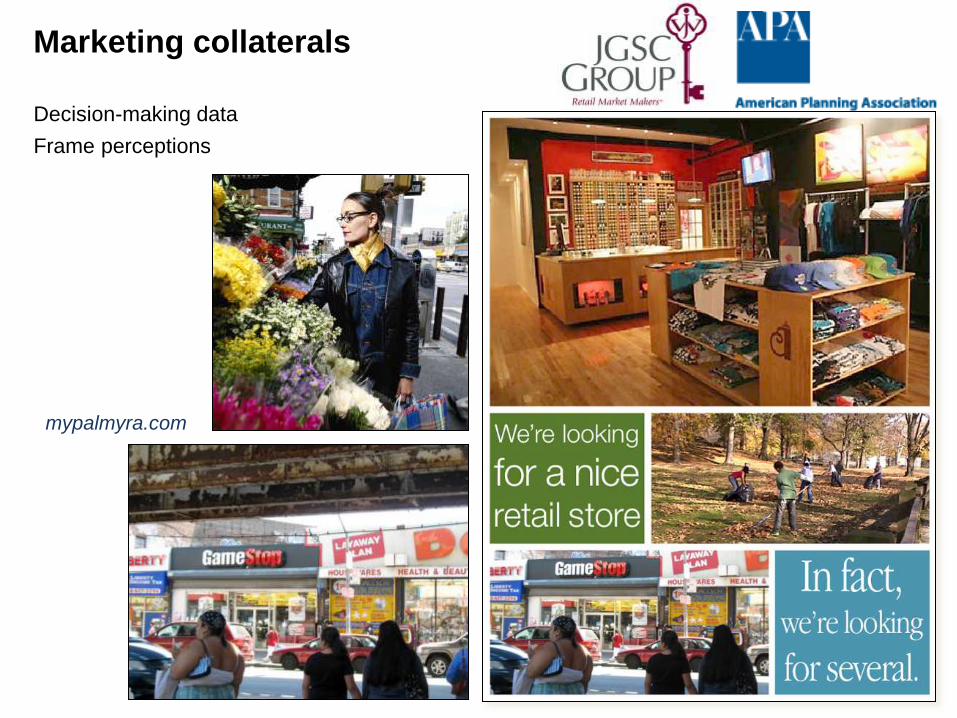
Marketing collaterals
Decision-making data
Frame perceptions
mypalmyra.com
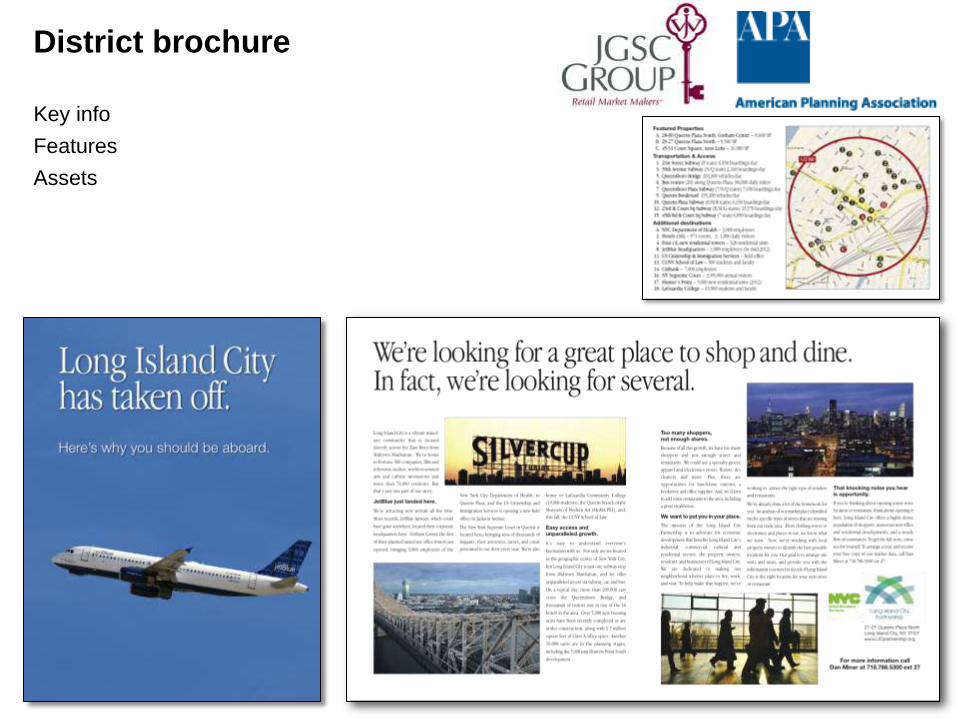
District brochure
Key info
Features
Assets

Communicating
Targeted
Focused
Repetitive

Sell sheets

Window signs
Proactive signs for
vacant storefronts
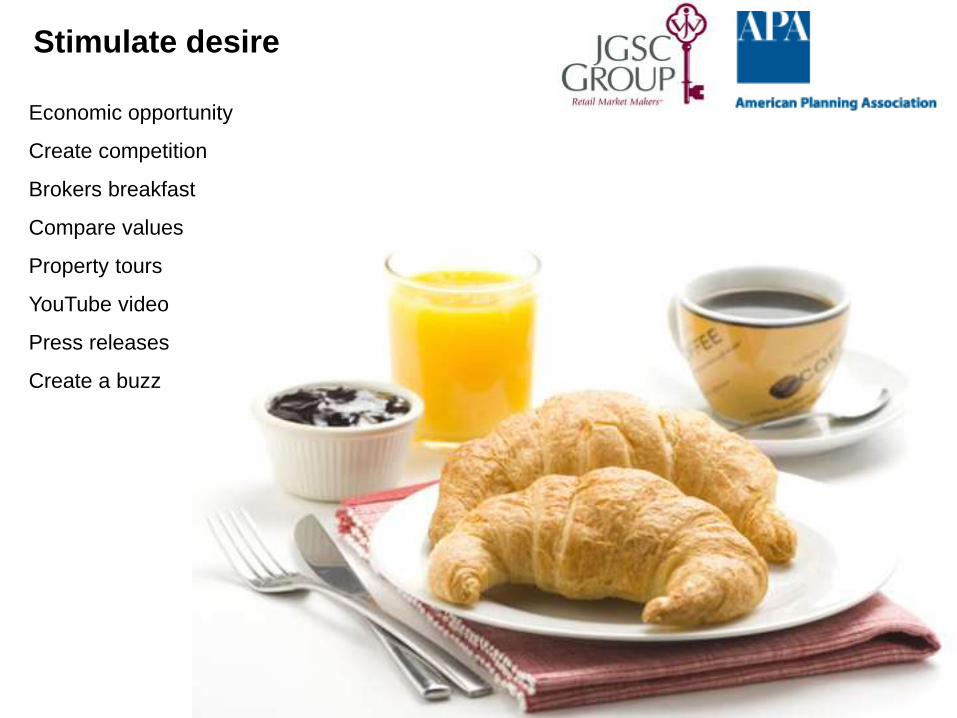
Stimulate desire
Economic opportunity
Create competition
Brokers breakfast
Compare values
Property tours
YouTube video
Press releases
Create a buzz
Thank you!
community-insights.com
Seferinus Okoth, AICP
Chicago Metropolitan Agency for Planning (CMAP)
Transit-Focused Community Revitalization
and Retail Development (S505)
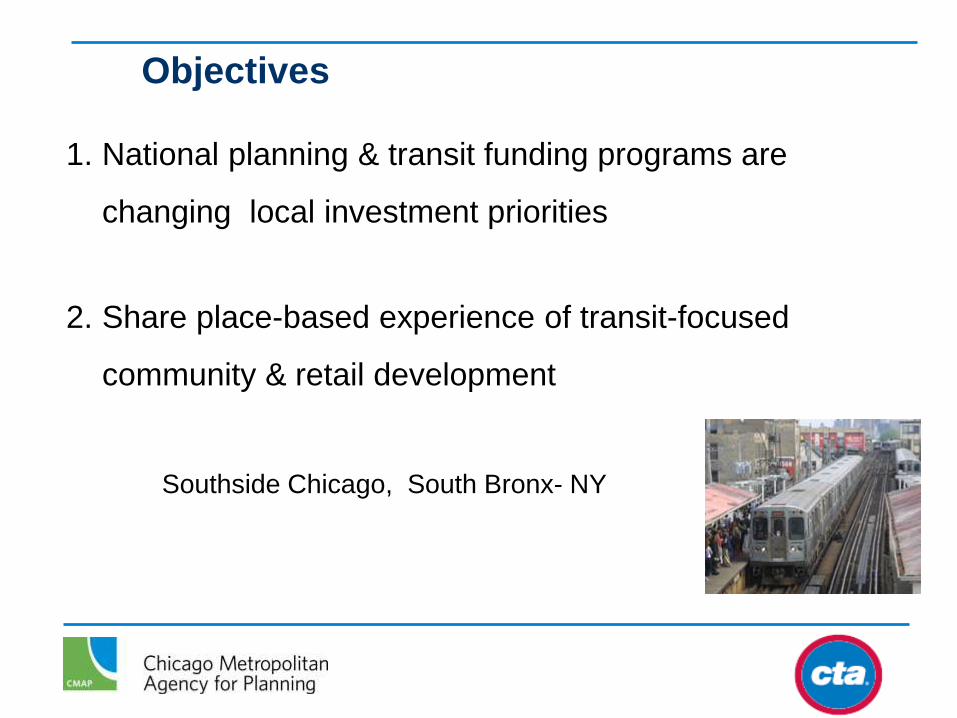
Objectives
1. National planning & transit funding programs are
changing local investment priorities
2. Share place-based experience of transit-focused
community & retail development
Southside Chicago, South Bronx- NY
Key Terms
1. Public Transit
2. Community Revitalization
3. Economic/Retail Development
4. Infrastructure investment
5. “New Starts” Program
6. Sustainable Communities Program
Transit
• Leading incentive for revitalizing neighborhoods
• Housing/business near transit nodes have higher ROI
• Attractive to investors
• Transit infrastructure gives you an edge
• Communities are taking advantage of existing
infrastructure to maximize retail and housing
Transit in Low-income/minority communities
• Difficult directing government attention-dollars
• Lack purchasing power and market strength
• Overlooked for larger gains elsewhere
• Transit infrastructure rich -dilapidated but with potential
• In New York and Chicago Transportation, is helping to
gunner public & government attention in low-income
neighborhoods
Federal planning & transit funding programs
• HUD’s sustainable communities program
• FTA’s New Starts Program
• encourage utilization of existing transit infrastructure
• Communities are using the programs to expand and
support public transit in low-income and minority
neighborhoods
• Federal transit funding is one of the leading impetus for
revitalizing minority neighborhoods
CMAP
• Regional planning agency for the Chicago metro area
• 7 counties, 284 municipalities
• GO TO 2040 Plan
– Livable communities
– Human capital
– Regional mobility
– Efficient governance
• Implementation: LTA program
• $4.2M Sustainable Communities Regional Planning grant
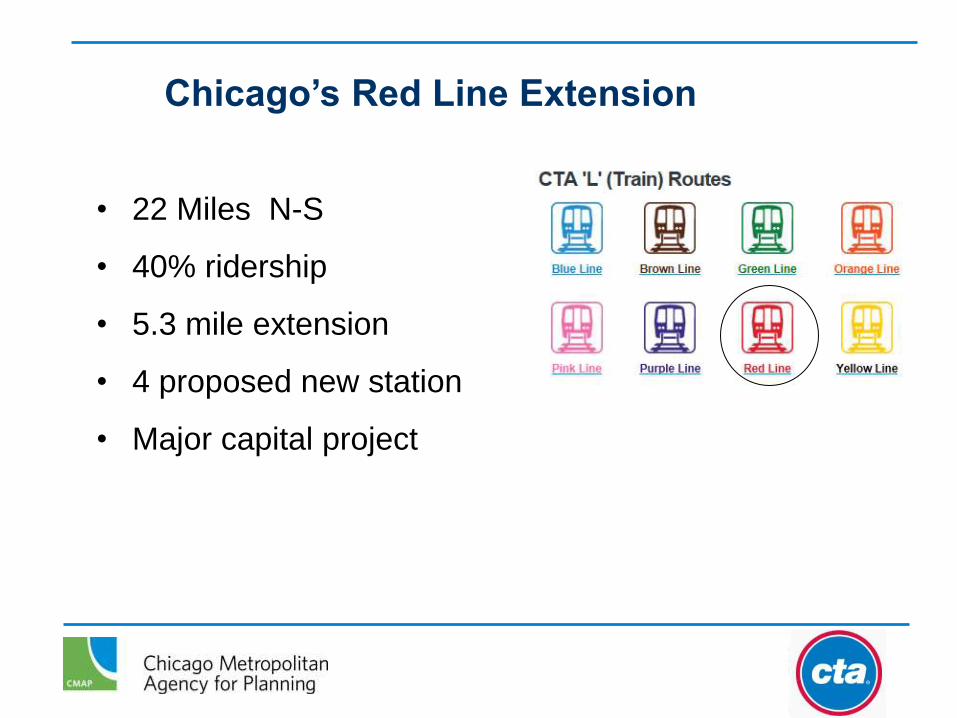
• 22 Miles N-S
• 40% ridership
• 5.3 mile extension
• 4 proposed new station
• Major capital project
Chicago’s Red Line Extension
Project Purpose
• Enhance economic competitiveness
• Improve neighborhood livability
• Reduce travel times to jobs and community
destinations
• Increase transportation options
• Improve transit performance
• Support community revitalization initiatives
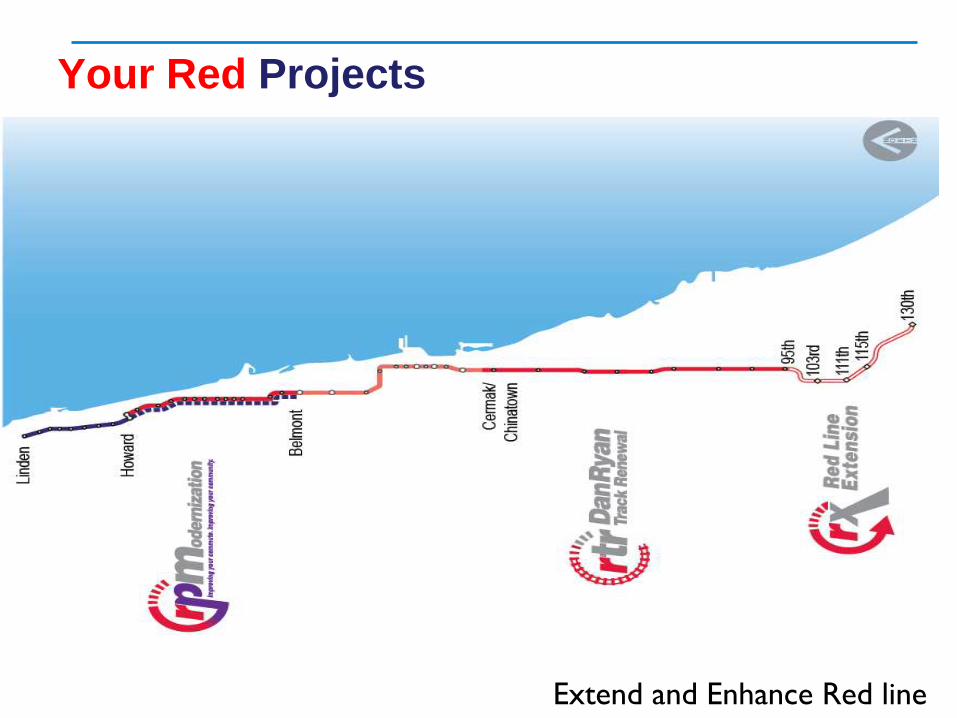
Your Red Projects
Extend and Enhance Red line

Red Line Extension
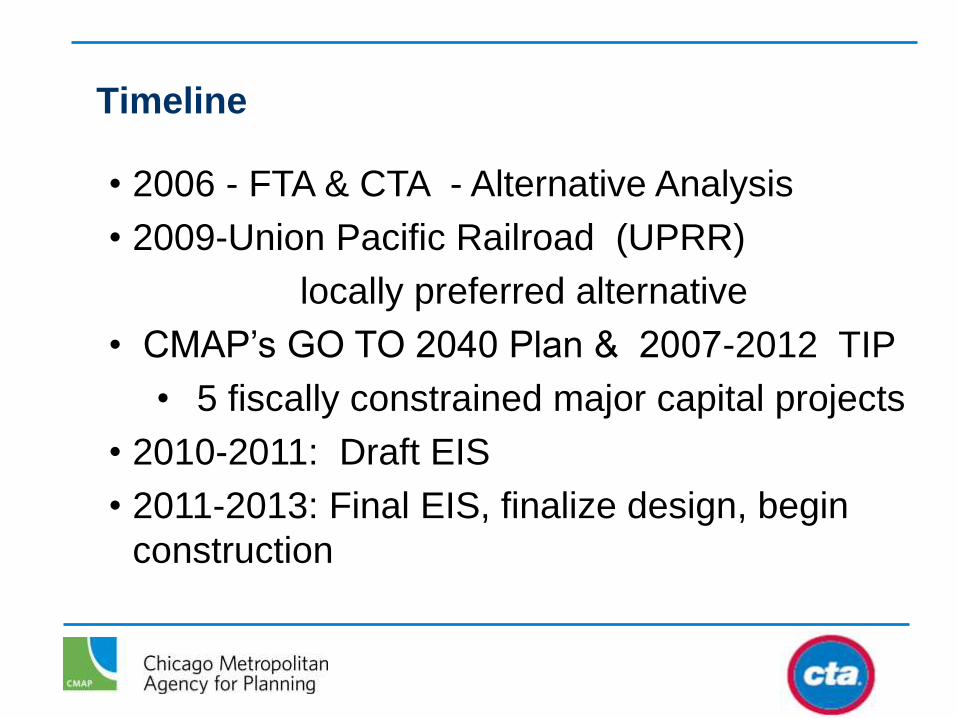
Timeline
• 2006 - FTA & CTA - Alternative Analysis
• 2009-Union Pacific Railroad (UPRR)
locally preferred alternative
• CMAP’s GO TO 2040 Plan & 2007-2012 TIP
• 5 fiscally constrained major capital projects
• 2010-2011: Draft EIS
• 2011-2013: Final EIS, finalize design, begin
construction

Locally Preferred
Alternative
UP- Line
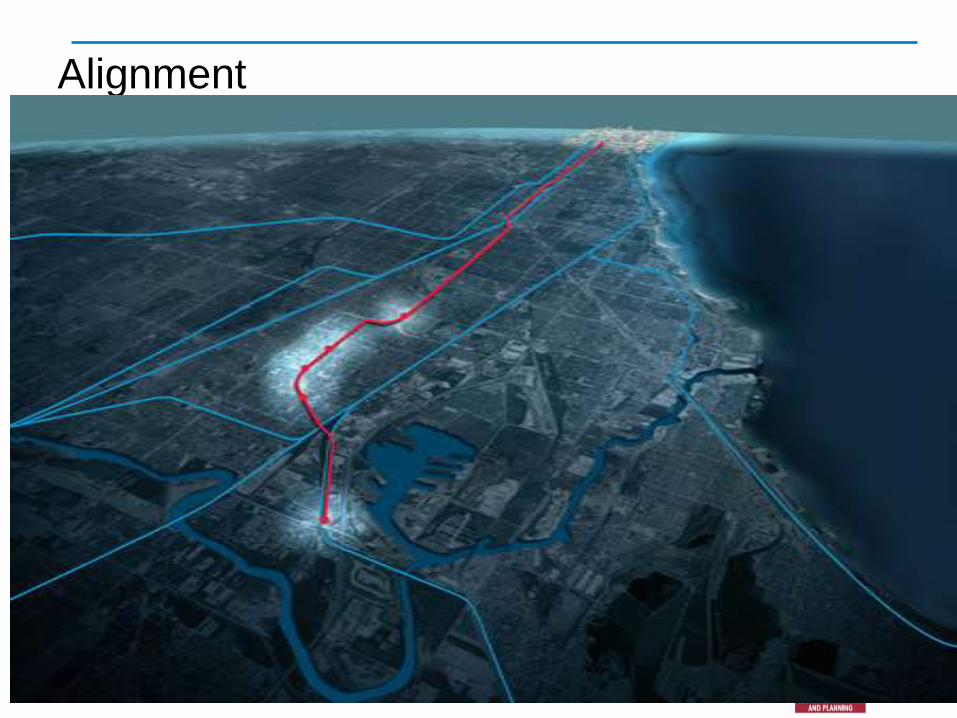
Alignment

Progress
• CTA - $8.4 M for EIS for Your Red Projects
• Draft EIS- underway
• 45 days public comments
• Final EIS prepared & submitted to FTA
• Preliminary engineering - subject to availability
of funding
• FTA to issue Record of Decision (ROD)
• Final design and construction
• 2016: open for operations
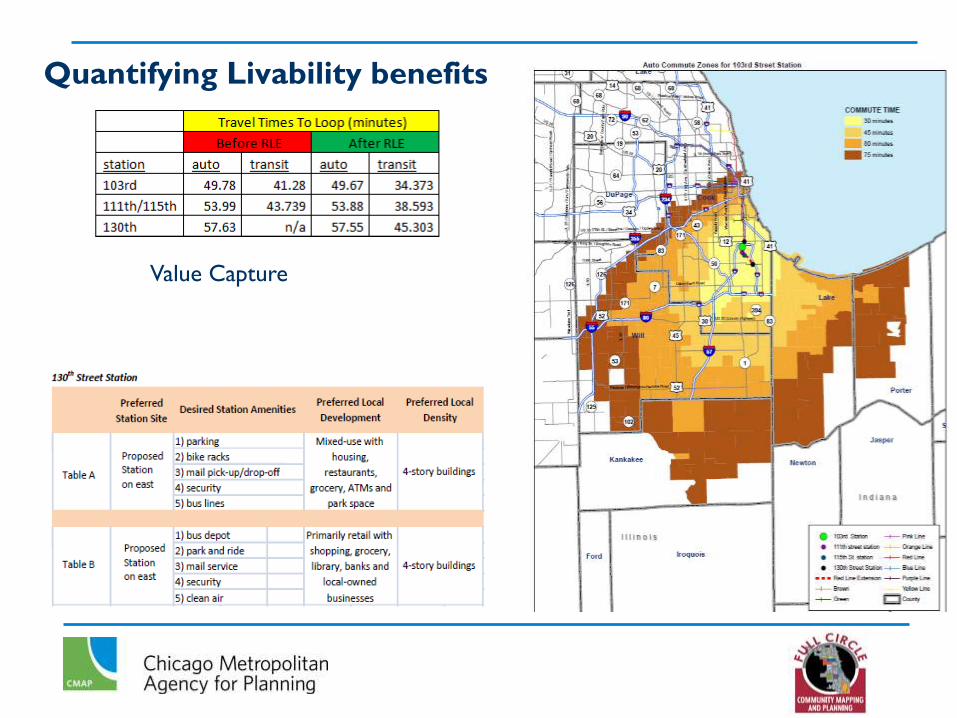
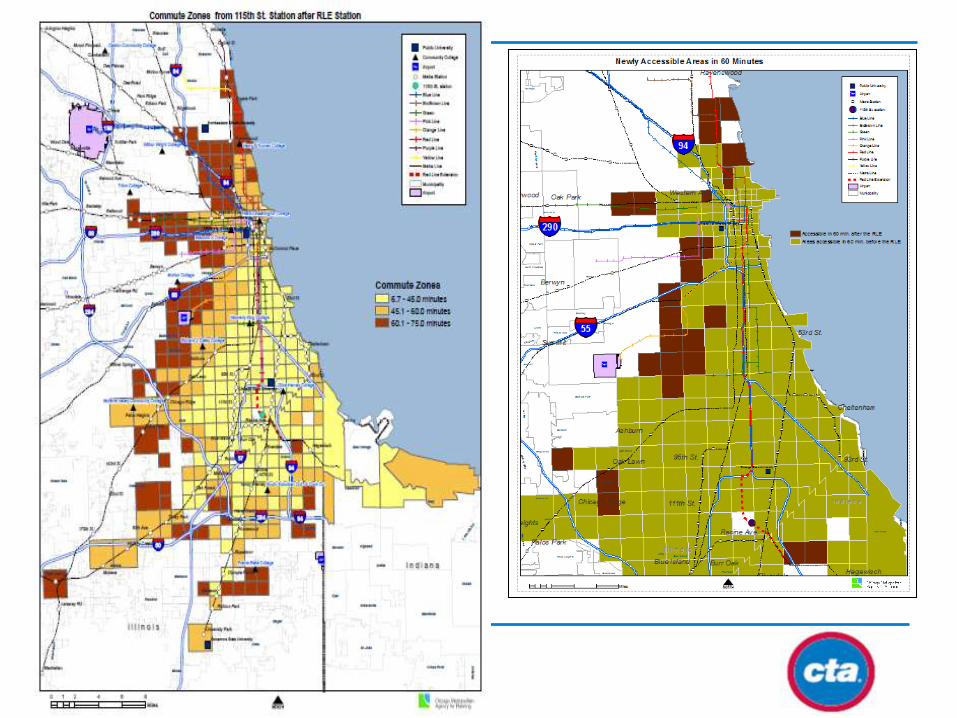
Quantifying Livability benefits
Value Capture
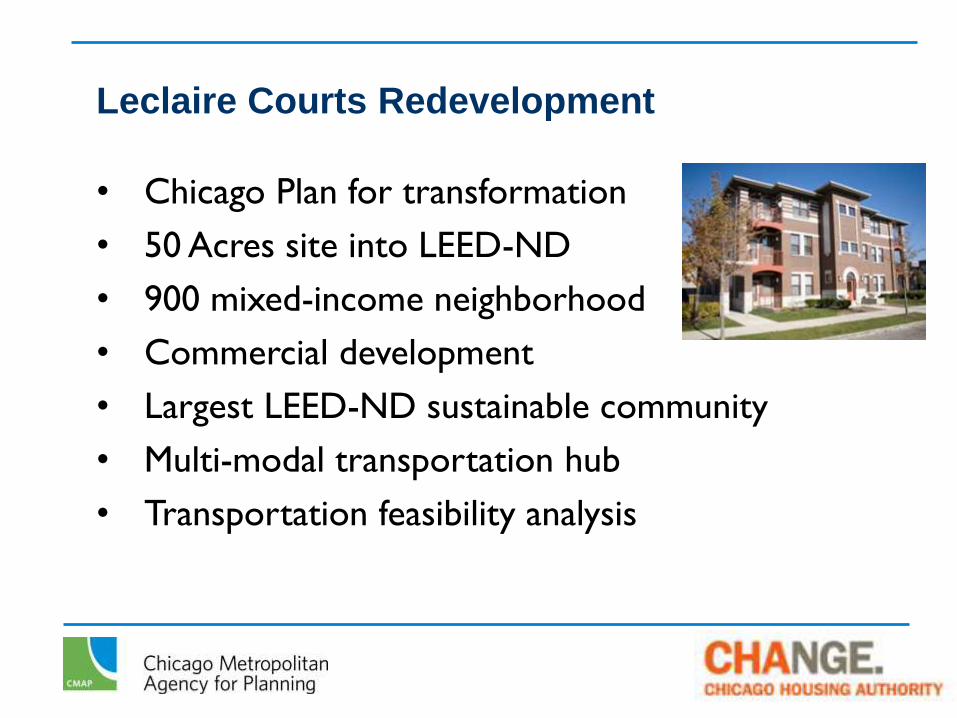
Leclaire Courts Redevelopment
• Chicago Plan for transformation
• 50 Acres site into LEED-ND
• 900 mixed-income neighborhood
• Commercial development
• Largest LEED-ND sustainable community
• Multi-modal transportation hub
• Transportation feasibility analysis