commercial real estate as an asset class
TRANSCRIPT

WELCOME TO “A BRIEF INTRODUCTION TO COMMERCIAL REAL ESTATE AS AN ASSET CLASS”
Press F5

Assets
RetailOfficeIndustrialLeisure
ResidentialHeath and education
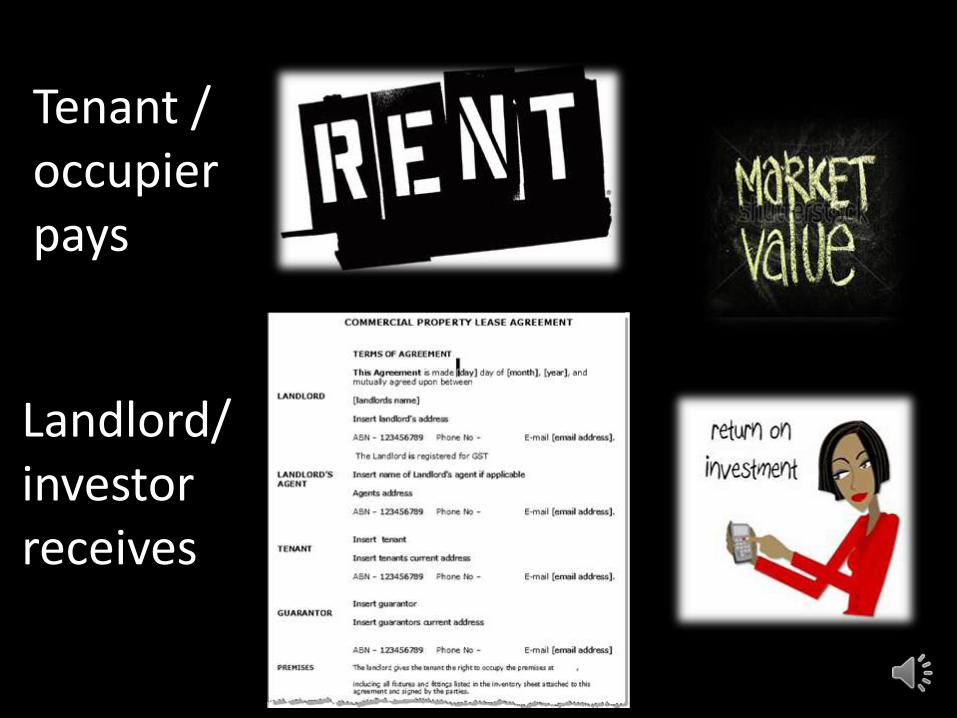
Tenant / occupierpays
Landlord/ investorreceives
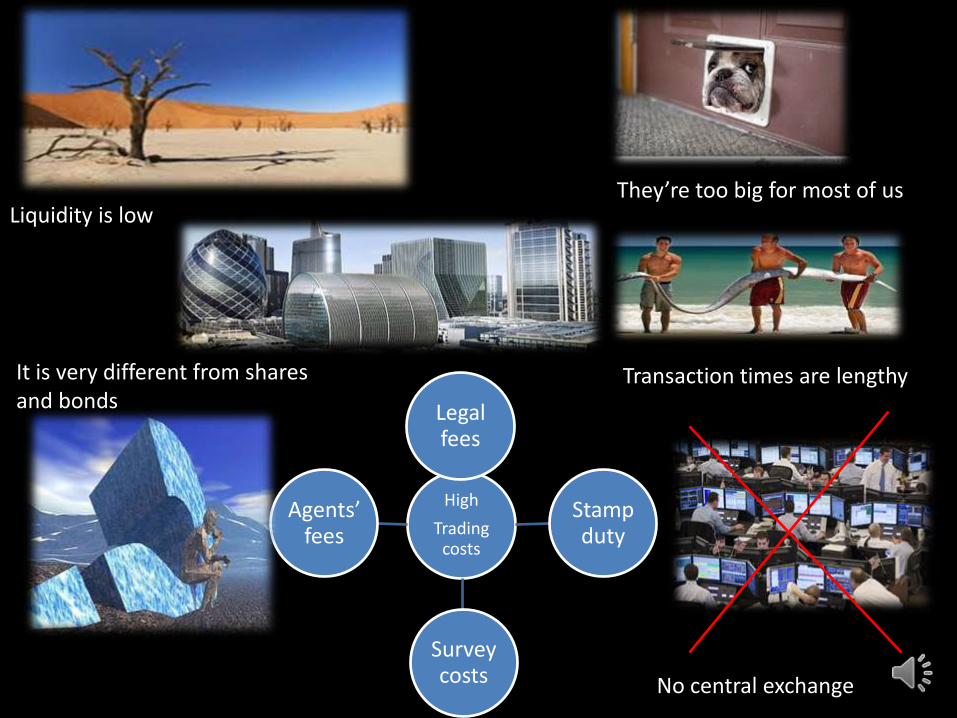
High
Trading costs
Legal fees
Stamp duty
Survey costs
Agents’ fees
Transaction times are lengthy
No central exchange
They’re too big for most of usLiquidity is low
It is very different from shares and bonds
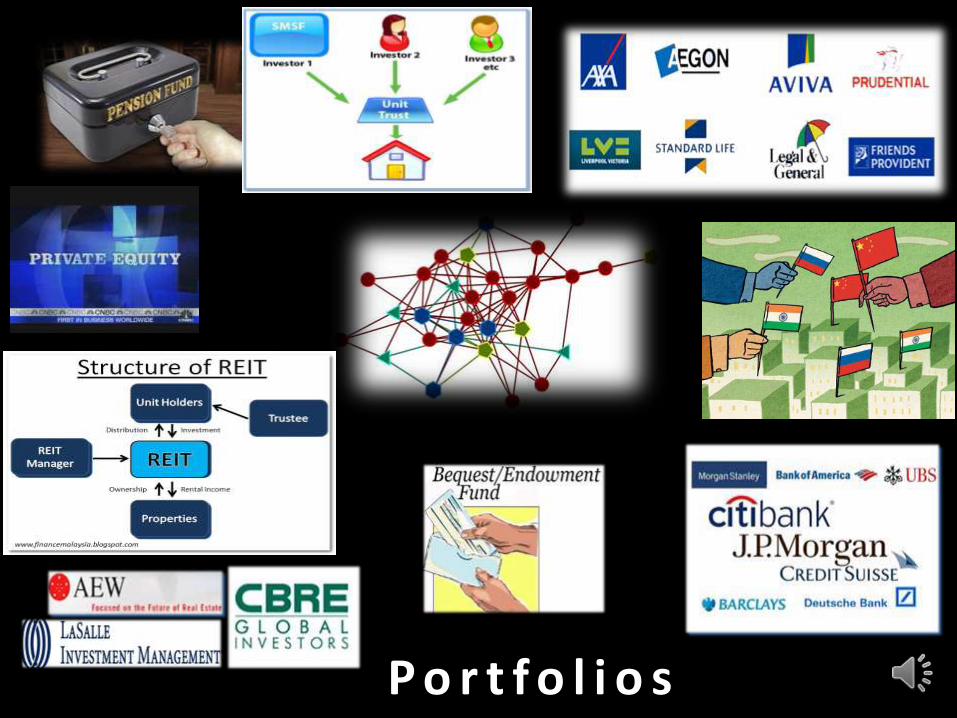
P o r t f o l i o s
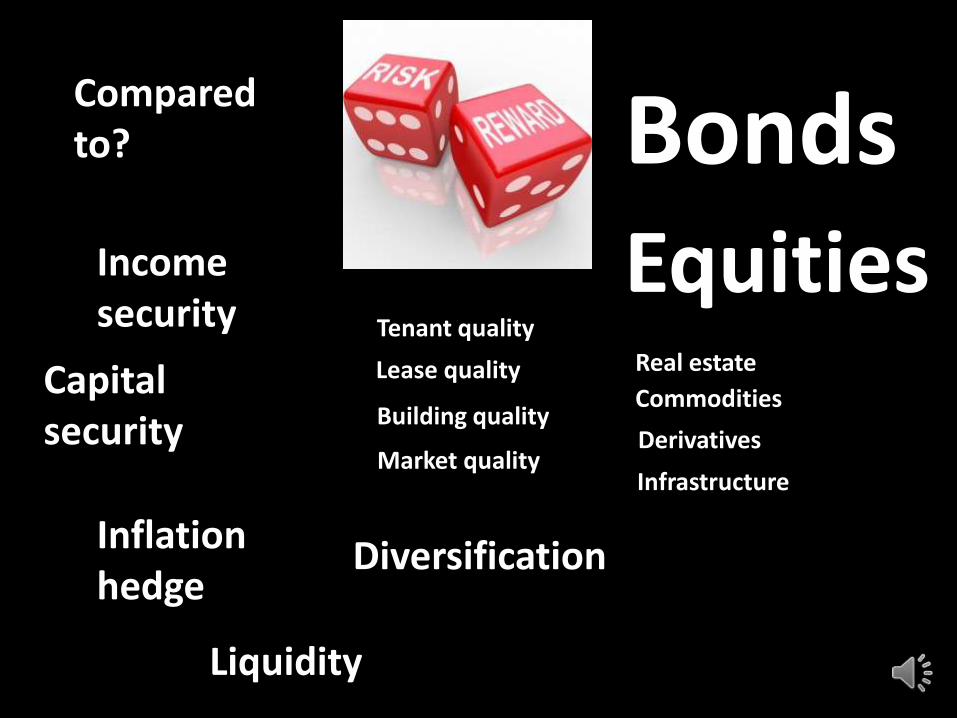
Income security
Capital security
Tenant quality
Lease quality
Building quality
Market quality
Inflation hedge
Compared to? Bonds
EquitiesReal estate
Commodities
Derivatives
Infrastructure
Diversification
Liquidity
-7.00%
-6.00%
-5.00%
-4.00%
-3.00%
-2.00%
-1.00%
0.00%
1.00%
2.00%
3.00%
4.00%
Jan
19
87
Jul 1
98
7
Jan
19
88
Jul 1
98
8
Jan
19
89
Jul 1
98
9
Jan
19
90
Jul 1
99
0
Jan
19
91
Jul 1
99
1
Jan
19
92
Jul 1
99
2
Jan
19
93
Jul 1
99
3
Jan
19
94
Jul 1
99
4
Jan
19
95
Jul 1
99
5
Jan
19
96
Jul 1
99
6
Jan
19
97
Jul 1
99
7
Jan
19
98
Jul 1
99
8
Jan
19
99
Jul 1
99
9
Jan
20
00
Jul 2
00
0
Jan
20
01
Jul 2
00
1
Jan
20
02
Jul 2
00
2
Jan
20
03
Jul 2
00
3
Jan
20
04
Jul 2
00
4
Jan
20
05
Jul 2
00
5
Jan
20
06
Jul 2
00
6
Jan
20
07
Jul 2
00
7
Jan
20
08
Jul 2
00
8
Jan
20
09
Jul 2
00
9
Jan
20
10
Jul 2
01
0
Jan
20
11
Jul 2
01
1
Bust
Bust
Bust
RecoveryBoom
Recovery Boom
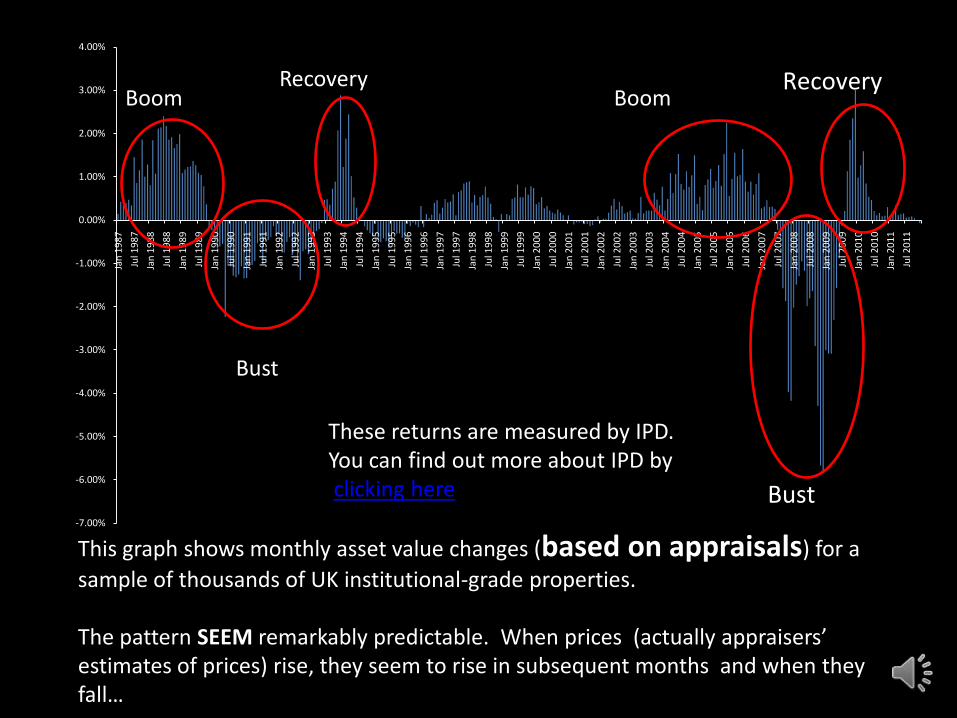
This graph shows monthly asset value changes (based on appraisals) for a
sample of thousands of UK institutional-grade properties.
The pattern SEEM remarkably predictable. When prices (actually appraisers’ estimates of prices) rise, they seem to rise in subsequent months and when they fall…
These returns are measured by IPD. You can find out more about IPD byclicking here

-30.00%
-25.00%
-20.00%
-15.00%
-10.00%
-5.00%
0.00%
5.00%
10.00%
15.00%
20.00%
Jan
19
87
Au
g 1
98
7
Mar
19
88
Oct
19
88
May
19
89
Dec
19
89
Jul 1
99
0
Feb
19
91
Sep
19
91
Ap
r 1
99
2
No
v 1
99
2
Jun
19
93
Jan
19
94
Au
g 1
99
4
Mar
19
95
Oct
19
95
May
19
96
Dec
19
96
Jul 1
99
7
Feb
19
98
Sep
19
98
Ap
r 1
99
9
No
v 1
99
9
Jun
20
00
Jan
20
01
Au
g 2
00
1
Mar
20
02
Oct
20
02
May
20
03
Dec
20
03
Jul 2
00
4
Feb
20
05
Sep
20
05
Ap
r 2
00
6
No
v 2
00
6
Jun
20
07
Jan
20
08
Au
g 2
00
8
Mar
20
09
Oct
20
09
May
20
10
Dec
20
10
Jul 2
01
1
This graph shows monthly (actual) price changes for FT All Share index over the same period.
The contrast with the pattern of value changes in the IPD Property Index is remarkable. It seems pretty difficult to guess whether prices will rise or fall month-
to-month. Patterns of share and bond price changes seem to be fairly random.

100.0
200.0
300.0
400.0
500.0
600.0
700.0
800.0
900.0
1000.0D
ec 1
98
6
Au
g 1
98
7
Ap
r 1
98
8
Dec
19
88
Au
g 1
98
9
Ap
r 1
99
0
Dec
19
90
Au
g 1
99
1
Ap
r 1
99
2
Dec
19
92
Au
g 1
99
3
Ap
r 1
99
4
Dec
19
94
Au
g 1
99
5
Ap
r 1
99
6
Dec
19
96
Au
g 1
99
7
Ap
r 1
99
8
Dec
19
98
Au
g 1
99
9
Ap
r 2
00
0
Dec
20
00
Au
g 2
00
1
Ap
r 2
00
2
Dec
20
02
Au
g 2
00
3
Ap
r 2
00
4
Dec
20
04
Au
g 2
00
5
Ap
r 2
00
6
Dec
20
06
Au
g 2
00
7
Ap
r 2
00
8
Dec
20
08
Au
g 2
00
9
Ap
r 2
01
0
Dec
20
10
Au
g 2
01
1
IPD Monthly
FT Real Estate Equities
Equities - All Share
Gilts - 5 to 15 yrs
This is a total return index for the UK major asset classes as
well as real estate. It includes shares and bonds.
Over the 25 years period, direct real estate has delivered a similar total return to shares and bonds.

0.0
50.0
100.0
150.0
200.0
250.0
300.0
350.0
400.0
450.0
500.0
Dec
19
86
Au
g 1
98
7
Ap
r 1
98
8
Dec
19
88
Au
g 1
98
9
Ap
r 1
99
0
Dec
19
90
Au
g 1
99
1
Ap
r 1
99
2
Dec
19
92
Au
g 1
99
3
Ap
r 1
99
4
Dec
19
94
Au
g 1
99
5
Ap
r 1
99
6
Dec
19
96
Au
g 1
99
7
Ap
r 1
99
8
Dec
19
98
Au
g 1
99
9
Ap
r 2
00
0
Dec
20
00
Au
g 2
00
1
Ap
r 2
00
2
Dec
20
02
Au
g 2
00
3
Ap
r 2
00
4
Dec
20
04
Au
g 2
00
5
Ap
r 2
00
6
Dec
20
06
Au
g 2
00
7
Ap
r 2
00
8
Dec
20
08
Au
g 2
00
9
Ap
r 2
01
0
Dec
20
10
Au
g 2
01
1
IPD Monthly
FT Real Estate Equities
Equities - All Share
Gilts - 5 to 15 yrs
This is a capital return index for the UK major asset classes as
well as real estate. It includes shares and bonds.
Over the 25 years period, direct real estate has delivered a low capital return compared to shares. It is the income return (rent)
that has been the main driver of its performance.
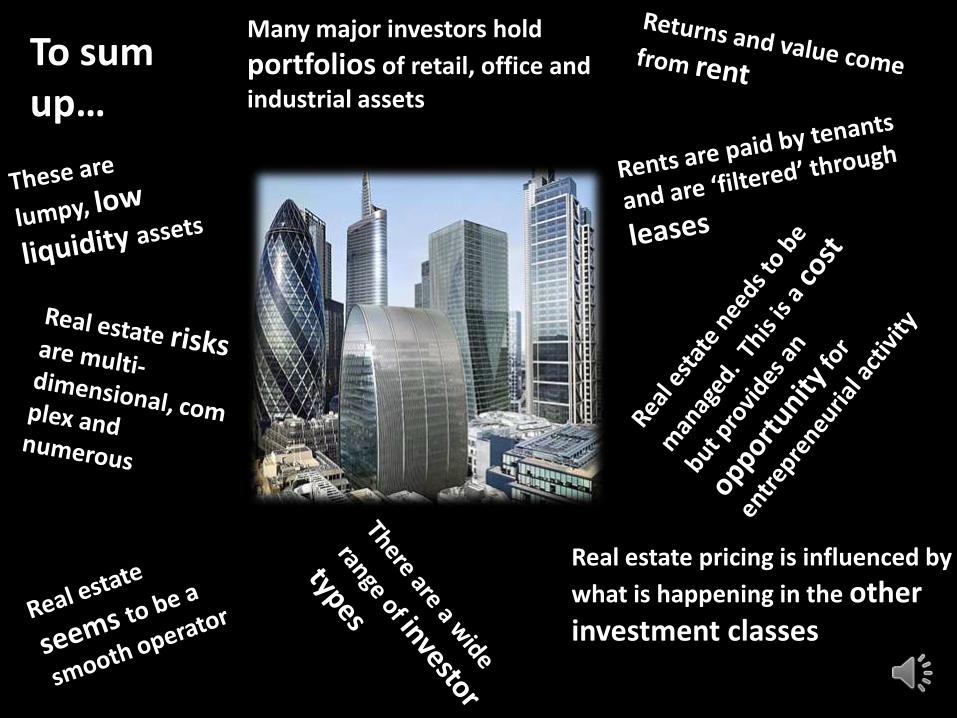
Many major investors hold
portfolios of retail, office and
industrial assets
To sum up…
Real estate pricing is influenced by
what is happening in the other investment classes
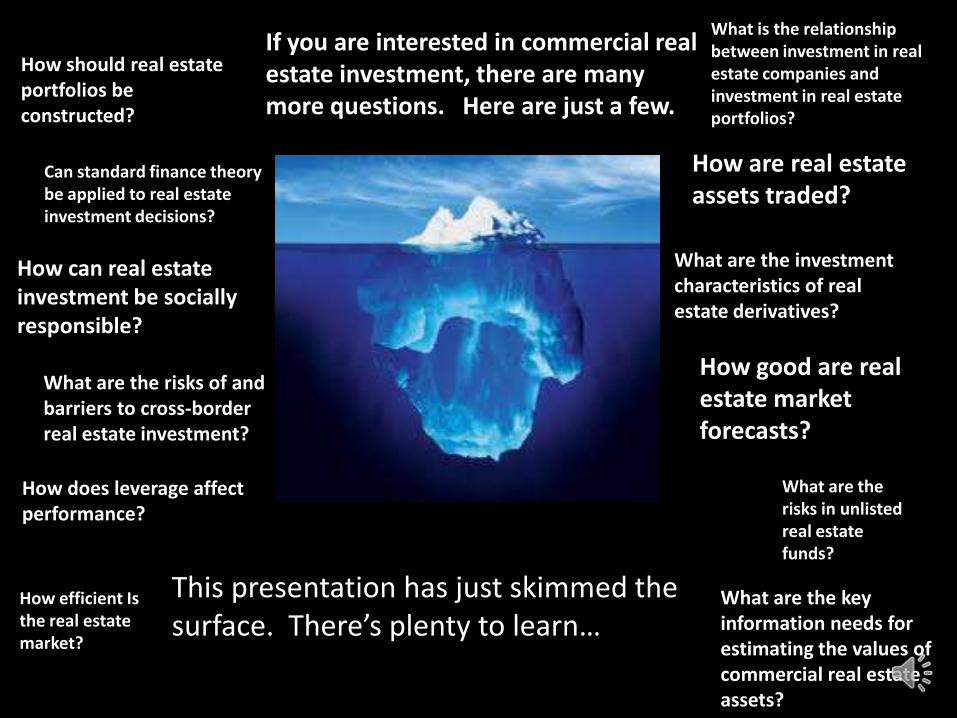
This presentation has just skimmed the surface. There’s plenty to learn…
How should real estate portfolios be constructed?
Can standard finance theory be applied to real estate investment decisions?
If you are interested in commercial real estate investment, there are many more questions. Here are just a few.
How can real estate investment be socially responsible?
What is the relationship between investment in real estate companies and investment in real estate portfolios?
How are real estate assets traded?
What are the investment characteristics of real estate derivatives?
How good are real estate market forecasts?
What are the risks of and barriers to cross-border real estate investment?
What are the key information needs for estimating the values of commercial real estate assets?
How does leverage affect performance?
How efficient Is the real estate market?
What are the risks in unlisted real estate funds?

For a quick quiz on this stuff Click here
For the answers Click Here