commercial aviation – market outlookmromarketing.aviationweek.com/downloads/mas2017/... ·...
TRANSCRIPT

TRUSTWORTHY.
FOCUSED. DIVERSIFIED. COMPETENT.
Commercial Aviation – Market Outlook Bert van Leeuwen – Head of Aviation Research DVB Bank
Singapore, November 2017
Disclaimer
This presentation was prepared by DVB Bank SE (“DVB”) exclusively for the benefit and internal use of the addressee mentioned on the cover page. Neither this presentation nor any of its contents may be used by any other party or for any other purpose without the prior written consent of DVB. The oral commentary from DVB accompanying this presentation is an integral part of the presentation and the presentation is not complete without such commentary. This material is for distribution only under such circumstances as may be permitted by applicable law. It has no regard to the specific investment objectives, financial situation or particular needs of any recipient. It is published solely for informational purposes and is not to be construed as a solicitation or an offer to buy or sell any securities or related financial instruments. The contents of this presentation should not be treated as advice relating to legal, tax or investment matters. No representation or warranty, either express or implied, is provided in relation to the accuracy, completeness or reliability of the information contained herein, nor is it intended to be a complete statement or summary of the securities, markets or developments referred to in the presentation. Any opinions expressed in this presentation are subject to change without notice and DVB is not under any obligation to update or keep current the information contained herein or communicate any updates to the addressee mentioned on the cover page. In particular, the information in this presentation reflects prevailing conditions and our views as of this date, all of which are subject to change. In preparing this presentation, we have relied upon and assumed, without independent verification, the accuracy and completeness of information available to us from public sources. Furthermore, neither DVB nor any of its affiliates, directors, employees or agents accept any liability for any loss or damage arising out of the use of all or any part of this presentation. In the UK, DVB is regulated in the conduct of its investment business by the Financial Conduct Authority. In the United States of America, DVB acts through DVB Capital Markets LLC, which is a broker dealer registered with the U.S. Securities and Exchange Commission and admitted by the Financial Industry Regulatory Authority to conduct securities business in the U.S. Forward looking statements: Statements made in this presentation, other than statements of historical fact, are forward-looking statements that involve risks and uncertainties. These statements relate to future aircraft deliveries, growths of the air transportation market and the aircraft leasing market. In some cases, forward-looking statements can be identified by terminology such as “may”, “will”, “should”, “expect”, “anticipate”, “intend”, “plan”, “believe”, “estimate”, “potential”, “continue”, “outlook”, “could”, “target”, “project”, “seek”, “may”, “assume”, the negative of these terms or other comparable terminology. Actual results, and actual events that occur, may differ materially from those projected in any forward-looking statement as a result of certain risks and uncertainties. You are cautioned not to place undue reliance on forward-looking statements, which speak only as of the date of this presentation and are based on information currently and reasonably known to us. Except as required by law, we undertake no obligation to update or revise any forward-looking statements, whether as a result of new information, future events or otherwise.

IATA passenger market – Trend
% %
Source: IATA
14.9
8.9 6.9 8.0
2.4
-1.2
8.0 6.3 5.3 5.7 6.0 6.5 6.3
2.8 1.0
6.6
1.7
8.3
-13.7
9.5
7.5
-1.4 -3.9
-2.5
-11.7 -8.8
73.5
74.9
76.0 77.0 76.0
76.1
78.6
78.4 79.3
79.7 79.8 80.5 80.5
70
72
74
76
78
80
82
-20
-15
-10
-5
0
5
10
15
20
2004 2005 2006 2007 2008 2009 2010 2011 2012 2013 2014 2015 2016
RPK growth Pax. yield PLF
Page 3

IATA passenger market - Recent data
% %
Source: IATA
Page 4
6.3%
3.8%
7.9%
10.5%
-6.0%
-1.0%
4.0%
9.0%
14.0%
Recent Monthly Traffic DevelopmentsSource: IATA Air Passenger and Freight Analysis
Revenue Passenger Km. Freight Tonne Km.

Worldwide airline profitability
US$ bn
Source: IATA "Economic Performance of the Airline Industry" (June 2017)
-5.6 -4.1
5.0
14.7
-26.1
-4.6
17.3
8.3 9.2 10.7 13.7
35.9 34.8 31.4
-35
-25
-15
-5
5
15
25
35
45
2004 2005 2006 2007 2008 2009 2010 2011 2012 2013 2014 2015 2016E 2017F
Page 5
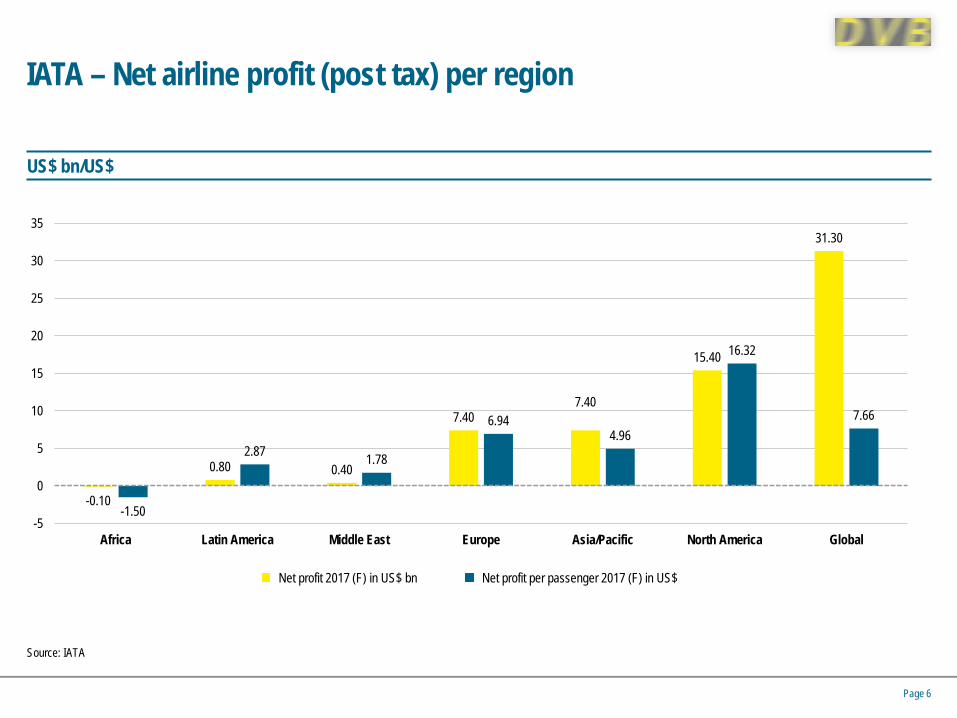
IATA – Net airline profit (post tax) per region
-0.10
0.80 0.40
7.40 7.40
15.40
31.30
-1.50
2.87 1.78
6.94 4.96
16.32
7.66
-5
0
5
10
15
20
25
30
35
Africa Latin America Middle East Europe Asia/Pacific North America Global
US$ bn/US$
Source: IATA
Net profit 2017 (F) in US$ bn Net profit per passenger 2017 (F) in US$
Page 6
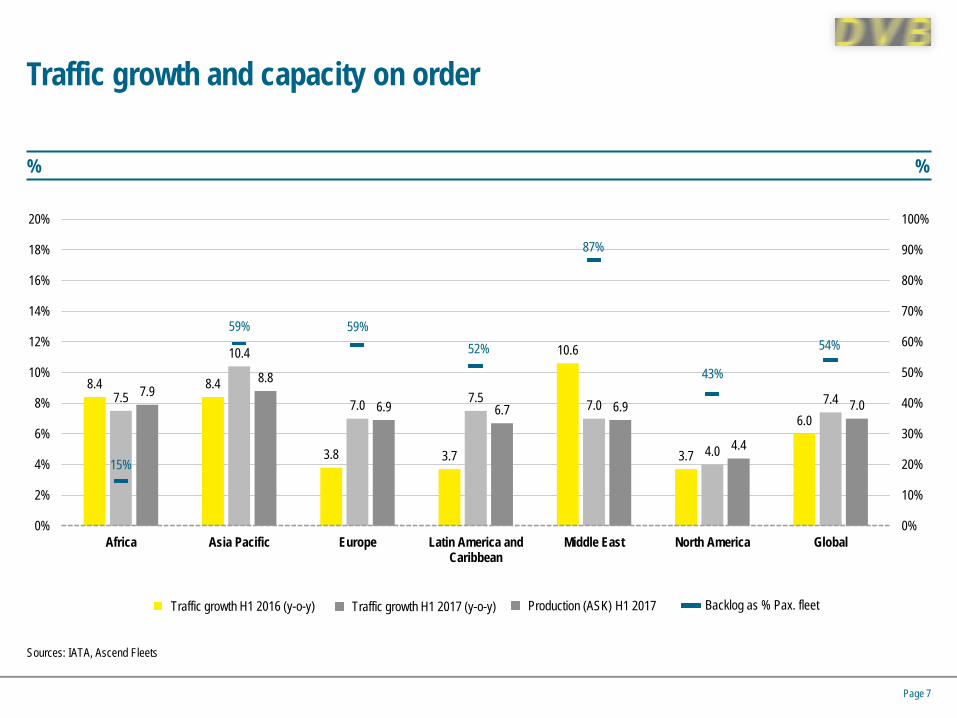
Traffic growth and capacity on order
% %
Sources: IATA, Ascend Fleets
8.4 8.4
3.8 3.7
10.6
3.7
6.0 7.5
10.4
7.0 7.5 7.0
4.0
7.4 7.9 8.8
6.9 6.7 6.9
4.4
7.0
15%
59% 59% 52%
87%
43%
54%
0%
10%
20%
30%
40%
50%
60%
70%
80%
90%
100%
0%
2%
4%
6%
8%
10%
12%
14%
16%
18%
20%
Africa Asia Pacific Europe Latin America andCaribbean
Middle East North America Global
Traffic growth H1 2016 (y-o-y) Production (ASK) H1 2017 Backlog as % Pax. fleet Traffic growth H1 2017 (y-o-y)
Page 7
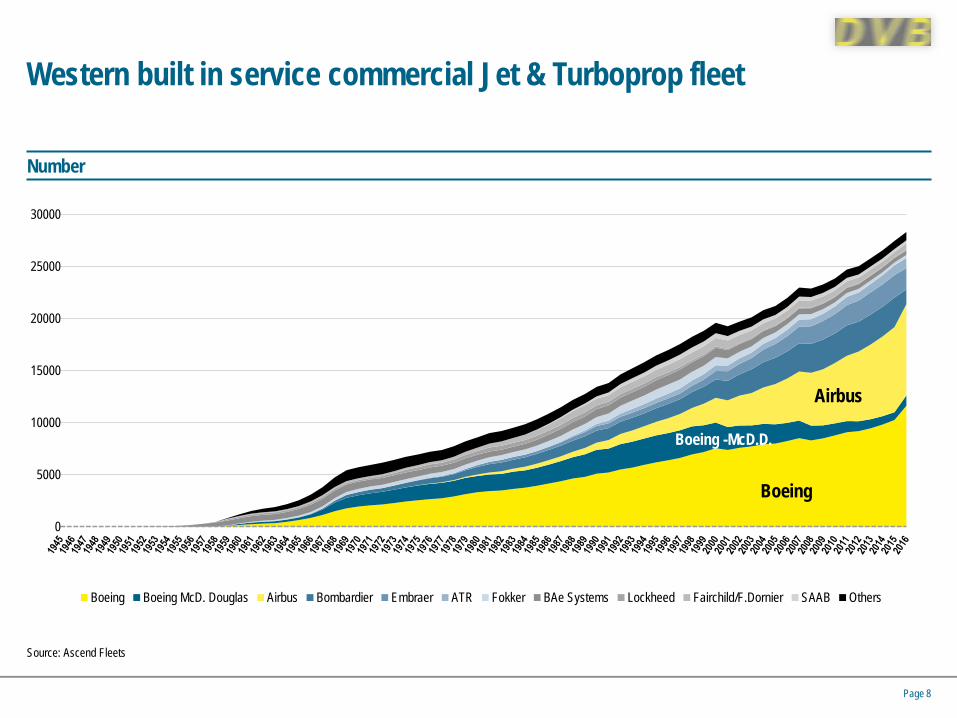
Western built in service commercial Jet & Turboprop fleet Number
0
5000
10000
15000
20000
25000
30000
Boeing Boeing McD. Douglas Airbus Bombardier Embraer ATR Fokker BAe Systems Lockheed Fairchild/F.Dornier SAAB Others
Boeing
Boeing -McD.D.
Airbus
Source: Ascend Fleets
Page 8

Order volume commercial jets Western built jets, all civil operators, including type swaps) Number
Sources: Flighglobal, Ascend Fleets
Page 9
1643 1268
367
900
1567 1334
2458
2321
1568 1258 976
2406
1416
652
1331
2548
2305
3485 3505
2350
2108
1500 (extrapol.)
0
500
1000
1500
2000
2500
3000
3500
4000
2007 2008 2009 2010 2011 2012 2013 2014 2015 2016 2017ORDERS 1/1-1/10 …. ORDERS 1/1-31/12 ….
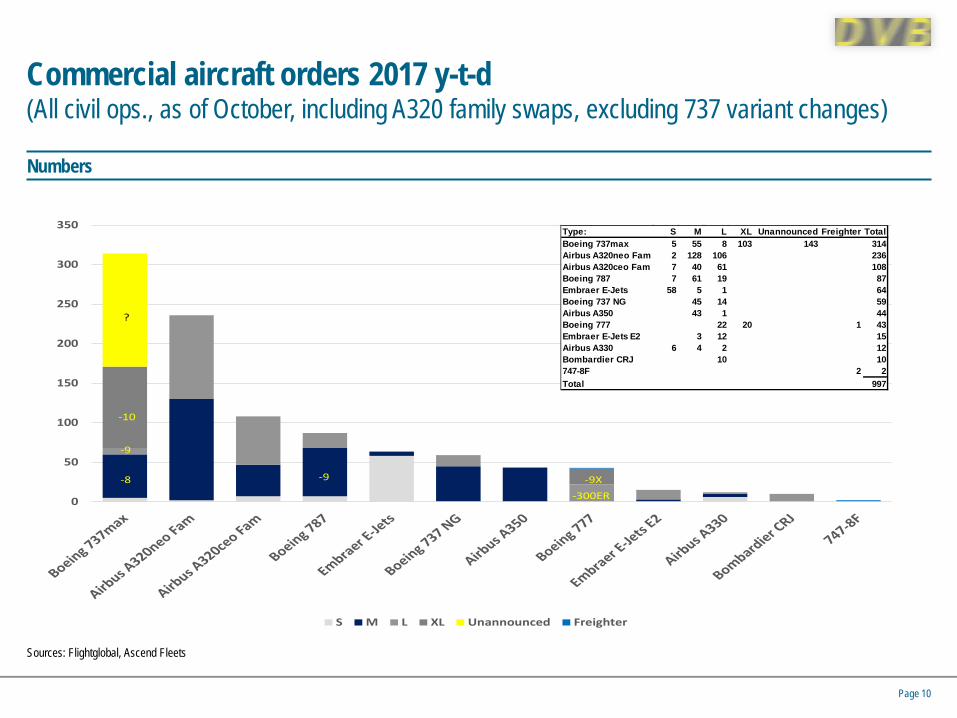
Commercial aircraft orders 2017 y-t-d (All civil ops., as of October, including A320 family swaps, excluding 737 variant changes)
Numbers
Sources: Flightglobal, Ascend Fleets
Page 10
0
50
100
150
200
250
300
350
S M L XL Unannounced Freighter
-9X-300ER
-10
-9
-8 -9
- ?
Type: S M L XL Unannounced Freighter TotalBoeing 737max 5 55 8 103 143 314Airbus A320neo Fam 2 128 106 236Airbus A320ceo Fam 7 40 61 108Boeing 787 7 61 19 87Embraer E-Jets 58 5 1 64Boeing 737 NG 45 14 59Airbus A350 43 1 44Boeing 777 22 20 1 43Embraer E-Jets E2 3 12 15Airbus A330 6 4 2 12Bombardier CRJ 10 10747-8F 2 2Total 997

Commercial jets – Backlog Mid October 2017 (western built, all civil operators)
Sources: Flightglobal, Ascend Fleets
Page 11
67 140
1000
2000
3000
4000
5000
6000
S M L XL F ?
13
Type/VersionA319 A320 A321 A321LR Total
A320neo 25 3512 1396 72 5005MAX 7 MAX 8 MAX9 MAX 10 Unann.
737max 66 2273 122 317 1096 3874XWB -800 XWB -900XWB -1000
A350 8 565 169 742787-8 787-9 787-10
787 78 432 168 678-700 -800 -900ER
737ng 3 465 71 539A319 A320 A321
A320ceo 51 220 230 501CS100 CS300
Cseries 110 231 341 -8X -9X Unann.
777 X 53 263 10 326E175 E190 E195
E-Jets E2 100 86 102 288MRJ90
MRJ 233 233-8 -9
A330neo 6 206 212E170 E175 E190 E195
E-Jets 1 92 57 7 157A380-800
A380 101 101 -300ER -200LRF
777 Current 69 30 99-200 -300 -200F
A330ceo 23 69 4 96 -300ERF
767 67 67CRJ700 CRJ900 CRJ1000
CRJ 10 22 13 45 -8F
747-8 14 14ERJ135
ERJ 13 13

2017 : Equipment highlights & concerns by type • A320 family selling well and gaining market share vs. 737MAX. A319 marginalized (replaced now by CSeries) and A321 taking
increasing share of orders. Significant number of A320CEO cancellations/type swaps.
• 737MAX selling well but falling behind A320 family. Issue seems the -9. Is the -10 a real solution against the A321NEO ? Will this simple stretch be enough ? Boeing not publishing order split not helpful for confidence in MAX 9 and 10. 737MAX 7+ still at risk of being marginalized.
• E-Jets E2 still outsold by the E1, in particular by the 175-E1. Concerns about 175-E2 not meeting MTOW limits under US Scope Clauses. E175-E1 the “fall-back” that MRJ may be missing, facing similar issues.
• 787 and A350 selling well by Twin Aisle standards with focus on 787-9 and A350-900. A350-800 “exit” and 787-8 heading in same direction. 787-10 and A350-1000 not yet too convincing. Will a A350-”2000” be convincing as Airbus’ largest twin aisle (apart from the struggling A380) ?
• A330CEO still doing well after having been given more range. -300 still a credible aircraft. A330-800 seems to follow the A350-800 “out”, -900 not a very convincing order-book yet.
• SQ order for 777X a positive sign. 777-300ER had to face the inevitable production cut (Iran ?). 777F the leading long haul plane in the niche long haul freighter market.
• CSeries had good 2016 but weak 2017 YtD. Boeing driving them into the arms of Airbus gift from heaven for the program.
• Will the MRJ be inspired by the recovery of the CSeries ? Advanced plane but needs some credible orders.
• 747-8F got some crucial orders. -8I nearing the end. A380 further in the danger-zone.
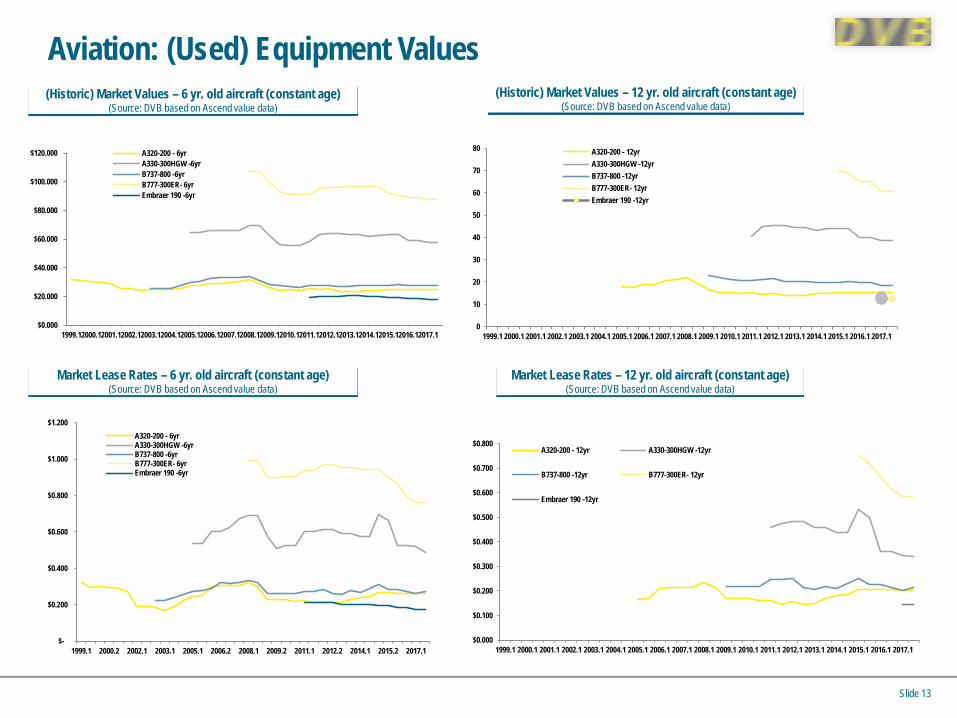
Aviation: (Used) Equipment Values
Slide 13
$-
$0.200
$0.400
$0.600
$0.800
$1.000
$1.200
1999.1 2000.2 2002.1 2003.1 2005.1 2006.2 2008.1 2009.2 2011.1 2012.2 2014.1 2015.2 2017.1
A320-200 - 6yrA330-300HGW -6yrB737-800 -6yrB777-300ER- 6yrEmbraer 190 -6yr
(Historic) Market Values – 6 yr. old aircraft (constant age) (Source: DVB based on Ascend value data)
Market Lease Rates – 6 yr. old aircraft (constant age) (Source: DVB based on Ascend value data)
Market Lease Rates – 12 yr. old aircraft (constant age) (Source: DVB based on Ascend value data)
$0.000
$0.100
$0.200
$0.300
$0.400
$0.500
$0.600
$0.700
$0.800
1999.1 2000.1 2001.1 2002.1 2003.1 2004.1 2005.1 2006.1 2007.1 2008.1 2009.1 2010.1 2011.1 2012.1 2013.1 2014.1 2015.1 2016.1 2017.1
A320-200 - 12yr A330-300HGW -12yr
B737-800 -12yr B777-300ER- 12yr
Embraer 190 -12yr
$0.000
$20.000
$40.000
$60.000
$80.000
$100.000
$120.000
1999.12000.12001.12002.12003.12004.12005.12006.12007.12008.12009.12010.12011.12012.12013.12014.12015.12016.12017.1
A320-200 - 6yrA330-300HGW -6yrB737-800 -6yrB777-300ER- 6yrEmbraer 190 -6yr
(Historic) Market Values – 12 yr. old aircraft (constant age) (Source: DVB based on Ascend value data)
0
10
20
30
40
50
60
70
80
1999.1 2000.1 2001.1 2002.1 2003.1 2004.1 2005.1 2006.1 2007.1 2008.1 2009.1 2010.1 2011.1 2012.1 2013.1 2014.1 2015.1 2016.1 2017.1
A320-200 - 12yrA330-300HGW -12yrB737-800 -12yrB777-300ER- 12yrEmbraer 190 -12yr
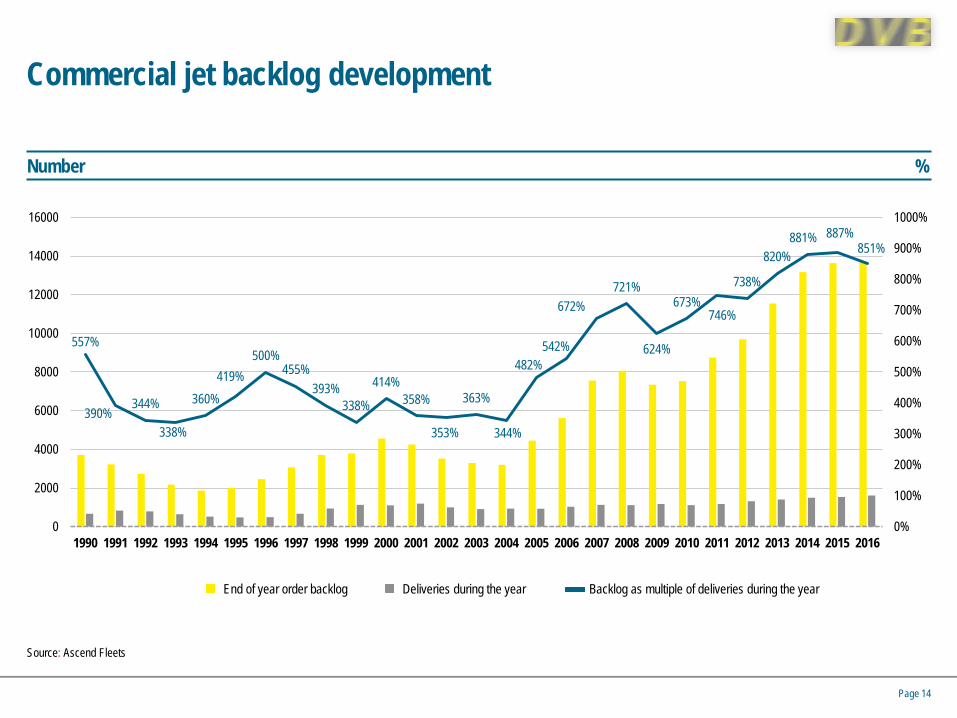
Commercial jet backlog development
Number %
Source: Ascend Fleets
557%
390% 344%
338%
360% 419%
500% 455%
393% 338%
414% 358%
353%
363%
344%
482% 542%
672% 721%
624%
673% 746%
738%
820% 881% 887%
851%
0%
100%
200%
300%
400%
500%
600%
700%
800%
900%
1000%
0
2000
4000
6000
8000
10000
12000
14000
16000
1990 1991 1992 1993 1994 1995 1996 1997 1998 1999 2000 2001 2002 2003 2004 2005 2006 2007 2008 2009 2010 2011 2012 2013 2014 2015 2016
End of year order backlog Deliveries during the year Backlog as multiple of deliveries during the year
Page 14

Annual deliveries – Western built commercial jets all civil operators Number
Source: Ascend Fleets
Page 15
0
200
400
600
800
1000
1200
1400
1600
1800
2000 2001 2002 2003 2004 2005 2006 2007 2008 2009 2010 2011 2012 2013 2014 2015 2016 20151/1 -
16/10
20161/1 -
16/10
20171/1 -
16/10
PassengerFreight / Cargo / Combi / ConvertibleOthersAll
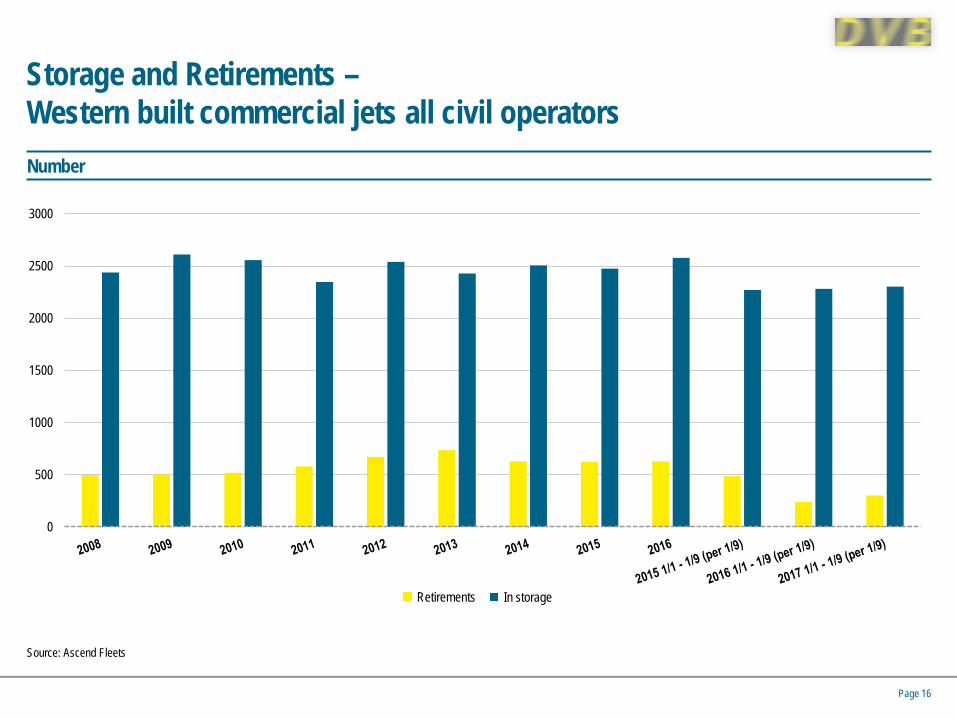
Storage and Retirements – Western built commercial jets all civil operators Number
Source: Ascend Fleets
0
500
1000
1500
2000
2500
3000
In storage Retirements
Page 16

Financing forecast for global commercial airplane deliveries in 2017
US$ bn
Source: Boeing Capital Corp.
0
20
40
60
80
100
120
140
160
180
200
2016 2017F 2018 2019 2020 2021
122 127 141
163 175
185
Capital markets Export credit Manufacturer Total Bank debt Cash
Page 17

Copyright © 2015 Boeing. All rights reserved.
2009 2010 2011 2012 2013 2014 2015 2016
Leasing companies
2017F
Capital markets
Commercial banks
Export credit agencies
Private equity and hedge funds
Tax equity
New sources of funding
Aircraft and engine manufacturers
Satisfactory Cautionary Major concern
Page 18
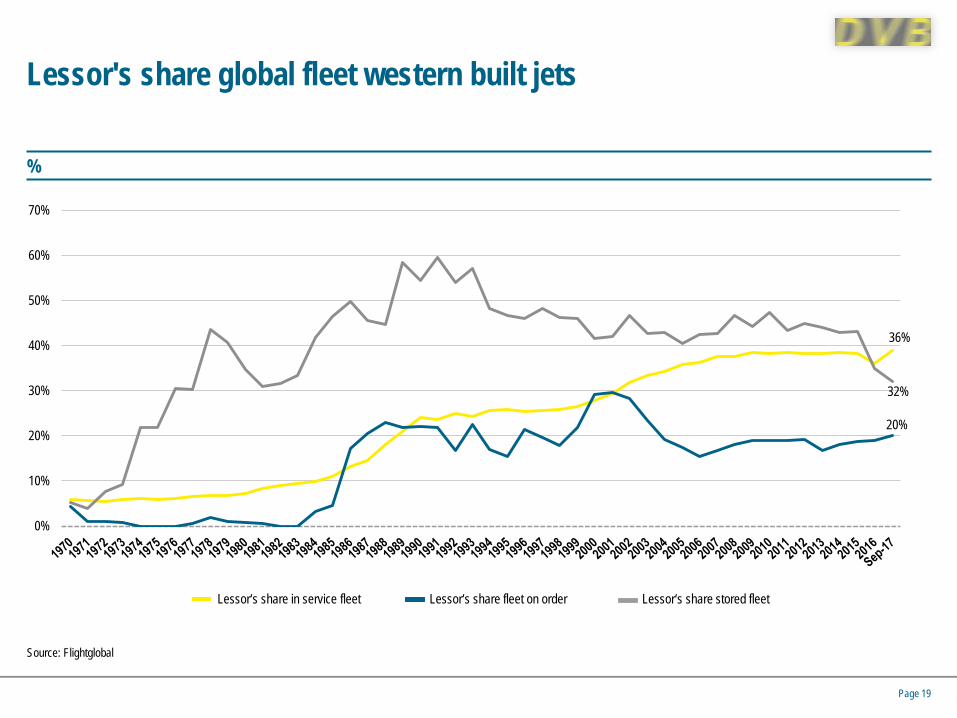
Lessor's share global fleet western built jets
%
Source: Flightglobal
36%
20%
32%
0%
10%
20%
30%
40%
50%
60%
70%
Lessor‘s share fleet on order Lessor‘s share stored fleet Lessor‘s share in service fleet
Page 19

Lessor's share global fleet western built jets Lessor/manager In service Stored On order Grand total
1 GECAS 1,170 156 390 1,716 2 AerCap 1,086 36 407 1,529 3 Avolon 568 21 254 843 4 Air Lease Corporation 284 3 374 661 5 SMBC Aviation Capital 436 5 203 644 6 BOC Aviation 299 0 178 477 7 Aviation Capital Group 260 1 150 411 8 BBAM LLC 406 1 0 407 9 ICBC Leasing Co 325 2 65 392
10 DAE Capital 294 7 14 315 11 Macquarie AirFinance 203 2 40 245 12 Aircastle Limited 202 3 25 230 13 CDB Aviation Lease Finance 178 4 45 227 14 China Aircraft Leasing Limited 93 0 133 226 15 ORIX Aviation 205 1 0 206 16 Boeing Capital Corp 176 21 0 197 17 ALAFCO 63 2 122 187 18 Nordic Aviation Capital 139 25 18 182 19 BoCom Leasing 146 0 1 147 20 Standard Chartered Aviation Finance 126 4 7 137 21 Apollo Aviation Group 135 1 0 136 22 Castlelake 123 6 0 129 23 Jackson Square Aviation 112 2 0 114 24 VEB-Leasing JSC 25 21 42 88 25 Avmax Aircraft Leasing Inc 41 46 0 87
Total fleet size sll lessors 9,453 729 2,647 12,829
Page 20

Global aircraft bank debt markets for airplane deliveries (2017 forecast)
12% Other 31% China
12% Germany 15% Japan
8% France
5% USA
6% Middle East
7% Australia
Source: Boeing Capital Corp.
Page 21
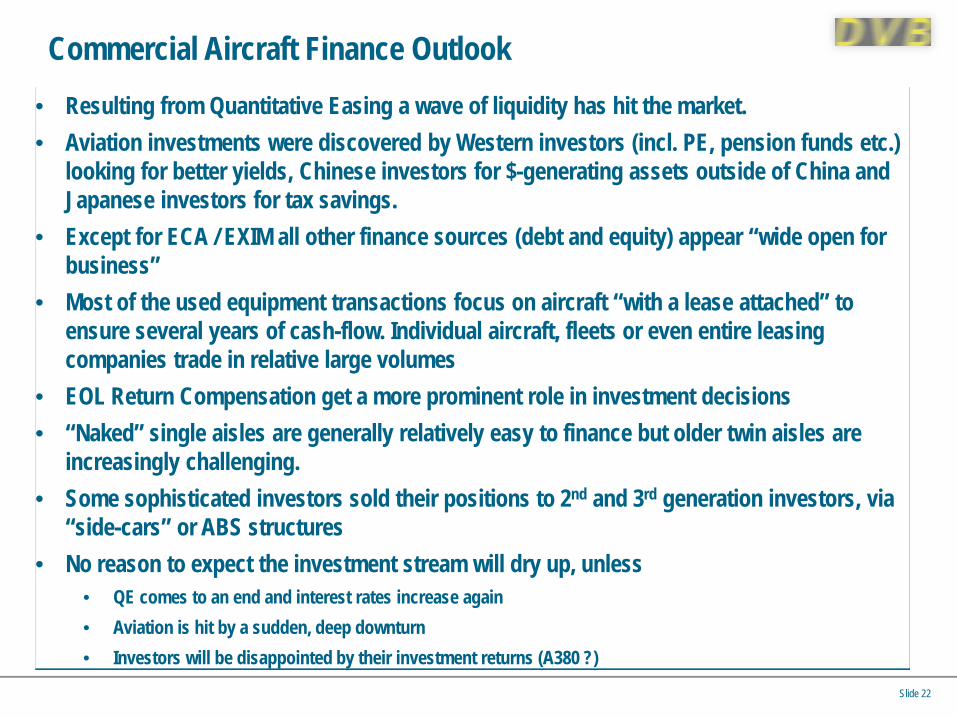
Commercial Aircraft Finance Outlook
Slide 22
• Resulting from Quantitative Easing a wave of liquidity has hit the market. • Aviation investments were discovered by Western investors (incl. PE, pension funds etc.)
looking for better yields, Chinese investors for $-generating assets outside of China and Japanese investors for tax savings.
• Except for ECA / EXIM all other finance sources (debt and equity) appear “wide open for business”
• Most of the used equipment transactions focus on aircraft “with a lease attached” to ensure several years of cash-flow. Individual aircraft, fleets or even entire leasing companies trade in relative large volumes
• EOL Return Compensation get a more prominent role in investment decisions • “Naked” single aisles are generally relatively easy to finance but older twin aisles are
increasingly challenging. • Some sophisticated investors sold their positions to 2nd and 3rd generation investors, via
“side-cars” or ABS structures • No reason to expect the investment stream will dry up, unless
• QE comes to an end and interest rates increase again • Aviation is hit by a sudden, deep downturn • Investors will be disappointed by their investment returns (A380 ?)