coming to terms with geographical information systems to term… · coming to terms with...
TRANSCRIPT

Coming to Terms with Geographical
Information Systems
John Markovic, Program Manager, OJJDP GIS Initiative, IACP, Alexandria, VA; James
Bueermann, Chief of Police, Redlands, CA; and Kurt Smith, Community Analysis and
Technology Director, Redlands, CA, Police Department
n increasing number of law
enforcement agencies are
relying on computerized crime
mapping, yet the prevalence of this
technology in policing is difficult to
gauge in precise terms. Wide
variations exist in the techniques that departments use, the levels of sophistication that police
managers possess, and the frequency with which agencies engage in crime mapping. Some
agencies are striving to produce simple graphic displays; others are performing complex spatial
analysis on a routine basis. In some departments, crime mapping remains the exclusive domain
of crime analysts; other departments are making interactive mapping applications available to
everyone across the command structure, including patrol officers. In some agencies, interactive
crime mapping Web sites are made available to the public. Many law enforcement executives
recognize the value of mapping but find it difficult to garner the resources for the software and
training necessary to get
started.
Starting at Square One This article starts with the
recognition that crime
mapping is evolving
rapidly and is being
implemented in diverse
ways. Although a
growing portion of the
state, county, local, and
tribal law enforcement
agencies in the United
States are doing some
form of crime mapping,
uniformity among
agencies implementing
crime mapping is not
commonplace.
Some standards about the dos and don'ts of crime mapping are emerging. But it can be difficult
to find detailed instructions for developing a crime mapping capacity or an independent
authoritative checklist of the steps an agency needs to take to get started in mapping.
Given these realities, this article provides an overview of the mapping terrain (a terrain that
changes almost daily) and seeks to achieve two objectives. The first is to provide nontechnical
law enforcement executives and managers with a basic grounding in what crime mapping
typically entails and to identify the implementation challenges they are likely to encounter. The
second objective is to present a basic conceptual overview covering key components of mapping
and some (certainly not all) trends in mapping.
How Many Agencies Are Mapping Crime? According to a survey administered in 2003 by the Bureau of Justice Statistics (BJS), in the U.S.
Department of Justice, an estimated 17.9 percent of the nearly 18,000 law enforcement agencies
in the United States reported using computers for crime mapping.1 By comparison, an estimated
14.5 percent reported doing so in the 2000 BJS survey. Not surprisingly, as revealed in Figure 1,
the percentage of agencies that self-report computer crime mapping capacity generally increases
with agency size and varies by agency type.
The Emergence and Growth of Crime Mapping: An Abbreviated History In his informative, comprehensive, and well illustrated book, Mapping Crime: Principle and
Practice, Professor Keith Harries dates the onset of standard printed crime maps to about 1830
and the first rudimentary computerized crime mapping efforts to the mid-1960s.2 Harries and
others have attributed the steady growth of and improvements in computerized crime mapping to
several factors, including the following:
Rapid improvement of desktop computer capacity and related printer and plotter
technology
Specific improvements in records management systems (RMS) used by law enforcement
agencies, including enhancements in data storage capacities, progress on justice data
standards, better quality assurance practices, and RMS features and operations that are
more user-friendly
Improvements in mapping and database software compatibility as well as increasing
integration of mapping and data management functionality
Benefits of cross-fertilization with other professionals involved in mapping, including
military analysts, geographers, urban planners, and public health scientists (particularly
epidemiologists)

A computer-literate generation coming of age and joining the ranks of law enforcement
National Trends and Converging Interests Although mapping implementations in law enforcement agencies vary widely, national efforts
have been under way for at least a decade to promote peer-to-peer information exchanges and
establish guidelines. After a planning meeting in 1996, the National Institute of Justice's (NIJ)
Crime Mapping and Research Center (CMRC) held its first annual conference in Denver in
1997. Now named the Mapping and Analysis for Public Safety (MAPS) program, conferences
are held on an 18-month cycle.
Although the MAPS conferences focus on the crime mapping concerns of law enforcement,
these multidisciplinary conferences have been remarkably broad in scope. They have brought
together law enforcement executives and managers, sworn and non sworn crime analysts,
academic researchers from the social sciences, commercial software vendors, computer
scientists, and former outsiders such as geographers and epidemiologists, whose expertise and
techniques are being adapted to address law enforcement concerns. (Both crime and disease
share some of the same spatial concepts and statistics. Both are relatively rare events that are
distributed non-randomly, often spatially clustered. In addition, the public health model is being
increasingly applied to assess problems like domestic violence and gun violence.)
MAPS conference presenters and attendees have come from
various countries, and presentation topics have ranged from
the most basic (such as fundamentals of crime mapping and
introductory training in mapping software) to the highly
sophisticated (such as applying geographic profiling
techniques to serial offenders or using spatial temporal
statistical models to predict where crimes will occur next).
Law enforcement executives or managers contemplating
whether to implement mapping can benefit substantially
from the training, presentations, and networking opportunities provided at the conference.
International representation at MAPS conferences has brought a wider diversity of perspectives
and approaches to light. Maps of carjackings plotted on a national level by federally organized
police agencies in such places as South Africa, for instance, provide a perspective quite distinct
from the highly localized mapping of UCR crime categories that predominate in the United
States. Technological capacity is more common in countries like the United States, the United
Kingdom, and Australia, but countries with police departments that cover larger geo graphic
areas can teach the West lessons about the benefits of centralizing and standardizing data.
The MAPS program, including its conference, its publications, and its Web site, has provided
needed structure, direction, and collaboration to the field during the past decade. Exchange
forums of this type are critically important given the broad and diverse activity involved in crime
mapping and considering the rapid pace at which technology is advancing.

Law enforcement must keep pace as geographical information systems (GIS) in private industry,
in the sciences, and in other government spheres are becoming more commonplace and more
sophisticated. Two popular e-mail discussion lists, one specifically focused on crime mapping
and the other focused more generally on crime analysis, have helped spur advancement by
providing a forum for advice to novices and by fostering peer-to-peer exchange among
accomplished mapping professionals from various disciplines. (These forums have occasionally
sparked heated, albeit constructive, debates.)
Technical assistance and training in crime mapping and
GIS is offered through the NIJ Office of Science and
Technology's National Law Enforcement and Corrections
Technology Center (NLECTC) under its Crime Mapping
and Analysis Program (CMAP). Training is provided free
of charge to state and local public safety agencies at
locations across the United States.
More county and municipal governments are developing
enterprise geographical information systems (GIS). Such
integrated mapping applications can serve city planners,
building inspectors, transportation and sanitation
managers, fire services, law enforcement, and residents.
Law enforcement personnel can benefit from these multi-user systems, but they must be more
than passive recipients of these technological tools. Active participation in planning and
designing these vertically integrated systems, and contributing data to them, is paramount.
Without it, multipurpose GIS cannot meet the specific mapping needs of law enforcement.
Mapping and the Changing Police Mission Mapping also holds great potential to help law
enforcement leaders as their missions become more diverse and complex. Adoption of
community policing and problem solving strategies, for instance, both present clear cases for
mapping. In promoting this position, Taxman and McEwen write, "One of the tools that has
promoted successful collaboration among the partners is geographical information, which
focuses attention on the problems and needs of [a] particular neighborhood or community and
uses the target area to garner community and government agency support for new initiatives."3
The emergent demands for homeland security further underscore the necessity for mapping,
specifically for mapping that transcends the confines of a single law enforcement agency.
Developing effective strategies to address homeland security will require mapping across the
public safety sectors and across law enforcement jurisdictions.
As paradigms of law enforcement change, the police need more capability from mapping than
the ability to plot traditional crime data. To better execute its service oriented mission, today's
law enforcement department must be able to use mapping to assess risk, to carry out plans for
protecting critical infrastructure, to jointly develop multiagency response strategies, and to better
understand community capacities and needs.

The clear nexus between homeland security preparedness and response and GIS presents both
opportunities and challenges to law enforcement. Broadly defined mapping enterprises-including
mapping and spatial analysis related to critical infrastructure, terrorist groups, suspicious activity,
remote sensing, and closed circuit television cameras-can help bridge gaps between hometown
security and homeland security. Embracing this critical nexus and recognizing the associated
needs-involving the sharing of technology, data, and intelligence-also should serve to benefit the
full spectrum of law enforcement activities, from conducting vacation door checks to
investigating serial murders.
The impetus to promote mapping for hometown and homeland security holds great promise. The
emerging and potential advances in mapping can bring about many technological and
organizational benefits, including the following:
Better information sharing, collaboration, and data standardization between federal, state,
local, and tribal law enforcement agencies.
Greater efficacy of mutual aid for disaster preparedness and response efforts. Spatially
enabled inventories of law enforcement resources-including personnel, equipment, and
specialized capacities such as SWAT-at regional or state levels could be extremely
valuable components of disaster prevention, preparedness, and response. Such inventories
can also promote more effective sharing of scarce resources among agencies in times of
fiscal constraint.
Mapping also could help diminish interagency turf issues. Maps can help identify
overlaps in jurisdictional and operational areas. They not only enhance cooperation and
identify joint problems but also break down organizational and informational silos.
It is clear that technological development both in and out of law enforcement will require that
every law enforcement executive at least be aware of the impact of mapping. Average citizens
have become reliant on Internet applications such as Google Maps, MapQuest, and Yahoo! Maps
as well as in-car navigation systems. City and county agencies are relying on GIS in growing
numbers. Computerized mapping is part of everyday life; law enforcement executives can
scarcely afford to ignore it.
Crime Mapping Principles A map, like any other type of picture, is intended to be a representation of reality. Depending on
the tools and data available, maps can be crude representations of reality or they can embody a
tremendous amount of complexity and nuance. While maps can make the complex more
comprehensible, the usefulness of any map depends on the skills, experiences, and knowledge of
the mapmaker. More complex is not necessarily better. Like pictures, abstract maps sometimes
portray information more clearly than complex maps. A well-designed map will be worth a
thousand words; a poorly designed map will confuse and misinform.

At a fundamental level, maps are a logical extension of the geometry and geography we all
learned in elementary school. Broken down to elements, maps are carefully arranged composites
of geometric objects. The most basic crime maps are nothing more than a series of points (dots
representing locations of crime incidents or arrests), lines (depicting street networks), and
polygons (demarking jurisdictional boundaries or precincts). Although the incorporation of aerial
satellite images, called orthophotography, can give a crime map an air of sophistication, the
photographic image is nothing more than a dense grid of colored squares, or pixels.
The power of maps lies in their ability to combine visualization with integration of information.
Depicted in figures 2, 3, 4, and 5 are a series of maps that range from very simple to moderately
complex.
Mapping Combines Human and Technical Resources Crime mapping requires more than data and software; it requires personnel with a diverse set of
skills, ideally blending the talents common in cartographers, graphic designers, and data
managers. Some employees, whether sworn or nonsworn, will have better aptitudes for mapping
than others. Mapping benefits from creative thinking about what data can be mapped and what
data can be acquired; mapping requires keen attention to data quality.
Law enforcement managers should be aware that crime mapping and analysis is an emerging
discipline. As a result, there is not yet a pool of college graduates who majored in crime
mapping. But many of the top police mapmakers and analysts in country today have come up
through the ranks, and managers should not discount the benefits of having worked the streets.
The department's best resource may be the spatially astute rookie who shows a knack for
mapping and analysis. Nurturing this officer's abilities by providing training and resources can
make a law enforcement manager look good to superiors.
Most of the data that the police themselves collect include some spatial reference. As agencies
move to computerized mapping, they must ensure that their geographic data fields comply with
basic standards. Law enforcement agencies that already have a strong track record of collecting a
broad range of data systematically-that is, with careful attention to standardization, uniformity,
and data quality--will be in a better position to produce valid and effective maps than those
agencies that have approached data collection more haphazardly. The quality of maps and spatial
analysis, or any crime analysis for that matter, can only be as good as the data from which it
originates.
Mapmakers and analysts must be keenly aware of the quality of not only their own agency's data
but also any data that are acquired from other government sources and commercial vendors.
Placing data in a map implies responsibility for the quality of the data. For instance, if the state
provides an agency with a data file of the destination addresses of released prisoners, the crime
analyst who integrates these data into agency crime maps should know the age and quality of the
data. Whether using the department's own data or data from other sources, mapmakers must
identify the source of the data with any map and include any appropriate disclaimers about the
timeliness and quality of the data.

The quality and sophistication of the department's CAD and RMS systems and mapping software
will influence the quality of the maps and analysis, but the skills of the mapmaker analyst and the
quality of the data are of utmost importance.
Setting the Foundation: Awareness of the Spatial Elements of Data Good maps depend on good data. Law enforcement personnel operate in spatial environments,
responding to calls at addresses or locations that are otherwise locatable (such as designated
buildings, crossroads, mile markers). They work in precincts and beats and attend community
meetings with civilians who live in neighbor-hoods. Law enforcement managers might deal with
concerned residents who want to know whether burglaries have increased on their block or a city
alderperson who wants to boast that crime is down in her ward.
Thus, whether or not an agency engages in crime mapping, it still behooves managers to ensure
that data are maintained carefully and at a high level of detail. Even without mapping software,
managers will be required to present and analyze data in reference to geographic regions.
Standard data collection methods will allow analysts to tabulate how many robberies occurred in
a designated area last year. But GIS capability, coupled with reliable incident data, would be able
to determine how many robberies occurred within 1,000 feet of a certain ATM during a certain
period. Using this type of detailed data enable better policing.
Standardized Addresses Translate to High Geocoding
Rates The computer equivalent of a human being placing a pin on
a wall map is the foundation of most maps. Computerized
pin maps require some type of geographic reference for
positioning a dot. Most often this reference is a
conventional street address. Occasionally it is a set of cross
streets. The computer process for converting standard
references to longitude and latitude coordinates is called
geocoding. Most geocoding in U.S. crime mapping efforts
involves interpolation along a line segment for which
information is stored in a base map. If, for example, a
burglary was reported at 125 Madison Street, a geocoding
program would determine that the dot should be placed in
the middle of the left side of a line segment representing the
addresses 101 to 149. The dot is typically offset from the
street centerline at a determined distance (25 feet, for
example). The logic of interpolation, however, does not always match reality. Not all streets are
set up with evenly spaced land parcels of equivalent sizes and not all locales follow the same
addressing logic.
Consistent and standardized addresses are paramount to successful geocoding. Developing
standards at the point of data capture is essential for data quality and will pay dividends when it
comes to mapping. Consider how different officers might write the same street name on standard
agency report forms:
Burglary at 123 Martin Luther King Dr
Simple assault at 128 King
Lost child on the 200 block of MLK Drive
Abandoned vehicle in the alley behind 205 ML King Drive
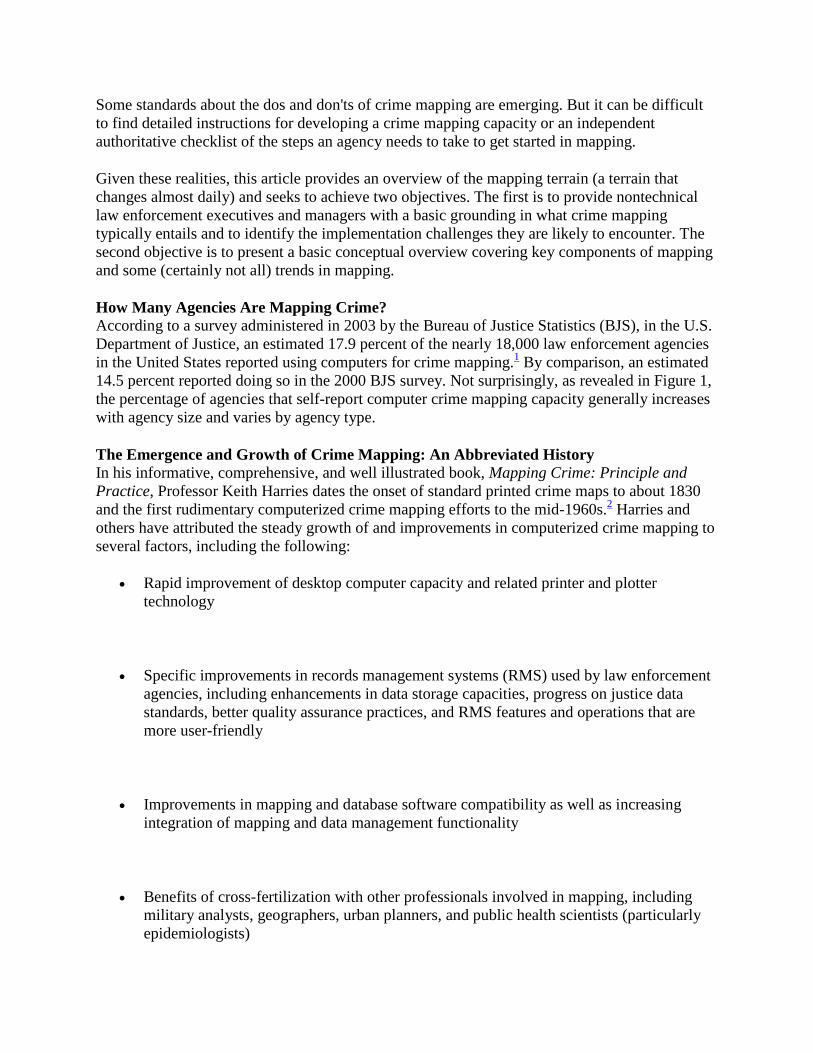
The variation in these examples illustrates the need for
standardization of street addresses. If these addresses were
transcribed into a standard RMS verbatim, a basic
geocoding engine embedded in typical mapping software
would only geocode the first of these four addresses (a
meager 25 percent geocoding hit rate). Some sort of editing
or human intervention (such as interactive geocoding
where the addresses can be corrected on the fly or data-
scrubbing routines that replace nonstandard address strings
with standard ones) would be necessary for geocoding at a
higher rate.
Moving beyond Address Geocoding Standard address geocoding has its limitations. Some
municipalities and counties have had the good fortune to
digitize their property parcel plots-that is, they have
developed detailed computerized maps that indicate
property lines and in some cases footprints of buildings on
those properties. With proper data links between standard
addresses recorded in an RMS and CAD system and the property parcel (or building base maps),
crime incident dots can be placed more precisely, often in the middle of the property parcel (or
building) polygon. As GIS technology improves, this may become more the norm. In the
meantime, spurred by the proliferation of aerial photography and the focus on homeland security,
efforts to map critical infrastructure at high levels of geographic precision are becoming more
common.

Crime analysts must be vigilant of both the geocoding rate
and the positional accuracy of the points they plot. An
agency that asserts an impressive 98 percent geocoding hit
rate may nonetheless produce misleading maps if the data
do not accurately reflect where events should be. Allowing
relaxed geocoding tolerances in automatic geocoding
routines (allowing geocoding to fall back to zip code
centroids when address fields are invalid, for instance) or
using inaccurate street base maps are common culprits.4
Analysts should routinely check geocoding accuracy by
inspecting points representing known addresses (the police
station, for instance, or the analyst's home). Many
geocoding programs or services provide some sort of
assurance regarding average positional accuracy (say, plus
or minus 25 feet). There may be some street segments or
sections of town where geocoding imprecision is well
above the average positional accuracy.
Global Positioning Systems GPS technology is at the heart of commercial in-car navigation systems and fleet-tracking
software, and it is increasingly being incorporated into monitoring brace-lets that are issued to
probationers, parolees, and sex offenders. As offender-monitoring technologies proliferate, law
enforcement will be provided with greater abilities to track crime and, in partnership with
probation and parole officers, determine where offenders are residing. With proper equipment
and with adequate data storage and retrieval capabilities, is even possible to determine where and
when these releasees violate conditions of supervision by failing to return to their residences
after curfew, by entering restricted zones, or by consorting with other felons. The staggering
volume of geographic data that this new technology will produce provides another reason law
enforcement agencies will be pressed to institute mapping.
While GPS technology holds promise, it also presents challenges. For instance, because the
locations of those monitored will be recorded at set time intervals, the technology will require
considerable resources in terms of data management, storage, and analysis. In addition, law
enforcement managers are responsible for using these data wisely. Having access to these data
and mapping them imply certain ethical considerations.
Importance of Contextual Data Computerized mapping leverages the ability of viewers to visually integrate large amounts of
information. The human eye can readily detect patterns in crime incident points and make
inferences about how these patterns relate to other features of the mapped environment. Even the
most casual student of crime mapping will know that shoplifting incidents will be related to
central business districts and shopping malls. Thus, using color-coded icons to differentiate types
of thefts along with plotting the location of business districts can provide a better understanding
of patterns.

Contextual data refers to a broad range of mappable entities that help make sense of incident
data. These range from street grids to schools to locations of police facilities. Maps could be
used, for instance, to determine whether a series of purse-snatchings tend to cluster around
particular types of parking facilities or around subway entrances.5 Similarly, maps can be used to
determine whether reports of gunshots heard in urban neighborhoods tend to cluster around
parks, certain liquor establishments, or neighbor-hoods known for gang activity.
Mapping software, coupled with good data, can help analysts discover patterns and also can
provide the means of empirically validating hypotheses, such as an investigator's supposition that
there is a relationship between adult entertainment establishments and sexual assault in the
community.
Patrol officers, detectives, and crime analysts may use maps to foster discussions. In this sense,
mapping can be used as part of an interactive discovery processes. Some viewers might see
patterns that others may miss or might suggest new contextual features that will bring more
clarity. Individual map layers may be selectively added or removed to provide for different
perspectives. Maps have been described as heuristic devices, or effective tools for stimulating
investigatory processes, exploration, and reexamination.
Robust Query Abilities and Detailed Attribute Data Law enforcement officers are well aware that they collect an abundance of descriptor data about
reported events, suspects, and conditions of arrest. Although visual selectivity of layers is a
powerful attribute of mapping, so is the selectability afforded by the descriptor, or attribute, data.
Well-designed and standardized databases take full advantage of this robust data and allow
analysts to produce effective maps with a high degree of specificity for tactical analysis. Using
data fields standard in many law enforcement records management systems, for instance, queries
can be made to select and map all residential bur-glary incidents that occurred between specific
times in which certain types of items were stolen. Analysts may create a query that seeks to
identify, for example, what burglaries occurred between 1500 and 1700 hours to unsecured
facilities that involved theft of music CDs, personal audio equipment, and other pocketable
property? Adding a mapping layer of schools to the map provides context. Thus, an integrated
map-ping of schools and queried data would be helpful in determining whether this particular
subset of burglaries is related spatially with juvenile offenders leaving school and performing
daytime burglaries to unoccupied and unsecured residences. Thus, the quality and detail of data
affects not only the ability to map events but also the ability to define crime types or modus
operandi with a high degree of specificity necessary for tactical crime analysis and for solving
crimes.
One practice of the Baltimore County Police Department (BCPD) provides an illustrative
example of the power of being able to disaggregate data based on key attribute information.
When mapping and assessing spatial patterns, BCPD analysts routinely distinguish so-called
nondefensible burglaries from other burglaries. Nondefensible burglaries are committed by
previous residents of a property, such as the ex-boyfriend who returns to an apartment he had
shared with his former girlfriend to retrieve personal items. He entered the apartment without
consent, but he had no intent of unlawfully taking property. For the purposes of tactical analysis,

nondefensible burglaries are clearly distinct from other burglaries, either forcible or nonforcible.
Without the ability to separate nondefensible burglaries from other burglaries, analysts might not
readily detect patterns that exist for conventional burglaries.
Mapping More Than
Crime For obvious reasons,
most mapping in law
enforcement centers on
crime. Although
contextual factors may
be added, the primary
focus is typically on
standard reactive police
activity, mostly calls
for service, crime
incidents, and arrests.
But just as law
enforcement is only a
portion of what most
police officers do,
crime mapping is
merely one part of
mapping by police
employees. Police also
use mapping for
prevention, community outreach, and accountability.
Law enforcement can also rely on map-ping to manage risk proactively and to direct resources
more effectively. Mapping technology can help keep track of trouble spots, such as bars named
in a large number of noise complaints. Mapping locations of tax delinquent properties, those in
serious violation of building codes, and those designated as abandoned can help police identify
locations of drug dealing. And, as we've already discussed, mapping can help track the location
of probationers and parolees.
Mapping can be an important part of proactive policing and community outreach. For instance,
police can create maps using census data to identify areas with high concentrations of
immigrants and persons with limited English proficiency. In the case of New York City, police
used maps based on such data to help develop outreach strategies to immigrant population
groups, who are often vulnerable to victimization but hesitant to call the police. In general, in the
last several decades, mapping has developed alongside problem-oriented policing and has been
widely adopted by agencies engaged in community policing.
Of course, departments may also use maps to assess traffic collisions or other events that demand
police resources. When one of the authors was involved with focus groups about mapping needs
in upstate New York law enforcement agencies, participants in one department were most

interested in mapping collisions between vehicles and deer, as this was perceived as a major
problem in the area.
Mapping for Police Accountability
and Public Relations Departments are also turning the
analytic lens of mapping on
themselves, using maps to assess
where citizen complaints are generated
and where use of force is most often
exercised. For instance, the map in
figure 6, taken from the 2004 annual
report on internal affairs of the
Charlotte-Mecklenburg Police
Department, illustrates the relationship
between locations where officers used
physical force and areas with high
violent crime density. The report is
available for viewing on the
department's Web site at
(www.charmeck.org/Departments/Poli
ce/About+Us/Departments/Internal+Af
fairs/Home.htm).
Selecting Software All major commercially available
software packages can produce quality
results for most common crime
mapping objectives. It is at the more
sophisticated end of the spectrum that
differences between software packages
can become apparent. Some packages may be rich in features but are challenging to use; others
are easier to use but have fewer features. Desktop software common in law enforcement includes
ESRI, Intergraph GeoMedia, MapInfo, and Microsoft's MapPoint. Prices vary according to
functionality and the amount of base map data that is included with the purchase.
Rather than trying to determine the elusive answer to the question about the best commercial
software, law enforcement managers would be better off determining what software their city or
county government is already using, if any. They also may deter-mine the software that their
agency's prospective crime mapper is most comfortable using. They might make the same
determination about potential consultants from the criminal justice or geography programs at the
local university.6 A discussion with or visit to a department already engaged in mapping-
especially an agency of a similar size and mission-would also be advisable.
Before making software purchases, law enforcement managers-or agency information
technology staff in agencies fortunate enough to have them-should assess what technology will

work best with their CAD systems and RMSs. Compatibility and ease of data transfer also
should be considered when CAD systems and RMSs are upgraded or the department is selecting
new CAD and RMS vendors.
Many CAD systems and some RMSs are now bundled with mapping capabilities. Managers need
to determine whether these components are flexible enough and have sufficient functionality for
the agency's needs. Even when the RMS vendor's literature pro-motes the capacities of its built-
in (or add-on) crime mapping module, the capacity most often will not be as full or as flexible as
that which standard desk-top mapping software can provide.
A modern-day adage holds that one should purchase more technological capacity than meets
present needs, based on the assumption that an agency will grow into it. Experience suggests this
certainly holds true for mapping.
Defining Organizational Approaches to Mapping Crime mapping technology may be con-figured and
organized in a variety of ways in law enforcement
agencies. Generally speaking, there are two organizational
approaches to mapping, which are not necessarily mutually
exclusive.
Approach 1 would be to leave mapping to specialists,
perhaps crime analysts. Mapmakers and analysts tend to be
proficient at both database management and computerized
cartography. They will likely employ commercially
available mapping software, use its capacities to the fullest,
and rely on incident and arrest data from the agency's CAD
system and RMS for mapping. They will also readily
incorporate other geo-graphic data, such as geographic
shape files depicting precinct boundaries, parks, or drug-
free school zones, as well as data acquired from outside
sources.
Approach 2 is to allow mapping to be accessible to
nonspecialists through custom mapping applications.
These approaches tend to deploy access to basic
functionality to a broad cross-section of personnel with graphical user interfaces (GUIs) that are
designed to be user-friendly. When Charles Ramsey, now chief of the Metropolitan Police
Department in Washington. D.C., was acting superintendent of the Chicago Police Department
(CPD), he was reported to have quipped that he wanted CPD to design a mapping application
that even he could use. Chicago's in-house mapping system, called ICAM (for Information
Collection for Automated Mapping) is highly versatile and designed to be accessible to everyone
in the department, from the beat officer to the superintendent. Similar agency-wide map-ping
systems can be made available through secured intranet (internal Internet) applications or virtual
private networks, controlling access through user authentication and passwords. These
customized approaches will require dedicated network resources and personnel to maintain the
systems, update software and hardware, and maintain associated data.
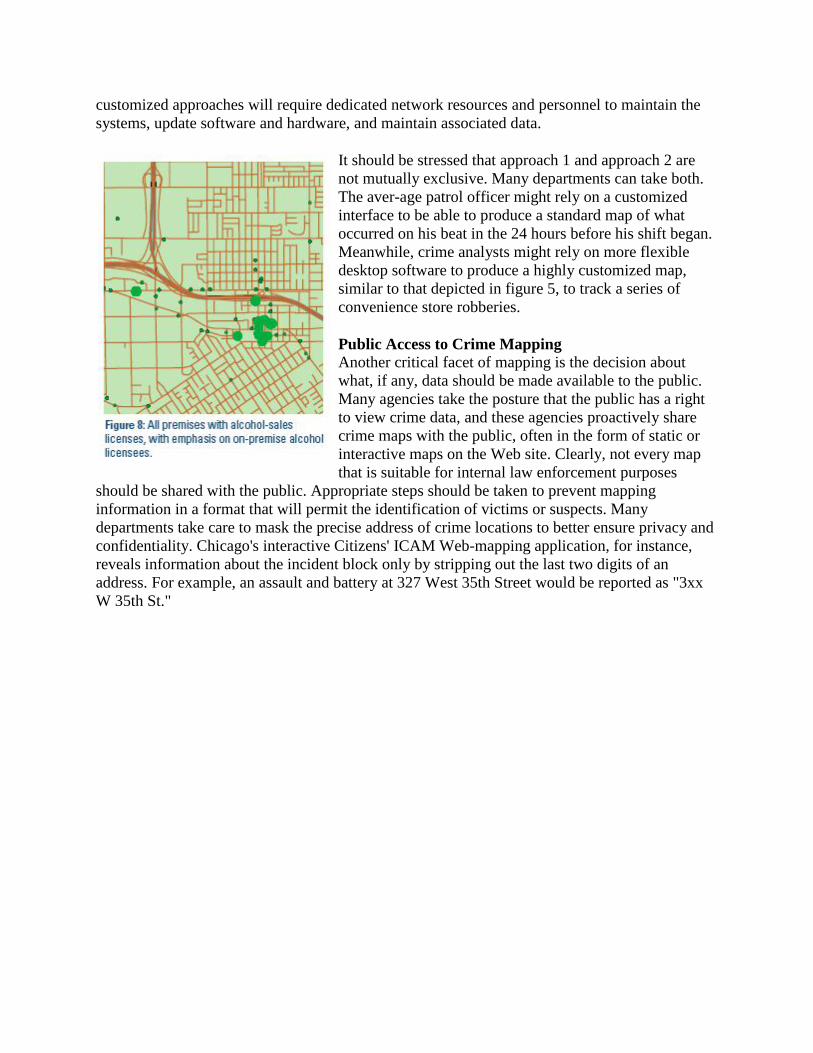
It should be stressed that approach 1 and approach 2 are
not mutually exclusive. Many departments can take both.
The aver-age patrol officer might rely on a customized
interface to be able to produce a standard map of what
occurred on his beat in the 24 hours before his shift began.
Meanwhile, crime analysts might rely on more flexible
desktop software to produce a highly customized map,
similar to that depicted in figure 5, to track a series of
convenience store robberies.
Public Access to Crime Mapping Another critical facet of mapping is the decision about
what, if any, data should be made available to the public.
Many agencies take the posture that the public has a right
to view crime data, and these agencies proactively share
crime maps with the public, often in the form of static or
interactive maps on the Web site. Clearly, not every map
that is suitable for internal law enforcement purposes
should be shared with the public. Appropriate steps should be taken to prevent mapping
information in a format that will permit the identification of victims or suspects. Many
departments take care to mask the precise address of crime locations to better ensure privacy and
confidentiality. Chicago's interactive Citizens' ICAM Web-mapping application, for instance,
reveals information about the incident block only by stripping out the last two digits of an
address. For example, an assault and battery at 327 West 35th Street would be reported as "3xx
W 35th St."

Mapping the Location of Sex Offenders Spurred by state laws requiring public notification about sex offender
residences, many states are providing interactive map-ping
applications that allow community residents to determine whether sex
offenders live in their neighborhood or near their children's schools.
In Arizona, a statewide application plots offender residences as well
as the location of schools and day care centers. It also includes access
to profiles and photographs of offenders. The National Institute of
Justice provides a Web site, at (www.nsopr.gov/), that allows visitors
to gain access to individual states' sex offender registry Web sites.
Recently available, yet still under development, is a nongovernmental
effort to consolidate and map sex offender data on a national basis.
That site can be found at (www.familywatchdog.us/).
Fairness in Mapping Mapping the location of crime and of offenders can have a
tremendous impact on public safety and assist in the law enforcement
mission. While mapping provides clear benefits, producing maps
carries some potential risks, and consequently certain responsibilities.
One responsibility is protecting the confidentiality of victims and
suspects. Police managers and analysts also need to remain aware that
maps, particularly those made available to the public, can induce fear
needlessly and may unintentionally stigmatize certain neighborhoods
and the people living in them. Consider the different impressions left
by the two maps below created from the same data.
Whether maps are used internally or shared with the public, it
behooves managers and analysts to be aware of the messages they are
sending. Map content and displays must be carefully chosen. When
necessary, analysts should provide appropriate caveats to avoid
misuse of maps and misinterpretation of data.
New Frontiers in Mapping More agencies are gravitating toward mapping, but it remains a data-intensive effort. For many
agencies the process requires downloading data from an RMS, converting data files to a format
that can be read by GIS software, and then making maps. The process is time-consuming and
requires technical proficiency. Departments either need to hire data analysts or mappers or send
employees to training. Several promising trends may help lessen these burdens for individual law
enforcement agencies.
Mapping-Enabled Records Management Systems: Several major venders of CAD systems
and RMSs now offer mapping functionality as a standard or add-on feature of their products. The
extent to which this built-in mapping capacity meets the needs of the law enforcement agency
will depend on both the vendor's software and the agency's needs. Agencies that do have
mapping-enabled CAD systems or RMSs may still find it necessary to have stand-alone mapping
software that allows for greater flexibility in map presentations and more sophisticated analyses.

Cross-Jurisdictional Mapping: The fact that individual criminals do not necessarily confine
their offenses to individual police jurisdictions is clear. This recognition, along with the
realization that criminal enterprises like street gangs involved in narcotics distribution often are
geographically dispersed beyond police boundaries, has led to efforts to develop cross-
jurisdictional crime mapping efforts. Some of these efforts are ad hoc attempts to pull together
data from different agencies using a combination of techniques and a standard off-the-shelf
mapping program. Many federally funded Weed-and-Seed and Project Safe Neighborhood sites
have obtained help from university-based researchers in such efforts. Interagency gang and drug
task forces have employed similar approaches.
In the last decade, efforts have been under way to develop integrated cross-jurisdictional crime
mapping systems in many areas of the United States. One such system is Regional Crime
Analysis GIS (RCAGIS), funded by NIJ and developed in 1999 for agencies in the Baltimore
and Washington, D.C., area. This system was designed around sharing data, mapping, and crime
analysis, particularly to examine crime incident data across jurisdictional boundaries. RCAGIS
was designed to run as a desktop computer application using shared data files.
At about the same time RCAGIS was being developed, several regional and state efforts were
under way to provide similar functionality through the Internet or secure intranet connections.
Examples include the cross-jurisdictional mapping applications in the San Diego area and in
New York State. Multiple motivations for regional or cross-jurisdictional mapping applications
exist. These include the realization that offenders do not operate within the confines of a
particular jurisdiction and the potential benefits of distributing the cost and responsibilities for
developing these systems across multiple jurisdictions. At the same time, challenges to creating
and maintaining cross-jurisdictional systems remain. These include technical, political, and
cultural obstacles related to data sharing as well as problems inherent in joint ownership and
organizations sharing responsibility for running the system. An individual agency will often
prefer to do things its own way, and its idea of data standardization is to assert the value of its
own standards and welcome other agencies to adopt them.
A 2002 publication by John Eck discusses how mapping crime across borders requires making
accommodations for variations across departments.7 Eck points out that agencies may vary in
levels of citizen crime reporting; in agency recording practices; event classification; in degree
and classification of descriptive (attribute) information (how one defines a crime as gang-related,
for instance); and in geocoding rate and accuracy.8 These obstacles present significant
challenges, but there are many compelling reasons to continue working toward data sharing and
the development of cross-jurisdictional mapping and capacities. Managers and analysts must
remain vigilant about interagency variations, some of which can be quite subtle but of enormous
importance.