comfort and adaptation in mixed-mode buildings in a hot-dry...
TRANSCRIPT

Proceedings of 8th Windsor Conference: Counting the Cost of Comfort in a changing
world Cumberland Lodge, Windsor, UK, 10-13 April 2014. London: Network for
Comfort and Energy Use in Buildings, http://nceub.org.uk
Comfort and adaptation in mixed-mode buildings in a hot-dry climate
Anoop Honnekeri1, Gail Brager1, Shivraj Dhaka2, Jyotirmay Mathur2
1 Center for the Built Environment, University of California Berkeley
2 Center for Energy and Environment, Malaviya National Institute of Technology
Jaipur
Abstract Mixed mode (MM) buildings open up a new arena for energy efficient design. Zoned MM buildings are
the most common, particularly in the developing world where only some areas in a building are air-
conditioned (AC) based on programmatic requirements while the rest of it is naturally ventilated (NV).
Occupants in the NV zone frequently visit the AC zone and are well aware of the conditions there. The
unanswered question in such a MM building is whether occupants in the NV zone have similar adaptive
behaviour and thermal comfort opinions as those in purely NV buildings or are they possibly influenced
by higher expectations created from the AC zone visits.
A transverse (cross-sectional) study was conducted between April 2011 to July 2013 in the hot and dry
climate of Jaipur, India, including 2869 total survey responses, out of which 604 were from zoned type
MM buildings. Mixed mode observations were available only during summer (April-August 2011).
Occupants were asked about their ‘right-now’ opinion of indoor environmental quality variables such
as thermal and humidity sensation, air movement and comfort. Simultaneous physical measurements of
air and radiant temperature, relative humidity and air speeds were also recorded. We analyse the results
examining the physical conditions and thermal comfort responses in both the zones, and adaptive
actions exercised in the NV zone. We compare the observations from the NV zone to three adaptive
comfort charts to evaluate whether comfort in the NV zone in a MM building can be modelled as a
purely NV building.
Keywords: Mixed mode, zoned type, adaptive action, thermal comfort
1. Introduction
Since the development of the adaptive comfort theory, researchers have conducted
many field studies in naturally ventilated (NV) and air-conditioned (AC) buildings to
evaluate comfort and adaptive actions. NV buildings consume significantly lower
energy as compared to AC and also maintain similar or improved comfort levels
(Loftness et al., 2007). However, it is commonly found that a building is not always
fully naturally ventilated or fully air-conditioned but sometimes combines both
conditioning strategies; these are referred to as ‘mixed mode’ (MM) buildings. The
temporal and spatial method of cooling the space further classifies the mixed mode
building as changeover, zoned and concurrent type (Center for the Built Environment-
mixed mode website).The MM buildings discussed in this paper are all zoned type; part
of the floor area is conditioned and the rest naturally ventilated. From now on they will
be referred as ‘AC zone’ and ‘NV zone’ respectively.
MM buildings have a great potential for energy efficient design when the major
responsibility of maintaining appropriate space temperature is borne by passive design
elements, and air-conditioners are used only to meet programmatic requirements such
as computer lab/conference room, or weather conditions with overly warm

temperatures. MM buildings also perform well as compared to purely NV and purely
AC buildings in thermal comfort and air quality (Brager and Baker, 2009).
Although MM buildings are becoming common, there are not many studies that have
evaluated comfort and adaptation in these buildings. Studies that have led to the
adaptive comfort standards show clear evidence that occupants in NV buildings are
comfortable over a broader temperature range than in AC (ASHRAE Standard 55, 2004,
Brager and de Dear, 1998, Nicol and Humphreys, 2002); the unresolved question is
whether the adaptive theory can be extended to MM buildings. In a zoned MM building,
occupants in the NV zone frequently shuttle to the AC zone during the day and are
aware of the environmental conditions in the AC zone. As a result, they might have
higher comfort expectations. Contrary to this point, access to adaptive opportunities
like operable windows and fans might outplay the expectancy factor. In a zoned type
MM building studied in Sydney Australia, occupants in the NV zone adapted using
passive means and accepted a wider indoor temperature compared to AC zone (Rowe,
2004). Testing the hypothesis of expectation in a switchover type MM building, Deuble
and de Dear found that status of the air-conditioner influenced occupant’s thermal
response. When the physical conditions were associated with a PMV value of +1, the
actual occupant votes revealed a warmer thermal response in AC mode as compared to
NV mode (Deuble and de Dear, 2012).
Understanding thermal expectation, comfort response and physical environmental
conditions in a MM building is crucial for a developing country like India where it is
estimated that two-thirds of the commercial area needed by 2030 is yet to be built
(Singh et al., 2013). Room air-conditioner sales are fast growing and have doubled from
400,000 units in 2006 to 800,000 units in 2011, accounting for highest energy
consumption in the energy sector. The estimated installed inventory of AC’s by 2016
is 10.2 million which, needless to say, would mount unrealistic pressure on power plants
(Phadke et al., Natural resources defense council (NRDC), 2013, World Bank report,
2008).
Designers have a choice for these buildings that are yet to be built; seal them completely
and install air-conditioners or adopt a more sustainable approach of selectively air-
conditioning spaces only when and where needed, and design the rest of it to be
naturally ventilated by deploying rigorous passive design strategies. To be able to opt
for the later, the environmental conditions and the corresponding influence of
expectancy on the occupants in the NV zones of a zoned type MM building needs to be
characterized.
Specifically, the objectives of this analysis of the field study data are:
1. Evaluate the temperature, humidity, air speed and CO2 concentration in the AC and
NV zones.
2. Evaluate the adaptive control actions of window, fan, blind/curtain and balcony
door operation in the NV zones.
3. Evaluate thermal comfort responses (thermal sensation/comfort) in the AC and NV
zones.
4. Evaluate whether the NV zone of MM buildings can be modelled as a purely NV
building, using the existing adaptive comfort model.

2. Methodologies
A transverse field study was conducted in the hot and dry climate of Jaipur, India,
including 2869 total survey responses (1418 responses were from 17 purely naturally
ventilated buildings, 642 from 6 purely AC, and 809 from 13 mixed mode buildings,
out of which 560 were from 11 zoned type buildings.). Amongst the 560 responses, 274
responses were from NV and 286 were from AC zone; both having desk based work.
Mixed mode observations were recorded only during summer (April- August).
The survey asked occupants about their clothing and activity patterns; thermal sensation,
comfort, humidity and air movement sensation; temperature and air movement
preference; and a few personal history questions, such as the use of air- conditioners at
home and in cars. Using the class-II protocol of field measurement (de Dear, 1998),
the study recorded parameters such as indoor temperature, relative humidity, mean
radiant temperature and air velocity. Data about adaptive actions such as operating fans,
windows, doors and blinds/curtains was also collected.
A weather station installed on a university campus (within 5 km radius of the surveyed
buildings) recorded outdoor air temperature, humidity, rainfall, wind speed and
direction.
3. Descriptive statistics
3.1.Climate analysis
Jaipur is a hot and dry climate. Summers are from the month of April to October with
hot afternoons (mean = 30.97°C, SD = 4.5°C, maximum = 43 °C) (Figure 1). Mean
value of relative humidity during summer is 53%. Winters are cold and occur during
the months of November – February (mean = 19.8°C, SD = 4.7°C, lowest = 7.2°C)
and mean relative humidity during winter is 41%.
Warm wind is prevalent during summer (Figure 2); outdoor wind speed in summer
(mean = 4.73 m/s, SD = 2.26 m/s) is higher than winter (mean = 2.94 m/s, SD = 1.7
m/s).
The weather is mainly cooling-dominated and thus presents a challenge for designing
an energy efficient building that minimizes air-conditioning use, while also providing
comfort.
Figure 1Heatmap of Jaipur weather Figure 2 Outdoor wind speed
3.2.Age/gender distribution
India is witnessing an increase in the working age ratio which bestows upon it a
‘demographic dividend’ for economic growth (Aiyar and Mody, 2011). This finding
has subtle implications on thermal comfort evaluation and design of future low energy

buildings. The young working age population (below 35 years of age) represents the
future demands for comfort and understanding their current thermal opinion can help
map out the pattern of comfort expectation. In our dataset the percentage of occupants
below the age of 35 is 63% in the ‘NV zone’ and 57% in ‘AC zone’ (Figure 3).
Figure 3 Age distribution in NV/AC zone
4. Physical measurements
4.1. Temperature/humidity distribution
Indoor operative temperature in the AC zone floated between 23 – 29˚C while the NV
zone indoor temperature was warmer, and ranged between 29 – 36˚C (considering only
those bins with more than 20 observation). Humidity level was also affected by the
presence of AC, as would be expected. Humidity was maintained below 50% in 91%
of the ‘AC zone’ observations, while the humidity shot above 50% in 50% of the NV
zone observations (Figure 5). This significant difference in temperature and humidity
between the AC and NV zone is particularly important because these two variables are
of great concern while designing MM buildings in tropical climate. Other studies
conducted in tropical climate have found that occupants are acceptable of higher indoor
temperature and humidity in NV buildings (Nicol, 2004, Busch, 1992, Indraganti, 2010,
Mallick, 1996). We test this hypothesis in this paper for the unique situation in a MM
building where the occupants in the NV zone are well aware of the lower temperature
and humidity in the AC zone.
Figure 6 shows the indoor – outdoor temperature occurrences in both the zones. The
dotted line is where the indoor temperature equals outdoor. Interestingly, indoor stayed
cooler than outdoors for 80% of the observations in the NV zone. This was mainly
because the NV zones were shielded from direct solar radiation (by balconies and
corridors) in most of the buildings and the construction material had high thermal mass.
These buildings were constructed with conventional building practices such as double
height ceiling, low window to wall ratio (20 – 30%), thick stone walls with plaster on
both sides (330 mm) and also brick construction (double brick type - 229 mm) with
plaster.
Overlaying the observations on the psychrometric chart (Figure 7) shows that 58% of
the observations from the AC zone were inside the comfort zone defined by ASHRAE
Standard 55. When the physical observations were inside the comfort zone, in 99% of
these occurrences the occupants voted that they were comfortable. However, even when

the physical observations were outside the comfort zone, there was still a high number
- 93% who were comfortable. The NV observations were clearly outside the comfort
zone. In these NV zone observations, occupants voted to be comfortable 80% of the
time when indoor temperature was less than 33 ˚C.
Figure 4 Indoor temperature distribution in
NV/AC zone
Figure 5 Humidity distribution in AC/NV zone
Figure 6 Indoor/outdoor temperature distribution
in NV/AC zone
Figure 7 Observations overlaid on the
psychrometric chart
4.2. Humidity sensation and air movement in NV zone
Although, Jaipur has a dry climate, 50% of the observations in the NV zone were found
to have relative humidity above 50%. Figure 8 shows the humidity sensation of
occupants in the NV zone for different relative humidity bins. Although humidity
sensation is above neutral for relative humidity above 50%, the median lies at “Slightly
humid” and there were negligible votes at “Very humid”. The forgiving humidity
sensation could be because of air movement, which is shown in Figure 8 for different
temperature bins, for both the NV and AC zones. Air movement is seen to be
significantly higher (p<0.05) in the NV zone compared to the AC zone in two of the
four temperature bins with overlapping observations (represented by a solid dot just
above the x axis). The horizontal dotted line shows the ASHRAE recommended limit
for draft 1.2 m/s (ASHRAE Standard 55 2010b). Based on these physical measurements,
24% of the observations in the ‘NV zone’ were found to have air speed more than 1.2
m/s while it was only 3% in the ‘AC zone’. In the NV zone, mean air speed for indoor
temperatures above 25˚C was 0.9 m/s, which is higher than the mean air speed found
for Pakistani subjects (0.45 m/s) in NV buildings in the same indoor temperature range
(Nicol et al., 1999).
Investigating the indoor air speed at high humidity, Figure 9 shows the range of air
speed for different relative humidity bins. We do the analysis just for the NV zones
since humidity above 50% was rarely observed in the AC zones (Figure 5). Air speed
at humidity above 50% in the NV zone is quite high around 1 m/s (Figure 9). The high
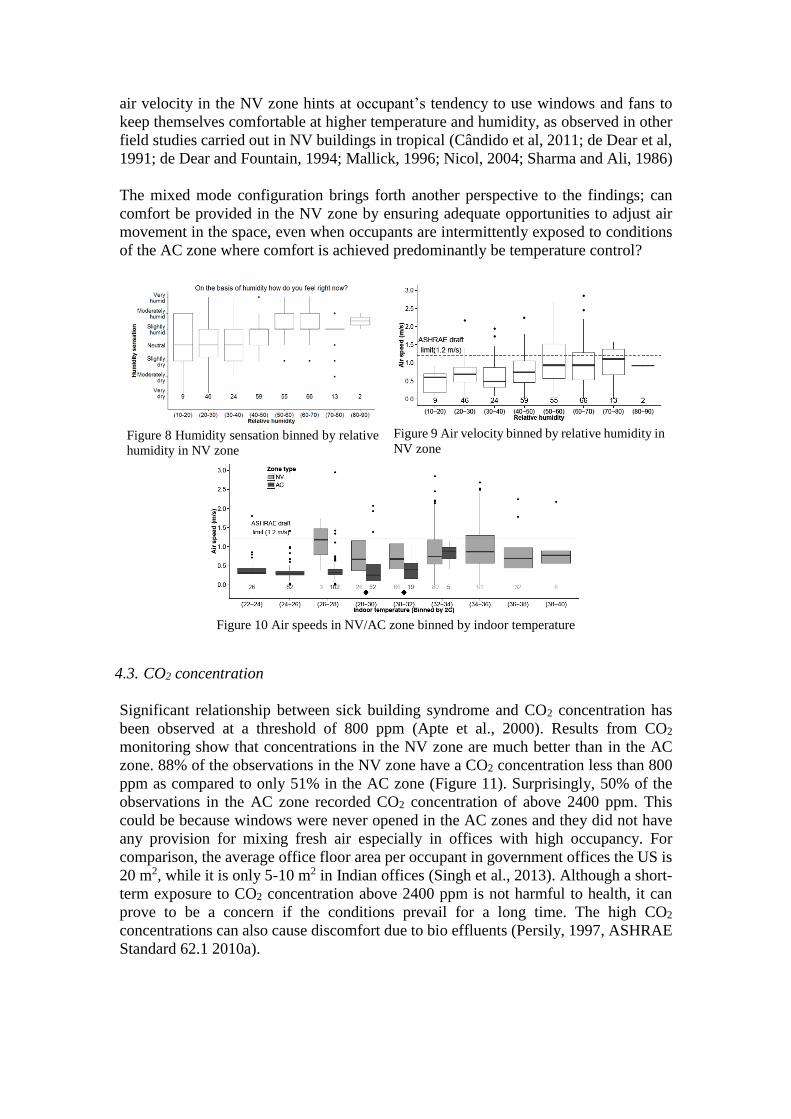
air velocity in the NV zone hints at occupant’s tendency to use windows and fans to
keep themselves comfortable at higher temperature and humidity, as observed in other
field studies carried out in NV buildings in tropical (Cândido et al, 2011; de Dear et al,
1991; de Dear and Fountain, 1994; Mallick, 1996; Nicol, 2004; Sharma and Ali, 1986)
The mixed mode configuration brings forth another perspective to the findings; can
comfort be provided in the NV zone by ensuring adequate opportunities to adjust air
movement in the space, even when occupants are intermittently exposed to conditions
of the AC zone where comfort is achieved predominantly be temperature control?
Figure 8 Humidity sensation binned by relative
humidity in NV zone
Figure 9 Air velocity binned by relative humidity in
NV zone
Figure 10 Air speeds in NV/AC zone binned by indoor temperature
4.3. CO2 concentration
Significant relationship between sick building syndrome and CO2 concentration has
been observed at a threshold of 800 ppm (Apte et al., 2000). Results from CO2
monitoring show that concentrations in the NV zone are much better than in the AC
zone. 88% of the observations in the NV zone have a CO2 concentration less than 800
ppm as compared to only 51% in the AC zone (Figure 11). Surprisingly, 50% of the
observations in the AC zone recorded CO2 concentration of above 2400 ppm. This
could be because windows were never opened in the AC zones and they did not have
any provision for mixing fresh air especially in offices with high occupancy. For
comparison, the average office floor area per occupant in government offices the US is
20 m2, while it is only 5-10 m2 in Indian offices (Singh et al., 2013). Although a short-
term exposure to CO2 concentration above 2400 ppm is not harmful to health, it can
prove to be a concern if the conditions prevail for a long time. The high CO2
concentrations can also cause discomfort due to bio effluents (Persily, 1997, ASHRAE
Standard 62.1 2010a).

Figure 11 CO2 concentration in NV/AC zone of MM building
5. Use of adaptive control in NV zone
Thermal comfort is directly influenced by behavioural adaptation in addition to
psychological and physiological adaptation (Brager and de Dear, 1998). By extending
the opportunities for behavioural adaptation in mixed mode buildings compared to
conventional sealed buildings, the question becomes whether occupants in the NV zone
use these adaptive actions to the same degree as in purely NV buildings. European and
Pakistani mixed mode buildings have been found to follow similar control patterns of
window opening and fan operation as in purely NV buildings (Rijal et al., 2008). In this
paper, we do a descriptive analysis of window, fan, blind and balcony door use in the
NV zone per degree indoor temperature to evaluate the proportion of usage in each bin.
We chose indoor over outdoor temperature as the metric for binning because it captures
the information at the individual building level which might vary from building to
building for the same outdoor temperature, as noted by Robinson (Robinson, 2006).
5.1. Windows
Windows in the AC zone were closed in all the observations while those in the NV
zone were sparingly opened; only 38% open overall (Figure 12). The bar graph does
not show any clear trend and it seems like fewer windows are opened at indoor
temperatures above 37˚C. This might be because outdoor temperature is warmer than
indoors in 80% of the observations (
Figure 6).The benefit of purging the warm indoor air and the disadvantage of bringing
in even warmer outdoor air seem to be acting against each other.
5.2. Fans
Fans were found to be on in 98 % of the observations in the NV zone. This result is
contrary to other studies that found windows to be the most widely used control option
(Haldi and Robinson, 2008, Liu et al., 2012). However, the high percentage of fan use
reveals that occupants like to have air movement. It also partially explains the window
opening behaviour; when the outdoor temperatures are higher than indoors, occupants
prefer to keep their window closed and turn on the fans to provide air movement, which
is an appropriate strategy.
5.3. Blinds/curtains
Adjusting blinds is an important adaptation strategy in tropical climates since direct
sunlight or glare is thermally and visually unpleasant at high indoor temperatures.
Overall, 68% of the blinds were found to be open in the NV zone (Figure 14). Fewer

blinds were found open as the indoor temperature increased above 33˚C, possibly to
avoid heat gain and glare.
5.4. Balcony doors
Overall, 72% balcony doors were open. Balconies are an integral part of climate
responsive building design in tropical climates as they act as thermal buffer zones,
reducing the direct solar exposure to the interiors while providing air movement. In
most of our buildings, balconies were located on the side of the façade that received
direct sunlight; towards South and South-west.
Figure 12 Percentage of windows open/closed in
the NV zone of MM
Figure 13 Percentage of fans on/off in the NV
zone of MM
Figure 14 Percentage of blinds open/closed in the
NV zone of MM
Figure 15 Percentage of balcony doors
open/closed in the NV zone of MM
5.5. Comparison with purely NV buildings
In the 17 purely naturally ventilated buildings surveyed and monitored in this study,
similar degree of adaptive control usage was observed for windows and fans. Overall,
windows were open in 33% and fans were turned on in 81% of the observations.
Interestingly, all of the 42 observations at indoor temperature above 36 ˚C had windows
open. Blinds were open in 58% while balcony doors were open in 83% of the
observations.
6. Thermal comfort
6.1. Thermal sensation in AC and NV zone
Overall, occupants in 70% and 87% of the observations in NV and AC zones,
respectively, voted within the thermal sensation limit of ±1 (slightly cool – slightly
warm). Figure 16 shows the box plot of thermal sensation votes in both the zones for
bins of indoor temperature. When the indoor temperatures were between 30˚C – 38˚C
in the NV zone, the median value of thermal sensation was “slightly warm”. This
indicates that occupants in the NV zone do not feel overly warm at higher indoor
temperatures and adapt themselves to the indoor conditions using controls such as
operable windows, fans, blinds and balcony door. This is particularly interesting
because of the expectancy factor discussed earlier, where there was concern that NV
occupants’ visits to the AC zones would lead to their desire for cooler temperatures.

Our results show that adaptation to the warmer temperatures in the NV zone overrides
expectation that may have been influenced by the AC zone.
Figure 16 Thermal sensation Indoor temperature range
6.2. Relation between thermal sensation and comfort
The most appropriate metric for thermal comfort has often been debated because of its
inherent subjective definition. The ASHRAE Standard 55 adaptive model uses thermal
sensation as the metric to calculate the percentage of people satisfied. However, thermal
sensation doesn’t necessarily reflect an occupant’s comfort opinion. An occupant might
vote that to feel warm, but may still be comfortable. This might be due to the three
adaptations pointed out in the adaptive comfort theory- behavioural, physiological and
psychological, or because of the pleasant experience in transient temperature conditions
(Brager and de Dear, 1998, Kuno, 1995).
In our survey, occupants recorded their comfort opinion on a scale of 5 (Very
uncomfortable- Very comfortable). Figure 17(NV) and Figure 18(AC) shows
percentage of occupants comfortable (colour), binned per degree indoor temperature
and thermal sensation. Only those bins with five or more observations are shown.
Interestingly, the range of thermal sensation is much broader in the NV zone on the
warmer side while it is broader on the cooler side in the AC zone. In the NV zone, when
the indoor temperature was between 30-35˚C, occupants voted to be “neutral” or
“slightly warm” in 73% of the observations (123 out of 169). Out of these 123
observations, 84% were comfortable (Figure 17). Occupants in the AC zone voted to
be comfortable in 96% of the observations (Figure 18). However, there are some
slightly cool and cool votes that occur at indoor temperature of 24 -27˚C which shows
that these AC zones run a potential risk of overcooling the building. The comparison of
thermal sensation and comfort between NV and AC zone illustrates that in a hot-dry
climate, air-conditioners do a good job in providing comfort, but it is also possible to
keep occupants comfortable without having to use an air-conditioner.

Figure 17 Percentage comfortable per degree
indoor temperature and thermal sensation in NV
zones
Figure 18 Percentage comfortable per degree
indoor temperature and thermal sensation in AC
zones
6.3. Comfort temperature range in NV and AC zone
In the NV zone more than 70%occupants voted to be comfortable per degree indoor
temperature ranging from 29˚C – 34˚C, while in the AC zone the range was 23˚C –
29˚C (considering only those bins with more than 20 votes). The higher comfort
temperature range in the NV zone clearly supports the adaptive theory which posits the
acceptance of a wider range of comfort temperature. The upper limit of the observed
comfort range in the AC zone is also higher than the one defined in ASHRAE Standard
(Figure 7), which basically means occupants in the AC zone also adapt to warmer than
neutral indoor temperatures.
When viewed from the perspective of a mixed mode building, the comfort range
presents an interesting scenario. Two groups of people in the same building are exposed
to a relatively low and high temperature range (AC and NV zone). The ones in the lower
temperature range are comfortable; but the majority of those in the higher temperature
range, barring a few observations when the indoor temperature is greater than 35 ˚C,
are also comfortable. This is a promising result for new constructions in tropical
climates which can rely more on passive design to provide comfort cost efficiently.
Figure 19 Percentage people dissatisfied in NV
zone binned by indoor temperature
Figure 20Percentage people dissatisfied in AC
zone binned by indoor temperature
6.4. Comparison of NV zone temperature with ASHRAE Standard 55, EN 15251 and an
adaptive chart developed for hot-humid Indian climate
ASHRAE adaptive standard 55 gives a relation between running mean temperature and
comfort temperature in an unconditioned building, but does not provide any guidelines
for modelling comfort in a mixed mode building. However, it allows the comfort model
to be applied in spaces that do not have a mechanical cooling system installed
(ASHRAE Standard 55, 2004). EN 15251, on the other hand, gives similar relationship
between comfort and running mean temperature while extending the applicability of
the standard to spaces that have mechanical conditioning installed but not in operation
(Nicol and Humphreys, 2002).Technically, both the adaptive models can be applied to
the NV zone of a mixed mode building.
To verify this hypothesis of applicability of the adaptive models in the NV zone, we
compare the percentage of people comfortable in our study with the ASHRAE Standard
55, EN 15251 and an adaptive model developed for hot-humid climate of South India
(Indraganti et al., 2014) (Figures 20-22).
Only 53% (145 out of 274) of the observations in the NV zone were in the temperature
range where ASHRAE adaptive chart is applicable (i.e., running mean outdoor
temperature less than 33˚C) (Figure 21). Of the 274 total NV zone observations, only
20 were inside the 80% satisfaction zone (outermost lines) defined by the adaptive chart
(Figure 21), and 85% of these 20 occupants voted that they were be comfortable. But
there was still a very high level of comfort above the adaptive comfort zone limits. In
the area above the 80% satisfied limit, but below the running mean 33˚C limit of
applicability (shown in a dotted blue line), 75% occupants were comfortable. When
running mean was greater than 33 ˚C, occupants voted comfortable in 60% of the 129
observations.
Comparing with EN 15251 standard (Figure 22), only 57 of the 274 observations fell
in the temperature zone where the adaptive chart is valid (running mean temperature
less than 30 ˚C). This is probably because EN 15251 was developed from field study
data from European countries, which did not have hot summers like Jaipur (Nicol and
Humphreys, 2002). We do not evaluate further with respect to EN15251 due to the
limited number of valid votes.
For the adaptive chart developed from a field study in hot-humid climate of South India
(Indraganti et al., 2014), 53% observations from the NV zone were within the
temperature range where the chart was valid (running mean temperature less than 33 oC) (Figure 23). Considering ± 4K deviation from neutral temperature as the comfort
threshold, 81% occupants voted to be comfortable inside the comfort zone. Out of the
56 observations that were outside the comfort range, 70% were comfortable.
These results indicate two things:
- The NV zone of mixed mode can be modelled as a purely naturally ventilated building,
while noting that in this particular study we found high degrees of comfort at
temperatures even high than the recommended upper limits
- Amongst the three adaptive charts compared above, ASHRAE Standard 55 and the
adaptive model developed by Madhavi et.al. best represent comfort from this tropical
climate better than EN15251.

Figure 21 Comfort votes from NV zone overlaid
on the ASHRAE Standard 55 adaptive chart
Figure 22 Comfort votes from NV zone overlaid
on EN 15251 adaptive chart
Figure 23 Comfort votes from NV zone overlaid on adaptive
chart developed by Madhavi et.al. for South Indian climate
7. Discussion
Physical measurements and thermal comfort survey responses from this study shows
that a zoned-type mixed mode building has the potential to save energy and also provide
comfort.
Indoor temperatures in the NV zones were found to be on an average 2 - 5 ˚C lower
than outdoor temperature even when the outdoor temperature was above 35˚C
Figure 6). In addition to revealing that the building envelope is performing well in a
hot-dry climate, this result when viewed in the light of thermal comfort raises an
interesting question- Is the comfort opinion of a space driven by the difference in indoor
and outdoor temperature, as opposed to the absolute value of either one of them? In
other words, if it is very hot outside a temperature drop of few degrees indoors could
be sufficient to keep occupants comfortable.
High air speeds at higher relative humidity and temperature, apparently due in part to
the frequent turning on of fans in the NV zone, shows that occupants prefer to have air
movement. In addition to this, 70 - 80% comfort at a high indoor temperature range of
29 – 34 ˚C is an evidence of thermal adaptation where occupants are comfortable
beyond the neutrality defined by the uniform conditioning-based PMV method.
Occupants’ ability to adapt to the high humidity and temperature in the NV zone by
accessing windows, fans, blinds and doors seem to override any potential expectations
of having conditions similar to AC zone. This implies that a building can be selectively
air conditioned based on programmatic requirement or zone location (perimeter and
core), while the other areas can be designed as a naturally ventilated building, and one
still gets the benefits of adaptive comfort.

The higher temperature range for comfort in the NV zone also gives designers an
opportunity to explore various passive design strategies in hot-dry climates that reduce
indoor temperatures, which might not be far enough to meet the neutral temperature
defined by the PMV based method. Studies evaluating the performance of passive
design in hot-dry Indian climates, such as using passive downdraft cooling towers, have
reported energy saving as high as 64% compared to air conditioned building (Ford et
al., 1998), and a temperature reduction in the range of 12 ˚C – 14 ˚C. Other passive
strategies that have been found to be effective are mud walls, thermal insulation over
roof and nocturnal cooling (Ford et al., 1998, Chel and Tiwari, 2009, Nahar et al., 2003).
Although experiences in the AC zones did not seem to influence thermal expectations
of occupants of the NV zone in our study, these results cannot necessarily be extended
to a switchover type mixed mode building. The unanswered question in a switch over
type MM building is - would installing an air conditioner influence the adaptive actions
that occupants would have otherwise exercised, such as opening a window or turning
on a fan?
Designers encounter two main challenges in a switchover type MM building. For a
system that switches between NV and AC automatically, there does not seem to be a
standard for deciding the temperature at which the switch over would happen. If the
decision to switch on and off the air conditioner is left to the occupants, there is no
certainty that occupants would actually turn off the air conditioner when the outdoor
weather is suitable to open windows. Mutual consensus between occupants to turn off
the air conditioner would also be a challenge.
In light of these difficulties, zoned type mixed modes have an advantage over
switchover types. The energy saving in the unconditioned area is guaranteed and there
are fewer concerns of HVAC control. Strategic location of programs within a building
considering cooling requirements and appropriate use of passive design seems to be a
promising way of reducing the cost of comfort in the 70% of the buildings that are yet
to come up in India.
8. Conclusions
Overall, the mixed mode buildings are performing well in providing comfort in the hot
and dry climate of Jaipur. Specific conclusions from this study are
- Indoor temperatures in the AC zone (23 – 29 ˚C) are much lower than the NV zone
(29 – 36 ̊ C) but occupants in the NV zone vote to be neutral or slightly warm in 71%
of the observations and are comfortable during the significant majority of the times.
- Relative humidity in the NV zone ranged from 36 – 86% while in the AC zone it
ranged between 31- 66%. In both zones, occupants rarely complained about feeling
very humid.
- Fans were found to be turned on in 98% of the observations in the NV zone with
high air speeds (mean = 0.9 m/s), indicating that occupants in prefer to have air
movement.
- The comfort temperature range in which 80% of the people were satisfied was found
to be 23 – 29 ˚C in the AC zone, compared to 29 – 34 ˚C in the NV zone.
- The ASHRAE Standard 55 adaptive model and the adaptive model developed by
Madhavi et.al best modelled comfort in the NV zone of the MM buildings in a hot-
dry climate.

- The opportunity to adapt to the warmer environments in the NV zone by use of
windows, fan, blinds and doors overrides the possible increase in thermal expectation
from intermittent exposure to AC zone.
Acknowledgements
This work was funded in part by the US - India Joint Clean Energy Research and
Development Center (JCERDC) under the framework of the Center for Building
Energy Research and Development (CBERD) project supported by the US-India
Science and Technology Forum and the U.S. Dept. of Energy.
We are grateful to Dr. G.D. Agarwal for his suggestions during field data collection and
also to the subjects who willingly filled out the surveys.
References
Aiyar S and Mody A (2011) Demographic Dividend: Evidence from the Indian States.
International Monetary Fund.
ANSI/ASHRAE (2010a) ANSI/ASHRAE 62.1-2010: Ventilation for acceptable
indoor air quality. American Society of Heating, Refrigerating and Air-
Conditioning Engineers, Atlanta.
ANSI/ASHRAE (2010b) Standard 55-2010 addendum.
Apte MG, Fisk WJ, Daisey JM (2000) Associations between indoor CO 2
concentrations and sick building syndrome symptoms in U. S. office buildings:
An analysis of the 1994-1996 BASE study data. Indoor air, 10, 4, 246-257.
ASHRAE (2004) ASHRAE Standard 55 - 2004 Thermal Environmental Conditions
for Human Occupancy.
Brager GS and Baker L (2009) Occupant satisfaction in mixed-mode buildings.
Building Research & Information, 37, 4, 369-380.
Brager GS and de Dear RJ (1998) Thermal adaptation in the built environment: A
literature review. Energy and Buildings, 27, , 83-96.
Busch JF (1992) A tale of two populations: Thermal comfort in air-conditioned and
naturally ventilated offices in thailand. Energy and Buildings, 18, 3–4, 235-249.
Cândido C, de Dear R, Lamberts R (2011) Combined thermal acceptability and air
movement assessments in a hot humid climate. Building and Environment, 46, 2,
379-385.
Center for the Built Environment Mixed Mode: Case Studies and Project Database.
Available at: http://www.cbe.berkeley.edu/mixedmode/aboutmm.html .
Chel A and Tiwari GN (2009) Thermal performance and embodied energy analysis of
a passive house – case study of vault roof mud-house in India. Applied Energy,
86, 10, 1956-1969.
de Dear RJ (1998) A global database of thermal comfort field experiments. ASHRAE
Transactions, 104, 1b, 1141-1152.
de Dear RJ and Fountain ME (1994) Field experiments on occupant comfort and
office thermal environments in a hot-humid climate. ASHRAE Transactions, 100,
2, 457-475.
de Dear RJ, Leow KG, Foo SC (1991) Thermal comfort in the humid tropics: Field
experiments in air conditioned and naturally ventilated buildings in Singapore.
International Journal of Biometeorology, 34, 259-265.
Deuble MP and de Dear RJ (2012) Mixed-mode buildings: A double standard in
occupants' comfort expectations. Building and Environment, 54, 53-60.

Ford B, Patel N, Zaveri P et al (1998) Cooling without air conditioning: The torrent
research centre, ahmedabad, India. Renewable Energy, 15, 1, 177-182.
Haldi F and Robinson D (2008) On the behaviour and adaptation of office occupants.
Building and Environment, 43, 12, 2163-2177.
Indraganti M, Ooka R, Rijal HB et al (2014) Adaptive model of thermal comfort for
offices in hot and humid climates of India. Building and Environment, 74, 39-5.
Indraganti M (2010) Thermal comfort in naturally ventilated apartments in summer:
Findings from a field study in hyderabad, India. Applied Energy, 87, 3, 866-883.
Kuno S(1995) Comfort and pleasantness. , Nagoya, Japan, March 1995.
Liu W, Zheng Y, Deng Q et al (2012) Human thermal adaptive behaviour in naturally
ventilated offices for different outdoor air temperatures: A case study in changsha
china. Building and Environment, 50, 76-89.
Loftness V, Hakkinen B, Adan O et al (2007) Elements that contribute to healthy
building design. Environmental Health Perspectives, 115, 965-970.
Mallick FH (1996) Thermal comfort and building design in the tropical climates.
Energy and Buildings, 23, 3, 161-167.
Nahar N, Sharma P, Purohit M (2003) Performance of different passive techniques for
cooling of buildings in arid regions. Building and Environment, 38, 1, 109-116.
Natural resources defense council (NRDC) (2013) Cooling India with less warming:
The business case for phasing down HFCs in room and vehicle air conditioners.
Nicol JF, Raja IA, Allaudin A et al (1999) Climatic variations in comfortable
temperatures: The pakistan projects. Energy and Buildings, 30, 3, 261-279.
Nicol JF and Humphreys MA (2002) Adaptive thermal comfort and sustainable
thermal standards for buildings. Energy and Buildings, 34, 6, 563-572.
Nicol F (2004) Adaptive thermal comfort standards in the hot–humid tropics. Energy
and Buildings, 36, 7, 628-637.
Persily AK (1997) Evaluating building IAQ and ventilation with indoor carbon
dioxide. TRANSACTIONS-AMERICAN SOCIETY OF HEATING
REFRIGERATING AND AIR CONDITIONING ENGINEERS, 103, , 193-204.
Phadke A, Abhyankar NShah N Avoiding 100 new power plants by increasing energy
efficiency of room air conditioners in India: Opportunities and challenges.
Rijal H, Humphreys MA Nicol JF (2008) How do the occupants control the
temperature in mixed-mode buildings? predicting the use of passive and active
controls. In: Proceedings of Air Conditioning and the Low Carbon Cooling
Challenge Windsor, UK.
Robinson D (2006) Some trends and research needs in energy and comfort prediction.
In: Proceedings Windsor conference, UK
Rowe DM (2004) Thermal comfort in a naturally ventilated environment with
supplementary cooling and heating. Architectural Science Review, 47, 2, 131-
140.
Sharma M and Ali S (1986) Tropical summer index—a study of thermal comfort of
Indian subjects. Building and Environment, 21, 1, 11-24.
Singh R, Sartor DGhatikar G (2013) Best practices guide for high- performance
Indian office buildings.
World Bank report (2008) Residential consumption of electricity in India:
Documentation of data and methodology (draft report).