come & join us at vustudents - ningapi.ning.com/.../fin619finalprojectofhabibbank.pdffinal...
TRANSCRIPT

Come & Join Us at VUSTUDENTS.net
For Assignment Solution, GDB, Online Quizzes, Helping Study material, Past Solved Papers, Solved MCQs, Current Papers, E-Books & more.
Go to http://www.vustudents.net and click Sing up to register.
VUSTUENTS.NET is a community formed to overcome the disadvantages of distant learning and virtual environment, where pupils don’t have any formal contact with their mentors, This community provides its members with the solution to current as well as the past Assignments, Quizzes, GDBs, and Papers. This community also facilitates its members in resolving the issues regarding subject and university matters, by providing text e-books, notes, and helpful conversations in chat room as well as study groups. Only members are privileged with the right to access all the material, so if you are not a member yet, kindly SIGN UP to get access to the resources of VUSTUDENTS.NET » » Regards » » VUSTUDENTS.NET TEAM. Virtual University of Pakistan
Come and Join Us at www.vustudents.ning.com
Fin a l Pro jec t F in an ce FI N 619
Final Project
FINANCIAL STATEMENT ANALYSIS OF
BANK AL FALAH
AND
HABIB BANK LIMITED
A REPORT
SUBMITTED TO THE DEPARTMENT OF MANAGEMENT SCIENCES,
VIRTUAL UNIVERSITY OF PAKISTAN
IN PARTIAL FULFILLMENT OF THE REQUIREMENTS FOR
THE DEGREE OF MASTERS IN BUSINESS ADMINISTRATION
Submitted By
Mc070400479
Sheikh Waqas Ahmed
Department of Management Sciences,
Virtual University of Pakistan
1S h e i k h W a q as A h m e d
M c 0 7 0 4 0 0 4 7 9
Come and Join Us at www.vustudents.ning.com
Fin a l Pro jec t F in an ce FI N 619
DedicationI would like to dedicate this project to my parents who have always encourage me
throughout in my academic career and make possible for me to stand where I am today.
2S h e i k h W a q as A h m e d
M c 0 7 0 4 0 0 4 7 9
Come and Join Us at www.vustudents.ning.com

Fin a l Pro jec t F in an ce FI N 619
AcknowledgementIn the name of ALLAH, the most kind and most merciful.
First of all I m grateful to ALLAH ALMIGHTY, who bestowed me with health, abilities
and guidance to complete the project in a successful manner, and without HIS help I was
unable to perform this task.
More than anybody else, I would like to acknowledge my project advisor, Dr.
Muhammad Anwar for his never ending support and untiring efforts. He was always
there to guide me whenever I felt stuck off and his encouragement always worked as
moral booster for me. I have found him very helpful while discussing the tricky issues in
this dissertation work. I would also like to thank Mr. Majid Hassan principal JMCIT
Lahore. His critical comments on my work have certainly made me think of new ideas
and techniques.
I am thankful to all my class fellow specially Ambreen Fatima and all other friends who
help me during the project when problem arises, specially my seniors Muhammad Yasir,
Tanzila Riaz, Fatima and Saeed Mahmood for their kind help.
3S h e i k h W a q as A h m e d
M c 0 7 0 4 0 0 4 7 9
Come and Join Us at www.vustudents.ning.com
Fin a l Pro jec t F in an ce FI N 619
Executive SummaryCommon Size Financial Statement discloses the internal structure of the firm. It indicates
the existing relationship between sales and each income statement account. It shows the
mix of assets that produce income and the mix of the sources of capital, whether by
current or long-term debt or by equity funding.
The primary objective of financial analysis is to forecast or determine the actual financial
status and performance of a project
4S h e i k h W a q as A h m e d
M c 0 7 0 4 0 0 4 7 9
Come and Join Us at www.vustudents.ning.com
Fin a l Pro jec t F in an ce FI N 619
TABLE OF CONTENT
Section I
a) Introduction……………………………………………………. 6
1.1 Background ……………………………………………………….. 6
1.2 Introduction of the organization’s business sector ………………… 7
1.3 Company’s Introduction ………………………………….……….. 8
Introduction of Habib Bank……………………………………. 8
Introduction of Bank AL Falah………………………………... 9
1.4 List of competitors ………………………………………………… 10
1.5 Objectives of Projects………………………………….…………… 10
1.6 Significance of the Project…………………………………………. 11
b) Processing and Analysis…………..…………………….……. 13
Data Collection Sources……………………..………………………… 13
Data Collection Tools………………………………………….……… 14
Data Processing and Analysis…………………………….…………… 14
Project proceedings………………………………………………. 14
1. Ratio Analysis…………………………………………….…………. 14
a) Liquid Ratio…………………………………………………... 15
b) Leverage Ratio………………………………………………… 18
c) Profitability Ratio……………………………………………… 24
d) Activity Ratio………………………………….….………….. 32
e) Market Ratios…………………………………………………. 33
f) Statement of Cash Flow………………………………………. 38
2. Common Size Analysis……………………………………………… 39
a) Horizontal Analysis…………..……………………….……… 40
b) Vertical Analysis……………..……………………………… 49
5S h e i k h W a q as A h m e d
M c 0 7 0 4 0 0 4 7 9
Come and Join Us at www.vustudents.ning.com
Fin a l Pro jec t F in an ce FI N 619
3 Review of Descriptive Information………….……………………... 59
4 Comparisons ……………………………………………………….. 60
a) Trend Analysis………………………………………………… 60
b) Industry Averages and Comparisons with Competitors……… 65
c) Summary……………………………………………………... 65
d) Conclusions / Findings………………………………………. 66
e) Recommendation ……………………………………………. 67
Section II……………………………………………………………. 68
a) Introduction of the student……………………………………….LXVIII
b) Appendix/Appendices………………………...………………….LXVIII
c) Bibliography...……………………………………………………LXXXVII
Section I
a) Introduction
Financial statements for banks present a different analytical problem than manufacturing
and service companies. As a result, analysis of a bank's financial statements requires a
distinct approach that recognizes a bank's somewhat unique risks.
Banks take deposits from savers, paying interest on some of these accounts. They pass
these funds on to borrowers, receiving interest on the loans. Their profits are derived
from the spread between the rate they pay for funds and the rate they receive from
borrowers. By managing this flow of funds, banks generate profits, acting as the
intermediary of interest paid and interest received and taking on the risks of offering
credit. As one of the most highly regulated banking industries in the world, investors
have some level of assurance in the soundness of the banking system. As a result,
investors can focus most of their efforts on how a bank will perform in different
economic environments. In this project, I am trying to provide assistance to the investors,
by showing them the performance of two banks underlying the same functions.
1.1 Background of the project:
Financial Statement Analysis is a method used by interested parties such as investors,
creditors, and management to evaluate the past, current, and projected conditions and
performance of the firm. Ratio analysis is the most common form of financial analysis. It 6
S h e i k h W a q as A h m e dM c 0 7 0 4 0 0 4 7 9
Come and Join Us at www.vustudents.ning.com
Fin a l Pro jec t F in an ce FI N 619
provides relative measures of the firm's conditions and performance. Horizontal Analysis
and Vertical Analysis are also popular forms. Horizontal analysis is used to evaluate the
trend in the accounts over the years, while vertical analysis, also called a Common Size
Financial Statement discloses the internal structure of the firm. It indicates the existing
relationship between sales and each income statement account. It shows the mix of assets
that produce income and the mix of the sources of capital, whether by current or long-
term debt or by equity funding. When using the financial ratios, a financial analyst makes
two types of comparisons.
Financial ratio analysis is an important topic and is covered in all mainstream corporate
finance textbooks. It is also a popular agenda item in investment club meetings. It is
widely used to summarize the information in a company's financial statements in
assessing its financial health. In today's information technology world, real time financial
data are readily available via the Internet. Performing financial ratio analysis using
publications, such as Robert Morris Associates’ Annual Statement Studies, Dun &
Bradstreet’s Key Business Ratios, Moody’s Manuals, Standard & Poor’s Corporation
Records, Value Line Investment Survey, etc., is no longer efficient. Since students and
investors now have easy access to on-line databases, the assignments on financial ratio
analysis can be modified accordingly to enhance learning.
In the current scenario where financial instability is rife and financial intuitions are
becoming popular, when it comes to investing, the sound analysis of financial statements
is one of the most important elements in the fundamental analysis process. At the same
time, the massive amount of numbers in a company's financial statements can be
bewildering and intimidating to many investors. However, through financial ratio
analysis, we shall be able to work with these numbers in an organized fashion and present
them in a concise form easily understandable to both the management and interested
investors.
1.2 Introduction of the organization’s business sector:
The organizations is choose, are from the banking sector. Banking primarily the business
of dealing in money and instruments of credit. Banks were traditionally differentiated
from other financial institutions by their principal functions of accepting deposits, subject
7S h e i k h W a q as A h m e d
M c 0 7 0 4 0 0 4 7 9
Come and Join Us at www.vustudents.ning.com
Fin a l Pro jec t F in an ce FI N 619
to withdrawal or transfer by check, and of making loans. A bank is a financial institution
licensed by a government. Its primary activity is to lend money. Many other financial
activities were allowed over time. For example banks are important players in financial
markets and offer financial services such as investment funds. In some countries such as
Germany, banks have historically owned major stakes in industrial corporations while in
other countries such as the United States banks are prohibited from owning non-financial
companies. In Japan, banks are usually the nexus of a cross-share holding entity known
as the zaibatsu. In France, banc assurance is prevalent, as most banks offer insurance
services (and now real estate services) to their clients. The level of government regulation
of the banking industry varies widely, with counties such as Iceland, the United Kingdom
and the United States having relatively light regulation of the banking sector, and
countries such as China having relatively heavier regulation.
Banks have traditionally been distinguished according to their primary functions.
Commercial banks, which include national- and state-chartered banks, trust companies,
stock savings banks, and industrial banks, have traditionally rendered a wide range of
services in addition to their primary functions of making loans and investments and
handling demand as well as savings and other time deposits. Mutual savings banks, until
recently, accepted only savings and other time deposits, and offered limited types of
loans and services. The fact that commercial banks were able to expand or contract their
loans and investments in accordance with changes in reserves and reserve requirements
further differentiated them from mutual savings banks, where the volume of loans and
investments was governed by changes in customers' deposits. Membership in the Federal
Deposit Insurance Corporation is compulsory for all Federal Reserve member banks but
optional for other banks.
1.3 Company’s introduction:
Introduction of Habib Bank of Pakistan:
Habib Bank Limited commonly referred to as "HBL" and head-quartered in Habib
Bank Plaza, Karachi, Pakistan, is the largest bank in Pakistan. HBL is a Banking
Company, which is engaged in Commercial & Retail Banking and related services
domestically and overseas. HBL was incorporated on 25th August 1941 and operated in
8S h e i k h W a q as A h m e d
M c 0 7 0 4 0 0 4 7 9
Come and Join Us at www.vustudents.ning.com
Fin a l Pro jec t F in an ce FI N 619
the private sector until its nationalization in 1974. HBL has been approved for
privatization and the privatization commission has selected a Financial Advisor to
prepare a comprehensive plan and assist in the sale process. The government has
appointed a professional management team to restructure the bank and to recover and
clean its doubtful and classified portfolio. HBL is one of the largest commercial bank of
Pakistan. It accounts for a substantial share (20%) of the total commercial banking
market in Pakistan with a network of 1,705 domestic branches; 55 overseas branches in
26 countries spread over Europe, the Middle East, Far East, Asia, Africa and the United
States; 3 HBL wholly owned Subsidiaries namely Habib Bank Financial Services (PVT)
LTD. Karachi, Habib Finance International LTD (Hong Kong) and Habib Finance
Australia Ltd. – Sydney; 2 Joint Ventures namely Habib Nigeria Bank Ltd. (40%) and
Himalayan Bank Ltd. (20%) and 2 representative offices in Iran and Egypt. It continues
to dominate the commercial banking sector with a major market share in inward foreign
remittances (55%) and loans to small industries, traders and farmers. HBL is one of
Pakistan's premier banks in terms of deposits and advances with a huge domestic and
international network. HBL provides its customers a complete range of banking products
and services including retail banking, corporate and institutional banking, trade finance,
consumer finance and credit cards. HBL is currently rated AA (Long term) and A-1+
(Short term) and has a balance sheet size of over USD 11 billion. It is the first Pakistani
bank to raise Tier II Capital from external sources.
Vision:
“Enabling people to advance with confidence and success”
Mission:
“To make our customer prosper, our staff excels and creates value for shareholders”
Introduction of Bank Al Falah:
Bank Alfalah Limited is a private bank in Pakistan owned by the Abu Dhabi Group.
Bank Alfalah Limited was incorporated on June 21st, 1992 as a public limited company
under the Companies Ordinance 1984. Its banking operations commenced from
November 1st ,1997. The bank is engaged in commercial banking and related services as
defined in the Banking companies ordinance, 1962. The Bank is currently operating
9S h e i k h W a q as A h m e d
M c 0 7 0 4 0 0 4 7 9
Come and Join Us at www.vustudents.ning.com
Fin a l Pro jec t F in an ce FI N 619
through 195 branches in 74 cities, with the registered office at B.A.Building,
I.I.Chundrigar, Karachi.
This facilitates the commitment to a culture of innovation and seeks out synergies with
clients and service providers to ensure uninterrupted services to its customers. Bank Al-
Falah is known to perceive the requirements of customers and match them with quality
products and service solutions. During the past five years, this bank has emerged as one
of the foremost financial institution in the region endeavoring to meet the needs of
tomorrow today. With a vision to be the premier organization operating locally &
internationality that provides the complete range of financial services to all segments
under one roof, Bank Al-Falah is one of the most important entities in banking sector of
Pakistan with a strong credit rating of AA for long term and A one plus for the short
term. Since its inception, as the new identity of H.C.E.B after the privatization in 1997,
the management of the bank has implemented strategies and policies to carve a distinct
position for the bank in the market place. Since its inception, as the new identity of
H.C.E.B after the privatization in 1997, the management of the bank has implemented
strategies and policies to carve a distinct position for the bank in the market place.
Strengthened with the banking of the Abu Dhabi Group and driven by the strategic goals
set out by its board of management, the Bank has invested in revolutionary technology to
have an extensive range of products and services.
Vision:
“To be the premier organization operating locally & internationality that provides the
complete range of financial services to all segments under one roof”
Mission:
“To develop & deliver the most innovative products, manage customer experience,
deliver quality services that contributes to brand strength, establishes a competitive
advantage and enhances profitability, thus providing value to the stakeholders of the
bank”
1.4 List of competitors:
• Standard Chartered Bank
• National Banks
• Allied Bank Limited
10S h e i k h W a q as A h m e d
M c 0 7 0 4 0 0 4 7 9
Come and Join Us at www.vustudents.ning.com
Fin a l Pro jec t F in an ce FI N 619
1.5 Objectives of the project:
The objective of this project is to provide insight into how the banks work, what are the
strengths and weakness of the banks, which bank is financially more feasible than the
other. The ratios will be compared of both the banks within the industry to see where the
banks stand. Question such as ‘What are the strengths and weaknesses of each bank?’
will be answered with the comparison of the ratios. To give the stock holder a clear view
about the financial feasibility of both the banks so that they can take the appropriate
decision. And most significantly it will provide a good understanding of the business
cycle and the yield curve - both of which have a major impact on the economic
performance of banks.
The primary objective of financial analysis is to forecast and/or determine the actual
financial status and performance of a project and, where appropriate, of the EAs. This is
to enable ADB to combine that information with all other pertinent data (technical,
economic, social, etc.) to assess the feasibility, viability, and potential economic benefits,
of a proposed or continuing lending operation. Secondary objective is the provision of
Technical Assistance to a borrower and an EA to enable them to make similar
assessments for the project and to apply the techniques to other non-ADB investments. A
tertiary objective is to encourage borrowers to make any necessary changes to their
institutional and financial management systems to facilitate the generation of appropriate
data to support good financial analysis. The objectives of financial analysis as set out
above are intended to measure the achievement of financial objectives of a borrower, the
project to be (or being) financed. The financial performance of a public and private sector
EA should normally be measured by the use of at least one indicator selected from the
range of the following groups of indicators derived from the financial analysis of a
project and its EA: (i) operation; (ii) capital structure, and (iii) liquidity. This means that,
if only one indicator from one of the three categories of indicators above would be the
subject of a loan covenant, the remaining indicator or indicators from each group above
recommended by the financial analyst should be the subject of periodic reporting. The
efficient allocation of resources is an important consideration in pricing policy,
particularly for REEA services. Financial analysis is used to describe the impact of such a
policy.
11S h e i k h W a q as A h m e d
M c 0 7 0 4 0 0 4 7 9
Come and Join Us at www.vustudents.ning.com
Fin a l Pro jec t F in an ce FI N 619
I worked on the financial statements of the bank i.e. Balance sheet of the bank and make
some essential calculations in order to give you an idea about the financial stability of the
bank.
1.6 Significance of the project:
Financial statements provide an overview of a business' financial condition in both short
and long term. All the relevant financial information of a business enterprise presented in
a structured manner and in a form easy to understand, is called the financial statements.
Therefore these financial statements are very useful for the stake holder, as they obtain all
insight information. In assessing the significance of various financial data, experts engage
in ratio analyses, the process of determining and evaluating financial ratios. A financial
ratio is a relationship that indicates something about a company's activities, such as the
ratio between the company's current assets, current liabilities or between its accounts
receivable and its annual sales. The basic source for these ratios is the company's
financial statements that contain figures on assets, liabilities, profits, or losses. Financial
ratios are only meaningful when compared with other information. Since they are most
often compared with industry data, ratios help an individual understand a company's
performance relative to that of competitors; they are often used to trace performance over
time.
Ratio analysis can reveal much about a company and its operations. However, there are
several points to keep in mind about ratios. First, financial statement ratios are "flags"
indicating areas of strength or weakness. One or even several ratios might be misleading,
but when combined with other knowledge of a company's management and economic
circumstances, ratio analysis can tell much about a corporation. Second, there is no single
correct value for a ratio. The observation that the value of a particular ratio is too high,
too low, or just right depends on the perspective of the analyst and on the company's
competitive strategy. Third, a ratio is meaningful only when it is compared with some
standard, such as an industry trend, ratio trend, a ratio trend for the specific company
being analyzed, or a stated management objective.
The significance of my project stems from the very nature of the financial statements i.e.
they are usually lengthy, bulky documents which have a huge array of numbers not
readily understandable. Financial statement analysis is the process of examining
12S h e i k h W a q as A h m e d
M c 0 7 0 4 0 0 4 7 9
Come and Join Us at www.vustudents.ning.com
Fin a l Pro jec t F in an ce FI N 619
relationships among financial statement elements and making comparisons with relevant
information. It is a valuable tool used by investors and creditors, financial analysts, and
others in their decision-making processes related to stocks, bonds, and other financial
instruments. The goal in analyzing financial statements is to assess past performance and
current financial position and to make predictions about the future performance of a
company. Investors who buy stock are primarily interested in a company's profitability
and their prospects for earning a return on their investment by receiving dividends and/or
increasing the market value of their stock holdings. Creditors and investors who buy debt
securities, such as bonds, are more interested in liquidity and solvency: the company's
short-and long-run ability to pay its debts. Financial analysts, who frequently specialize
in following certain industries, routinely assess the profitability, liquidity, and solvency
of companies in order to make recommendations about the purchase or sale of securities,
such as stocks and bonds. Analysts can obtain useful information by comparing a
company's most recent financial statements with its results in previous years and with the
results of other companies in the same industry. My aim is to summarize all that data into
a form which is easily understood by all the relevant parties.
b) Processing and Analysis
This section should provide solid or concrete foundations to the study. Quality and value of
the research report depends upon how precisely and accurately the data is collected,
processed, interpreted and analyzed so that fruitful conclusions may be drawn out of it. It
includes:
Data Collection Sources:
To think about the issue of data collection means you are wondering about the
characteristics of the methods used. Each method has its own advantages and
inconveniences. With each technique you might also found a few people who will
disapprove its use for such or such reason.
At the beginning of a research (Project), it can be important to look for documentary
sources. It is what some will call: “the review of papers ". And here, I use the term
documentary sources in the widest meaning of this term. Indeed, the goal is not to find
only written sources. These documentary sources I use are:
• Sites on the internet,
13S h e i k h W a q as A h m e d
M c 0 7 0 4 0 0 4 7 9
Come and Join Us at www.vustudents.ning.com
Fin a l Pro jec t F in an ce FI N 619
• Articles from scientific publications,
• Documents on various format (audio, video or computer support),
• Advisers with a particular expertise
The purpose of the gathering of documentary sources is to have a better idea of what have
been said or written about my subject. It is not for the intellectual beauty of the matter
which I should do that. The search for documentary sources allowed me to put a more
adequate glance at the data you will later gather.
Also I use secondary sources for data collection for my work, that include internet and
then I use stock exchange for data gathering as the banks are listed in Lahore stock
exchange. So I got their annual reports from there.
Data Collection Tools:
According to the topic I have selected for my project, the tool used for data collection is
direct observation of the financial statements of the banks.
Company profile forms
Company comparison forms
Stock exchange
Internet past articles
Case Study
Data Processing and Analysis:
We can use several tools to evaluate a company, but I will use one of the most valuable
tool that is “financial ratios“. Ratios are an analyst’s microscope; they allow us get a
better view of the firm’s financial health than just looking at the raw financial statements.
Ratios are useful both to internal and external analysts of the firm. For internal
purposes: ratios can be useful in planning for the future, setting goals, and evaluating the
performance of managers. External analysts use ratios to decide whether to grant credit,
to monitor financial performance, to forecast financial performance, and to decide
whether to invest in the company. I will use Microsoft Word and Microsoft Excel work
sheets to compute the different ratios and analysis.
Project proceedings
1. RATIO ANALYSIS:
14S h e i k h W a q as A h m e d
M c 0 7 0 4 0 0 4 7 9
Come and Join Us at www.vustudents.ning.com
Fin a l Pro jec t F in an ce FI N 619
Financial ratios are useful indicators of a firm's performance and financial situation.
Financial ratios can be used to analyze trends and to compare the firm's financials to
those of other firms. Ratio analysis is the calculation and comparison of ratios which are
derived from the information in a company's financial statements. Financial ratios are
usually expressed as a percent or as times per period. Ratio analysis is a widely used tool
of financial analysis. It is defined as the systematic use of ratio to interpret the financial
statements so that the strength and weaknesses of a firm as well as its historical
performance and current financial condition can be determined. The term ratio refers to
the numerical or quantitative relationship between two variables. With the help of ratio
analysis conclusion can be drawn regarding several aspects such as financial health,
profitability and operational efficiency of the undertaking. Ratio points out the operating
efficiency of the firm i.e. whether the management has utilized the firm’s assets correctly,
to increase the investor’s wealth. It ensures a fair return to its owners and secures
optimum utilization of firm’s assets. Ratio analysis helps in inter-firm comparison by
providing necessary data. An inter firm comparison indicates relative position. It provides
the relevant data for the comparison of the performance of different departments. If
comparison shows a variance, the possible reasons of variations may be identified and if
results are negative, the action may be initiated immediately to bring them in line. Yet
another dimension of usefulness or ratio analysis, relevant from the View point of
management is that it throws light on the degree efficiency in the various activity ratios
measures this kind of operational efficiency.
a) Liquidity Ratios
b) Leverage Ratios
c) Profitability Ratios
d) Activity Ratios
e) Market Ratios
f) Statements of Cash Flow
Ratio Analysis
a) Liquidity Ratios15
S h e i k h W a q as A h m e dM c 0 7 0 4 0 0 4 7 9
Come and Join Us at www.vustudents.ning.com
Fin a l Pro jec t F in an ce FI N 619
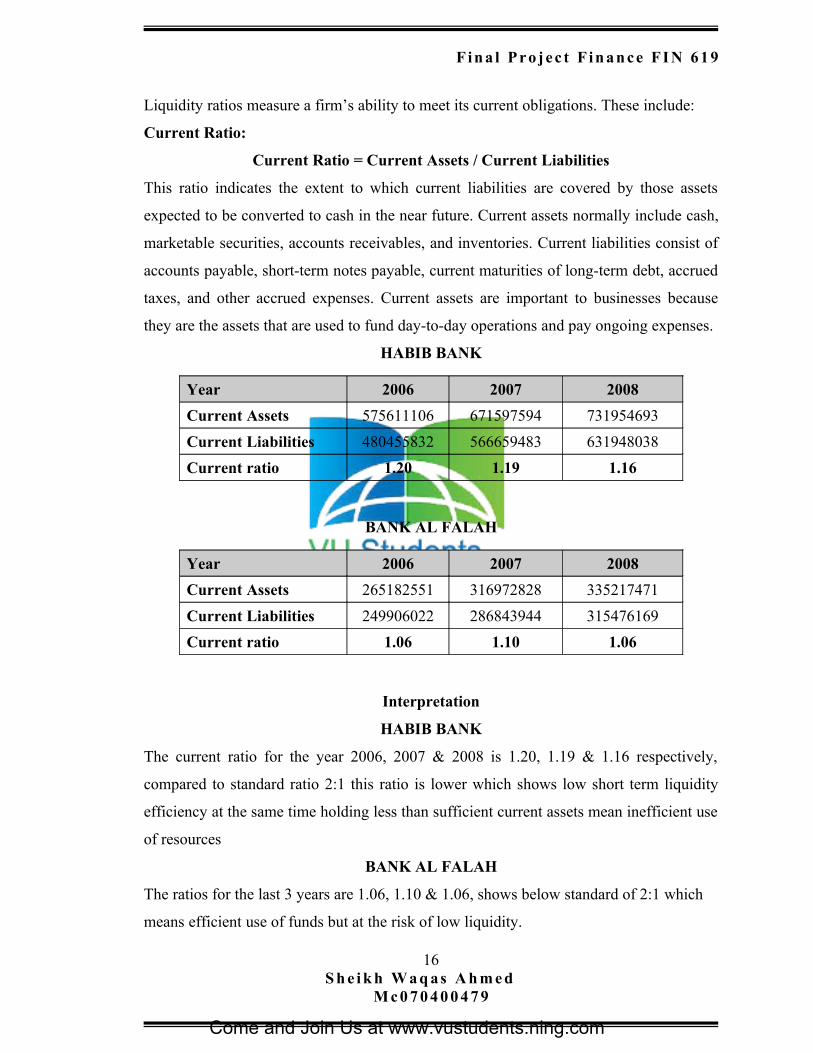
Liquidity ratios measure a firm’s ability to meet its current obligations. These include:
Current Ratio:
Current Ratio = Current Assets / Current Liabilities
This ratio indicates the extent to which current liabilities are covered by those assets
expected to be converted to cash in the near future. Current assets normally include cash,
marketable securities, accounts receivables, and inventories. Current liabilities consist of
accounts payable, short-term notes payable, current maturities of long-term debt, accrued
taxes, and other accrued expenses. Current assets are important to businesses because
they are the assets that are used to fund day-to-day operations and pay ongoing expenses.
HABIB BANK
BANK AL FALAH
Interpretation
HABIB BANK
The current ratio for the year 2006, 2007 & 2008 is 1.20, 1.19 & 1.16 respectively,
compared to standard ratio 2:1 this ratio is lower which shows low short term liquidity
efficiency at the same time holding less than sufficient current assets mean inefficient use
of resources
BANK AL FALAH
The ratios for the last 3 years are 1.06, 1.10 & 1.06, shows below standard of 2:1 which
means efficient use of funds but at the risk of low liquidity.
16S h e i k h W a q as A h m e d
M c 0 7 0 4 0 0 4 7 9
Year 2006 2007 2008
Current Assets 575611106 671597594 731954693
Current Liabilities 480455832 566659483 631948038
Current ratio 1.20 1.19 1.16
Year 2006 2007 2008
Current Assets 265182551 316972828 335217471
Current Liabilities 249906022 286843944 315476169
Current ratio 1.06 1.10 1.06
Come and Join Us at www.vustudents.ning.com
Fin a l Pro jec t F in an ce FI N 619
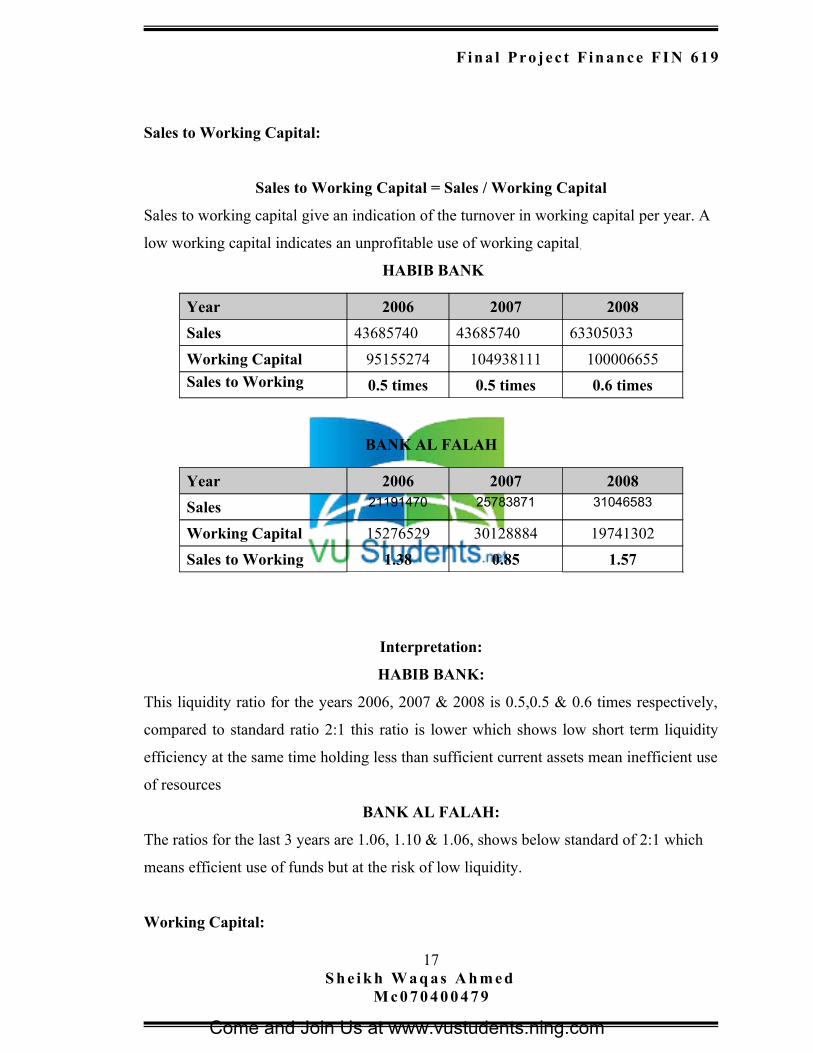
Sales to Working Capital:
Sales to Working Capital = Sales / Working Capital
Sales to working capital give an indication of the turnover in working capital per year. A
low working capital indicates an unprofitable use of working capital.
HABIB BANK
BANK AL FALAH
Interpretation:
HABIB BANK:
This liquidity ratio for the years 2006, 2007 & 2008 is 0.5,0.5 & 0.6 times respectively,
compared to standard ratio 2:1 this ratio is lower which shows low short term liquidity
efficiency at the same time holding less than sufficient current assets mean inefficient use
of resources
BANK AL FALAH:
The ratios for the last 3 years are 1.06, 1.10 & 1.06, shows below standard of 2:1 which
means efficient use of funds but at the risk of low liquidity.
Working Capital:
17S h e i k h W a q as A h m e d
M c 0 7 0 4 0 0 4 7 9
Year 2006 2007 2008
Sales 43685740 43685740 63305033
Working Capital 95155274 104938111 100006655
Sales to Working
Capital
0.5 times 0.5 times 0.6 times
Year 2006 2007 2008
Sales 21191470 25783871 31046583
Working Capital 15276529 30128884 19741302
Sales to Working 1.38 0.85 1.57
Come and Join Us at www.vustudents.ning.com
Fin a l Pro jec t F in an ce FI N 619
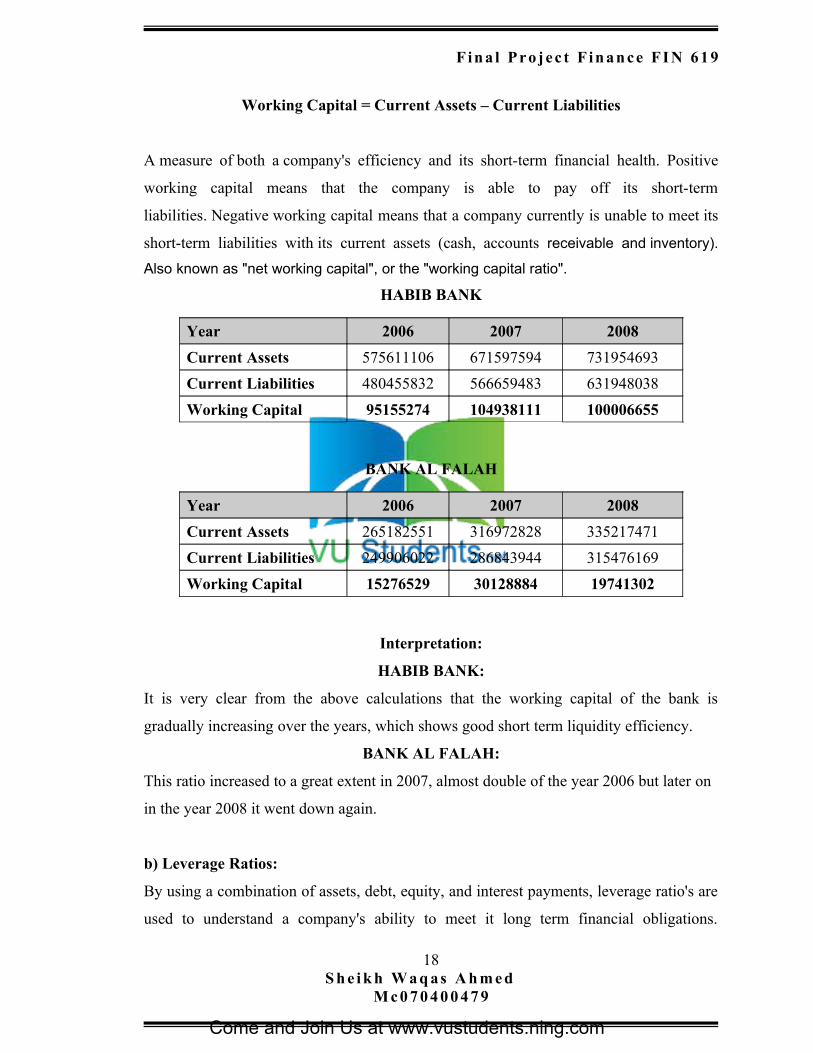
Working Capital = Current Assets – Current Liabilities
A measure of both a company's efficiency and its short-term financial health. Positive
working capital means that the company is able to pay off its short-term
liabilities. Negative working capital means that a company currently is unable to meet its
short-term liabilities with its current assets (cash, accounts receivable and inventory).
Also known as "net working capital", or the "working capital ratio".
HABIB BANK
BANK AL FALAH
Interpretation:
HABIB BANK:
It is very clear from the above calculations that the working capital of the bank is
gradually increasing over the years, which shows good short term liquidity efficiency.
BANK AL FALAH:
This ratio increased to a great extent in 2007, almost double of the year 2006 but later on
in the year 2008 it went down again.
b) Leverage Ratios:
By using a combination of assets, debt, equity, and interest payments, leverage ratio's are
used to understand a company's ability to meet it long term financial obligations.
18S h e i k h W a q as A h m e d
M c 0 7 0 4 0 0 4 7 9
Year 2006 2007 2008
Current Assets 575611106 671597594 731954693
Current Liabilities 480455832 566659483 631948038
Working Capital 95155274 104938111 100006655
Year 2006 2007 2008
Current Assets 265182551 316972828 335217471
Current Liabilities 249906022 286843944 315476169
Working Capital 15276529 30128884 19741302
Come and Join Us at www.vustudents.ning.com
Fin a l Pro jec t F in an ce FI N 619
Leverage ratios measure the degree of protection of suppliers of long term funds. The
level of leverage depends on a lot of factors such as availability of collateral, strength of
operating cash flow and tax treatments. Thus, investors should be careful about
comparing financial leverage between companies from different industries. For example
companies in the banking industry naturally operates with a high leverage as collateral
their assets are easily collateralized.
These include:
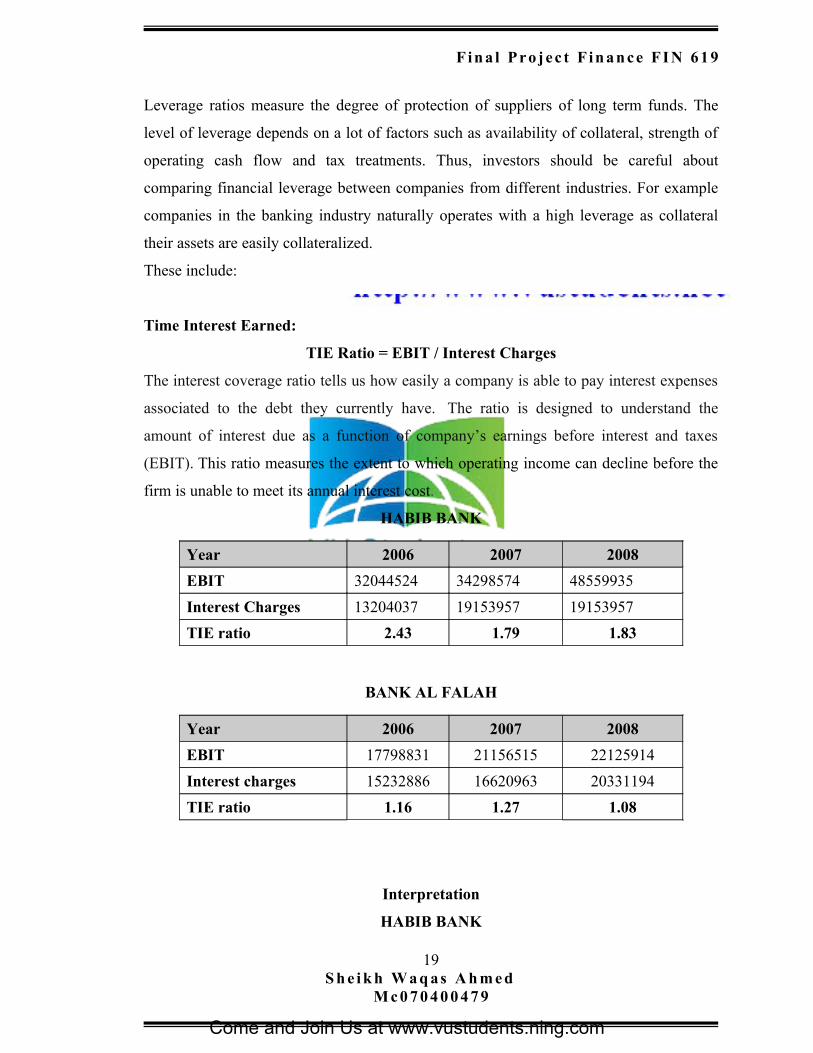
Time Interest Earned:
TIE Ratio = EBIT / Interest Charges
The interest coverage ratio tells us how easily a company is able to pay interest expenses
associated to the debt they currently have. The ratio is designed to understand the
amount of interest due as a function of company’s earnings before interest and taxes
(EBIT). This ratio measures the extent to which operating income can decline before the
firm is unable to meet its annual interest cost.
HABIB BANK
BANK AL FALAH
Interpretation
HABIB BANK
19S h e i k h W a q as A h m e d
M c 0 7 0 4 0 0 4 7 9
Year 2006 2007 2008
EBIT 32044524 34298574 48559935
Interest Charges 13204037 19153957 19153957
TIE ratio 2.43 1.79 1.83
Year 2006 2007 2008
EBIT 17798831 21156515 22125914
Interest charges 15232886 16620963 20331194
TIE ratio 1.16 1.27 1.08
Come and Join Us at www.vustudents.ning.com
Fin a l Pro jec t F in an ce FI N 619
We can see from this ratio analysis that, this company has covered their interest expenses
2.43 times in 2006, 1.79 times in 2007 and 1.8 times in 2008. It means they have
performed pretty much same in 2007 and 2008, but has taken a different look in 2006.
As in 2006 they issued a little high number of long-term loans and does not have good
liquidity position, their EBIT became high thus making TIE a little high as well
BANK AL FALAH
We can see that, this company has covered their interest expenses 1.16 times in 2006,
1.27 times in 2007 and 1.08 times in 2008. It means they haven’t improved in the past
years.
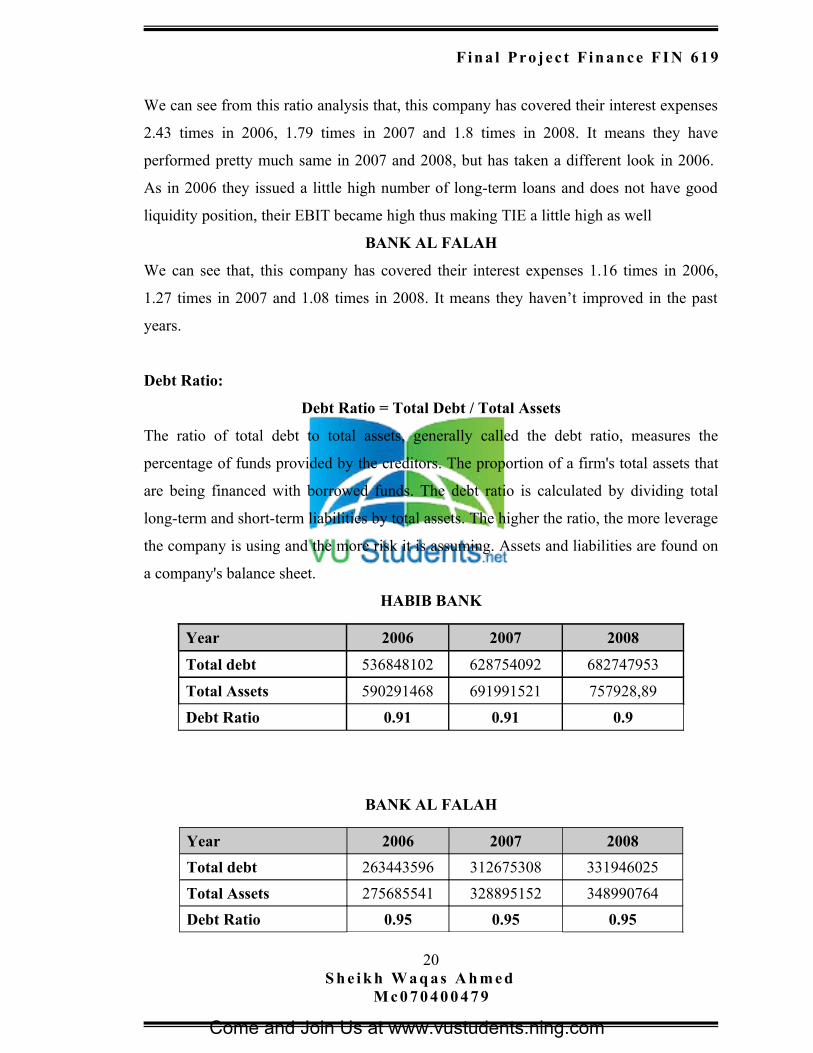
Debt Ratio:
Debt Ratio = Total Debt / Total Assets
The ratio of total debt to total assets, generally called the debt ratio, measures the
percentage of funds provided by the creditors. The proportion of a firm's total assets that
are being financed with borrowed funds. The debt ratio is calculated by dividing total
long-term and short-term liabilities by total assets. The higher the ratio, the more leverage
the company is using and the more risk it is assuming. Assets and liabilities are found on
a company's balance sheet.
HABIB BANK
BANK AL FALAH
20S h e i k h W a q as A h m e d
M c 0 7 0 4 0 0 4 7 9
Year 2006 2007 2008
Total debt 536848102 628754092 682747953
Total Assets 590291468 691991521 757928,89
Debt Ratio 0.91 0.91 0.9
Year 2006 2007 2008
Total debt 263443596 312675308 331946025
Total Assets 275685541 328895152 348990764
Debt Ratio 0.95 0.95 0.95
Come and Join Us at www.vustudents.ning.com
Fin a l Pro jec t F in an ce FI N 619
Interpretation:
HABIB BANK
Calculating the debt ratio, we came to see that this company is highly leveraged one
BANK AL FALAH
Calculating the debt ratio, we came to see that this company is highly leveraged one.
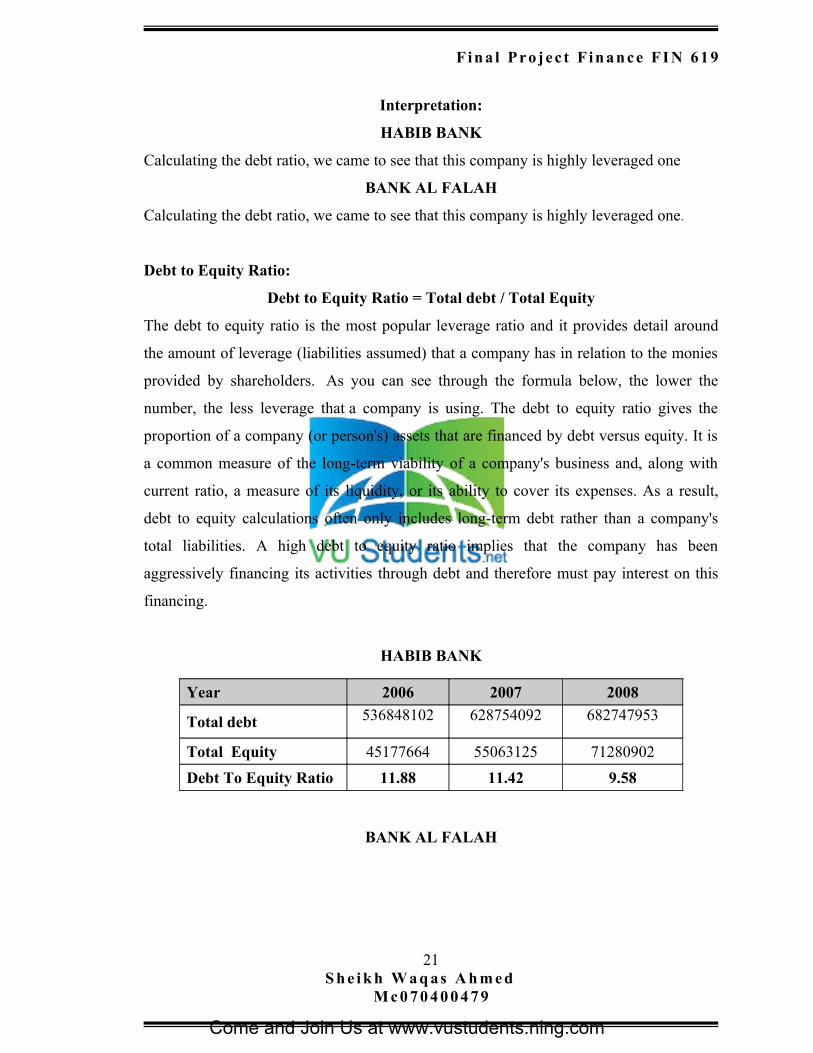
Debt to Equity Ratio:
Debt to Equity Ratio = Total debt / Total Equity
The debt to equity ratio is the most popular leverage ratio and it provides detail around
the amount of leverage (liabilities assumed) that a company has in relation to the monies
provided by shareholders. As you can see through the formula below, the lower the
number, the less leverage that a company is using. The debt to equity ratio gives the
proportion of a company (or person's) assets that are financed by debt versus equity. It is
a common measure of the long-term viability of a company's business and, along with
current ratio, a measure of its liquidity, or its ability to cover its expenses. As a result,
debt to equity calculations often only includes long-term debt rather than a company's
total liabilities. A high debt to equity ratio implies that the company has been
aggressively financing its activities through debt and therefore must pay interest on this
financing.
HABIB BANK
BANK AL FALAH
21S h e i k h W a q as A h m e d
M c 0 7 0 4 0 0 4 7 9
Year 2006 2007 2008
Total debt 536848102 628754092 682747953
Total Equity 45177664 55063125 71280902
Debt To Equity Ratio 11.88 11.42 9.58
Come and Join Us at www.vustudents.ning.com
Fin a l Pro jec t F in an ce FI N 619
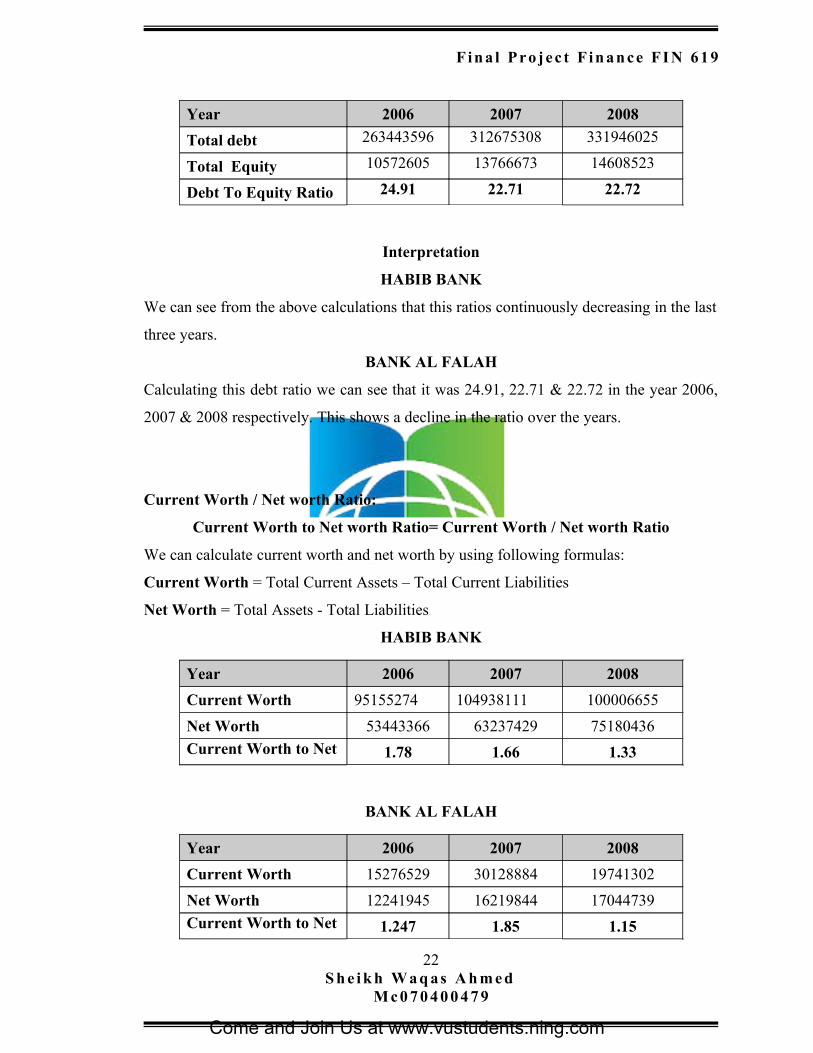
Interpretation
HABIB BANK
We can see from the above calculations that this ratios continuously decreasing in the last
three years.
BANK AL FALAH
Calculating this debt ratio we can see that it was 24.91, 22.71 & 22.72 in the year 2006,
2007 & 2008 respectively. This shows a decline in the ratio over the years.
Current Worth / Net worth Ratio:
Current Worth to Net worth Ratio= Current Worth / Net worth Ratio
We can calculate current worth and net worth by using following formulas:
Current Worth = Total Current Assets – Total Current Liabilities
Net Worth = Total Assets - Total Liabilities
HABIB BANK
BANK AL FALAH
22S h e i k h W a q as A h m e d
M c 0 7 0 4 0 0 4 7 9
Year 2006 2007 2008
Total debt 263443596 312675308 331946025
Total Equity 10572605 13766673 14608523
Debt To Equity Ratio 24.91 22.71 22.72
Year 2006 2007 2008
Current Worth 95155274 104938111 100006655
Net Worth 53443366 63237429 75180436
Current Worth to Net
worth Ratio
1.78 1.66 1.33
Year 2006 2007 2008
Current Worth 15276529 30128884 19741302
Net Worth 12241945 16219844 17044739
Current Worth to Net
worth Ratio
1.247 1.85 1.15
Come and Join Us at www.vustudents.ning.com
Fin a l Pro jec t F in an ce FI N 619
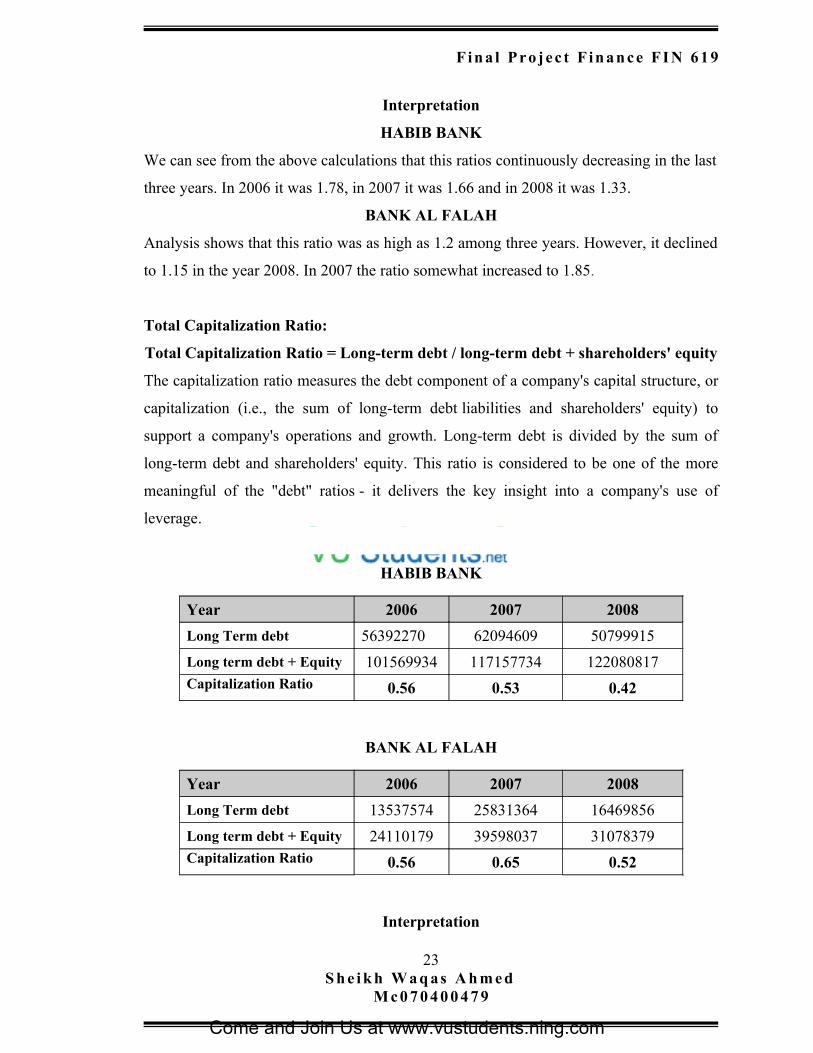
Interpretation
HABIB BANK
We can see from the above calculations that this ratios continuously decreasing in the last
three years. In 2006 it was 1.78, in 2007 it was 1.66 and in 2008 it was 1.33.
BANK AL FALAH
Analysis shows that this ratio was as high as 1.2 among three years. However, it declined
to 1.15 in the year 2008. In 2007 the ratio somewhat increased to 1.85.
Total Capitalization Ratio:
Total Capitalization Ratio = Long-term debt / long-term debt + shareholders' equity
The capitalization ratio measures the debt component of a company's capital structure, or
capitalization (i.e., the sum of long-term debt liabilities and shareholders' equity) to
support a company's operations and growth. Long-term debt is divided by the sum of
long-term debt and shareholders' equity. This ratio is considered to be one of the more
meaningful of the "debt" ratios - it delivers the key insight into a company's use of
leverage.
HABIB BANK
BANK AL FALAH
Interpretation
23S h e i k h W a q as A h m e d
M c 0 7 0 4 0 0 4 7 9
Year 2006 2007 2008
Long Term debt 56392270 62094609 50799915
Long term debt + Equity 101569934 117157734 122080817Capitalization Ratio
worth Ratio
0.56 0.53 0.42
Year 2006 2007 2008
Long Term debt 13537574 25831364 16469856
Long term debt + Equity 24110179 39598037 31078379Capitalization Ratio
worth Ratio
0.56 0.65 0.52
Come and Join Us at www.vustudents.ning.com
Fin a l Pro jec t F in an ce FI N 619
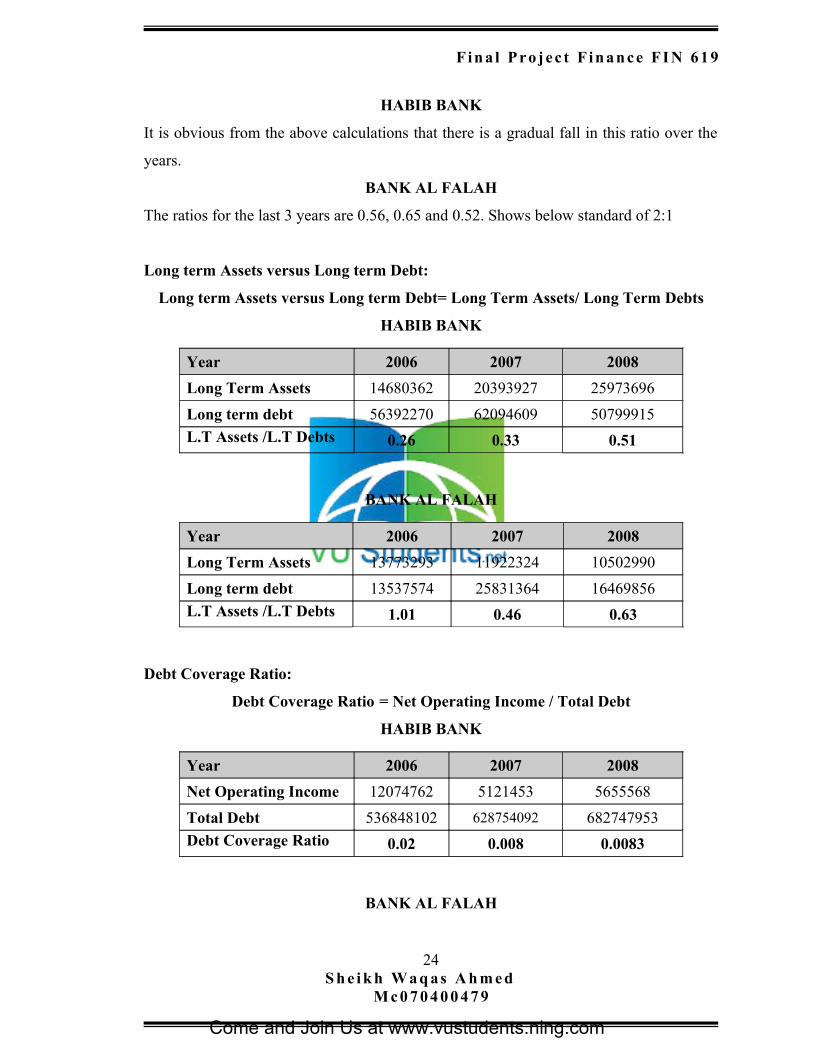
HABIB BANK
It is obvious from the above calculations that there is a gradual fall in this ratio over the
years.
BANK AL FALAH
The ratios for the last 3 years are 0.56, 0.65 and 0.52. Shows below standard of 2:1
Long term Assets versus Long term Debt:
Long term Assets versus Long term Debt= Long Term Assets/ Long Term Debts
HABIB BANK
BANK AL FALAH
Debt Coverage Ratio:
Debt Coverage Ratio = Net Operating Income / Total Debt
HABIB BANK
BANK AL FALAH
24S h e i k h W a q as A h m e d
M c 0 7 0 4 0 0 4 7 9
Year 2006 2007 2008
Long Term Assets 14680362 20393927 25973696
Long term debt 56392270 62094609 50799915
L.T Assets /L.T Debts
Debt:worth Ratio
0.26 0.33 0.51
Year 2006 2007 2008
Long Term Assets 13773293 11922324 10502990
Long term debt 13537574 25831364 16469856
L.T Assets /L.T Debts
worth Ratio
1.01 0.46 0.63
Year 2006 2007 2008
Net Operating Income 12074762 5121453 5655568
Total Debt 536848102 628754092 682747953
Debt Coverage Ratio
Debt:worth Ratio
0.02 0.008 0.0083
Come and Join Us at www.vustudents.ning.com
Fin a l Pro jec t F in an ce FI N 619
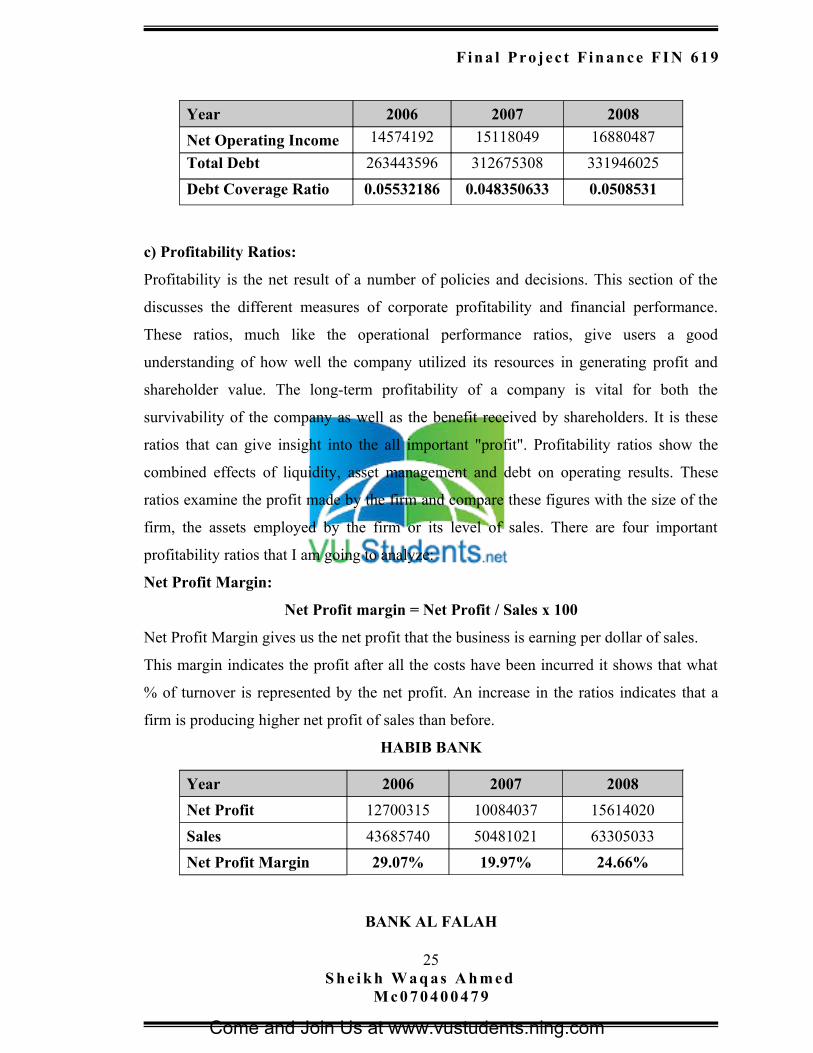
c) Profitability Ratios:
Profitability is the net result of a number of policies and decisions. This section of the
discusses the different measures of corporate profitability and financial performance.
These ratios, much like the operational performance ratios, give users a good
understanding of how well the company utilized its resources in generating profit and
shareholder value. The long-term profitability of a company is vital for both the
survivability of the company as well as the benefit received by shareholders. It is these
ratios that can give insight into the all important "profit". Profitability ratios show the
combined effects of liquidity, asset management and debt on operating results. These
ratios examine the profit made by the firm and compare these figures with the size of the
firm, the assets employed by the firm or its level of sales. There are four important
profitability ratios that I am going to analyze:
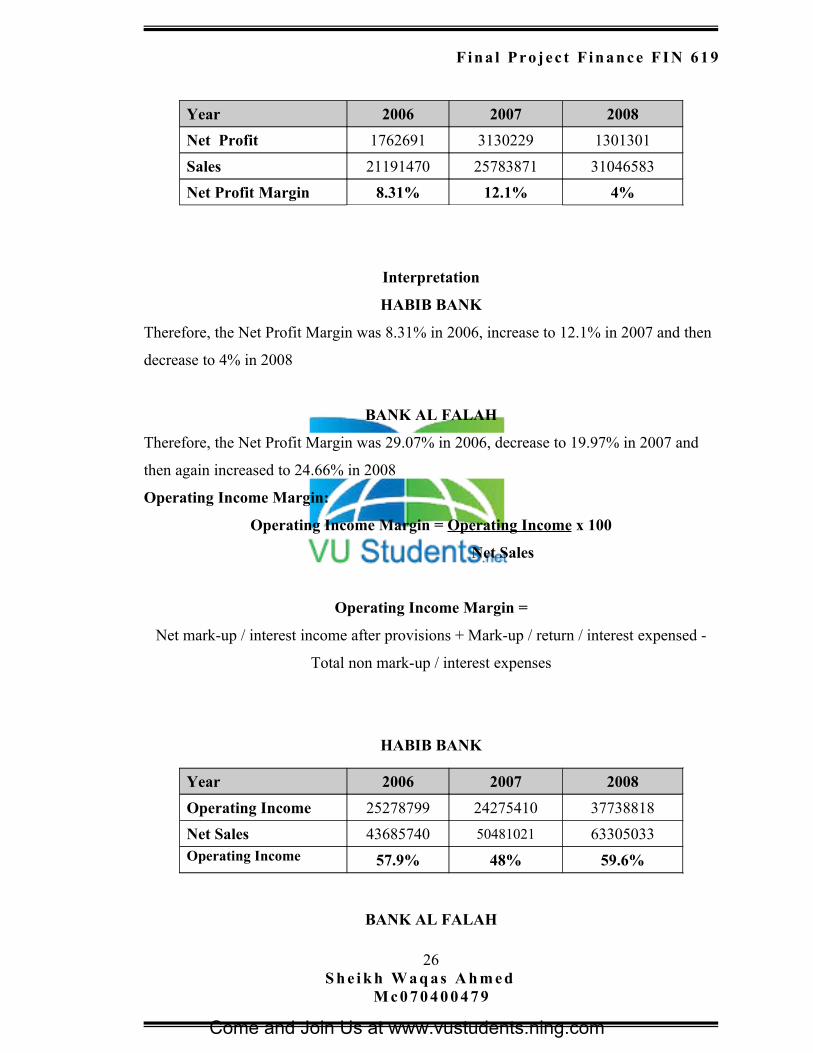
Net Profit Margin:
Net Profit margin = Net Profit / Sales x 100
Net Profit Margin gives us the net profit that the business is earning per dollar of sales.
This margin indicates the profit after all the costs have been incurred it shows that what
% of turnover is represented by the net profit. An increase in the ratios indicates that a
firm is producing higher net profit of sales than before.
HABIB BANK
BANK AL FALAH
25S h e i k h W a q as A h m e d
M c 0 7 0 4 0 0 4 7 9
Year 2006 2007 2008
Net Operating Income 14574192 15118049 16880487
Total Debt 263443596 312675308 331946025
Debt Coverage Ratio
worth Ratio
0.05532186
9
0.048350633 0.0508531
Year 2006 2007 2008
Net Profit 12700315 10084037 15614020
Sales 43685740 50481021 63305033
Net Profit Margin 29.07% 19.97% 24.66%
Come and Join Us at www.vustudents.ning.com
Fin a l Pro jec t F in an ce FI N 619
Interpretation
HABIB BANK
Therefore, the Net Profit Margin was 8.31% in 2006, increase to 12.1% in 2007 and then
decrease to 4% in 2008
BANK AL FALAH
Therefore, the Net Profit Margin was 29.07% in 2006, decrease to 19.97% in 2007 and
then again increased to 24.66% in 2008
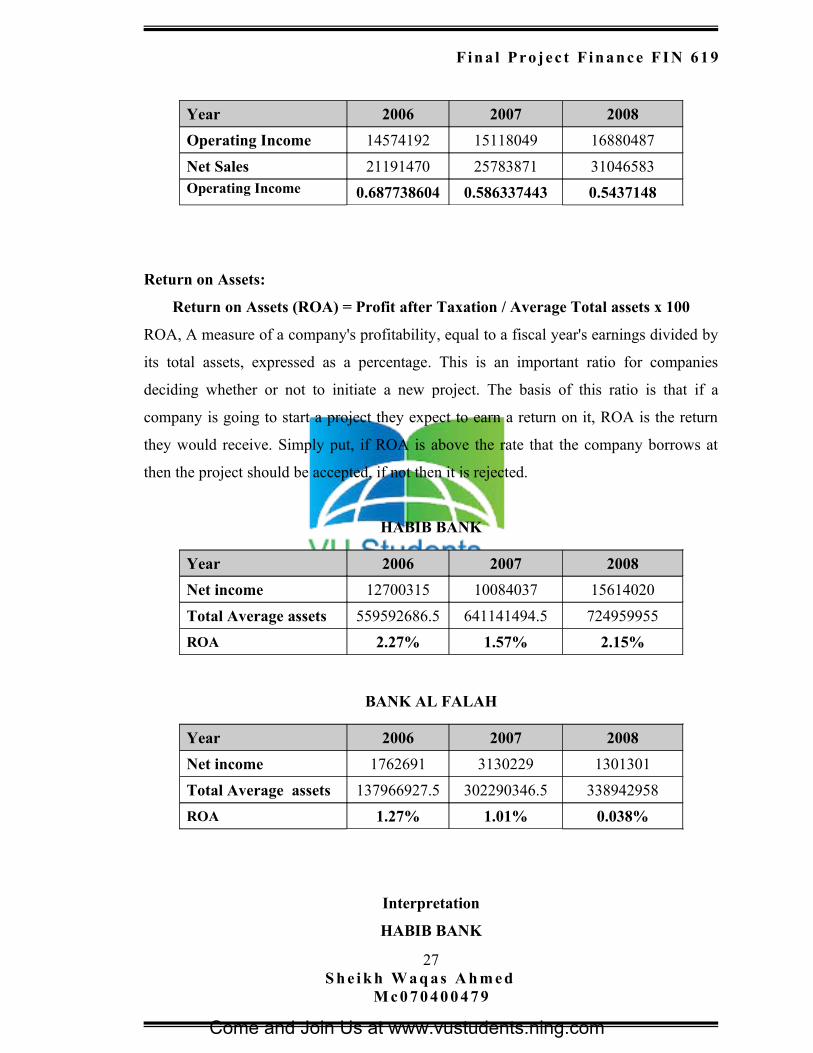
Operating Income Margin:
Operating Income Margin = Operating Income x 100
Net Sales
Operating Income Margin =
Net mark-up / interest income after provisions + Mark-up / return / interest expensed -
Total non mark-up / interest expenses
HABIB BANK
BANK AL FALAH
26S h e i k h W a q as A h m e d
M c 0 7 0 4 0 0 4 7 9
Year 2006 2007 2008
Net Profit 1762691 3130229 1301301
Sales 21191470 25783871 31046583
Net Profit Margin 8.31% 12.1% 4%
Year 2006 2007 2008
Operating Income 25278799 24275410 37738818
Net Sales 43685740 50481021 63305033Operating Income
Margin
57.9% 48% 59.6%
Come and Join Us at www.vustudents.ning.com
Fin a l Pro jec t F in an ce FI N 619
Return on Assets:
Return on Assets (ROA) = Profit after Taxation / Average Total assets x 100
ROA, A measure of a company's profitability, equal to a fiscal year's earnings divided by
its total assets, expressed as a percentage. This is an important ratio for companies
deciding whether or not to initiate a new project. The basis of this ratio is that if a
company is going to start a project they expect to earn a return on it, ROA is the return
they would receive. Simply put, if ROA is above the rate that the company borrows at
then the project should be accepted, if not then it is rejected.
HABIB BANK
BANK AL FALAH
Interpretation
HABIB BANK
27S h e i k h W a q as A h m e d
M c 0 7 0 4 0 0 4 7 9
Year 2006 2007 2008
Operating Income 14574192 15118049 16880487
Net Sales 21191470 25783871 31046583Operating Income
Margin
0.687738604 0.586337443 0.5437148
Year 2006 2007 2008
Net income 12700315 10084037 15614020
Total Average assets 559592686.5 641141494.5 724959955
ROA 2.27% 1.57% 2.15%
Year 2006 2007 2008
Net income 1762691 3130229 1301301
Total Average assets 137966927.5 302290346.5 338942958
ROA 1.27% 1.01% 0.038%
Come and Join Us at www.vustudents.ning.com
Fin a l Pro jec t F in an ce FI N 619
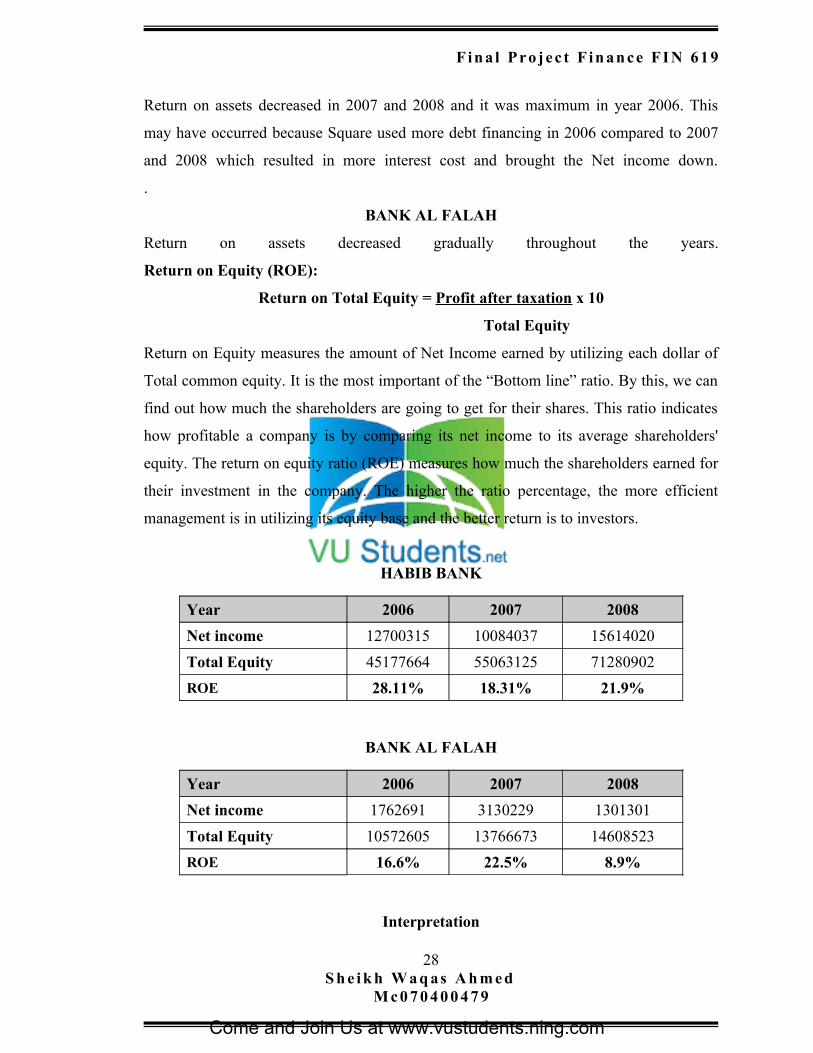
Return on assets decreased in 2007 and 2008 and it was maximum in year 2006. This
may have occurred because Square used more debt financing in 2006 compared to 2007
and 2008 which resulted in more interest cost and brought the Net income down.
.
BANK AL FALAH
Return on assets decreased gradually throughout the years.
Return on Equity (ROE):
Return on Total Equity = Profit after taxation x 10
Total Equity
Return on Equity measures the amount of Net Income earned by utilizing each dollar of
Total common equity. It is the most important of the “Bottom line” ratio. By this, we can
find out how much the shareholders are going to get for their shares. This ratio indicates
how profitable a company is by comparing its net income to its average shareholders'
equity. The return on equity ratio (ROE) measures how much the shareholders earned for
their investment in the company. The higher the ratio percentage, the more efficient
management is in utilizing its equity base and the better return is to investors.
HABIB BANK
BANK AL FALAH
Interpretation
28S h e i k h W a q as A h m e d
M c 0 7 0 4 0 0 4 7 9
Year 2006 2007 2008
Net income 12700315 10084037 15614020
Total Equity 45177664 55063125 71280902
ROE 28.11% 18.31% 21.9%
Year 2006 2007 2008
Net income 1762691 3130229 1301301
Total Equity 10572605 13766673 14608523
ROE 16.6% 22.5% 8.9%
Come and Join Us at www.vustudents.ning.com
Fin a l Pro jec t F in an ce FI N 619
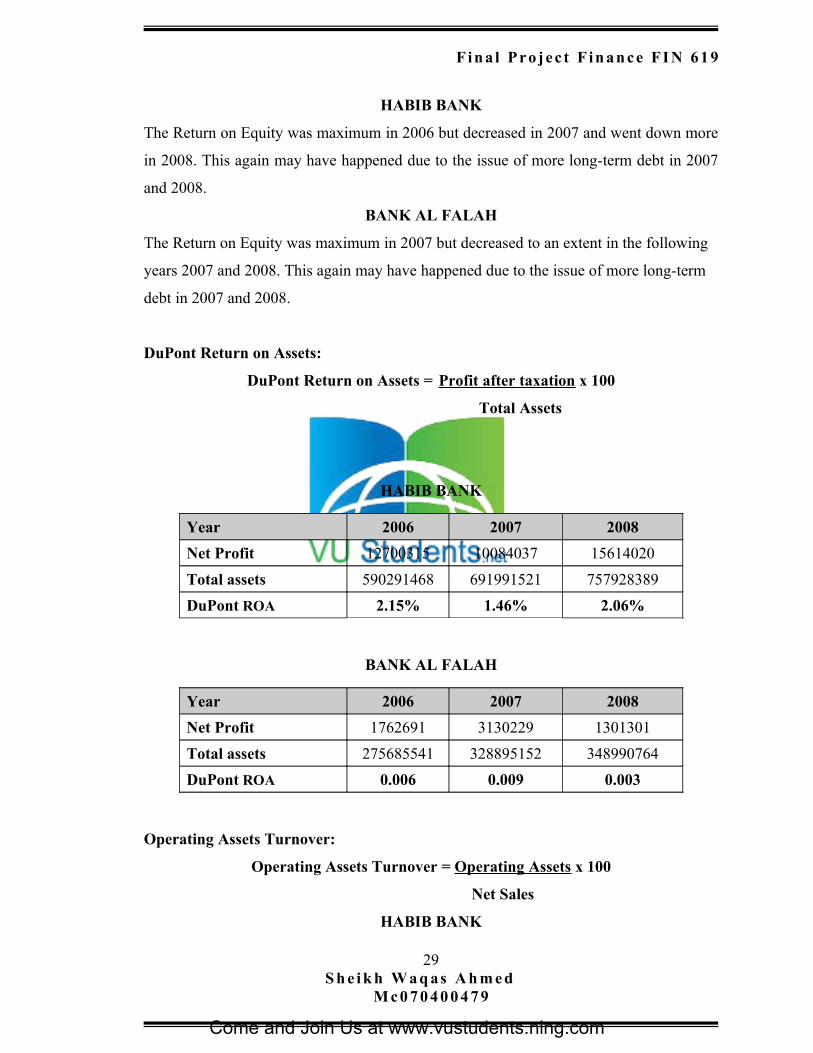
HABIB BANK
The Return on Equity was maximum in 2006 but decreased in 2007 and went down more
in 2008. This again may have happened due to the issue of more long-term debt in 2007
and 2008.
BANK AL FALAH
The Return on Equity was maximum in 2007 but decreased to an extent in the following
years 2007 and 2008. This again may have happened due to the issue of more long-term
debt in 2007 and 2008.
DuPont Return on Assets:
DuPont Return on Assets = Profit after taxation x 100
Total Assets
HABIB BANK
BANK AL FALAH
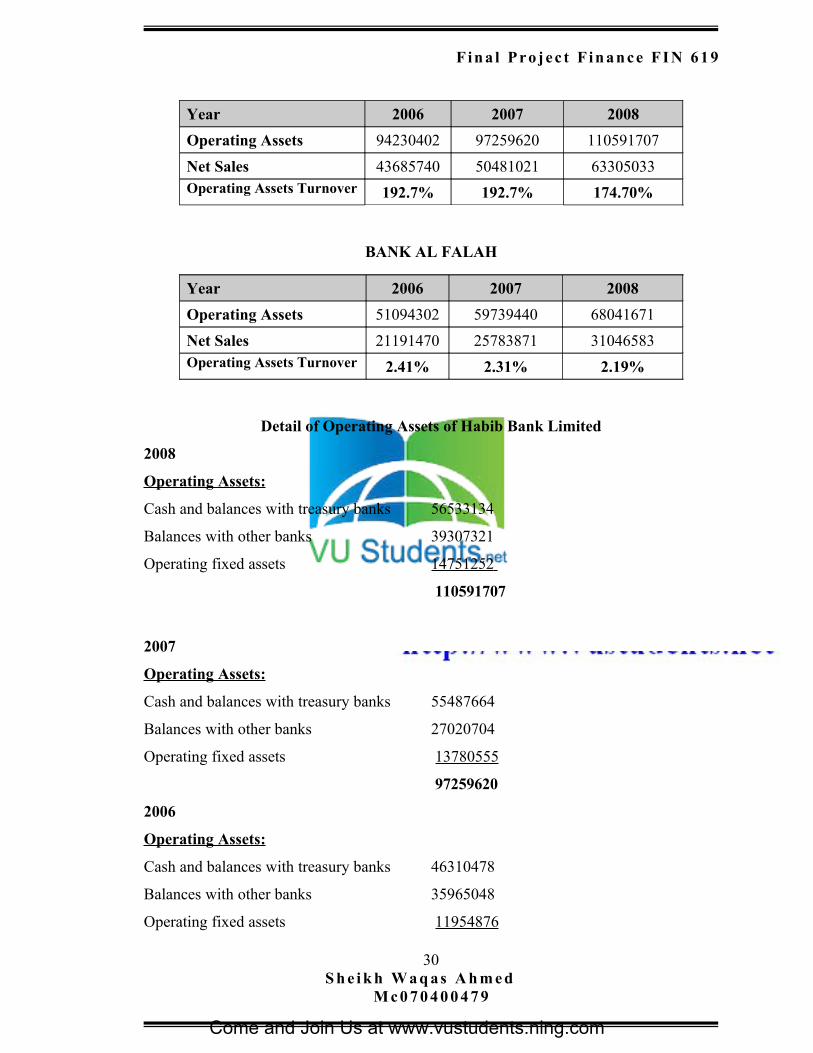
Operating Assets Turnover:
Operating Assets Turnover = Operating Assets x 100
Net Sales
HABIB BANK
29S h e i k h W a q as A h m e d
M c 0 7 0 4 0 0 4 7 9
Year 2006 2007 2008
Net Profit 12700315 10084037 15614020
Total assets 590291468 691991521 757928389
DuPont ROA 2.15% 1.46% 2.06%
Year 2006 2007 2008
Net Profit 1762691 3130229 1301301
Total assets 275685541 328895152 348990764
DuPont ROA 0.006 0.009 0.003
Come and Join Us at www.vustudents.ning.com
Fin a l Pro jec t F in an ce FI N 619
BANK AL FALAH
Detail of Operating Assets of Habib Bank Limited
2008
Operating Assets:
Cash and balances with treasury banks 56533134
Balances with other banks 39307321
Operating fixed assets 14751252
110591707
2007
Operating Assets:
Cash and balances with treasury banks 55487664
Balances with other banks 27020704
Operating fixed assets 13780555
97259620
2006
Operating Assets:
Cash and balances with treasury banks 46310478
Balances with other banks 35965048
Operating fixed assets 11954876
30S h e i k h W a q as A h m e d
M c 0 7 0 4 0 0 4 7 9
Year 2006 2007 2008
Operating Assets 94230402 97259620 110591707
Net Sales 43685740 50481021 63305033Operating Assets Turnover
Margin
192.7% 192.7% 174.70%
Year 2006 2007 2008
Operating Assets 51094302 59739440 68041671
Net Sales 21191470 25783871 31046583Operating Assets Turnover
Margin
2.41% 2.31% 2.19%
Come and Join Us at www.vustudents.ning.com
Fin a l Pro jec t F in an ce FI N 619
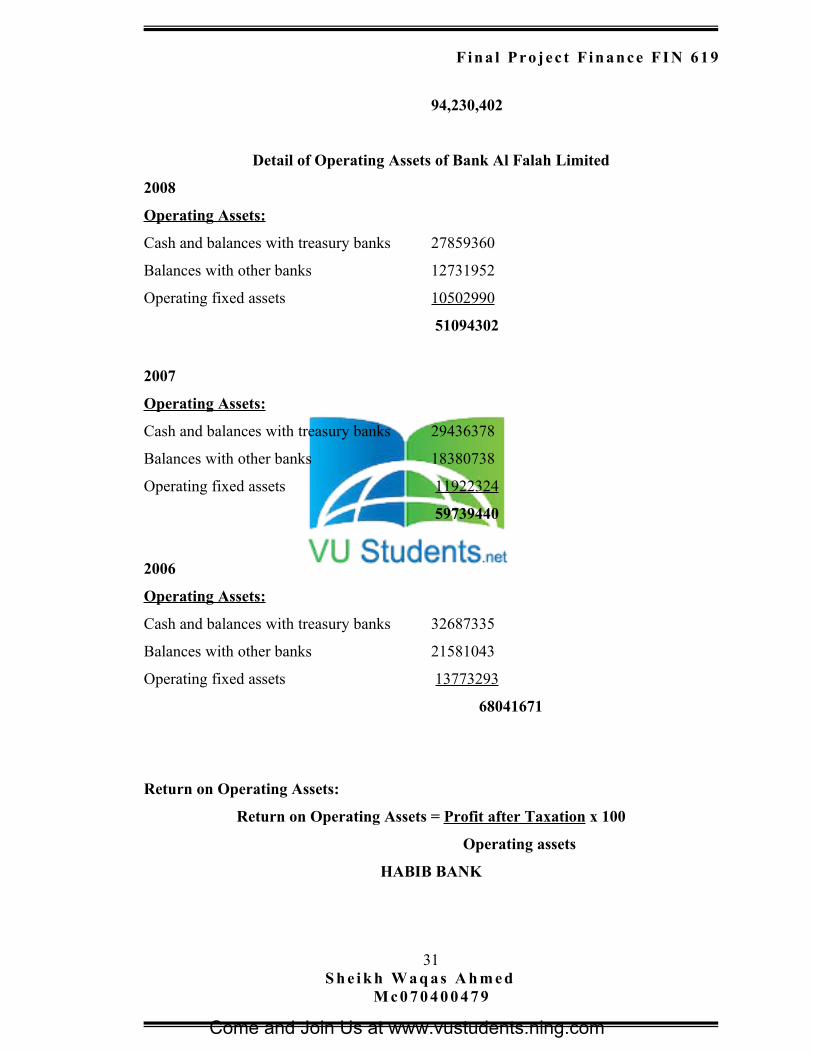
94,230,402
Detail of Operating Assets of Bank Al Falah Limited
2008
Operating Assets:
Cash and balances with treasury banks 27859360
Balances with other banks 12731952
Operating fixed assets 10502990
51094302
2007
Operating Assets:
Cash and balances with treasury banks 29436378
Balances with other banks 18380738
Operating fixed assets 11922324
59739440
2006
Operating Assets:
Cash and balances with treasury banks 32687335
Balances with other banks 21581043
Operating fixed assets 13773293
68041671
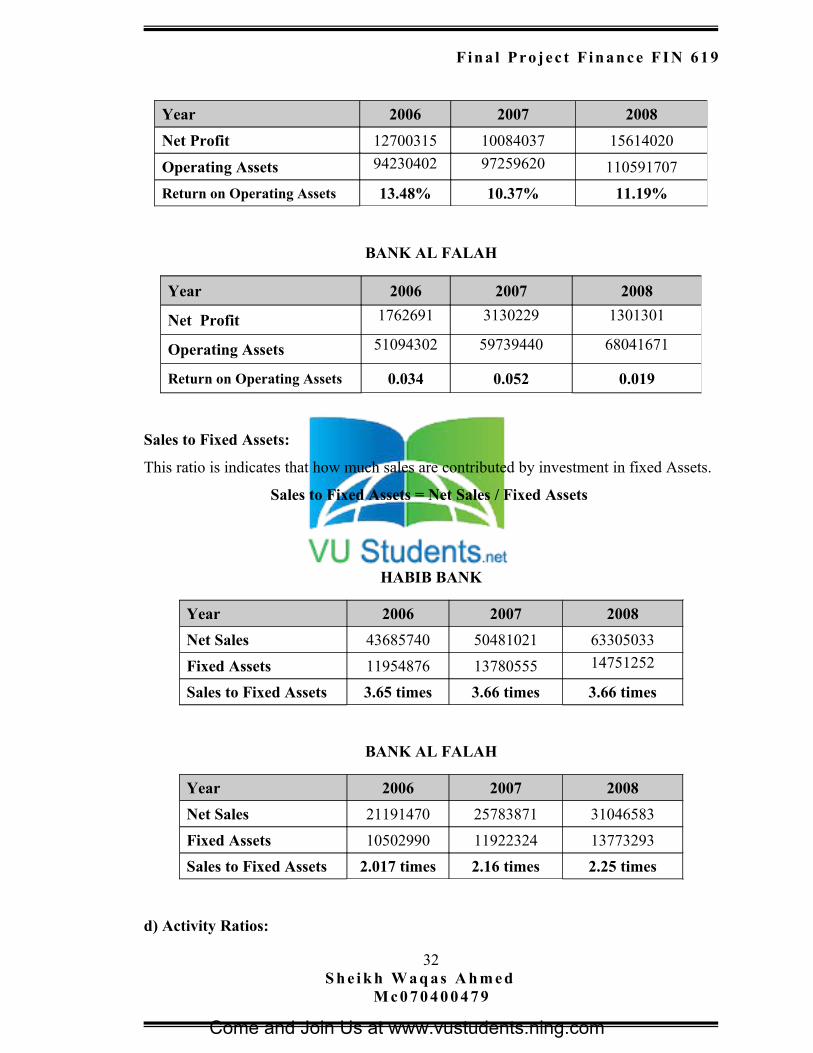
Return on Operating Assets:
Return on Operating Assets = Profit after Taxation x 100
Operating assets
HABIB BANK
31S h e i k h W a q as A h m e d
M c 0 7 0 4 0 0 4 7 9
Come and Join Us at www.vustudents.ning.com
Fin a l Pro jec t F in an ce FI N 619
BANK AL FALAH
Sales to Fixed Assets:
This ratio is indicates that how much sales are contributed by investment in fixed Assets.
Sales to Fixed Assets = Net Sales / Fixed Assets
HABIB BANK
BANK AL FALAH
d) Activity Ratios:
32S h e i k h W a q as A h m e d
M c 0 7 0 4 0 0 4 7 9
Year 2006 2007 2008
Net Profit 12700315 10084037 15614020
Operating Assets 94230402 97259620 110591707
Return on Operating Assets 13.48% 10.37% 11.19%
Year 2006 2007 2008
Net Profit 1762691 3130229 1301301
Operating Assets 51094302 59739440 68041671
Return on Operating Assets 0.034 0.052 0.019
Year 2006 2007 2008
Net Sales 43685740 50481021 63305033
Fixed Assets 11954876 13780555 14751252
Sales to Fixed Assets 3.65 times 3.66 times 3.66 times
Year 2006 2007 2008
Net Sales 21191470 25783871 31046583
Fixed Assets 10502990 11922324 13773293
Sales to Fixed Assets 2.017 times 2.16 times 2.25 times
Come and Join Us at www.vustudents.ning.com
Fin a l Pro jec t F in an ce FI N 619
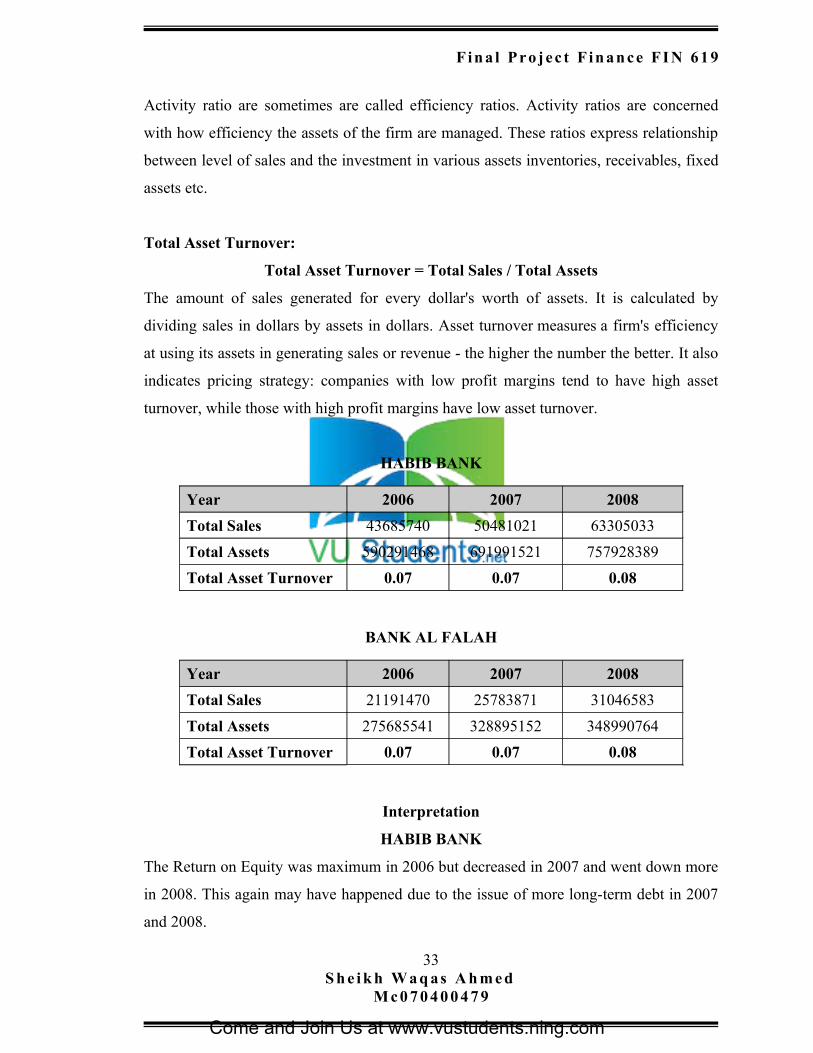
Activity ratio are sometimes are called efficiency ratios. Activity ratios are concerned
with how efficiency the assets of the firm are managed. These ratios express relationship
between level of sales and the investment in various assets inventories, receivables, fixed
assets etc.
Total Asset Turnover:
Total Asset Turnover = Total Sales / Total Assets
The amount of sales generated for every dollar's worth of assets. It is calculated by
dividing sales in dollars by assets in dollars. Asset turnover measures a firm's efficiency
at using its assets in generating sales or revenue - the higher the number the better. It also
indicates pricing strategy: companies with low profit margins tend to have high asset
turnover, while those with high profit margins have low asset turnover.
HABIB BANK
BANK AL FALAH
Interpretation
HABIB BANK
The Return on Equity was maximum in 2006 but decreased in 2007 and went down more
in 2008. This again may have happened due to the issue of more long-term debt in 2007
and 2008.
33S h e i k h W a q as A h m e d
M c 0 7 0 4 0 0 4 7 9
Year 2006 2007 2008
Total Sales 43685740 50481021 63305033
Total Assets 590291468 691991521 757928389
Total Asset Turnover 0.07 0.07 0.08
Year 2006 2007 2008
Total Sales 21191470 25783871 31046583
Total Assets 275685541 328895152 348990764
Total Asset Turnover 0.07 0.07 0.08
Come and Join Us at www.vustudents.ning.com
Fin a l Pro jec t F in an ce FI N 619
BANK AL FALAH
The Return on Equity was maximum in 2007 but decreased to an extent in the following
years 2007 and 2008. This again may have
e) Market Ratio:
Market Value Ratios relate an observable market value, the stock price, to book values
obtained from the firm's financial statements.
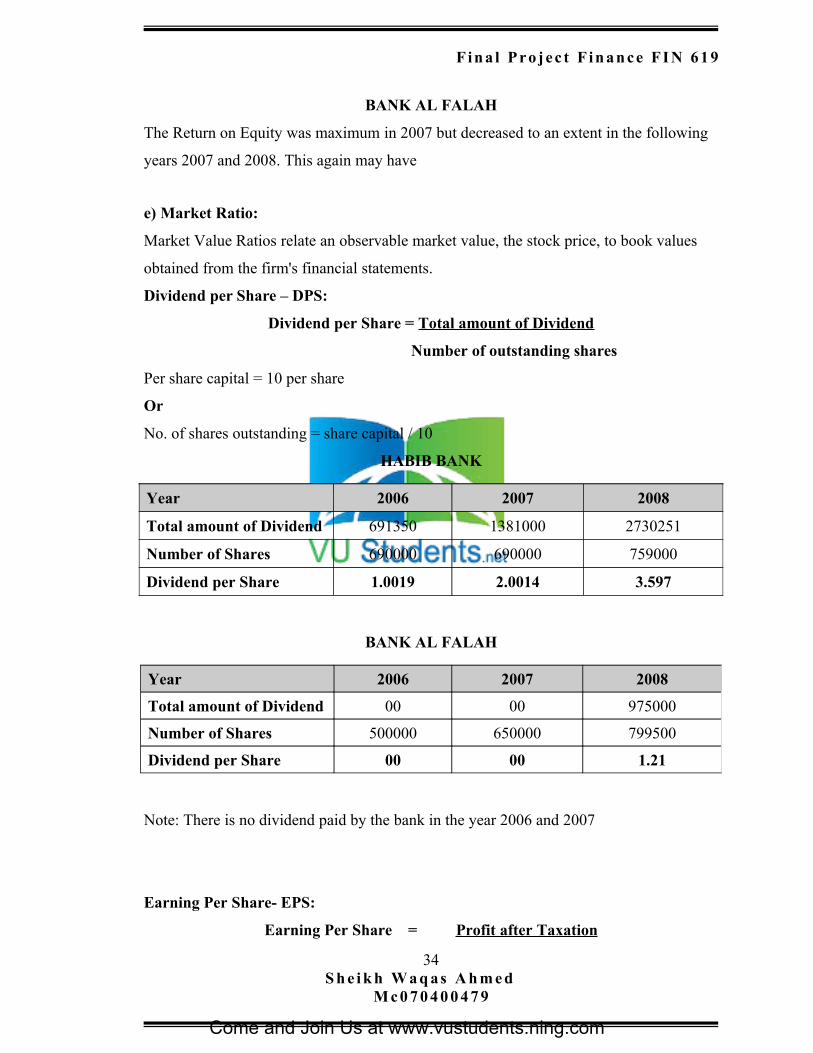
Dividend per Share – DPS:
Dividend per Share = Total amount of Dividend
Number of outstanding shares
Per share capital = 10 per share
Or
No. of shares outstanding = share capital / 10
HABIB BANK
BANK AL FALAH
Note: There is no dividend paid by the bank in the year 2006 and 2007
Earning Per Share- EPS:
Earning Per Share = Profit after Taxation
34S h e i k h W a q as A h m e d
M c 0 7 0 4 0 0 4 7 9
Year 2006 2007 2008
Total amount of Dividend 691350 1381000 2730251
Number of Shares 690000 690000 759000
Dividend per Share 1.0019 2.0014 3.597
Year 2006 2007 2008
Total amount of Dividend 00 00 975000
Number of Shares 500000 650000 799500
Dividend per Share 00 00 1.21
Come and Join Us at www.vustudents.ning.com
Fin a l Pro jec t F in an ce FI N 619
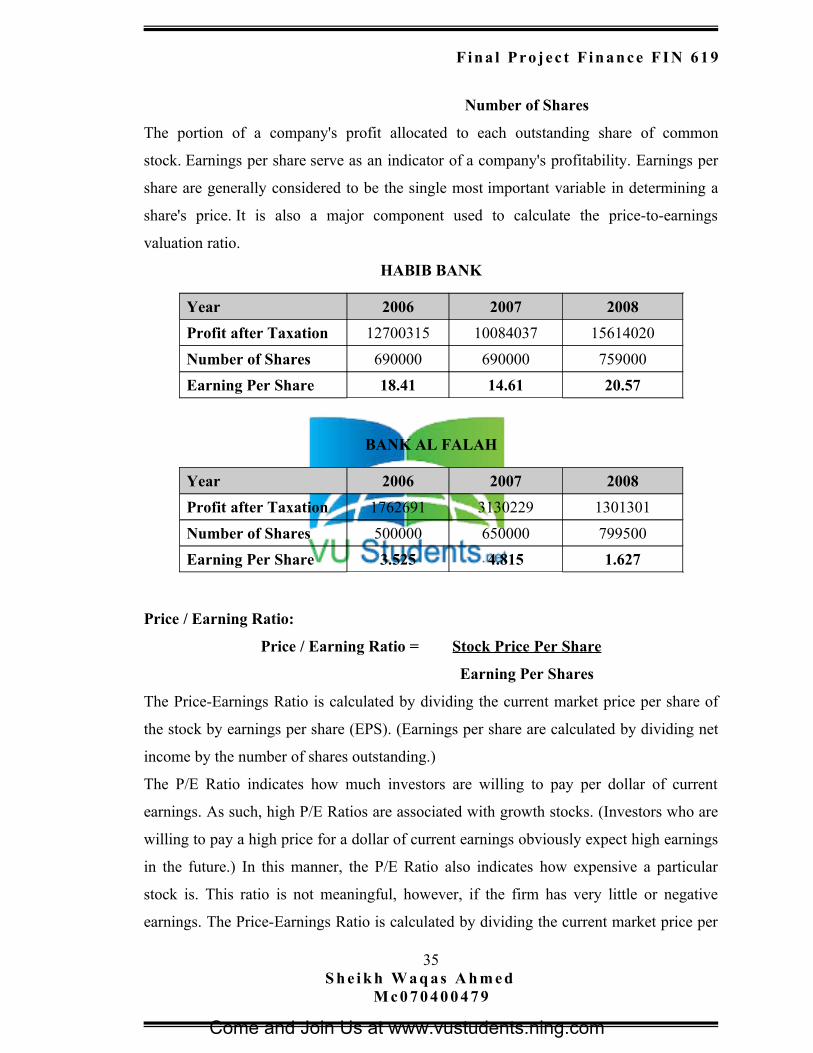
Number of Shares
The portion of a company's profit allocated to each outstanding share of common
stock. Earnings per share serve as an indicator of a company's profitability. Earnings per
share are generally considered to be the single most important variable in determining a
share's price. It is also a major component used to calculate the price-to-earnings
valuation ratio.
HABIB BANK
BANK AL FALAH
Price / Earning Ratio:
Price / Earning Ratio = Stock Price Per Share
Earning Per Shares
The Price-Earnings Ratio is calculated by dividing the current market price per share of
the stock by earnings per share (EPS). (Earnings per share are calculated by dividing net
income by the number of shares outstanding.)
The P/E Ratio indicates how much investors are willing to pay per dollar of current
earnings. As such, high P/E Ratios are associated with growth stocks. (Investors who are
willing to pay a high price for a dollar of current earnings obviously expect high earnings
in the future.) In this manner, the P/E Ratio also indicates how expensive a particular
stock is. This ratio is not meaningful, however, if the firm has very little or negative
earnings. The Price-Earnings Ratio is calculated by dividing the current market price per
35S h e i k h W a q as A h m e d
M c 0 7 0 4 0 0 4 7 9
Year 2006 2007 2008
Profit after Taxation 12700315 10084037 15614020
Number of Shares 690000 690000 759000
Earning Per Share 18.41 14.61 20.57
Year 2006 2007 2008
Profit after Taxation 1762691 3130229 1301301
Number of Shares 500000 650000 799500
Earning Per Share 3.525 4.815 1.627
Come and Join Us at www.vustudents.ning.com
Fin a l Pro jec t F in an ce FI N 619
share of the stock by earnings per share (EPS). (Earnings per share are calculated by
dividing net income by the number of shares outstanding.) The P/E Ratio indicates how
much investors are willing to pay per dollar of current earnings. As such, high P/E Ratios
are associated with growth stocks. (Investors who are willing to pay a high price for a
dollar of current earnings obviously expect high earnings in the future.) In this manner,
the P/E Ratio also indicates how expensive a particular stock is. This ratio is not
meaningful, however, if the firm has very little or negative earnings.
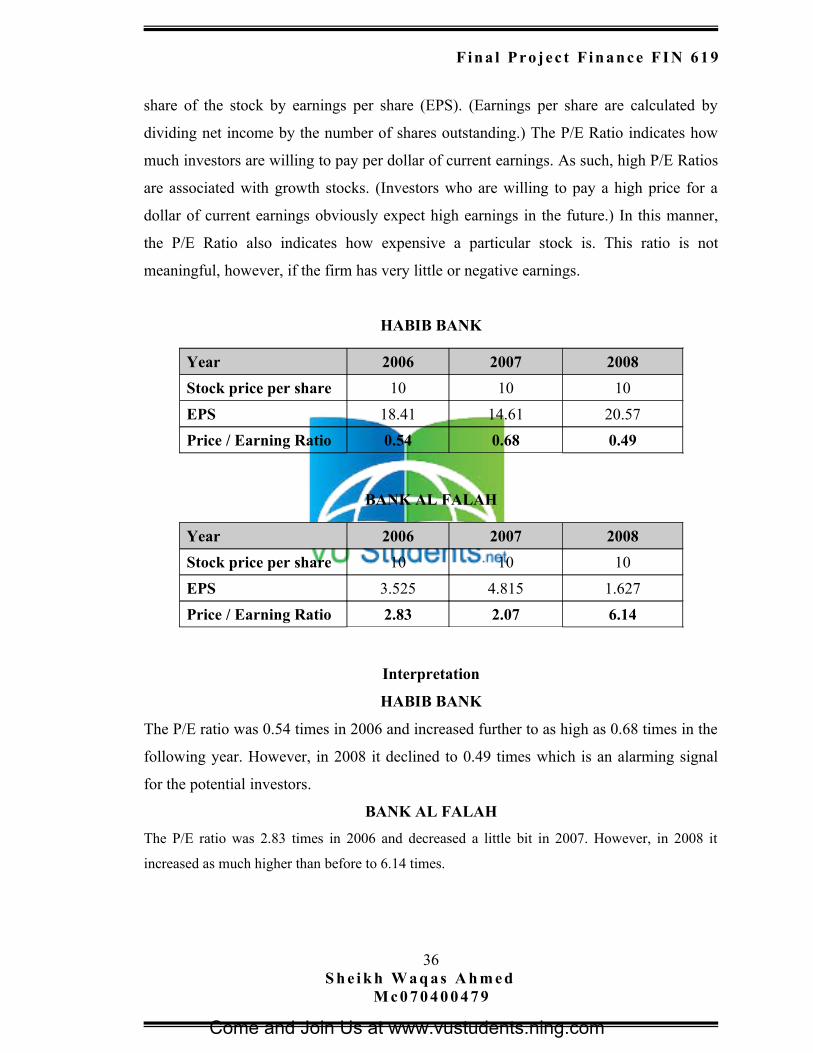
HABIB BANK
BANK AL FALAH
Interpretation
HABIB BANK
The P/E ratio was 0.54 times in 2006 and increased further to as high as 0.68 times in the
following year. However, in 2008 it declined to 0.49 times which is an alarming signal
for the potential investors.
BANK AL FALAH
The P/E ratio was 2.83 times in 2006 and decreased a little bit in 2007. However, in 2008 it
increased as much higher than before to 6.14 times.
36S h e i k h W a q as A h m e d
M c 0 7 0 4 0 0 4 7 9
Year 2006 2007 2008
Stock price per share 10 10 10
EPS 18.41 14.61 20.57
Price / Earning Ratio 0.54 0.68 0.49
Year 2006 2007 2008
Stock price per share 10 10 10
EPS 3.525 4.815 1.627
Price / Earning Ratio 2.83 2.07 6.14
Come and Join Us at www.vustudents.ning.com
Fin a l Pro jec t F in an ce FI N 619
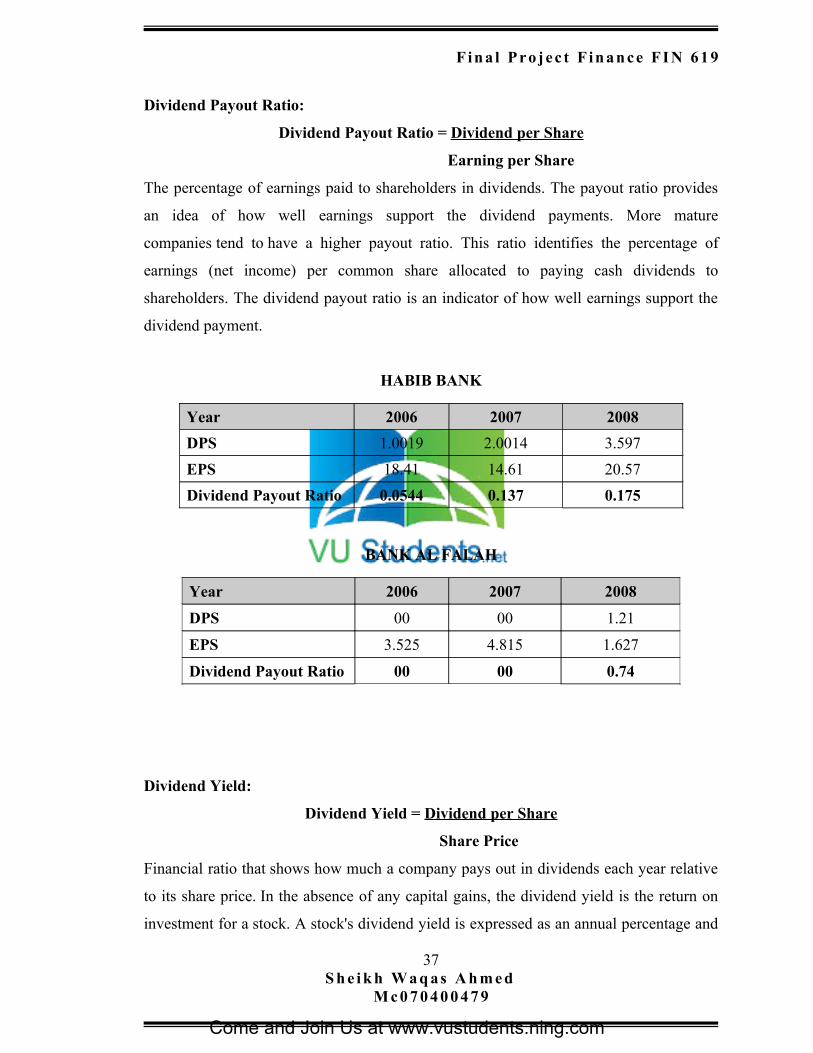
Dividend Payout Ratio:
Dividend Payout Ratio = Dividend per Share
Earning per Share
The percentage of earnings paid to shareholders in dividends. The payout ratio provides
an idea of how well earnings support the dividend payments. More mature
companies tend to have a higher payout ratio. This ratio identifies the percentage of
earnings (net income) per common share allocated to paying cash dividends to
shareholders. The dividend payout ratio is an indicator of how well earnings support the
dividend payment.
HABIB BANK
BANK AL FALAH
Dividend Yield:
Dividend Yield = Dividend per Share
Share Price
Financial ratio that shows how much a company pays out in dividends each year relative
to its share price. In the absence of any capital gains, the dividend yield is the return on
investment for a stock. A stock's dividend yield is expressed as an annual percentage and
37S h e i k h W a q as A h m e d
M c 0 7 0 4 0 0 4 7 9
Year 2006 2007 2008
DPS 1.0019 2.0014 3.597
EPS 18.41 14.61 20.57
Dividend Payout Ratio 0.0544 0.137 0.175
Year 2006 2007 2008
DPS 00 00 1.21
EPS 3.525 4.815 1.627
Dividend Payout Ratio 00 00 0.74
Come and Join Us at www.vustudents.ning.com
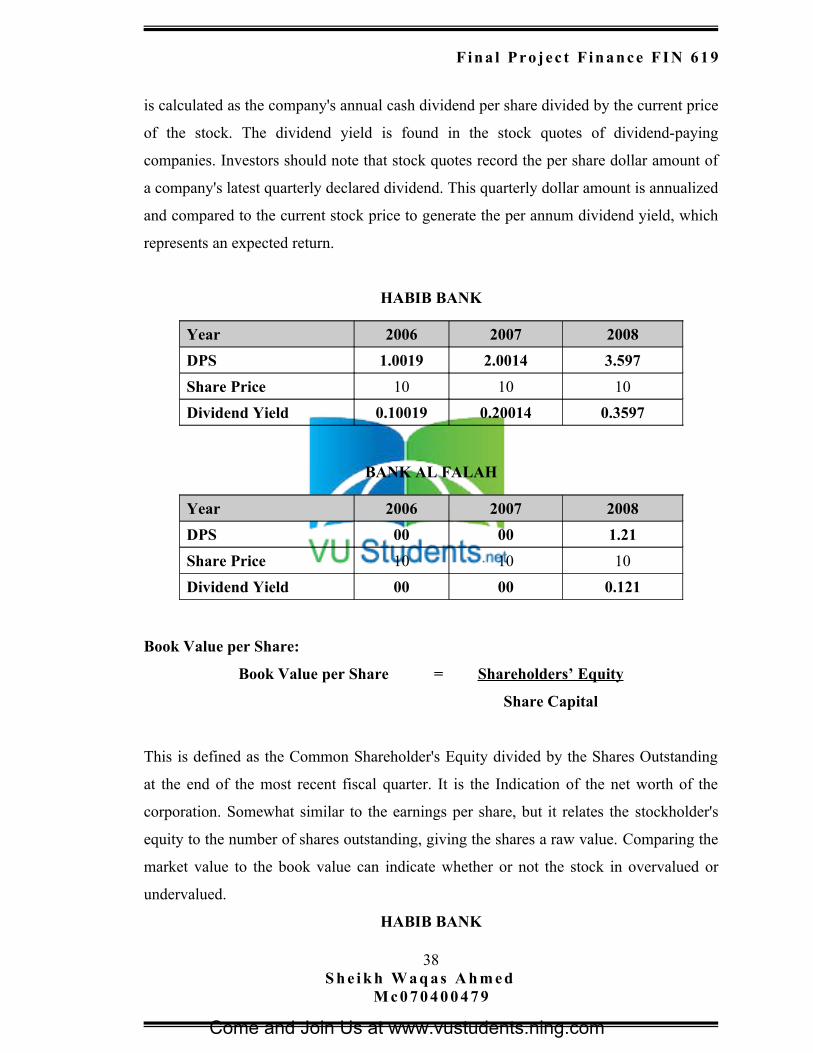
Fin a l Pro jec t F in an ce FI N 619
is calculated as the company's annual cash dividend per share divided by the current price
of the stock. The dividend yield is found in the stock quotes of dividend-paying
companies. Investors should note that stock quotes record the per share dollar amount of
a company's latest quarterly declared dividend. This quarterly dollar amount is annualized
and compared to the current stock price to generate the per annum dividend yield, which
represents an expected return.
HABIB BANK
BANK AL FALAH
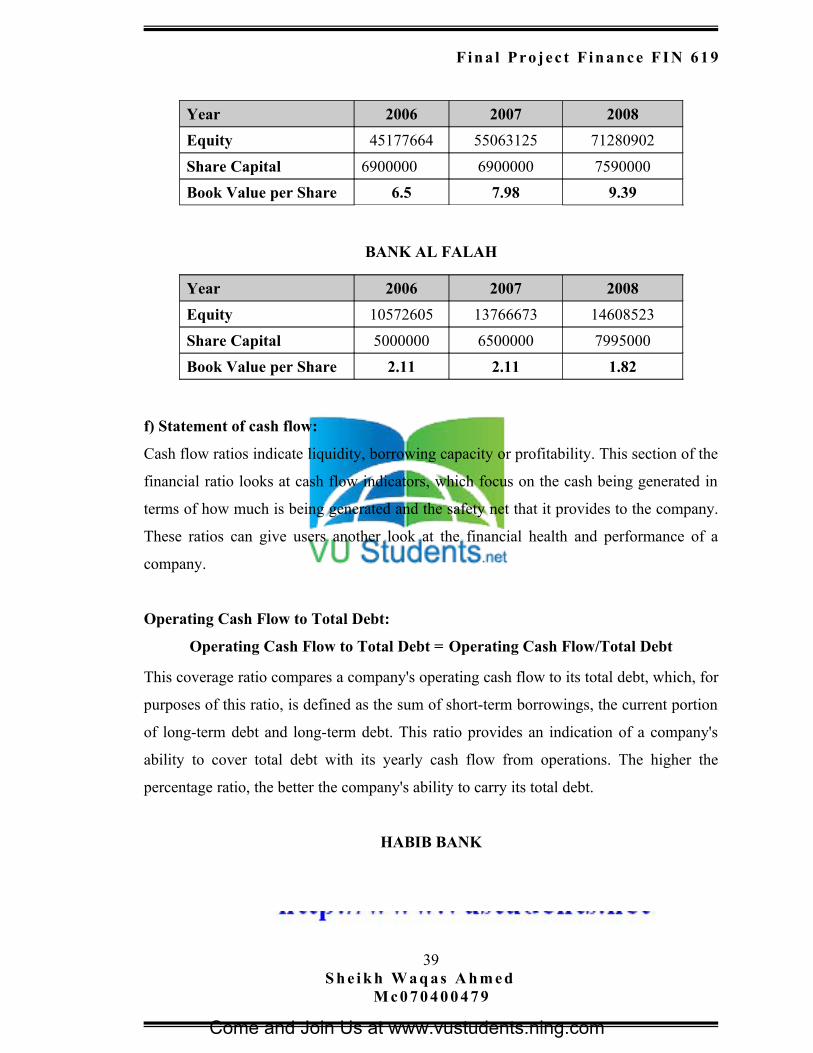
Book Value per Share:
Book Value per Share = Shareholders’ Equity
Share Capital
This is defined as the Common Shareholder's Equity divided by the Shares Outstanding
at the end of the most recent fiscal quarter. It is the Indication of the net worth of the
corporation. Somewhat similar to the earnings per share, but it relates the stockholder's
equity to the number of shares outstanding, giving the shares a raw value. Comparing the
market value to the book value can indicate whether or not the stock in overvalued or
undervalued.
HABIB BANK
38S h e i k h W a q as A h m e d
M c 0 7 0 4 0 0 4 7 9
Year 2006 2007 2008
DPS 1.0019 2.0014 3.597
Share Price 10 10 10
Dividend Yield 0.10019 0.20014 0.3597
Year 2006 2007 2008
DPS 00 00 1.21
Share Price 10 10 10
Dividend Yield 00 00 0.121
Come and Join Us at www.vustudents.ning.com
Fin a l Pro jec t F in an ce FI N 619
BANK AL FALAH
f) Statement of cash flow:
Cash flow ratios indicate liquidity, borrowing capacity or profitability. This section of the
financial ratio looks at cash flow indicators, which focus on the cash being generated in
terms of how much is being generated and the safety net that it provides to the company.
These ratios can give users another look at the financial health and performance of a
company.
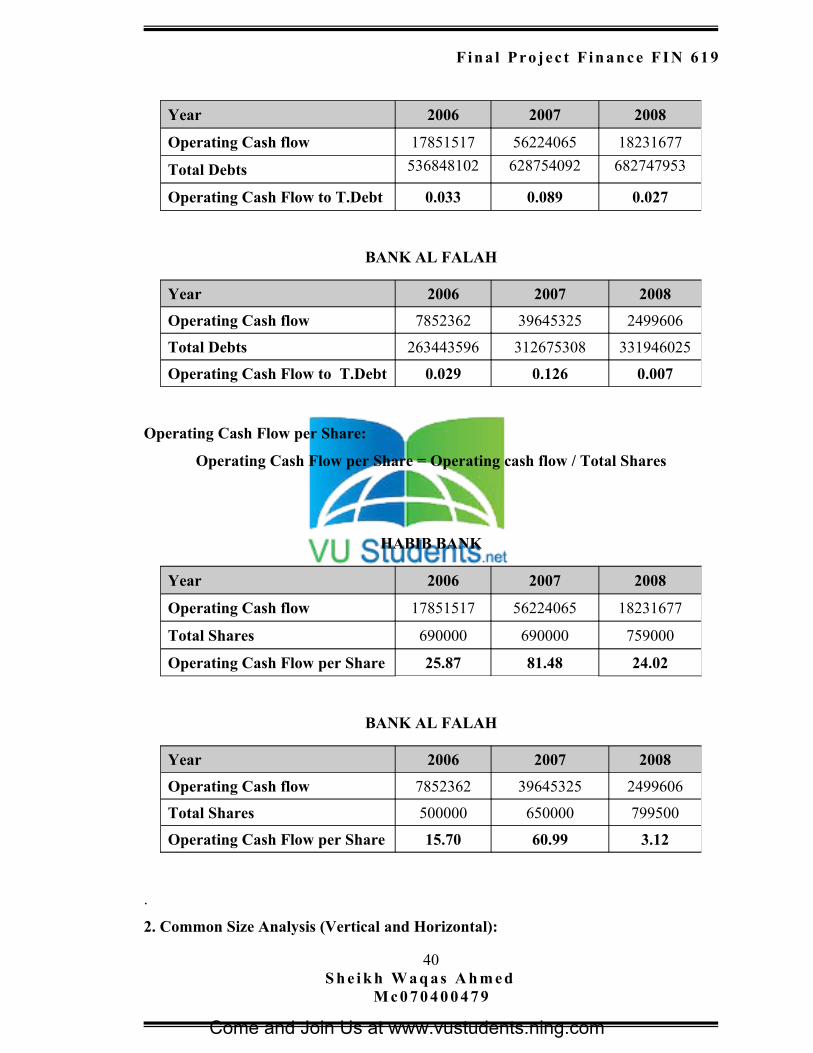
Operating Cash Flow to Total Debt:
Operating Cash Flow to Total Debt = Operating Cash Flow/Total Debt
This coverage ratio compares a company's operating cash flow to its total debt, which, for
purposes of this ratio, is defined as the sum of short-term borrowings, the current portion
of long-term debt and long-term debt. This ratio provides an indication of a company's
ability to cover total debt with its yearly cash flow from operations. The higher the
percentage ratio, the better the company's ability to carry its total debt.
HABIB BANK
39S h e i k h W a q as A h m e d
M c 0 7 0 4 0 0 4 7 9
Year 2006 2007 2008
Equity 45177664 55063125 71280902
Share Capital 6900000 6900000 7590000
Book Value per Share 6.5 7.98 9.39
Year 2006 2007 2008
Equity 10572605 13766673 14608523
Share Capital 5000000 6500000 7995000
Book Value per Share 2.11 2.11 1.82
Come and Join Us at www.vustudents.ning.com
Fin a l Pro jec t F in an ce FI N 619
BANK AL FALAH
Operating Cash Flow per Share:
Operating Cash Flow per Share = Operating cash flow / Total Shares
HABIB BANK
BANK AL FALAH
.
2. Common Size Analysis (Vertical and Horizontal):
40S h e i k h W a q as A h m e d
M c 0 7 0 4 0 0 4 7 9
Year 2006 2007 2008
Operating Cash flow 17851517 56224065 18231677
Total Debts 536848102 628754092 682747953
Operating Cash Flow to T.Debt 0.033 0.089 0.027
Year 2006 2007 2008
Operating Cash flow 7852362 39645325 2499606
Total Debts 263443596 312675308 331946025
Operating Cash Flow to T.Debt 0.029 0.126 0.007
Year 2006 2007 2008
Operating Cash flow 17851517 56224065 18231677
Total Shares 690000 690000 759000
Operating Cash Flow per Share 25.87 81.48 24.02
Year 2006 2007 2008
Operating Cash flow 7852362 39645325 2499606
Total Shares 500000 650000 799500
Operating Cash Flow per Share 15.70 60.99 3.12
Come and Join Us at www.vustudents.ning.com
Fin a l Pro jec t F in an ce FI N 619
The term "trend analysis" refers to the concept of collecting information and attempting
to spot a pattern, or trend, in the information. In some fields of study, the term "trend
analysis" has more formally-defined meanings. Although trend analysis is often used to
predict future events, it could be used to estimate uncertain events in the past. Financial
statement information is used by both external and internal users, including investors,
creditors, managers, and executives. These users must analyze the information in order to
make business decisions, so understanding financial statements is of great importance.
Several methods of performing financial statement analysis exist. I will discuss two of
these methods: horizontal analysis and vertical analysis.
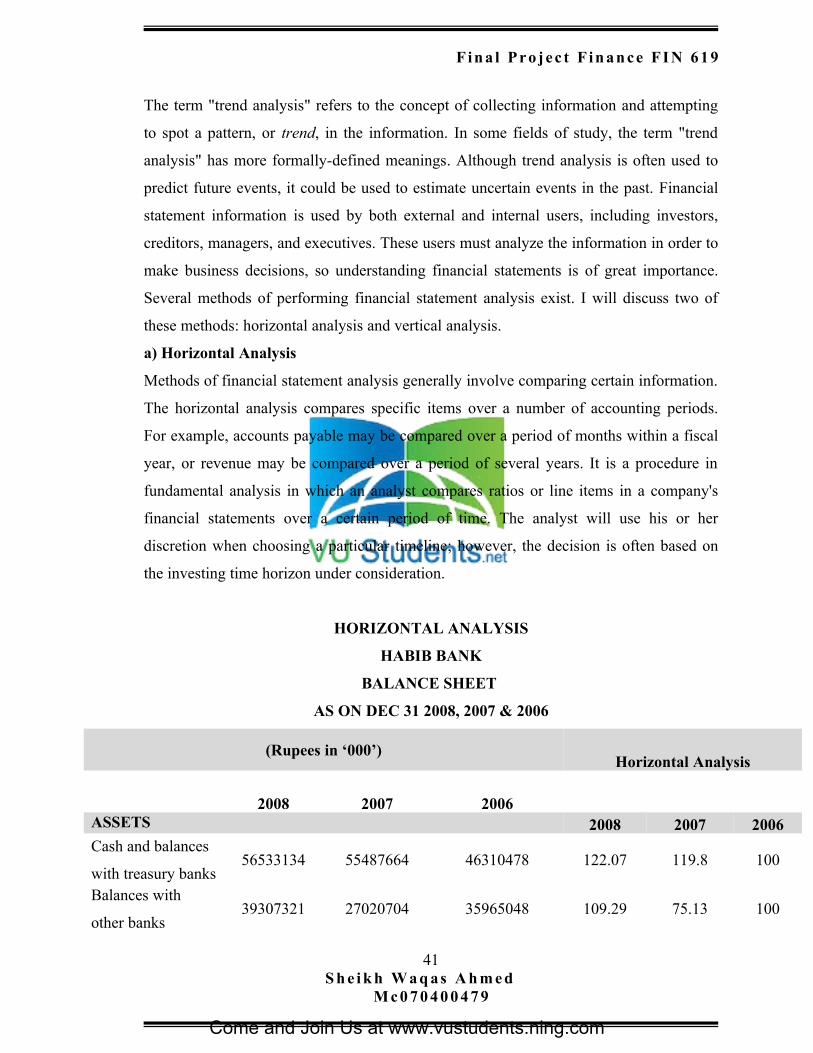
a) Horizontal Analysis
Methods of financial statement analysis generally involve comparing certain information.
The horizontal analysis compares specific items over a number of accounting periods.
For example, accounts payable may be compared over a period of months within a fiscal
year, or revenue may be compared over a period of several years. It is a procedure in
fundamental analysis in which an analyst compares ratios or line items in a company's
financial statements over a certain period of time. The analyst will use his or her
discretion when choosing a particular timeline; however, the decision is often based on
the investing time horizon under consideration.
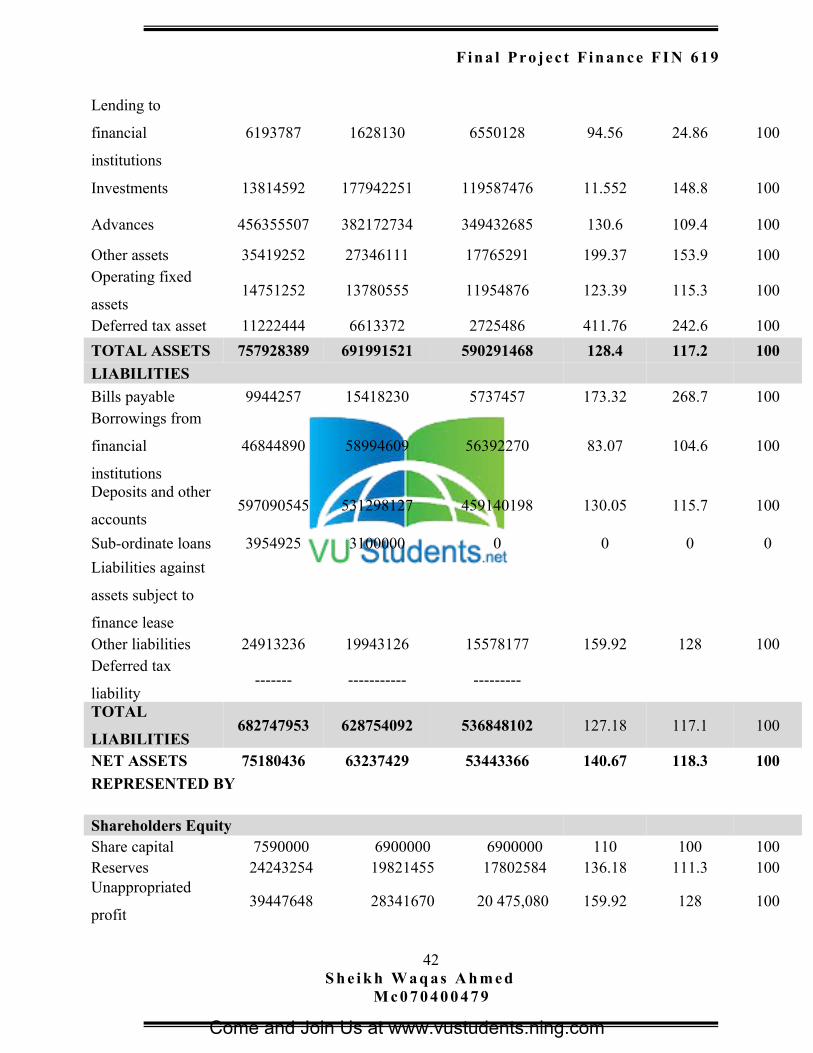
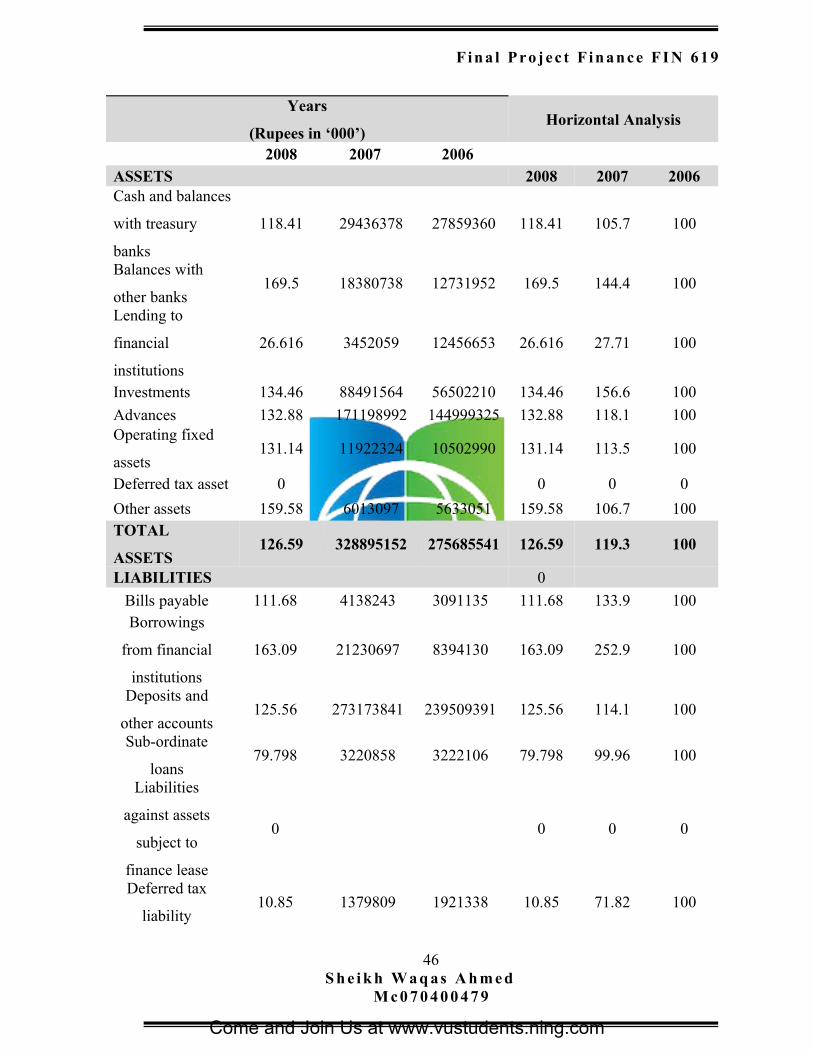
HORIZONTAL ANALYSIS
HABIB BANK
BALANCE SHEET
AS ON DEC 31 2008, 2007 & 2006
(Rupees in ‘000’)Horizontal Analysis
2008 2007 2006ASSETS 2008 2007 2006Cash and balances
with treasury banks56533134 55487664 46310478 122.07 119.8 100
Balances with
other banks39307321 27020704 35965048 109.29 75.13 100
41S h e i k h W a q as A h m e d
M c 0 7 0 4 0 0 4 7 9
Come and Join Us at www.vustudents.ning.com
Fin a l Pro jec t F in an ce FI N 619
Lending to
financial
institutions
6193787 1628130 6550128 94.56 24.86 100
Investments 13814592 177942251 119587476 11.552 148.8 100
Advances 456355507 382172734 349432685 130.6 109.4 100
Other assets 35419252 27346111 17765291 199.37 153.9 100Operating fixed
assets14751252 13780555 11954876 123.39 115.3 100
Deferred tax asset 11222444 6613372 2725486 411.76 242.6 100
TOTAL ASSETS 757928389 691991521 590291468 128.4 117.2 100
LIABILITIES
Bills payable 9944257 15418230 5737457 173.32 268.7 100Borrowings from
financial
institutions
46844890 58994609 56392270 83.07 104.6 100
Deposits and other
accounts597090545 531298127 459140198 130.05 115.7 100
Sub-ordinate loans 3954925 3100000 0 0 0 0
Liabilities against
assets subject to
finance leaseOther liabilities 24913236 19943126 15578177 159.92 128 100Deferred tax
liability------- ----------- ---------
TOTAL
LIABILITIES682747953 628754092 536848102 127.18 117.1 100
NET ASSETS 75180436 63237429 53443366 140.67 118.3 100
REPRESENTED BY
Shareholders EquityShare capital 7590000 6900000 6900000 110 100 100Reserves 24243254 19821455 17802584 136.18 111.3 100Unappropriated
profit39447648 28341670 20 475,080 159.92 128 100
42S h e i k h W a q as A h m e d
M c 0 7 0 4 0 0 4 7 9
Come and Join Us at www.vustudents.ning.com
Fin a l Pro jec t F in an ce FI N 619
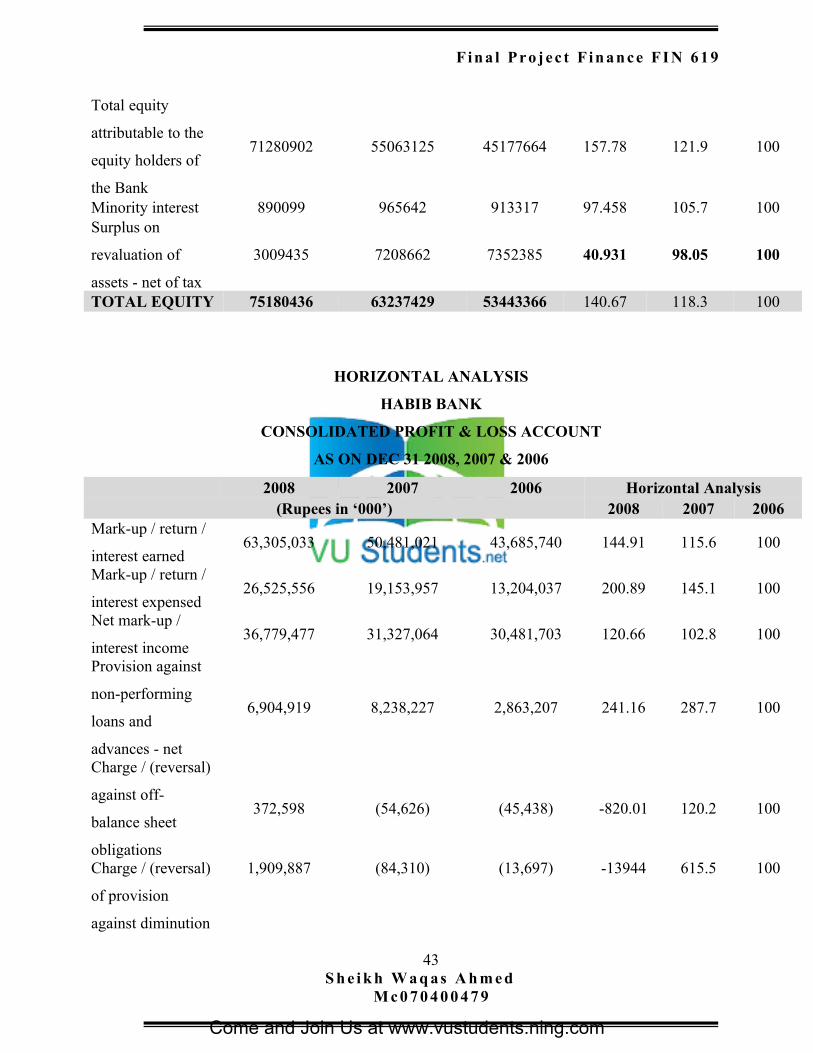
Total equity
attributable to the
equity holders of
the Bank
71280902 55063125 45177664 157.78 121.9 100
Minority interest 890099 965642 913317 97.458 105.7 100Surplus on
revaluation of
assets - net of tax
3009435 7208662 7352385 40.931 98.05 100
TOTAL EQUITY 75180436 63237429 53443366 140.67 118.3 100
HORIZONTAL ANALYSIS
HABIB BANK
CONSOLIDATED PROFIT & LOSS ACCOUNT
AS ON DEC 31 2008, 2007 & 2006
2008 2007 2006 Horizontal Analysis(Rupees in ‘000’) 2008 2007 2006
Mark-up / return /
interest earned63,305,033 50,481,021 43,685,740 144.91 115.6 100
Mark-up / return /
interest expensed26,525,556 19,153,957 13,204,037 200.89 145.1 100
Net mark-up /
interest income36,779,477 31,327,064 30,481,703 120.66 102.8 100
Provision against
non-performing
loans and
advances - net
6,904,919 8,238,227 2,863,207 241.16 287.7 100
Charge / (reversal)
against off-
balance sheet
obligations
372,598 (54,626) (45,438) -820.01 120.2 100
Charge / (reversal)
of provision
against diminution
1,909,887 (84,310) (13,697) -13944 615.5 100
43S h e i k h W a q as A h m e d
M c 0 7 0 4 0 0 4 7 9
Come and Join Us at www.vustudents.ning.com
Fin a l Pro jec t F in an ce FI N 619
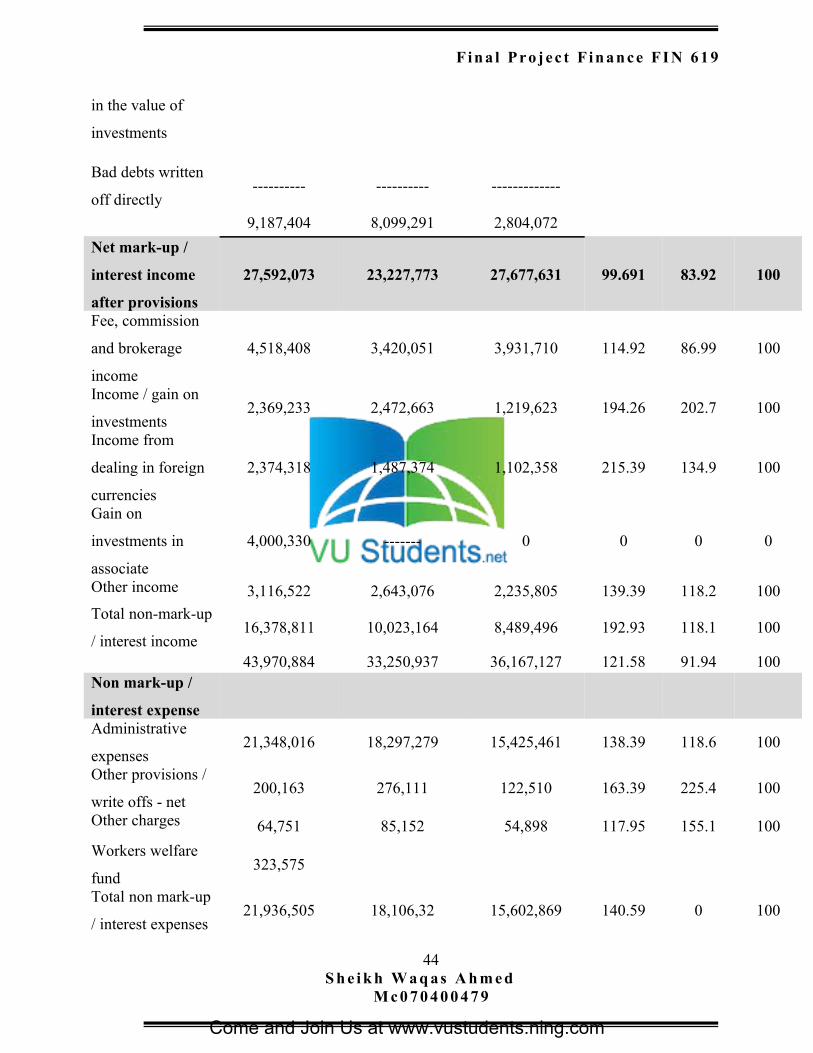
in the value of
investments
Bad debts written
off directly---------- ---------- -------------
9,187,404 8,099,291 2,804,072
Net mark-up /
interest income
after provisions
27,592,073 23,227,773 27,677,631 99.691 83.92 100
Fee, commission
and brokerage
income
4,518,408 3,420,051 3,931,710 114.92 86.99 100
Income / gain on
investments 2,369,233 2,472,663 1,219,623 194.26 202.7 100
Income from
dealing in foreign
currencies
2,374,318 1,487,374 1,102,358 215.39 134.9 100
Gain on
investments in
associate
4,000,330 ------- 0 0 0 0
Other income 3,116,522 2,643,076 2,235,805 139.39 118.2 100
Total non-mark-up
/ interest income 16,378,811 10,023,164 8,489,496 192.93 118.1 100
43,970,884 33,250,937 36,167,127 121.58 91.94 100Non mark-up /
interest expenseAdministrative
expenses21,348,016 18,297,279 15,425,461 138.39 118.6 100
Other provisions /
write offs - net200,163 276,111 122,510 163.39 225.4 100
Other charges 64,751 85,152 54,898 117.95 155.1 100
Workers welfare
fund323,575
Total non mark-up
/ interest expenses21,936,505 18,106,32 15,602,869 140.59 0 100
44S h e i k h W a q as A h m e d
M c 0 7 0 4 0 0 4 7 9
Come and Join Us at www.vustudents.ning.com
Fin a l Pro jec t F in an ce FI N 619
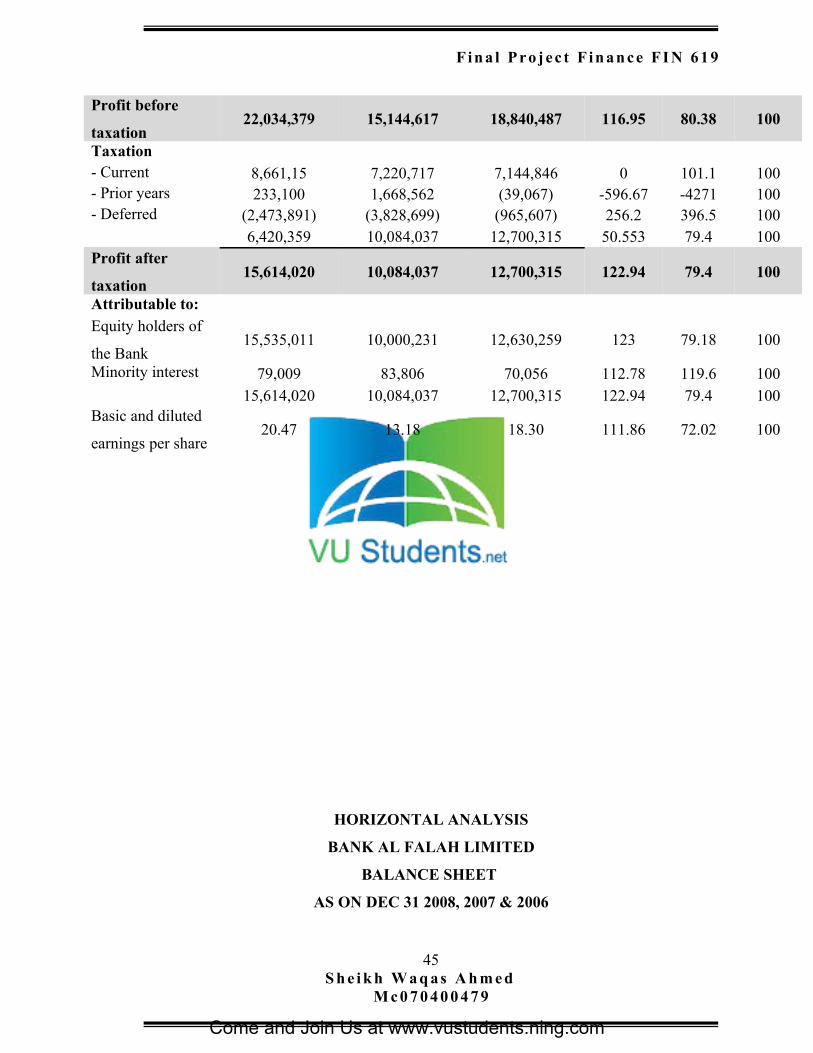
Profit before
taxation22,034,379 15,144,617 18,840,487 116.95 80.38 100
Taxation- Current 8,661,15 7,220,717 7,144,846 0 101.1 100- Prior years 233,100 1,668,562 (39,067) -596.67 -4271 100- Deferred (2,473,891) (3,828,699) (965,607) 256.2 396.5 100
6,420,359 10,084,037 12,700,315 50.553 79.4 100Profit after
taxation15,614,020 10,084,037 12,700,315 122.94 79.4 100
Attributable to:Equity holders of
the Bank15,535,011 10,000,231 12,630,259 123 79.18 100
Minority interest 79,009 83,806 70,056 112.78 119.6 10015,614,020 10,084,037 12,700,315 122.94 79.4 100
Basic and diluted
earnings per share20.47 13.18 18.30 111.86 72.02 100
HORIZONTAL ANALYSIS
BANK AL FALAH LIMITED
BALANCE SHEET
AS ON DEC 31 2008, 2007 & 2006
45S h e i k h W a q as A h m e d
M c 0 7 0 4 0 0 4 7 9
Come and Join Us at www.vustudents.ning.com
Fin a l Pro jec t F in an ce FI N 619
Years
(Rupees in ‘000’)Horizontal Analysis
2008 2007 2006ASSETS 2008 2007 2006Cash and balances
with treasury
banks
118.41 29436378 27859360 118.41 105.7 100
Balances with
other banks169.5 18380738 12731952 169.5 144.4 100
Lending to
financial
institutions
26.616 3452059 12456653 26.616 27.71 100
Investments 134.46 88491564 56502210 134.46 156.6 100
Advances 132.88 171198992 144999325 132.88 118.1 100Operating fixed
assets131.14 11922324 10502990 131.14 113.5 100
Deferred tax asset 0 0 0 0
Other assets 159.58 6013097 5633051 159.58 106.7 100TOTAL
ASSETS126.59 328895152 275685541 126.59 119.3 100
LIABILITIES 0
Bills payable 111.68 4138243 3091135 111.68 133.9 100Borrowings
from financial
institutions
163.09 21230697 8394130 163.09 252.9 100
Deposits and
other accounts125.56 273173841 239509391 125.56 114.1 100
Sub-ordinate
loans79.798 3220858 3222106 79.798 99.96 100
Liabilities
against assets
subject to
finance lease
0 0 0 0
Deferred tax
liability10.85 1379809 1921338 10.85 71.82 100
46S h e i k h W a q as A h m e d
M c 0 7 0 4 0 0 4 7 9
Come and Join Us at www.vustudents.ning.com
Fin a l Pro jec t F in an ce FI N 619
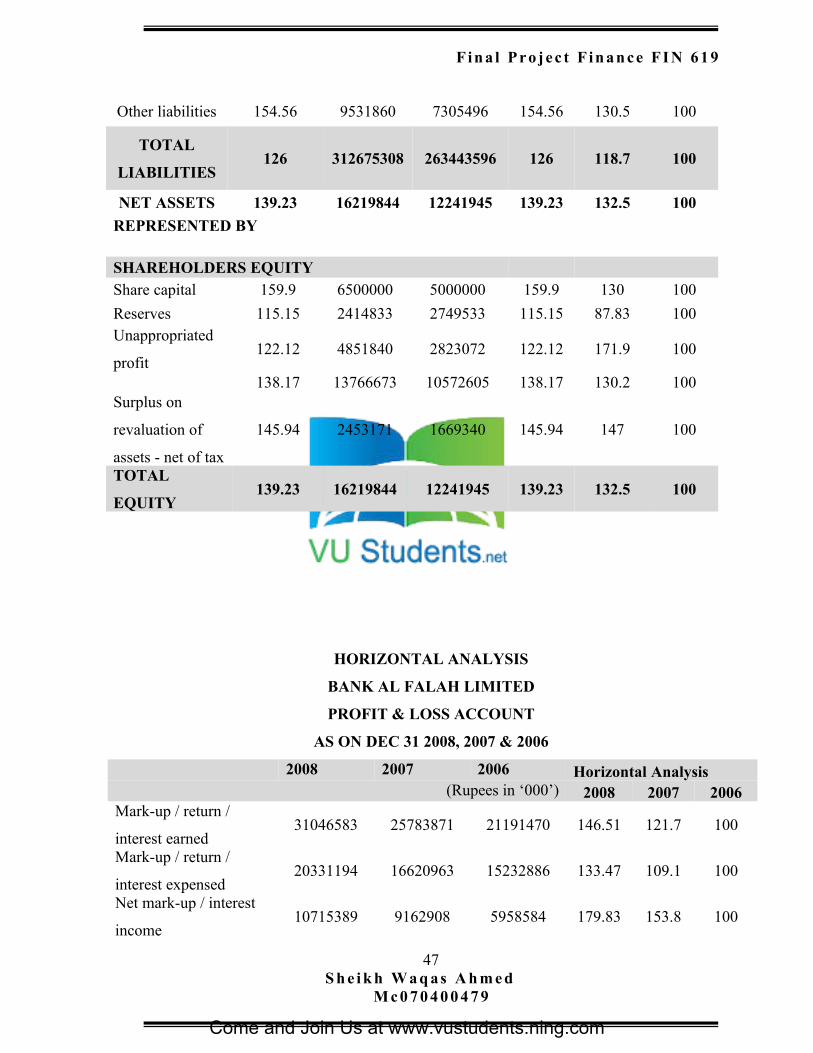
Other liabilities 154.56 9531860 7305496 154.56 130.5 100
TOTAL
LIABILITIES126 312675308 263443596 126 118.7 100
NET ASSETS 139.23 16219844 12241945 139.23 132.5 100
REPRESENTED BY
SHAREHOLDERS EQUITYShare capital 159.9 6500000 5000000 159.9 130 100
Reserves 115.15 2414833 2749533 115.15 87.83 100Unappropriated
profit122.12 4851840 2823072 122.12 171.9 100
138.17 13766673 10572605 138.17 130.2 100Surplus on
revaluation of
assets - net of tax
145.94 2453171 1669340 145.94 147 100
TOTAL
EQUITY139.23 16219844 12241945 139.23 132.5 100
HORIZONTAL ANALYSIS
BANK AL FALAH LIMITED
PROFIT & LOSS ACCOUNT
AS ON DEC 31 2008, 2007 & 2006
2008 2007 2006 Horizontal Analysis(Rupees in ‘000’) 2008 2007 2006
Mark-up / return /
interest earned31046583 25783871 21191470 146.51 121.7 100
Mark-up / return /
interest expensed20331194 16620963 15232886 133.47 109.1 100
Net mark-up / interest
income10715389 9162908 5958584 179.83 153.8 100
47S h e i k h W a q as A h m e d
M c 0 7 0 4 0 0 4 7 9
Come and Join Us at www.vustudents.ning.com
Fin a l Pro jec t F in an ce FI N 619
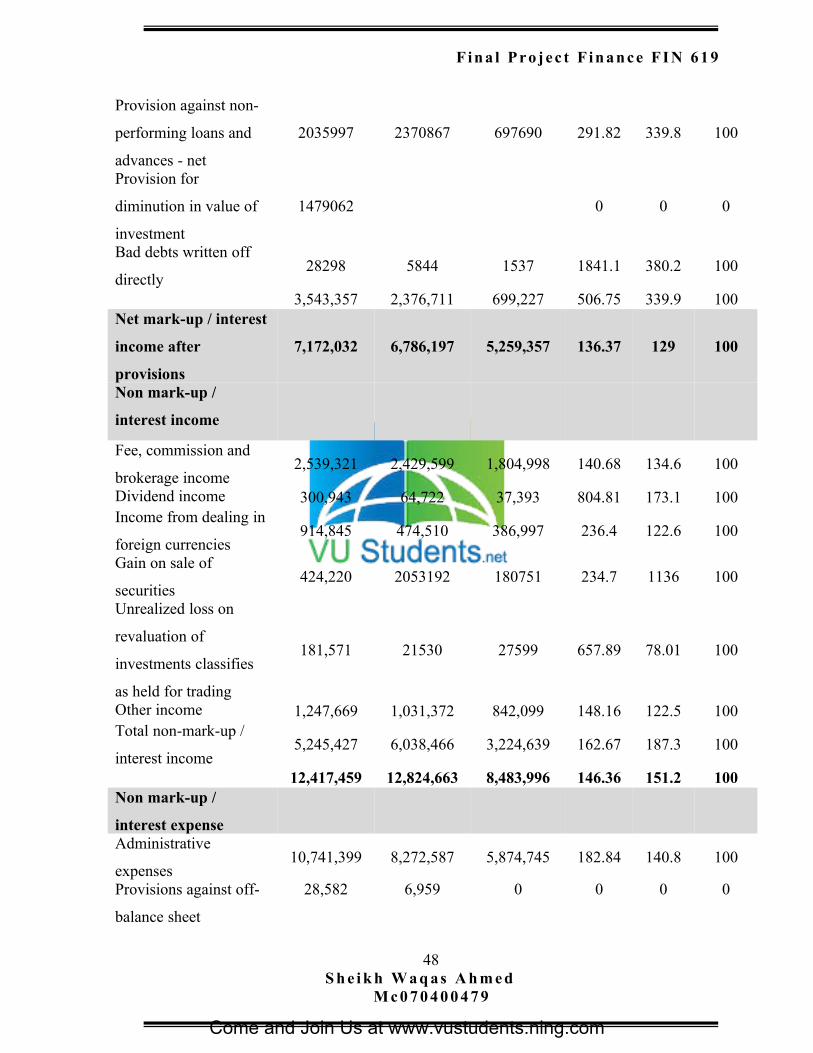
Provision against non-
performing loans and
advances - net
2035997 2370867 697690 291.82 339.8 100
Provision for
diminution in value of
investment
1479062 0 0 0
Bad debts written off
directly28298 5844 1537 1841.1 380.2 100
3,543,357 2,376,711 699,227 506.75 339.9 100Net mark-up / interest
income after
provisions
7,172,032 6,786,197 5,259,357 136.37 129 100
Non mark-up /
interest income
Fee, commission and
brokerage income 2,539,321 2,429,599 1,804,998 140.68 134.6 100
Dividend income 300,943 64,722 37,393 804.81 173.1 100Income from dealing in
foreign currencies 914,845 474,510 386,997 236.4 122.6 100
Gain on sale of
securities424,220 2053192 180751 234.7 1136 100
Unrealized loss on
revaluation of
investments classifies
as held for trading
181,571 21530 27599 657.89 78.01 100
Other income 1,247,669 1,031,372 842,099 148.16 122.5 100Total non-mark-up /
interest income 5,245,427 6,038,466 3,224,639 162.67 187.3 100
12,417,459 12,824,663 8,483,996 146.36 151.2 100Non mark-up /
interest expenseAdministrative
expenses10,741,399 8,272,587 5,874,745 182.84 140.8 100
Provisions against off-
balance sheet
28,582 6,959 0 0 0 0
48S h e i k h W a q as A h m e d
M c 0 7 0 4 0 0 4 7 9
Come and Join Us at www.vustudents.ning.com
Fin a l Pro jec t F in an ce FI N 619
obligations
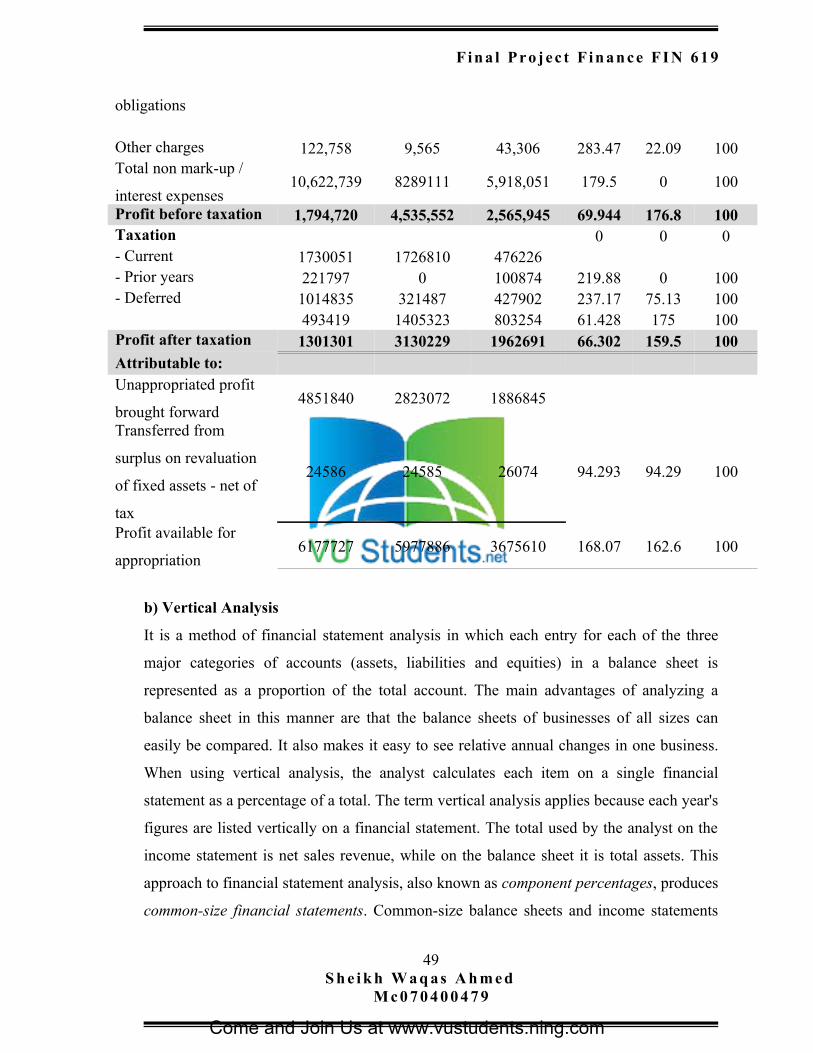
Other charges 122,758 9,565 43,306 283.47 22.09 100Total non mark-up /
interest expenses10,622,739 8289111 5,918,051 179.5 0 100
Profit before taxation 1,794,720 4,535,552 2,565,945 69.944 176.8 100Taxation 0 0 0- Current 1730051 1726810 476226- Prior years 221797 0 100874 219.88 0 100- Deferred 1014835 321487 427902 237.17 75.13 100
493419 1405323 803254 61.428 175 100Profit after taxation 1301301 3130229 1962691 66.302 159.5 100Attributable to:Unappropriated profit
brought forward4851840 2823072 1886845
Transferred from
surplus on revaluation
of fixed assets - net of
tax
24586 24585 26074 94.293 94.29 100
Profit available for
appropriation6177727 5977886 3675610 168.07 162.6 100
b) Vertical Analysis
It is a method of financial statement analysis in which each entry for each of the three
major categories of accounts (assets, liabilities and equities) in a balance sheet is
represented as a proportion of the total account. The main advantages of analyzing a
balance sheet in this manner are that the balance sheets of businesses of all sizes can
easily be compared. It also makes it easy to see relative annual changes in one business.
When using vertical analysis, the analyst calculates each item on a single financial
statement as a percentage of a total. The term vertical analysis applies because each year's
figures are listed vertically on a financial statement. The total used by the analyst on the
income statement is net sales revenue, while on the balance sheet it is total assets. This
approach to financial statement analysis, also known as component percentages, produces
common-size financial statements. Common-size balance sheets and income statements
49S h e i k h W a q as A h m e d
M c 0 7 0 4 0 0 4 7 9
Come and Join Us at www.vustudents.ning.com
Fin a l Pro jec t F in an ce FI N 619
can be more easily compared, whether across the years for a single company or across
different companies.
VERTICAL ANALYSIS
HABIB BANK
BALANCE SHEET
AS ON AS ON DEC 31 2008, 2007 & 2006
50S h e i k h W a q as A h m e d
M c 0 7 0 4 0 0 4 7 9
Come and Join Us at www.vustudents.ning.com
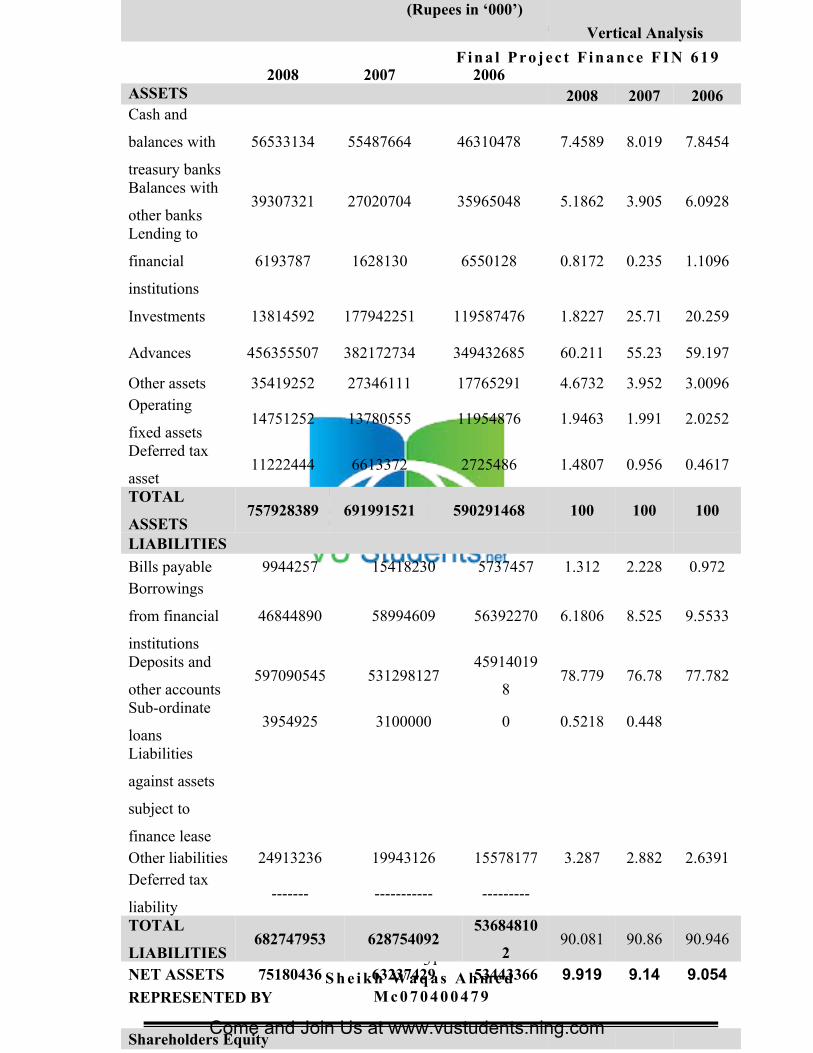
Fin a l Pro jec t F in an ce FI N 619
51S h e i k h W a q as A h m e d
M c 0 7 0 4 0 0 4 7 9
(Rupees in ‘000’)
Vertical Analysis
2008 2007 2006ASSETS 2008 2007 2006Cash and
balances with
treasury banks
56533134 55487664 46310478 7.4589 8.019 7.8454
Balances with
other banks39307321 27020704 35965048 5.1862 3.905 6.0928
Lending to
financial
institutions
6193787 1628130 6550128 0.8172 0.235 1.1096
Investments 13814592 177942251 119587476 1.8227 25.71 20.259
Advances 456355507 382172734 349432685 60.211 55.23 59.197
Other assets 35419252 27346111 17765291 4.6732 3.952 3.0096Operating
fixed assets14751252 13780555 11954876 1.9463 1.991 2.0252
Deferred tax
asset11222444 6613372 2725486 1.4807 0.956 0.4617
TOTAL
ASSETS757928389 691991521 590291468 100 100 100
LIABILITIES
Bills payable 9944257 15418230 5737457 1.312 2.228 0.972Borrowings
from financial
institutions
46844890 58994609 56392270 6.1806 8.525 9.5533
Deposits and
other accounts597090545 531298127
45914019
878.779 76.78 77.782
Sub-ordinate
loans 3954925 3100000 0 0.5218 0.448
Liabilities
against assets
subject to
finance leaseOther liabilities 24913236 19943126 15578177 3.287 2.882 2.6391Deferred tax
liability------- ----------- ---------
TOTAL
LIABILITIES682747953 628754092
53684810
290.081 90.86 90.946
NET ASSETS 75180436 63237429 53443366 9.919 9.14 9.054
REPRESENTED BY
Shareholders Equity Share capital 7590000 6900000 6900000 1.001 1 1.169
Come and Join Us at www.vustudents.ning.com
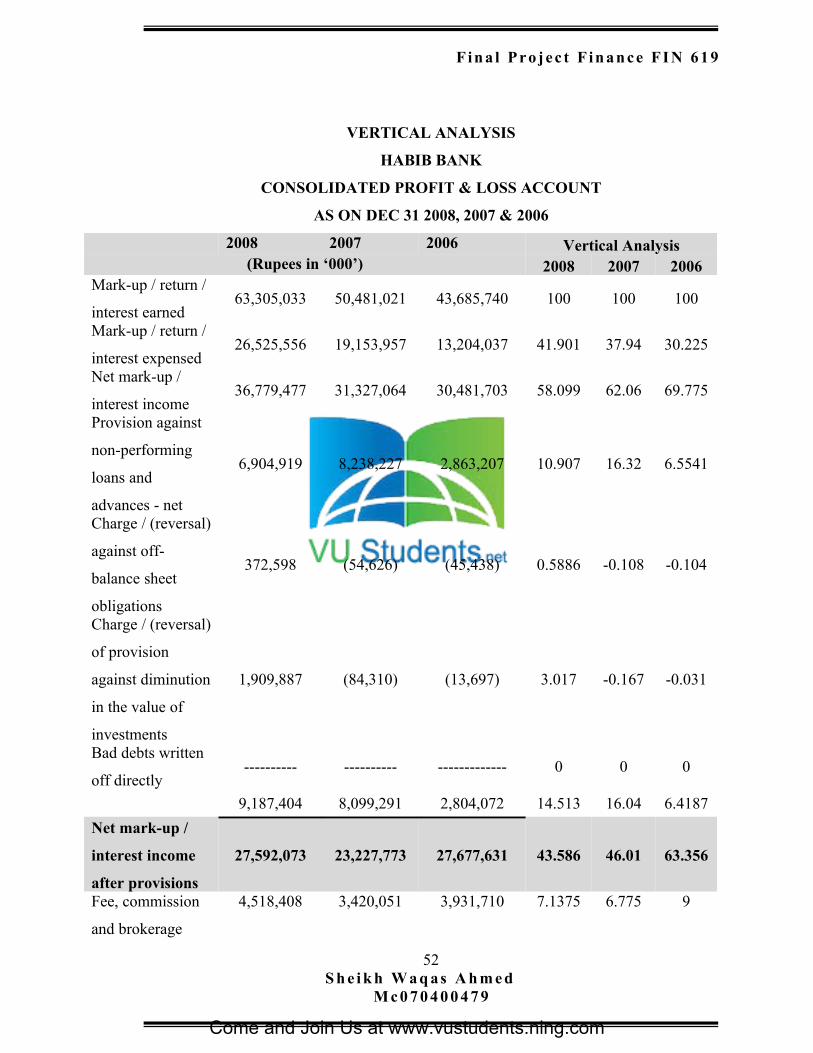
Fin a l Pro jec t F in an ce FI N 619
VERTICAL ANALYSIS
HABIB BANK
CONSOLIDATED PROFIT & LOSS ACCOUNT
AS ON DEC 31 2008, 2007 & 2006
2008 2007 2006 Vertical Analysis(Rupees in ‘000’) 2008 2007 2006
Mark-up / return /
interest earned63,305,033 50,481,021 43,685,740 100 100 100
Mark-up / return /
interest expensed26,525,556 19,153,957 13,204,037 41.901 37.94 30.225
Net mark-up /
interest income36,779,477 31,327,064 30,481,703 58.099 62.06 69.775
Provision against
non-performing
loans and
advances - net
6,904,919 8,238,227 2,863,207 10.907 16.32 6.5541
Charge / (reversal)
against off-
balance sheet
obligations
372,598 (54,626) (45,438) 0.5886 -0.108 -0.104
Charge / (reversal)
of provision
against diminution
in the value of
investments
1,909,887 (84,310) (13,697) 3.017 -0.167 -0.031
Bad debts written
off directly---------- ---------- ------------- 0 0 0
9,187,404 8,099,291 2,804,072 14.513 16.04 6.4187
Net mark-up /
interest income
after provisions
27,592,073 23,227,773 27,677,631 43.586 46.01 63.356
Fee, commission
and brokerage
4,518,408 3,420,051 3,931,710 7.1375 6.775 9
52S h e i k h W a q as A h m e d
M c 0 7 0 4 0 0 4 7 9
Come and Join Us at www.vustudents.ning.com
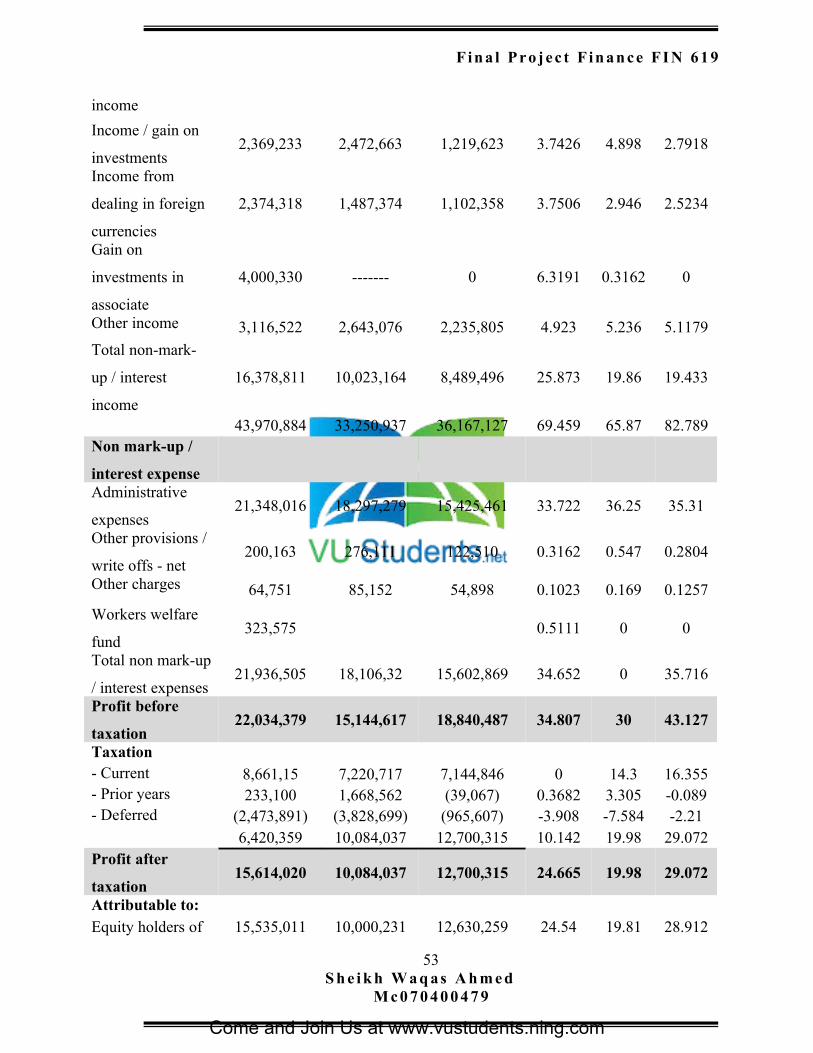
Fin a l Pro jec t F in an ce FI N 619
income
Income / gain on
investments 2,369,233 2,472,663 1,219,623 3.7426 4.898 2.7918
Income from
dealing in foreign
currencies
2,374,318 1,487,374 1,102,358 3.7506 2.946 2.5234
Gain on
investments in
associate
4,000,330 ------- 0 6.3191 0.3162 0
Other income 3,116,522 2,643,076 2,235,805 4.923 5.236 5.1179
Total non-mark-
up / interest
income
16,378,811 10,023,164 8,489,496 25.873 19.86 19.433
43,970,884 33,250,937 36,167,127 69.459 65.87 82.789Non mark-up /
interest expenseAdministrative
expenses21,348,016 18,297,279 15,425,461 33.722 36.25 35.31
Other provisions /
write offs - net200,163 276,111 122,510 0.3162 0.547 0.2804
Other charges 64,751 85,152 54,898 0.1023 0.169 0.1257
Workers welfare
fund323,575 0.5111 0 0
Total non mark-up
/ interest expenses21,936,505 18,106,32 15,602,869 34.652 0 35.716
Profit before
taxation22,034,379 15,144,617 18,840,487 34.807 30 43.127
Taxation- Current 8,661,15 7,220,717 7,144,846 0 14.3 16.355- Prior years 233,100 1,668,562 (39,067) 0.3682 3.305 -0.089- Deferred (2,473,891) (3,828,699) (965,607) -3.908 -7.584 -2.21
6,420,359 10,084,037 12,700,315 10.142 19.98 29.072Profit after
taxation15,614,020 10,084,037 12,700,315 24.665 19.98 29.072
Attributable to:Equity holders of 15,535,011 10,000,231 12,630,259 24.54 19.81 28.912
53S h e i k h W a q as A h m e d
M c 0 7 0 4 0 0 4 7 9
Come and Join Us at www.vustudents.ning.com
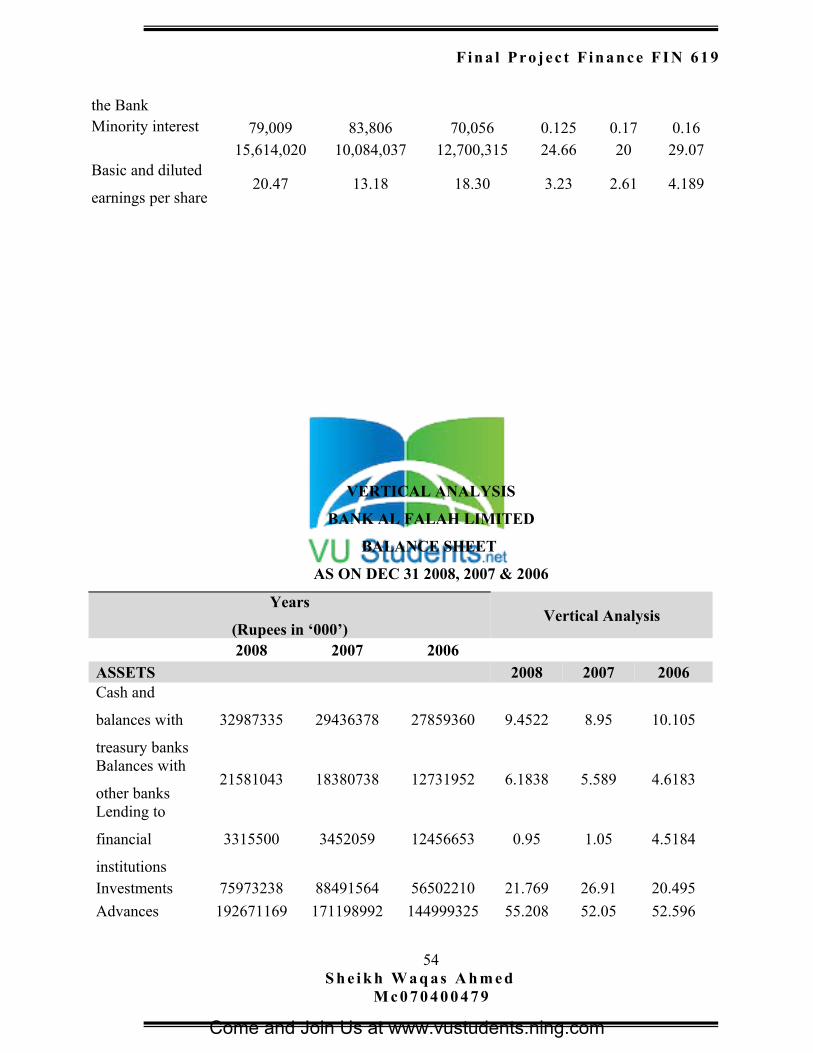
Fin a l Pro jec t F in an ce FI N 619
the BankMinority interest 79,009 83,806 70,056 0.125 0.17 0.16
15,614,020 10,084,037 12,700,315 24.66 20 29.07Basic and diluted
earnings per share20.47 13.18 18.30 3.23 2.61 4.189
VERTICAL ANALYSIS
BANK AL FALAH LIMITED
BALANCE SHEET
AS ON DEC 31 2008, 2007 & 2006
Years
(Rupees in ‘000’)Vertical Analysis
2008 2007 2006
ASSETS 2008 2007 2006Cash and
balances with
treasury banks
32987335 29436378 27859360 9.4522 8.95 10.105
Balances with
other banks21581043 18380738 12731952 6.1838 5.589 4.6183
Lending to
financial
institutions
3315500 3452059 12456653 0.95 1.05 4.5184
Investments 75973238 88491564 56502210 21.769 26.91 20.495
Advances 192671169 171198992 144999325 55.208 52.05 52.596
54S h e i k h W a q as A h m e d
M c 0 7 0 4 0 0 4 7 9
Come and Join Us at www.vustudents.ning.com
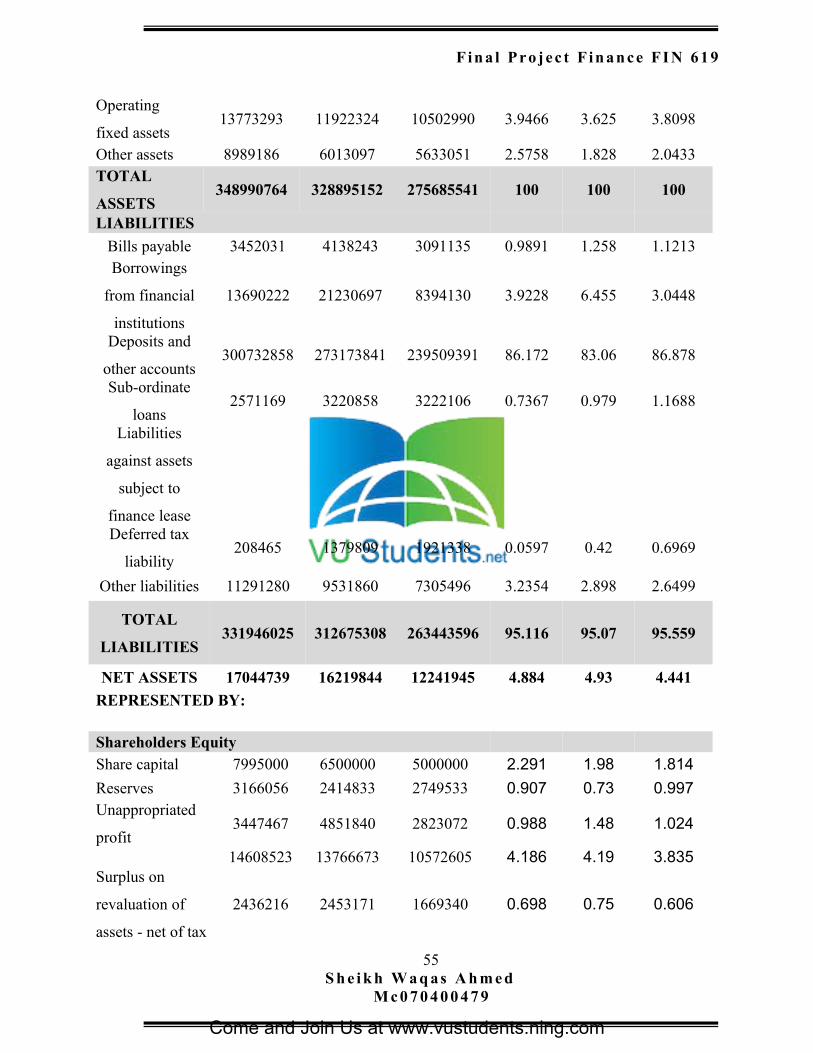
Fin a l Pro jec t F in an ce FI N 619
Operating
fixed assets13773293 11922324 10502990 3.9466 3.625 3.8098
Other assets 8989186 6013097 5633051 2.5758 1.828 2.0433TOTAL
ASSETS348990764 328895152 275685541 100 100 100
LIABILITIES
Bills payable 3452031 4138243 3091135 0.9891 1.258 1.1213Borrowings
from financial
institutions
13690222 21230697 8394130 3.9228 6.455 3.0448
Deposits and
other accounts300732858 273173841 239509391 86.172 83.06 86.878
Sub-ordinate
loans2571169 3220858 3222106 0.7367 0.979 1.1688
Liabilities
against assets
subject to
finance leaseDeferred tax
liability208465 1379809 1921338 0.0597 0.42 0.6969
Other liabilities 11291280 9531860 7305496 3.2354 2.898 2.6499
TOTAL
LIABILITIES331946025 312675308 263443596 95.116 95.07 95.559
NET ASSETS 17044739 16219844 12241945 4.884 4.93 4.441
REPRESENTED BY:
Shareholders EquityShare capital 7995000 6500000 5000000 2.291 1.98 1.814
Reserves 3166056 2414833 2749533 0.907 0.73 0.997Unappropriated
profit3447467 4851840 2823072 0.988 1.48 1.024
14608523 13766673 10572605 4.186 4.19 3.835Surplus on
revaluation of
assets - net of tax
2436216 2453171 1669340 0.698 0.75 0.606
55S h e i k h W a q as A h m e d
M c 0 7 0 4 0 0 4 7 9
Come and Join Us at www.vustudents.ning.com
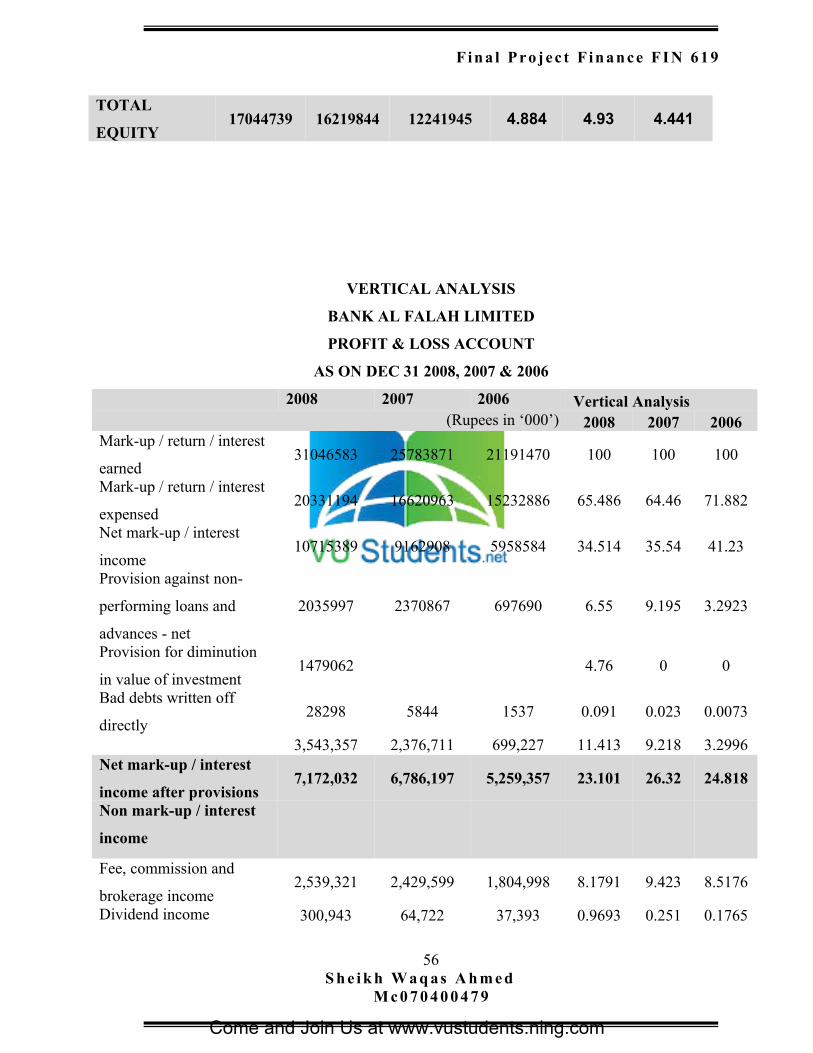
Fin a l Pro jec t F in an ce FI N 619
TOTAL
EQUITY17044739 16219844 12241945 4.884 4.93 4.441
VERTICAL ANALYSIS
BANK AL FALAH LIMITED
PROFIT & LOSS ACCOUNT
AS ON DEC 31 2008, 2007 & 2006
2008 2007 2006 Vertical Analysis(Rupees in ‘000’) 2008 2007 2006
Mark-up / return / interest
earned31046583 25783871 21191470 100 100 100
Mark-up / return / interest
expensed20331194 16620963 15232886 65.486 64.46 71.882
Net mark-up / interest
income10715389 9162908 5958584 34.514 35.54 41.23
Provision against non-
performing loans and
advances - net
2035997 2370867 697690 6.55 9.195 3.2923
Provision for diminution
in value of investment1479062 4.76 0 0
Bad debts written off
directly28298 5844 1537 0.091 0.023 0.0073
3,543,357 2,376,711 699,227 11.413 9.218 3.2996Net mark-up / interest
income after provisions7,172,032 6,786,197 5,259,357 23.101 26.32 24.818
Non mark-up / interest
income
Fee, commission and
brokerage income 2,539,321 2,429,599 1,804,998 8.1791 9.423 8.5176
Dividend income 300,943 64,722 37,393 0.9693 0.251 0.1765
56S h e i k h W a q as A h m e d
M c 0 7 0 4 0 0 4 7 9
Come and Join Us at www.vustudents.ning.com
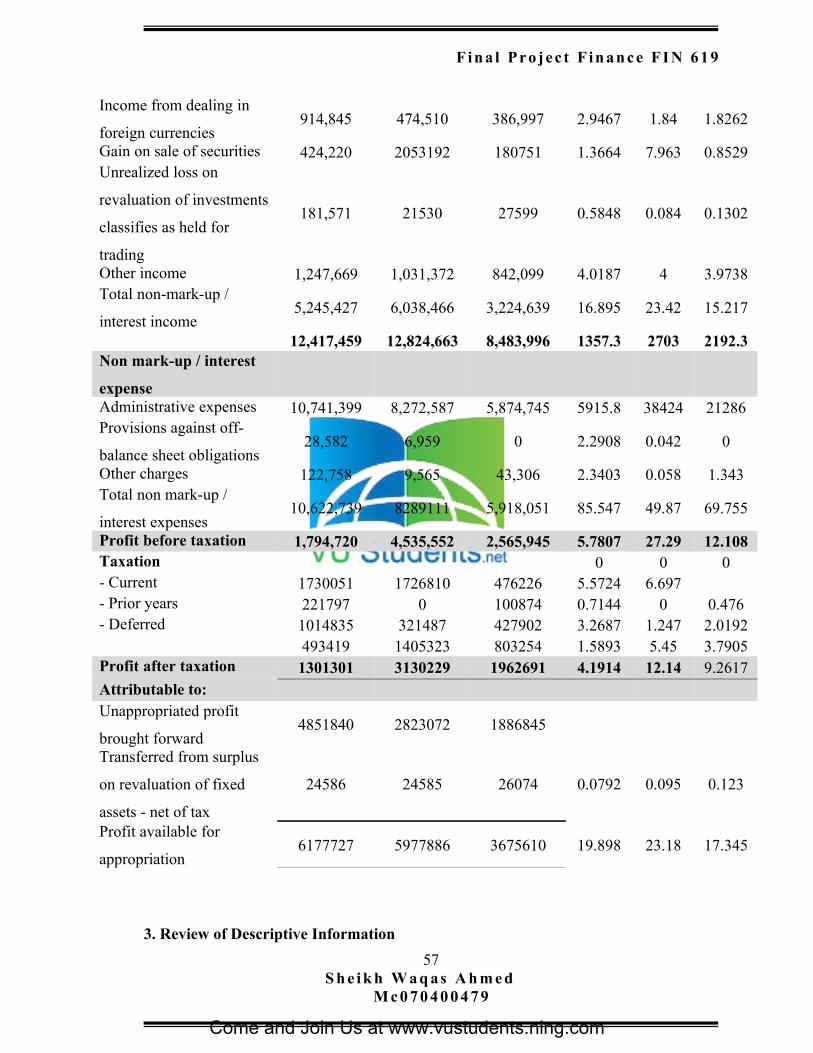
Fin a l Pro jec t F in an ce FI N 619
Income from dealing in
foreign currencies 914,845 474,510 386,997 2.9467 1.84 1.8262
Gain on sale of securities 424,220 2053192 180751 1.3664 7.963 0.8529Unrealized loss on
revaluation of investments
classifies as held for
trading
181,571 21530 27599 0.5848 0.084 0.1302
Other income 1,247,669 1,031,372 842,099 4.0187 4 3.9738Total non-mark-up /
interest income 5,245,427 6,038,466 3,224,639 16.895 23.42 15.217
12,417,459 12,824,663 8,483,996 1357.3 2703 2192.3Non mark-up / interest
expenseAdministrative expenses 10,741,399 8,272,587 5,874,745 5915.8 38424 21286Provisions against off-
balance sheet obligations28,582 6,959 0 2.2908 0.042 0
Other charges 122,758 9,565 43,306 2.3403 0.058 1.343Total non mark-up /
interest expenses10,622,739 8289111 5,918,051 85.547 49.87 69.755
Profit before taxation 1,794,720 4,535,552 2,565,945 5.7807 27.29 12.108Taxation 0 0 0- Current 1730051 1726810 476226 5.5724 6.697- Prior years 221797 0 100874 0.7144 0 0.476- Deferred 1014835 321487 427902 3.2687 1.247 2.0192
493419 1405323 803254 1.5893 5.45 3.7905Profit after taxation 1301301 3130229 1962691 4.1914 12.14 9.2617Attributable to:Unappropriated profit
brought forward4851840 2823072 1886845
Transferred from surplus
on revaluation of fixed
assets - net of tax
24586 24585 26074 0.0792 0.095 0.123
Profit available for
appropriation6177727 5977886 3675610 19.898 23.18 17.345
3. Review of Descriptive Information
57S h e i k h W a q as A h m e d
M c 0 7 0 4 0 0 4 7 9
Come and Join Us at www.vustudents.ning.com
Fin a l Pro jec t F in an ce FI N 619
Habib Bank Limited:
These financial statements have been prepared in accordance with approved accounting
standards as applicable in Pakistan. Approved accounting standards comprise of such
International Financial Reporting Standards issued by the International Accounting
Standards Board as are notified under the Companies Ordinance, 1984, provisions of and
directives issued under the Companies Ordinance, 1984 and Banking Companies
Ordinance, 1962 and the directives issued by State Bank of Pakistan (SBP). In case the
requirements of provisions and directives issued under the Companies Ordinance, 1984
and Banking Companies Ordinance, 1962 and the directives issued by SBP differ, the
provisions of and directives issued under the Companies Ordinance, 1984 and Banking
Companies Ordinance, 1962 and the directives issued by SBP shall prevail.
Amended IAS 27 Consolidated and Separate Financial Statements (effective for annual
periods beginning on or after 1 July 2009) requires accounting for changes in ownership
interest by the group in a subsidiary, while maintaining control, to be recognized as an
equity transaction. When the group loses control of subsidiary, any interest retained in the
former subsidiary will be measured at fair value with the gain or loss recognized in the
profit or loss. The application of the standard is not likely to have an effect on the
Group's financial statements. The auditors conducted their audit in accordance with the
auditing standards as applicable in Pakistan. These standards require that they plan and
perform the audit to obtain reasonable assurance about whether the above said statements
are free of any material misstatement. And in their opinion the consolidated financial
statements present fairly the financial position of Habib Bank Limited as at December 31,
2006, 2007 & 2008 and the results of its operations, its cash flows and changes in equity
for the year then ended in accordance with the approved accounting standards as
applicable in Pakistan.
Bank Al Falah Limited:
The financial statements prepared by the management, present fairly its state of affairs,
the results of its operating cash flow and changes in equity. All directors of the company
are registered as tax payers and none of them has default in payments of any loan to a
banking company. The auditors perform their audit in accordance with the auditing
58S h e i k h W a q as A h m e d
M c 0 7 0 4 0 0 4 7 9
Come and Join Us at www.vustudents.ning.com
Fin a l Pro jec t F in an ce FI N 619
standards as applicable in Pakistan. These standards require that they plan and perform
the audit to obtain reasonable assurance about whether the above said statements are free
of any material misstatement. And in their opinion the consolidated financial statements
present fairly the financial position of Habib Bank Limited as at December 31, 2006,
2007 & 2008 and the results of its operations, its cash flows and changes in equity for the
year then ended in accordance with the approved accounting standards as applicable in
Pakistan.
The board of directors through its sub committee called Board Risk Management
Committee (BRMC) oversees the overall risk of the bank. RMD is the organizational arm
performing the functions of identifying, measuring, monitoring and controlling the
various risks and assists the Apex level committee and the various sub- committees in
conversion of policies into action.
Credit risk Management processes encompasses identification, assessment, measurement,
monitoring and control of the credit exposures. The bank, as per State Bank of Pakistan
Guidelines, has migrated to baseII as on January, with the standardized approach.
4. Comparisons
Financial trend analysis is an applied, practical approach for monitoring the financial
condition of any company through the use of financial indicators. I shall use technique to
compare previous three-year period data and observes how they change. This would
permit an assessment of the current financial condition.
a) Trend Analysis
A firm's present ratio is compared with its past and expected future ratios to determine
whether the company's financial condition is improving or deteriorating over time. Trend
analysis studies the financial history of a firm for comparison. By looking at the trend of
a particular ratio, one sees whether the ratio is falling, rising, or remaining relatively
constant. This helps to detect problems or observe good management.
59S h e i k h W a q as A h m e d
M c 0 7 0 4 0 0 4 7 9
Come and Join Us at www.vustudents.ning.com
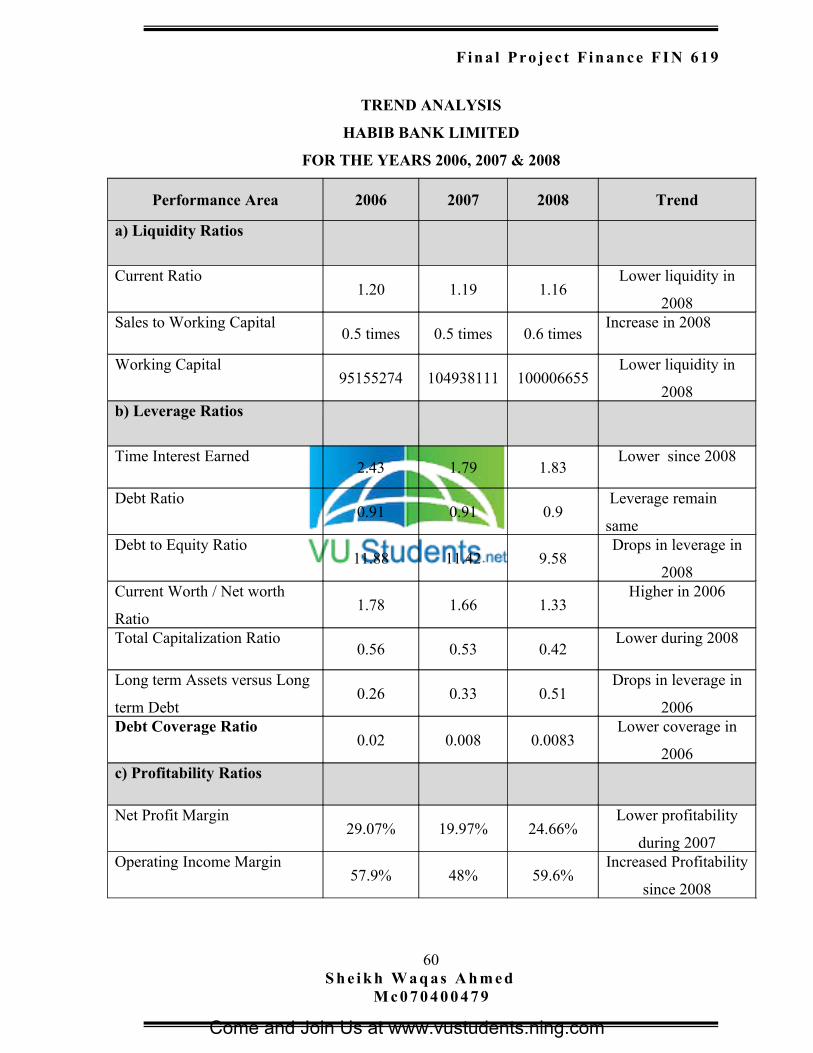
Fin a l Pro jec t F in an ce FI N 619
TREND ANALYSIS
HABIB BANK LIMITED
FOR THE YEARS 2006, 2007 & 2008
Performance Area 2006 2007 2008 Trend
a) Liquidity Ratios
Current Ratio1.20 1.19 1.16
Lower liquidity in
2008Sales to Working Capital
0.5 times 0.5 times 0.6 timesIncrease in 2008
Working Capital95155274 104938111 100006655
Lower liquidity in
2008b) Leverage Ratios
Time Interest Earned2.43 1.79 1.83
Lower since 2008
Debt Ratio0.91 0.91 0.9
Leverage remain
sameDebt to Equity Ratio
11.88 11.42 9.58Drops in leverage in
2008Current Worth / Net worth
Ratio1.78 1.66 1.33
Higher in 2006
Total Capitalization Ratio0.56 0.53 0.42
Lower during 2008
Long term Assets versus Long
term Debt0.26 0.33 0.51
Drops in leverage in
2006Debt Coverage Ratio
0.02 0.008 0.0083Lower coverage in
2006c) Profitability Ratios
Net Profit Margin29.07% 19.97% 24.66%
Lower profitability
during 2007Operating Income Margin
57.9% 48% 59.6%Increased Profitability
since 2008
60S h e i k h W a q as A h m e d
M c 0 7 0 4 0 0 4 7 9
Come and Join Us at www.vustudents.ning.com
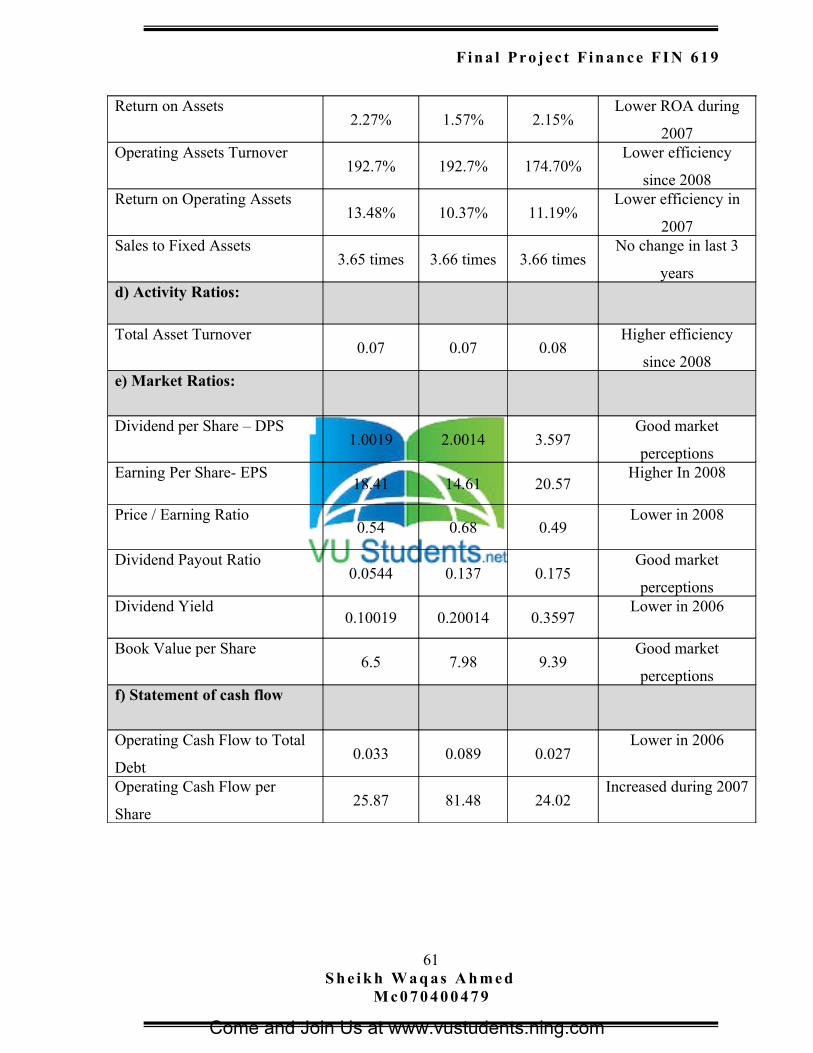
Fin a l Pro jec t F in an ce FI N 619
Return on Assets2.27% 1.57% 2.15%
Lower ROA during
2007Operating Assets Turnover
192.7% 192.7% 174.70%Lower efficiency
since 2008Return on Operating Assets
13.48% 10.37% 11.19%Lower efficiency in
2007Sales to Fixed Assets
3.65 times 3.66 times 3.66 timesNo change in last 3
yearsd) Activity Ratios:
Total Asset Turnover0.07 0.07 0.08
Higher efficiency
since 2008e) Market Ratios:
Dividend per Share – DPS1.0019 2.0014 3.597
Good market
perceptionsEarning Per Share- EPS
18.41 14.61 20.57Higher In 2008
Price / Earning Ratio0.54 0.68 0.49
Lower in 2008
Dividend Payout Ratio0.0544 0.137 0.175
Good market
perceptionsDividend Yield
0.10019 0.20014 0.3597Lower in 2006
Book Value per Share6.5 7.98 9.39
Good market
perceptionsf) Statement of cash flow
Operating Cash Flow to Total
Debt0.033 0.089 0.027
Lower in 2006
Operating Cash Flow per
Share25.87 81.48 24.02
Increased during 2007
61S h e i k h W a q as A h m e d
M c 0 7 0 4 0 0 4 7 9
Come and Join Us at www.vustudents.ning.com
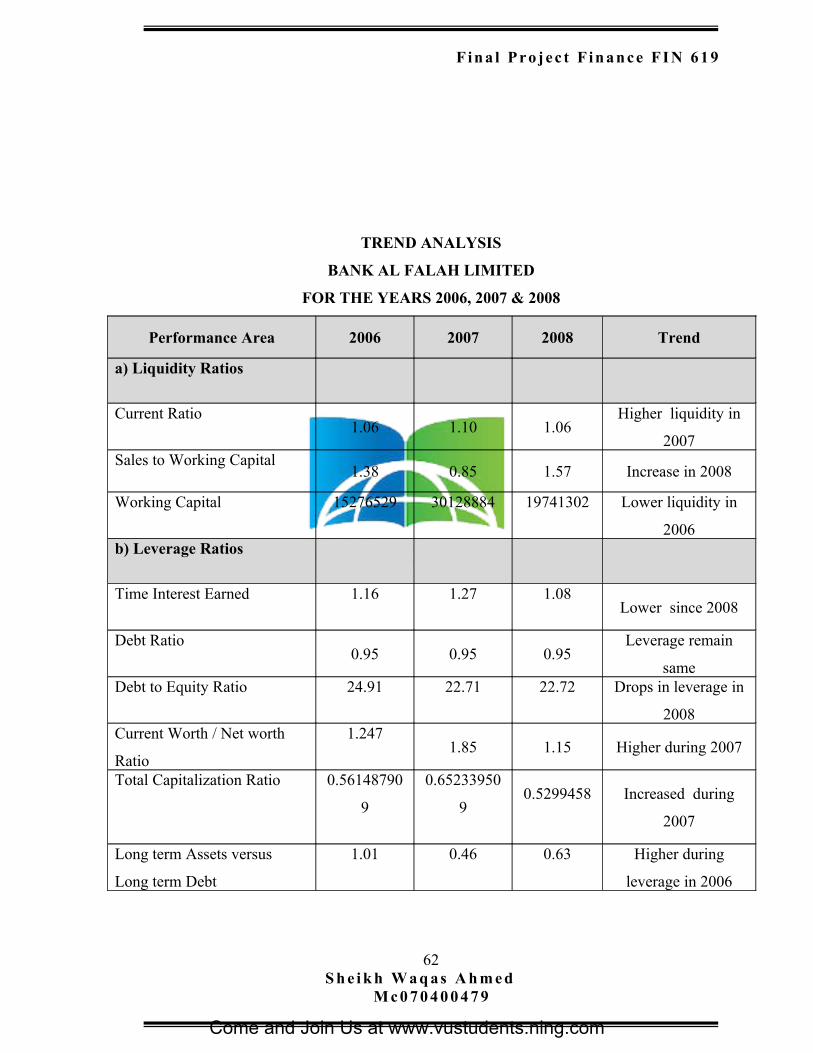
Fin a l Pro jec t F in an ce FI N 619
TREND ANALYSIS
BANK AL FALAH LIMITED
FOR THE YEARS 2006, 2007 & 2008
Performance Area 2006 2007 2008 Trend
a) Liquidity Ratios
Current Ratio1.06 1.10 1.06
Higher liquidity in
2007Sales to Working Capital
1.38 0.85 1.57 Increase in 2008
Working Capital 15276529 30128884 19741302 Lower liquidity in
2006b) Leverage Ratios
Time Interest Earned 1.16 1.27 1.08Lower since 2008
Debt Ratio0.95 0.95 0.95
Leverage remain
sameDebt to Equity Ratio 24.91 22.71 22.72 Drops in leverage in
2008Current Worth / Net worth
Ratio
1.2471.85 1.15 Higher during 2007
Total Capitalization Ratio 0.56148790
9
0.65233950
90.5299458 Increased during
2007
Long term Assets versus
Long term Debt
1.01 0.46 0.63 Higher during
leverage in 2006
62S h e i k h W a q as A h m e d
M c 0 7 0 4 0 0 4 7 9
Come and Join Us at www.vustudents.ning.com
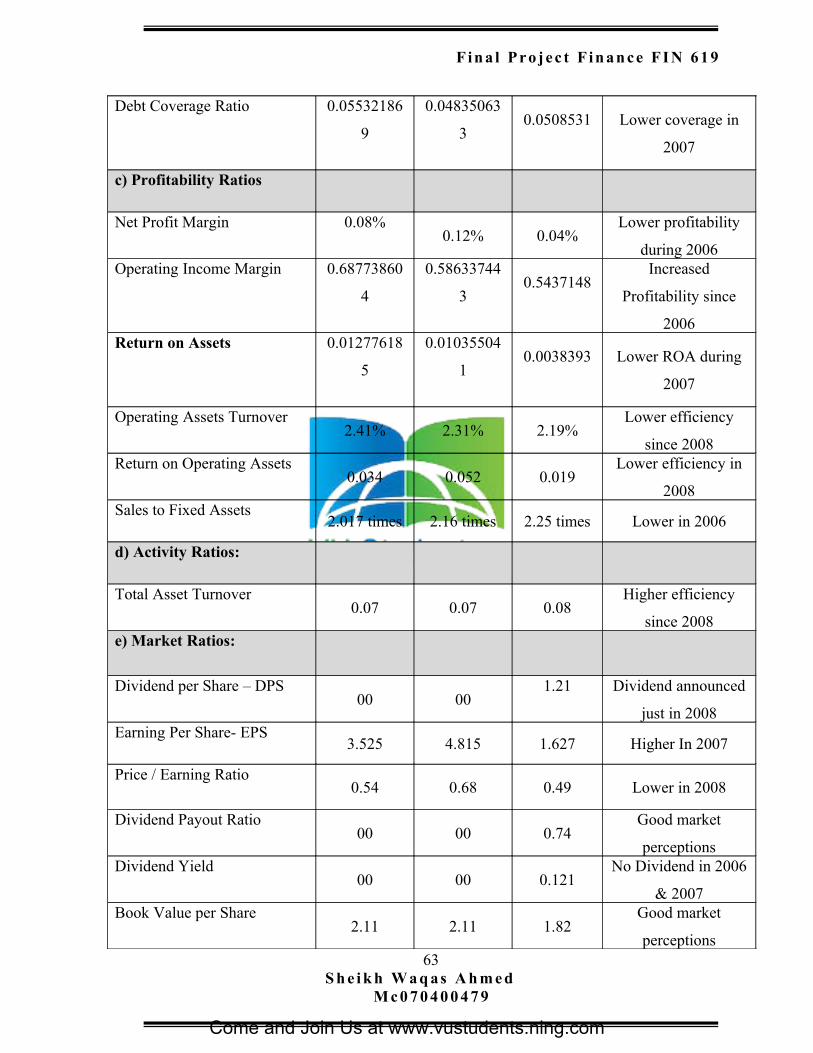
Fin a l Pro jec t F in an ce FI N 619
Debt Coverage Ratio 0.05532186
9
0.04835063
30.0508531 Lower coverage in
2007
c) Profitability Ratios
Net Profit Margin 0.08%0.12% 0.04%
Lower profitability
during 2006Operating Income Margin 0.68773860
4
0.58633744
30.5437148
Increased
Profitability since
2006Return on Assets 0.01277618
5
0.01035504
10.0038393 Lower ROA during
2007
Operating Assets Turnover2.41% 2.31% 2.19%
Lower efficiency
since 2008Return on Operating Assets
0.034 0.052 0.019Lower efficiency in
2008Sales to Fixed Assets
2.017 times 2.16 times 2.25 times Lower in 2006
d) Activity Ratios:
Total Asset Turnover0.07 0.07 0.08
Higher efficiency
since 2008e) Market Ratios:
Dividend per Share – DPS00 00
1.21 Dividend announced
just in 2008Earning Per Share- EPS
3.525 4.815 1.627 Higher In 2007
Price / Earning Ratio0.54 0.68 0.49 Lower in 2008
Dividend Payout Ratio00 00 0.74
Good market
perceptionsDividend Yield
00 00 0.121No Dividend in 2006
& 2007Book Value per Share
2.11 2.11 1.82Good market
perceptions63
S h e i k h W a q as A h m e dM c 0 7 0 4 0 0 4 7 9
Come and Join Us at www.vustudents.ning.com
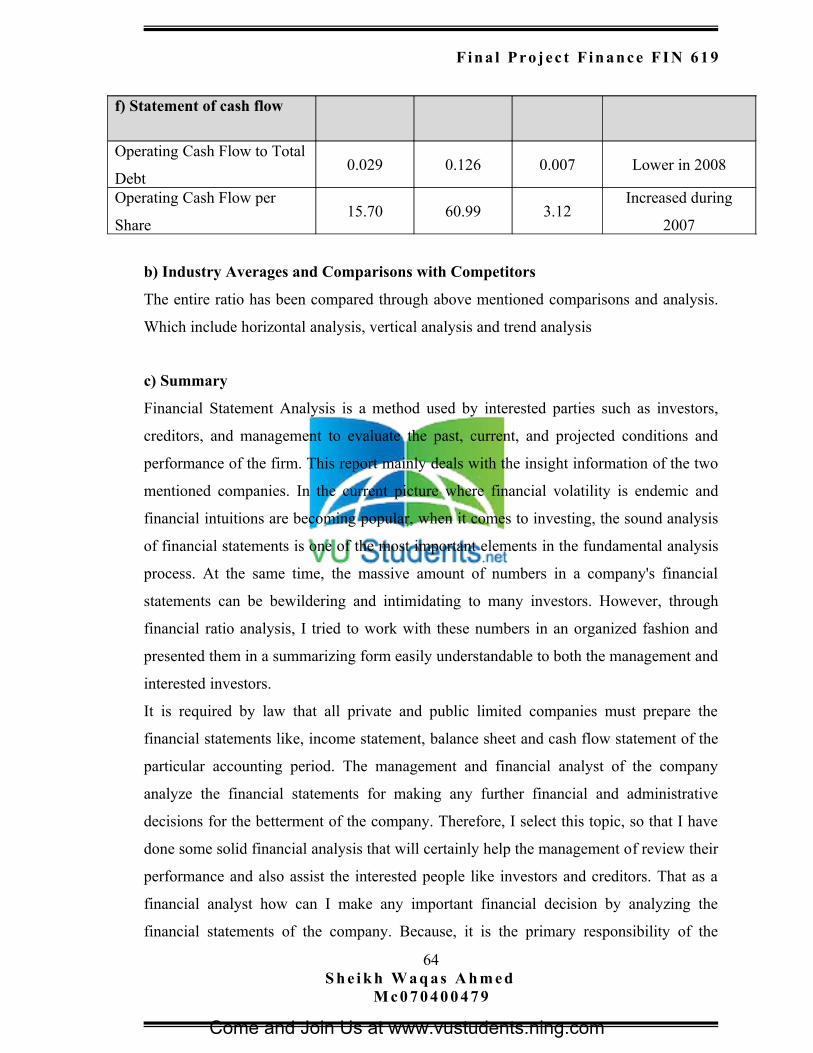
Fin a l Pro jec t F in an ce FI N 619
f) Statement of cash flow
Operating Cash Flow to Total
Debt0.029 0.126 0.007 Lower in 2008
Operating Cash Flow per
Share15.70 60.99 3.12
Increased during
2007
b) Industry Averages and Comparisons with Competitors
The entire ratio has been compared through above mentioned comparisons and analysis.
Which include horizontal analysis, vertical analysis and trend analysis
c) Summary
Financial Statement Analysis is a method used by interested parties such as investors,
creditors, and management to evaluate the past, current, and projected conditions and
performance of the firm. This report mainly deals with the insight information of the two
mentioned companies. In the current picture where financial volatility is endemic and
financial intuitions are becoming popular, when it comes to investing, the sound analysis
of financial statements is one of the most important elements in the fundamental analysis
process. At the same time, the massive amount of numbers in a company's financial
statements can be bewildering and intimidating to many investors. However, through
financial ratio analysis, I tried to work with these numbers in an organized fashion and
presented them in a summarizing form easily understandable to both the management and
interested investors.
It is required by law that all private and public limited companies must prepare the
financial statements like, income statement, balance sheet and cash flow statement of the
particular accounting period. The management and financial analyst of the company
analyze the financial statements for making any further financial and administrative
decisions for the betterment of the company. Therefore, I select this topic, so that I have
done some solid financial analysis that will certainly help the management of review their
performance and also assist the interested people like investors and creditors. That as a
financial analyst how can I make any important financial decision by analyzing the
financial statements of the company. Because, it is the primary responsibility of the
64S h e i k h W a q as A h m e d
M c 0 7 0 4 0 0 4 7 9
Come and Join Us at www.vustudents.ning.com
Fin a l Pro jec t F in an ce FI N 619
financial managers or financial analyst to manage the financial matters of the company
by evaluating the financial statements. I am also providing some important suggestions
and opinions about the financial matters of the business.
d) Conclusion / Findings:
I compare and analysis the financial statements of Habib Bank Limited and Bank Al
Falah Limited.
Liquidity position of both companies is not up to standard, both are below
industry average, but the liquidity position of Habib Bank is better from Bank
AL Falah Limited. Working capital of Habib Bank is better than Bank La
Falah, but both companies must improve their liquidity position.
Leverage ratios indicate the high risk associated with both the companies.
Generally leverage ratios, measures the percentage of funds provided by the
creditors. The proportion of a firm’s total assets is being financed with high
percentage of borrowed funds.
Profitability ratios of Habib Bank Limited are better than Bank AL Falah
Limited. Net profit of Bank Al falah Limited is low due to heavy financial
charges.
Habib Bank has a good market perception due to continuous declaration of
dividends but on the other hand Bank LA Falah limited has not announced in
dividend in the year 2006 and 2007.
Book value per share of Habib Bank Limited is much higher than the Al
Falah Bank. It is the Indication of the net worth of the corporation. Somewhat
similar to the earnings per share, but it relates the stockholder's equity to the
number of shares outstanding, giving the shares a raw value. So the net worth
of Habib Bank is better than Al Falah Bank.
Earning per Share and Operating cash flow of Habib Bank Limited is also
better than Bank AL Falah Limited.
65S h e i k h W a q as A h m e d
M c 0 7 0 4 0 0 4 7 9
Come and Join Us at www.vustudents.ning.com
Fin a l Pro jec t F in an ce FI N 619
e) Recommendation
This section deals with your proposed solutions or plans to cover and remove all the ills
and deficiencies that you think (in light of data processing and analysis) needs to be removed
or improved. Recommendations should be vivid, lucid and based on your findings. They
must be logical and applicable.
Section II
a) Introduction of the student
� B.com (2 Years)
� Warsan Homoeopathic Laboratories
� Assistant Accounts Officer
� 2 Years Experience
66S h e i k h W a q as A h m e d
M c 0 7 0 4 0 0 4 7 9
Come and Join Us at www.vustudents.ning.com
Fin a l Pro jec t F in an ce FI N 619
67S h e i k h W a q as A h m e d
M c 0 7 0 4 0 0 4 7 9
Come and Join Us at www.vustudents.ning.com
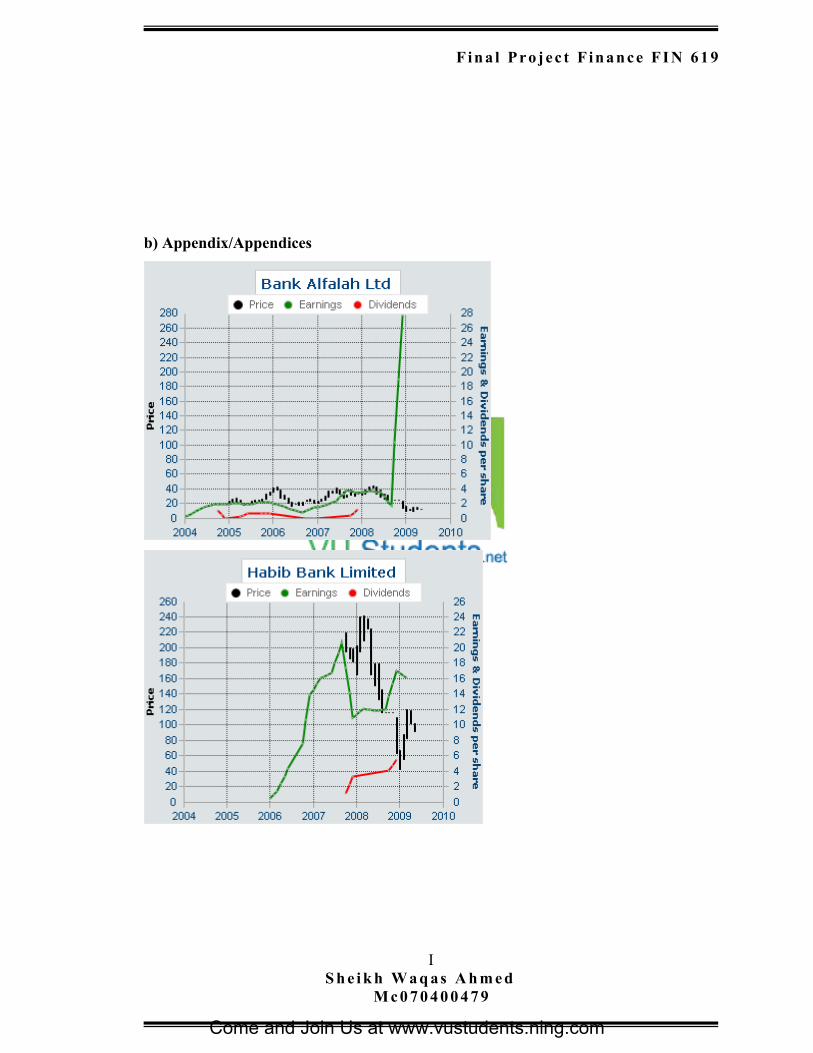
Fin a l Pro jec t F in an ce FI N 619
b) Appendix/Appendices
IS h e i k h W a q as A h m e d
M c 0 7 0 4 0 0 4 7 9
Come and Join Us at www.vustudents.ning.com
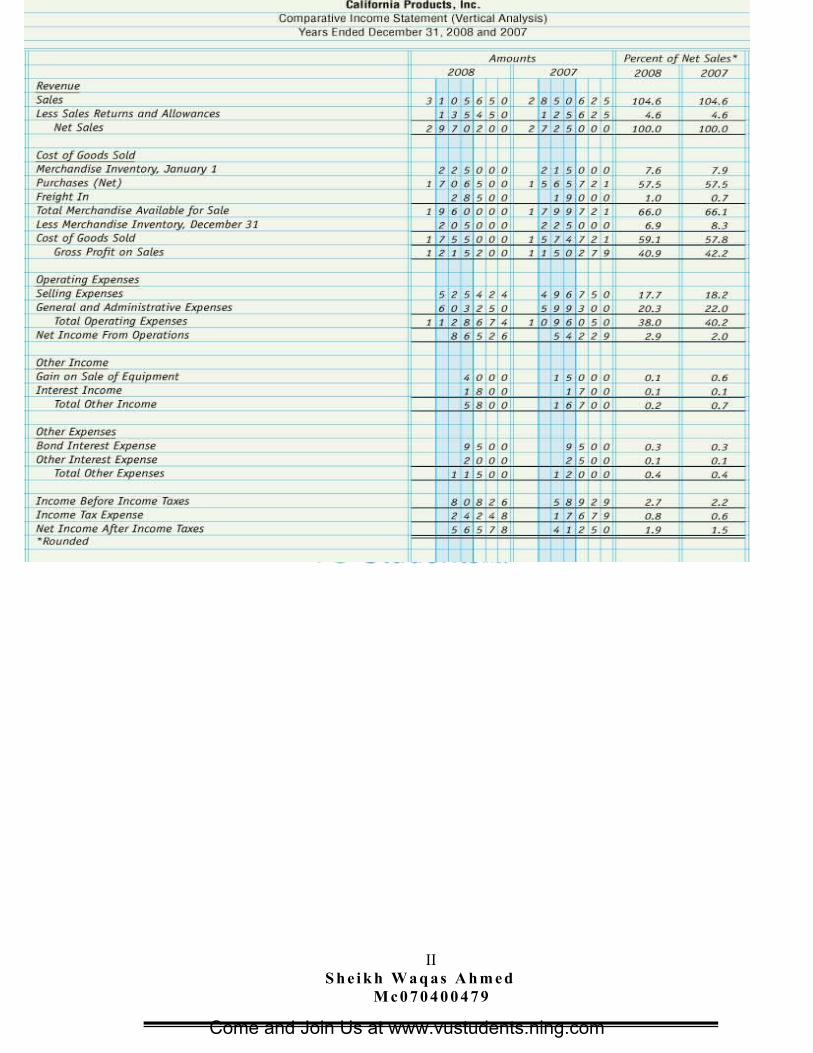
Fin a l Pro jec t F in an ce FI N 619
IIS h e i k h W a q as A h m e d
M c 0 7 0 4 0 0 4 7 9
Come and Join Us at www.vustudents.ning.com
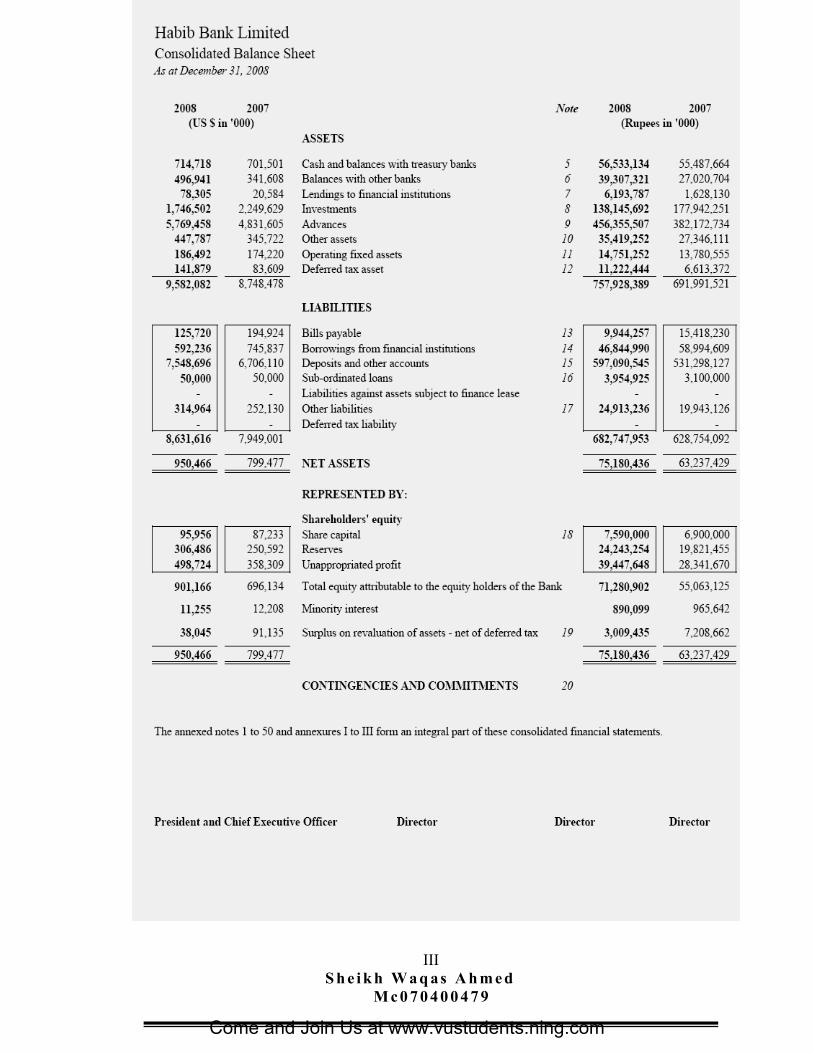
Fin a l Pro jec t F in an ce FI N 619
IIIS h e i k h W a q as A h m e d
M c 0 7 0 4 0 0 4 7 9
Come and Join Us at www.vustudents.ning.com
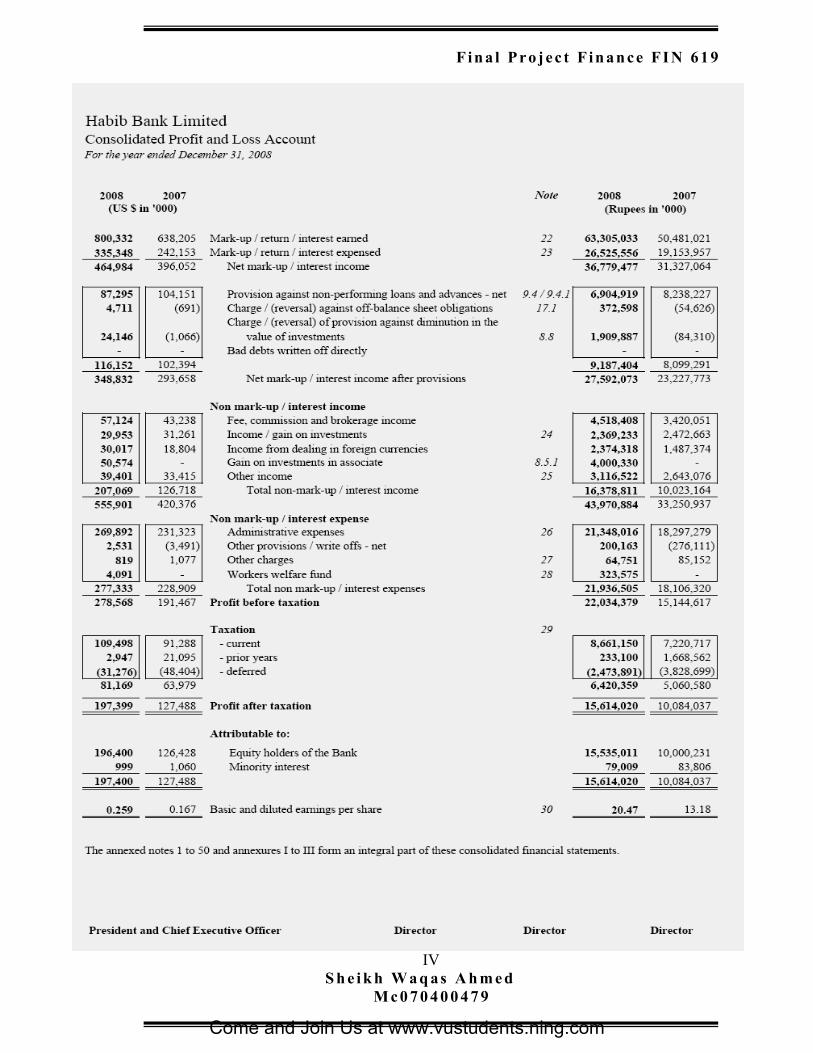
Fin a l Pro jec t F in an ce FI N 619
IVS h e i k h W a q as A h m e d
M c 0 7 0 4 0 0 4 7 9
Come and Join Us at www.vustudents.ning.com
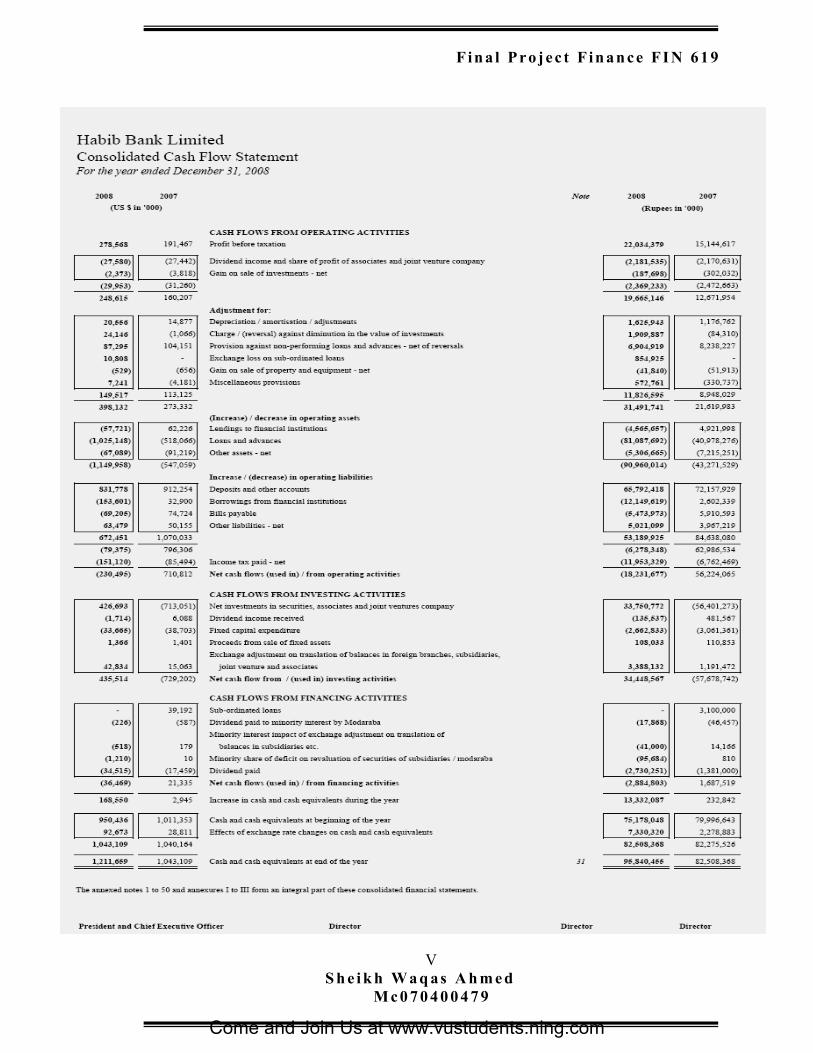
Fin a l Pro jec t F in an ce FI N 619
VS h e i k h W a q as A h m e d
M c 0 7 0 4 0 0 4 7 9
Come and Join Us at www.vustudents.ning.com
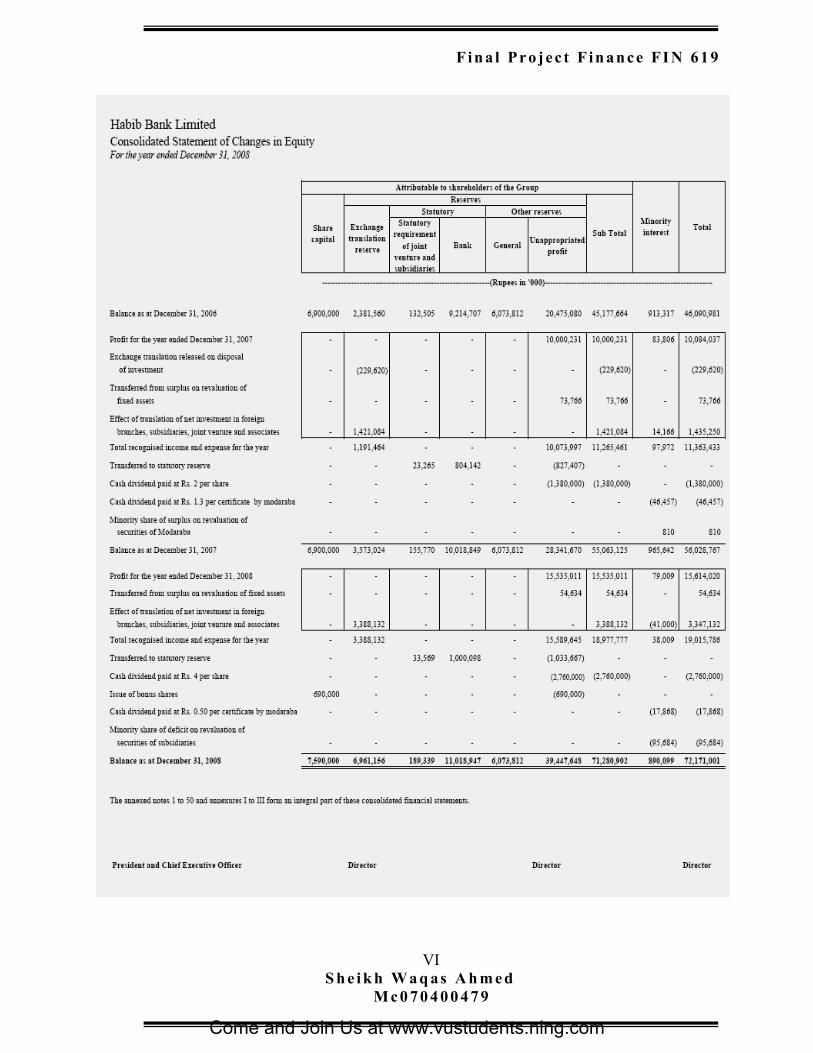
Fin a l Pro jec t F in an ce FI N 619
VIS h e i k h W a q as A h m e d
M c 0 7 0 4 0 0 4 7 9
Come and Join Us at www.vustudents.ning.com

Fin a l Pro jec t F in an ce FI N 619
VIIS h e i k h W a q as A h m e d
M c 0 7 0 4 0 0 4 7 9
Come and Join Us at www.vustudents.ning.com
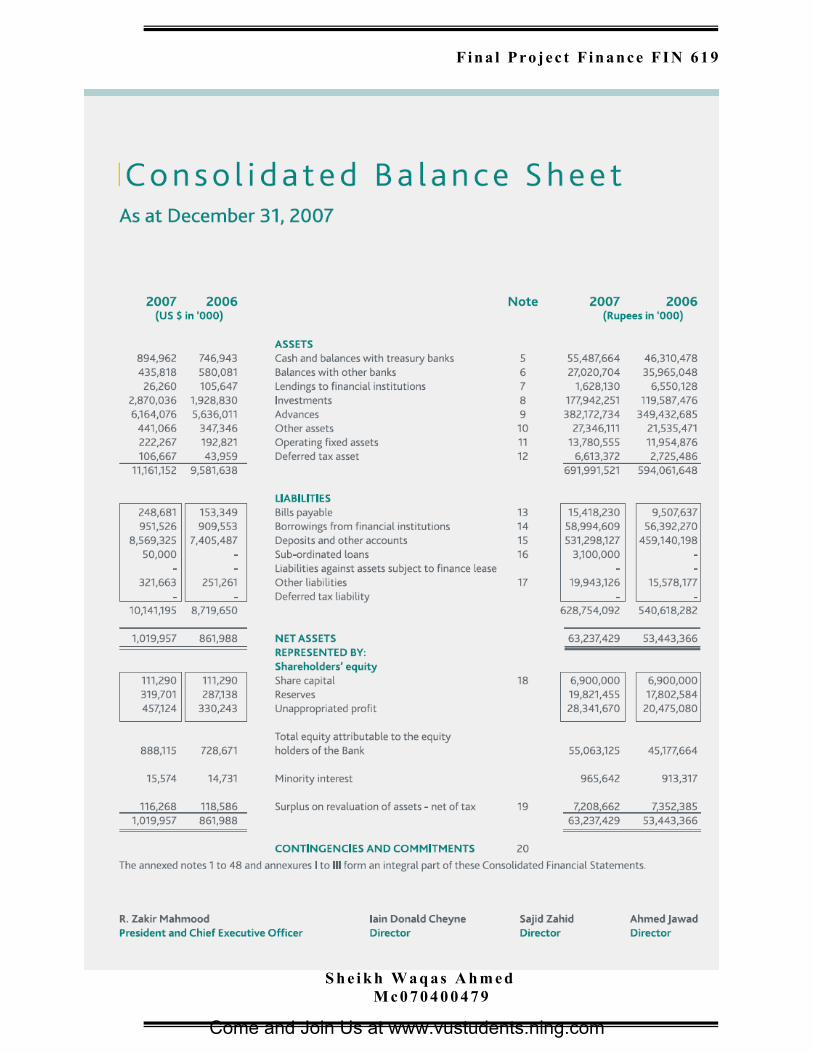
Fin a l Pro jec t F in an ce FI N 619
VIIIS h e i k h W a q as A h m e d
M c 0 7 0 4 0 0 4 7 9
Come and Join Us at www.vustudents.ning.com
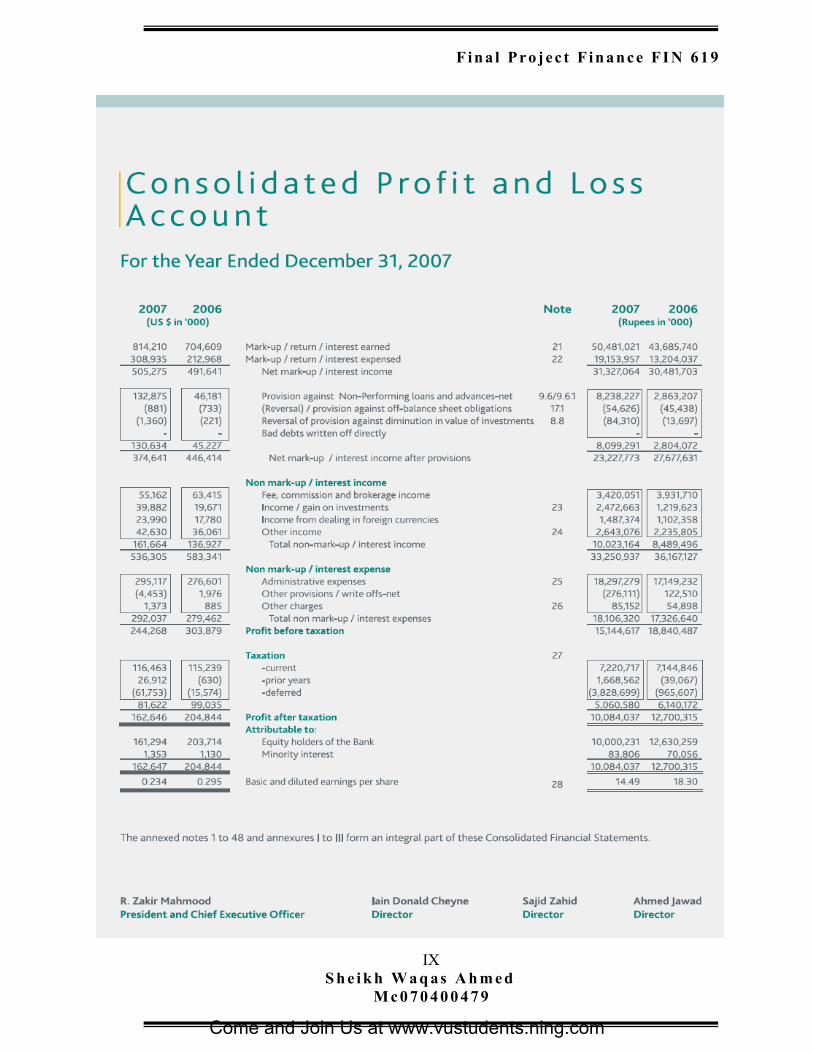
Fin a l Pro jec t F in an ce FI N 619
IXS h e i k h W a q as A h m e d
M c 0 7 0 4 0 0 4 7 9
Come and Join Us at www.vustudents.ning.com
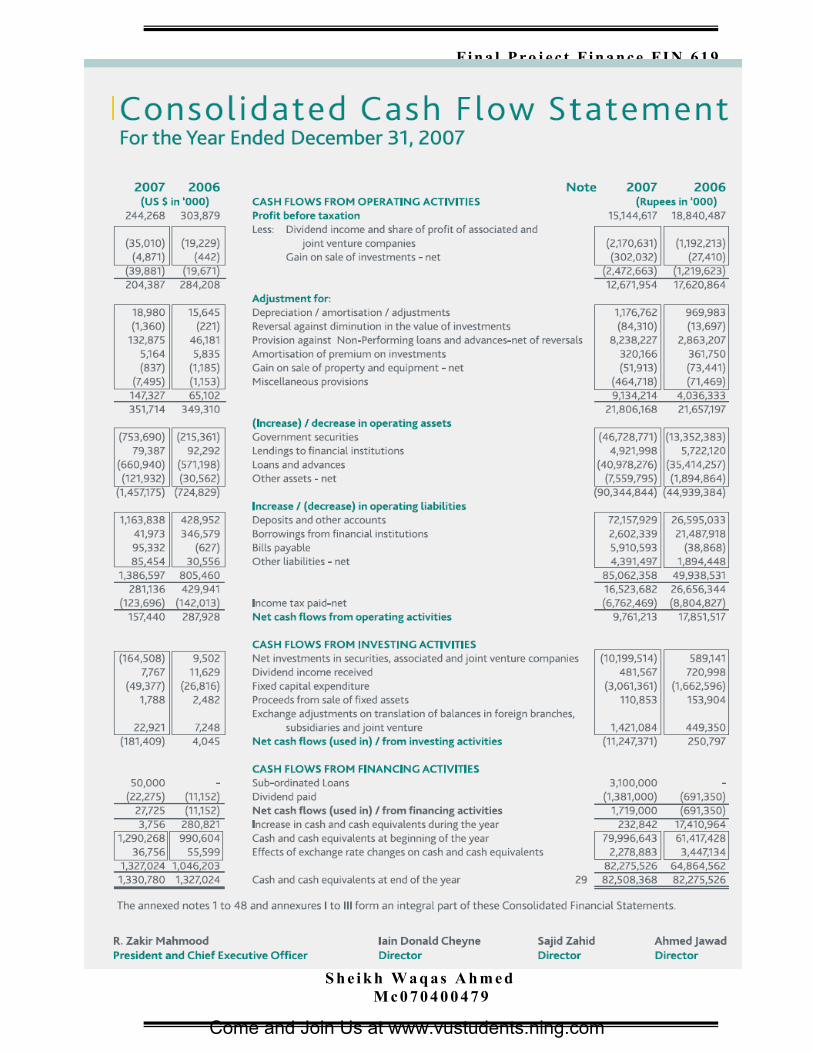
Fin a l Pro jec t F in an ce FI N 619
XS h e i k h W a q as A h m e d
M c 0 7 0 4 0 0 4 7 9
Come and Join Us at www.vustudents.ning.com
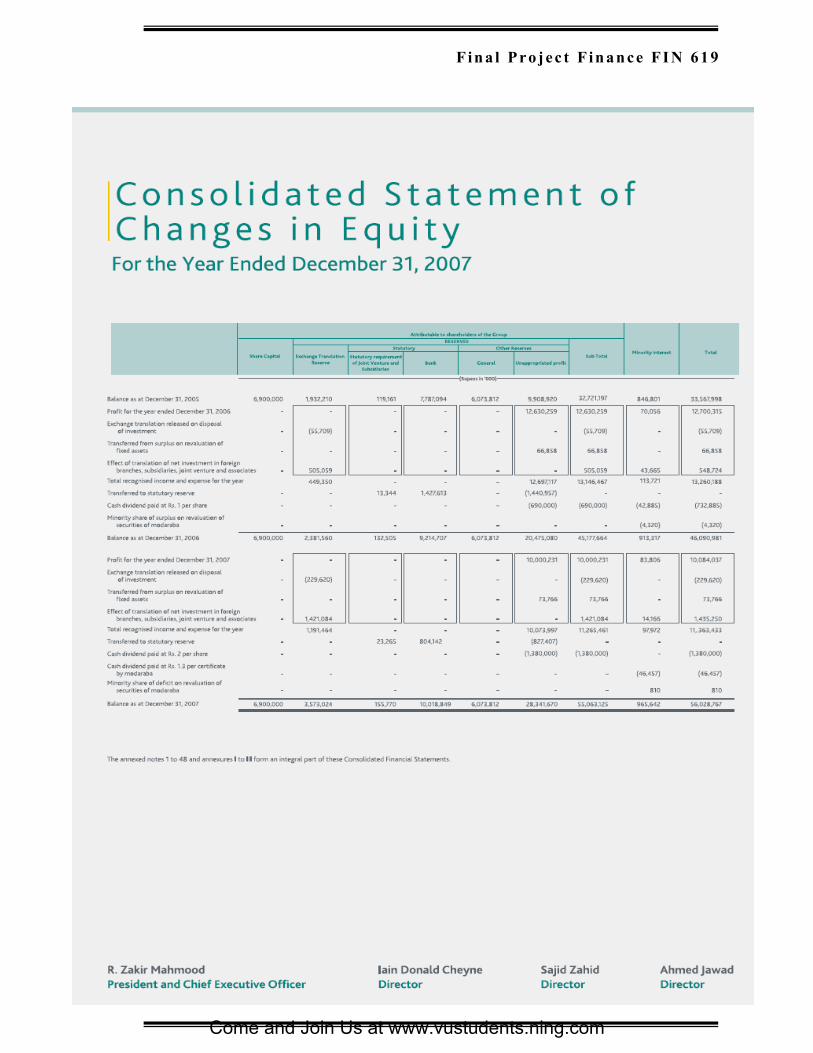
Fin a l Pro jec t F in an ce FI N 619
XIS h e i k h W a q as A h m e d
M c 0 7 0 4 0 0 4 7 9
Come and Join Us at www.vustudents.ning.com
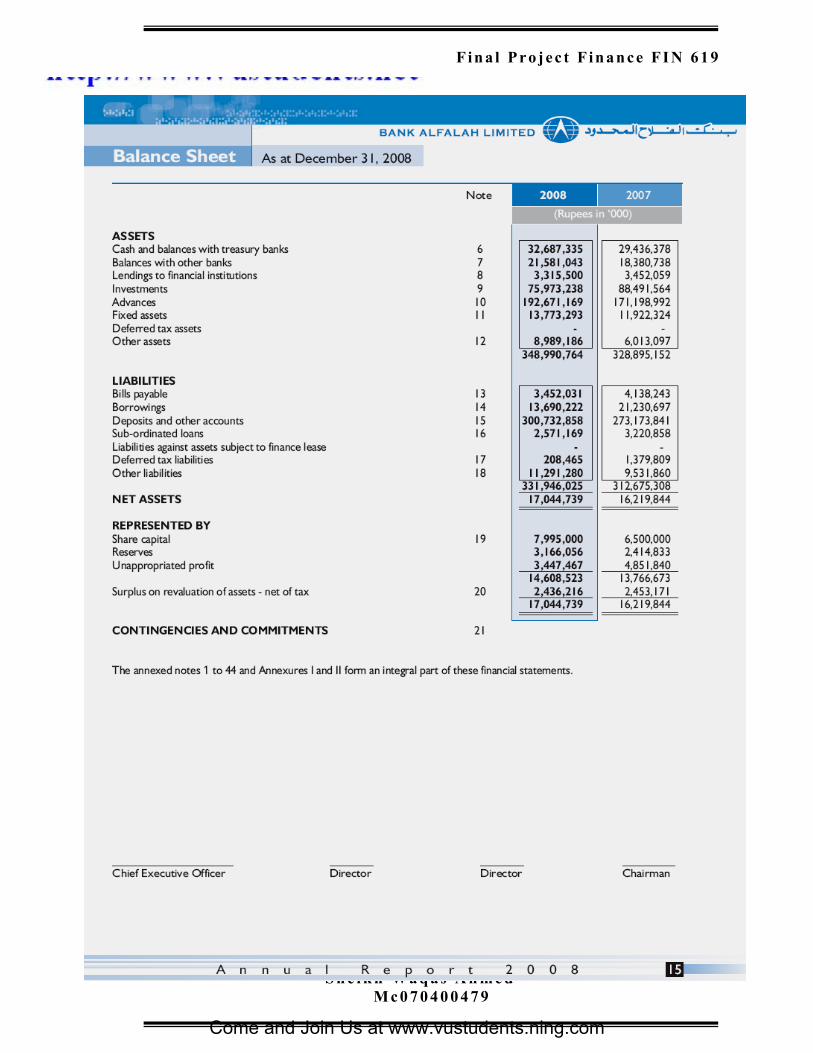
Fin a l Pro jec t F in an ce FI N 619
XIIS h e i k h W a q as A h m e d
M c 0 7 0 4 0 0 4 7 9
Come and Join Us at www.vustudents.ning.com
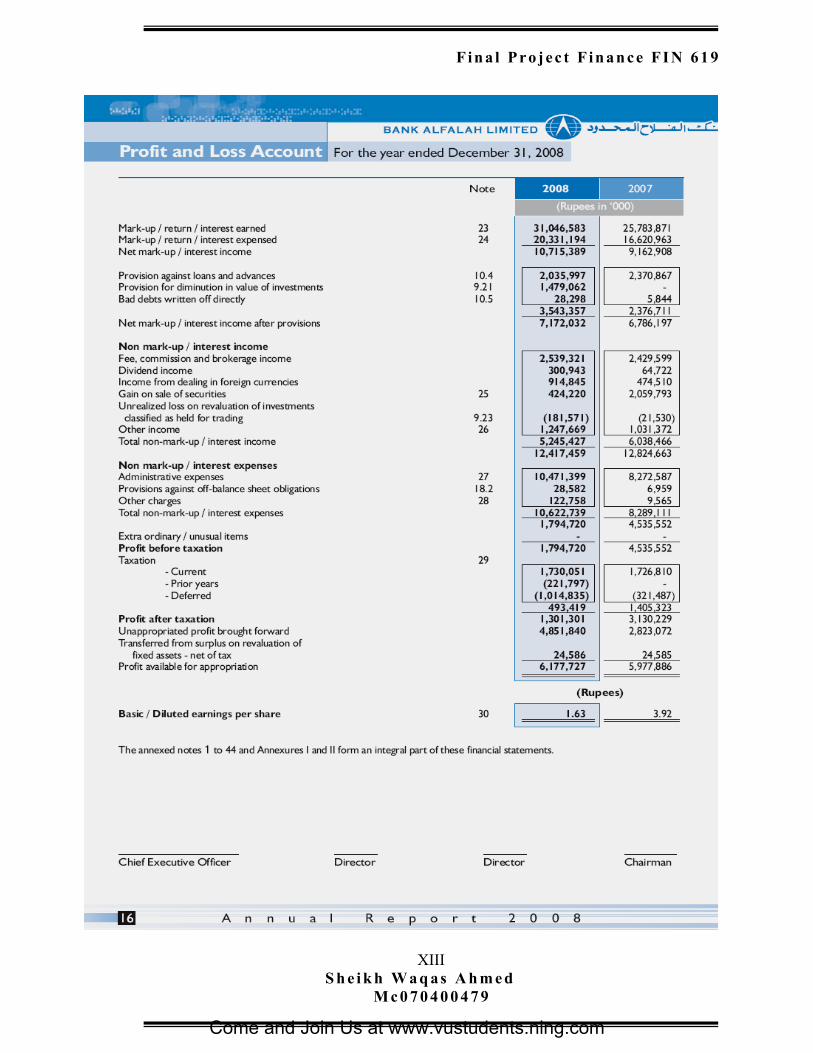
Fin a l Pro jec t F in an ce FI N 619
XIIIS h e i k h W a q as A h m e d
M c 0 7 0 4 0 0 4 7 9
Come and Join Us at www.vustudents.ning.com
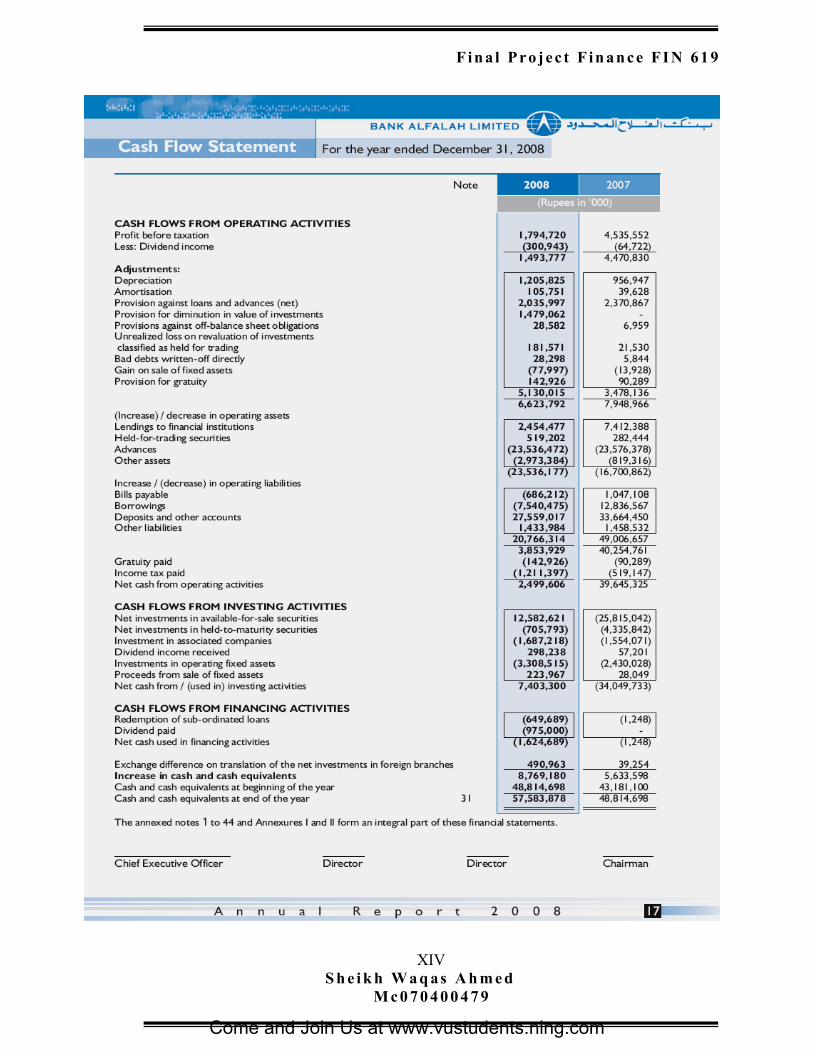
Fin a l Pro jec t F in an ce FI N 619
XIVS h e i k h W a q as A h m e d
M c 0 7 0 4 0 0 4 7 9
Come and Join Us at www.vustudents.ning.com
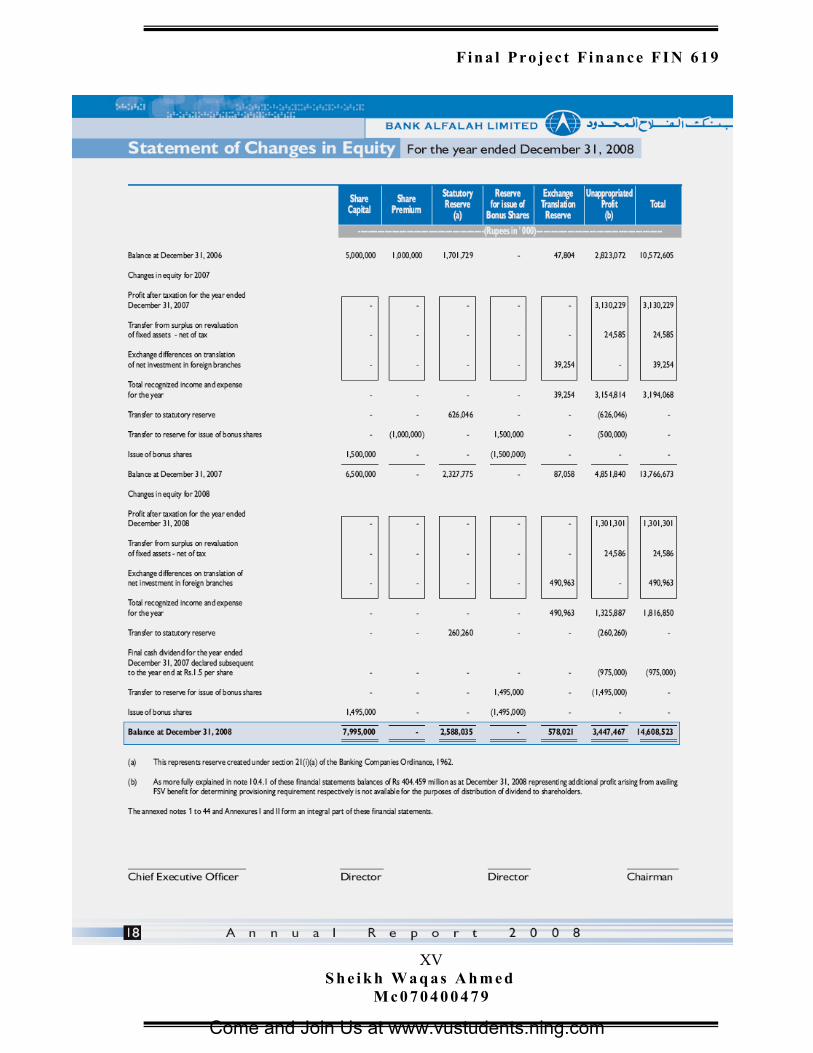
Fin a l Pro jec t F in an ce FI N 619
XVS h e i k h W a q as A h m e d
M c 0 7 0 4 0 0 4 7 9
Come and Join Us at www.vustudents.ning.com
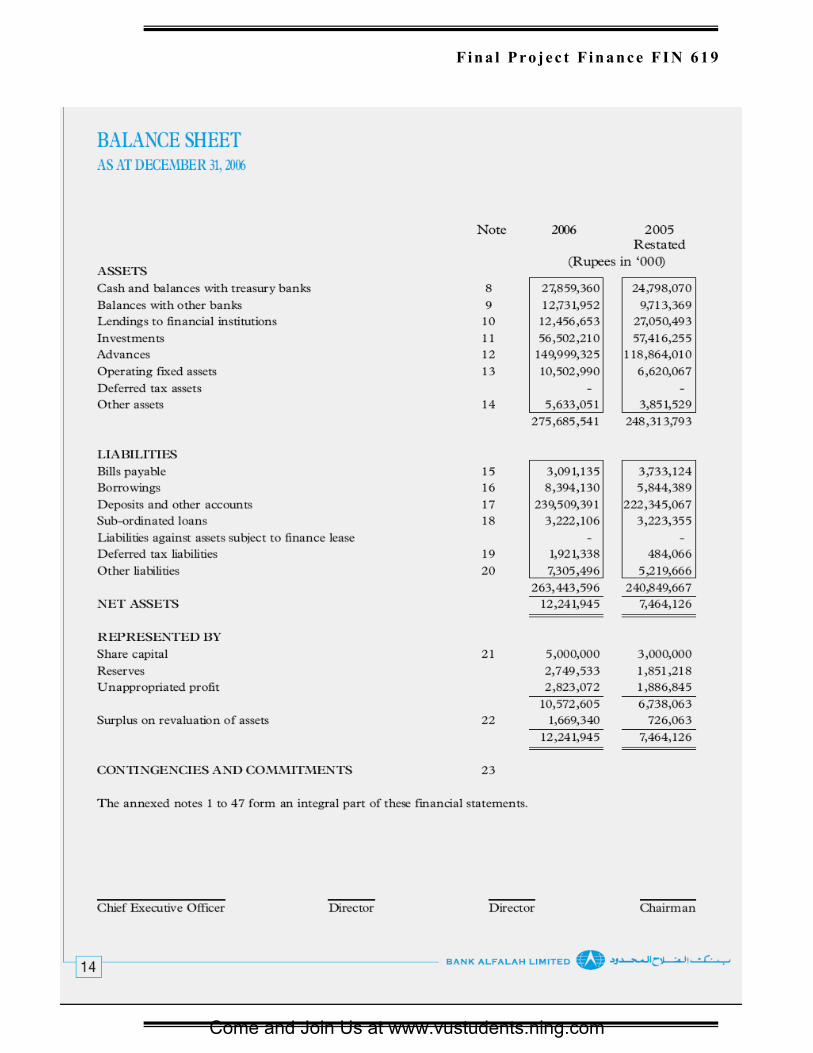
Fin a l Pro jec t F in an ce FI N 619
XVIS h e i k h W a q as A h m e d
M c 0 7 0 4 0 0 4 7 9
Come and Join Us at www.vustudents.ning.com
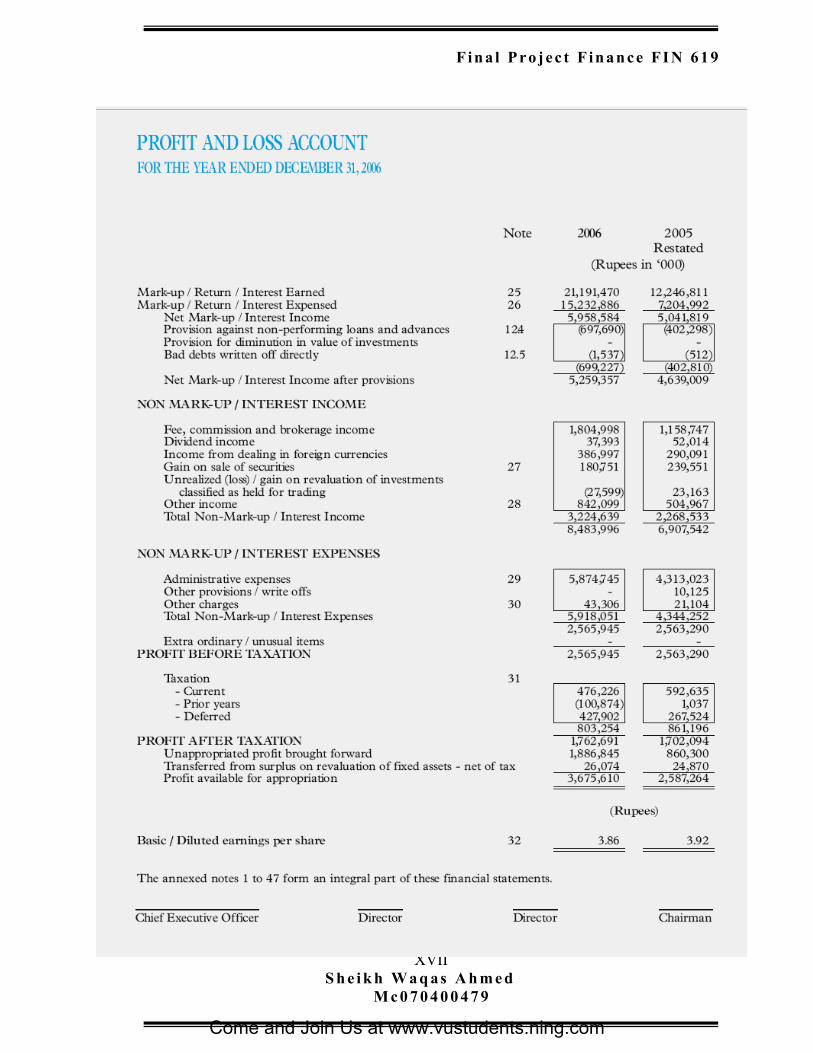
Fin a l Pro jec t F in an ce FI N 619
XVIIS h e i k h W a q as A h m e d
M c 0 7 0 4 0 0 4 7 9
Come and Join Us at www.vustudents.ning.com
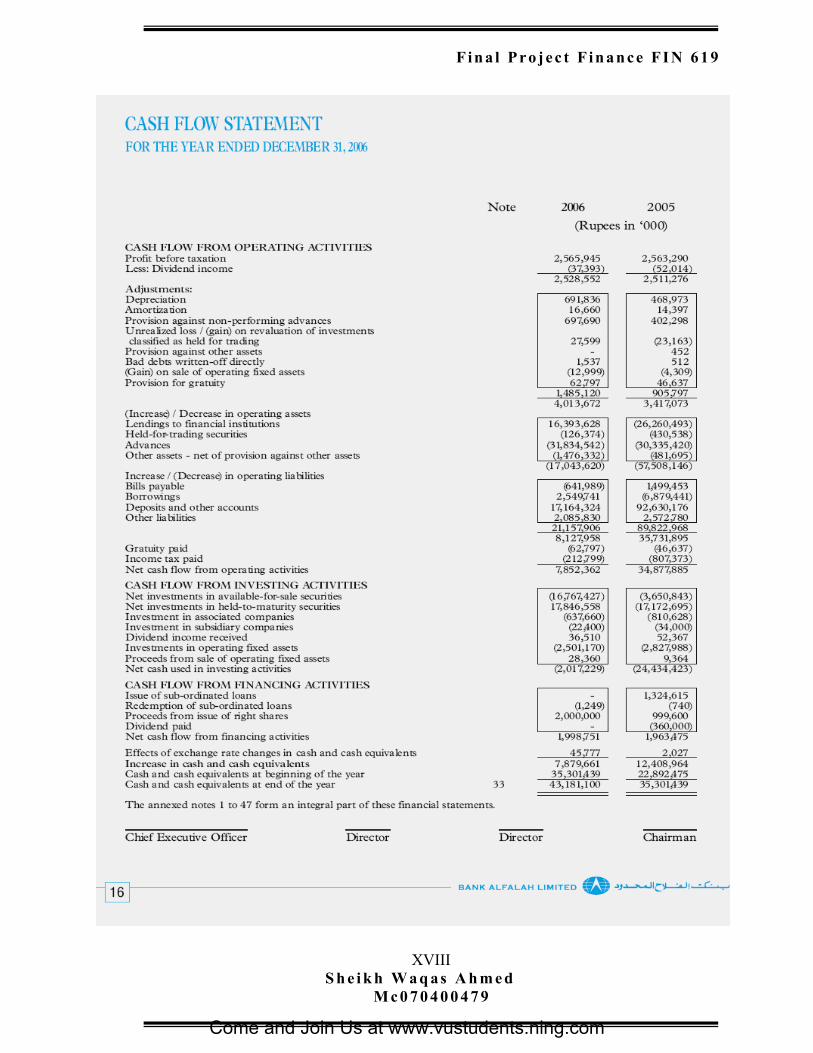
Fin a l Pro jec t F in an ce FI N 619
XVIIIS h e i k h W a q as A h m e d
M c 0 7 0 4 0 0 4 7 9
Come and Join Us at www.vustudents.ning.com
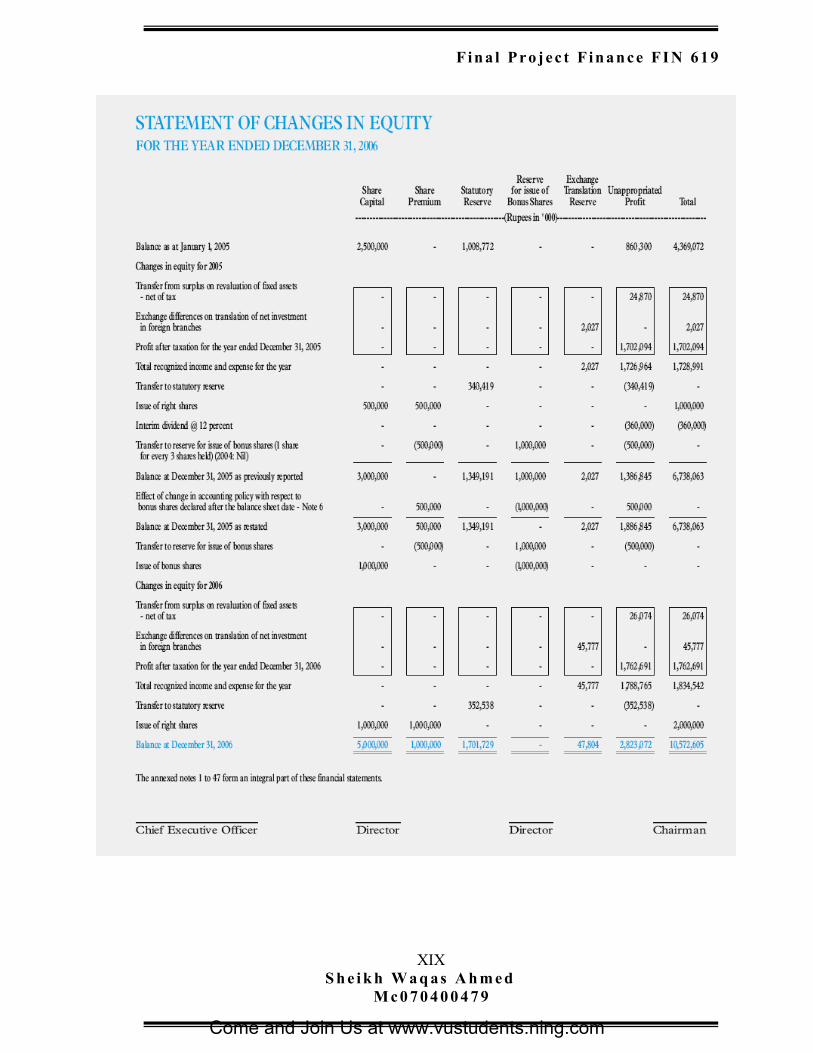
Fin a l Pro jec t F in an ce FI N 619
XIXS h e i k h W a q as A h m e d
M c 0 7 0 4 0 0 4 7 9
Come and Join Us at www.vustudents.ning.com
Fin a l Pro jec t F in an ce FI N 619
c) Bibliography
• Vu hand Outs
• Internet sources
• www.investopedia.com
• www.bankalhabib.com
• www.habibbankltd.com
• http://www.canadaone.com/tools/ratios/debt_equity.html
• Financial Statement Analysis : A Practitioner's Guide, 3rd Edition.
• Ross, S.A., R.W. Westerfield and B.D. Jordan. Essentials of Corporate Finance
(1999), 2nd Edition, Irwin/McGraw-Hill.
• Ross, S.A., R.W. Westerfield and J. Jaffe. Corporate Finance (1999), 5th Edition,
Irwin/McGraw-Hill.
• Scott, D.F., J.D. Martin, J.W. Petty and A. Keown. Basic Financial Management
(1999), 8th Edition, Prentice-Hall, Inc.
d) Index
An index is an alphabetical list of names, places and subjects mentioned in the report,
along with the page on which they occur. They are rarely included in unpublished
reports.
XXS h e i k h W a q as A h m e d
M c 0 7 0 4 0 0 4 7 9
Come and Join Us at www.vustudents.ning.com