combustion based report and analysis
TRANSCRIPT

Combustion based Report and Analysis
On
ULSD > Ultra Low Sulphur Diesel B100 > 100% Biodiesel B100adv. > 100% Biodiesel with advanced
injection timing of 3°.
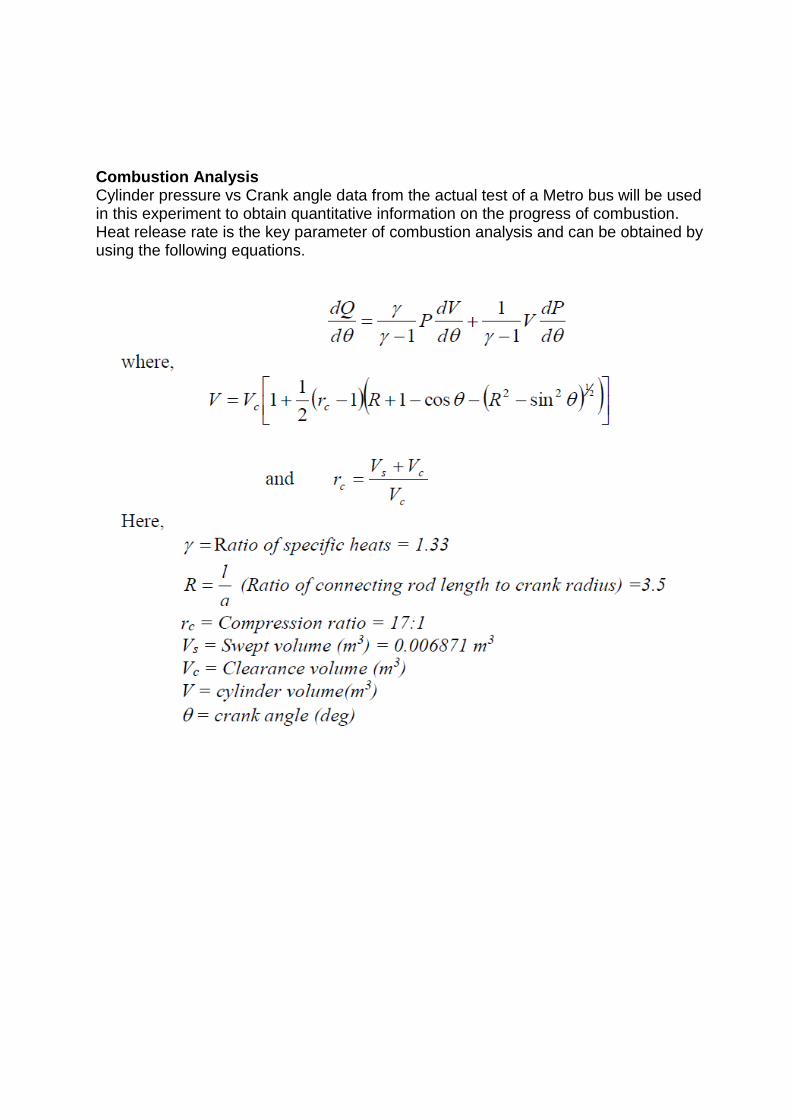
Combustion Analysis Cylinder pressure vs Crank angle data from the actual test of a Metro bus will be used in this experiment to obtain quantitative information on the progress of combustion. Heat release rate is the key parameter of combustion analysis and can be obtained by using the following equations.

Performance Test To analyse the performance of an engine, the required parameters are, efficiency (η), torque (T), output power (P) and input energy (Q). The efficiency of the engine can be obtained from the following relation
We have to download the data and calculate the above equations and put it in a graph. The Fuels that were given are: ULSD > Ultra Low Sulphur Diesel B100 > 100% Biodiesel B100adv. > 100% Biodiesel with advanced injection timing of 3°. After finding the required data, the graphs that were plotted for the above fuels were: 1. P vs. θ
2. dQ/dθ vs. θ
3. Q vs. θ

The Graphs are as follows:
P vs. θ
Series 1 - ULSD
Series 2 - B100
Series 3 - B100 (3° Adv)
0
1000000
2000000
3000000
4000000
5000000
6000000
7000000
0 100 200 300 400 500 600 700 800
Pre
ssu
re
Theta θ
Series2
Series3
Series1

dQ/dθ vs. θ Series 1 - ULSD
Series 2 - B100 Series 3 - B100 (3° Adv)
-200
-100
0
100
200
300
400
0 100 200 300 400 500 600 700 800
dQ
/dθ
Theta θ
Series2
Series3
Series1

Q vs. θ
Series 1 - ULSD Series 2 - B100 Series 3 - B100 (3° Adv)
-2000
0
2000
4000
6000
8000
10000
12000
0 100 200 300 400 500 600 700 800
Inp
ut
Ene
rgy
(Q)
Theta θ
Series2
Series3
Series1

The Performance Report for the fuels is as follows:
Calorific value (CV) of diesel 44514 kJ/kg Calorific value (CV) of B100 38730 kJ/kg
ULSD No.Of
Run Speed Power Torque Fuel Flow bsfc Efficiency
(ŋ)
(rev/min) (kW) (N-m) (g/h) (g/kWh) (%)
1 2421 88.99275 1820.48128 34929.85972 392.502288 20.60457621
2 2206 101.0067 2166.186622 32132.13213 318.1186992 25.42240782
3 2002 100.2484 2451.012552 29609.60961 295.362379 27.38108805
4 1792 95.25 2670.527559 27507.50751 288.7927297 28.00397127
5 1598 89.52787 2817.939693 25108.21643 280.4514127 28.83687848
6 1410 80.14068 2908.809374 22102.1021 275.7912914 29.32414315
7 1191 64.07429 2717.900968 18276.55311 285.2400262 28.35276457
8 1015 46.54604 2352.143685 14252.25225 306.1968939 26.4122317
B100 No.Of
Run Speed Power Torque Fuel Flow bsfc Efficiency
(ŋ)
(rev/min) (kW) (N-m) (g/h) (g/kWh) (%)
1 2404 82.59004 1691.213701 36733.46693 444.7687375 18.18325486
2 2199 91.70027 2002.869505 34714.71471 378.5672214 21.36303106
3 1994 91.04711 2220.965653 32404.80962 355.9125753 22.72283664
4 1803 87.62211 2408.961886 29038.07615 331.401261 24.40347778
5 1602 81.61368 2523.252747 26332.66533 322.6501596 25.0653628
6 1402 72.40445 2582.66842 23326.65331 322.1715321 25.10260064
7 1201 57.48059 2403.369151 18415.24574 320.3732806 25.24350125
8 1002 39.72849 1953.724002 12698.09428 319.6218341 25.30284995
B100 (adv)
No.Of Run Speed Power Torque Fuel Flow bsfc
Efficiency (ŋ)
(rev/min) (kW) (N-m) (g/h) (g/kWh) (%)
1 2399 88.77543 1828.387716 38472.36181 433.3672166 18.66164075
2 2199 100.0907 2244.72973 36084.33735 360.5162641 22.43267256
3 2004 98.02512 2427.698551 34096.38554 347.8331398 23.25064056
4 1798 95.32623 2610.923524 30571.71515 320.7062083 25.21729576
5 1600 90.18375 2789.373308 27562.68806 305.6280907 26.4613874
6 1398 80.10738 2832.908917 24482.41206 305.6199227 26.46209461
7 1202 54.23897 2252.000383 18512.56281 341.3147649 23.69467758
8 998 40.49714 1995.257143 13326.63317 329.075886 24.575922

Based on the Performance Report we are to plot three graphs for the fuels.
1. Torque vs. speed
2. Power vs. speed
3. Bsfc vs. speed
4. Efficiency vs. speed
The graphs for the fuels have been combined into one for comparison. The graphs can be seen below:

Torque vs. speed
Series 1 - ULSD Series 2 - B100 Series 3 - B100 (3° Adv)
0
500
1000
1500
2000
2500
3000
3500
0 500 1000 1500 2000 2500 3000
Torq
ue
Speed
Series2
Series3
Series1

Power vs. speed
Series 1 - ULSD Series 2 - B100 Series 3 - B100 (3° Adv)
0
20
40
60
80
100
120
0 500 1000 1500 2000 2500 3000
Po
we
r
Speed
Series2
Series3
Series1

Bsfc vs. speed
Series 1 - ULSD Series 2 - B100 Series 3 - B100 (3° Adv)
0
50
100
150
200
250
300
350
400
450
500
0 500 1000 1500 2000 2500 3000
bfs
c
Speed
Series2
Series3
Series1

Efficiency vs. speed
Series 1 - ULSD
Series 2 - B100 Series 3 - B100 (3° Adv)
0
5
10
15
20
25
30
35
0 500 1000 1500 2000 2500 3000
Effi
cie
ncy
(η)
Speed
Series2
Series3
Series1

Angles of occurrence of the peak pressures
ULSD
Pressure (N/m2) θ in Degrees
5117203 371.7351
5117188 371.9226
B100
Pressure (N/m2) θ in Degrees
5201575 372.6034
5201688 372.7641
B100 (3 Adv)
Pressure (N/m2) θ in Degrees
6246713 370.3667
6247067 370.5274
Ignition delays and combustion durations (in angle)
ULSD 360.157
B100 361.8623
B100 (3° Adv) 358.956
Minimum bsfc
ULSD -> 275.8 g/kWh
B100 -> 319.6 g/kWh
B100 (3° Adv) -> 305.6 g/kWh
Maximum Efficiency (η)
ULSD -> 29.30%
B100 -> 25.30%
B100 (3° Adv) -> 26.50%

Conclusion:
Based on the data and performance analysis, it can be concluded that using B100 could impact power. The vehicle would lose power. By advancing the ingnition timing of B100 (adv) we could get increased Torque at higher rpm. Also by advancing the ingnition timing, the bsfc was found to be lower than B100. This also means that lower bsfc rates can be achieved by advancing the ignition timings.