combining hydrophilic interaction chromatography (hilic ... · combining hydrophilic interaction...
TRANSCRIPT
Metabolites 2013, 3, 575-591; doi:10.3390/metabo30x000x
metabolites ISSN 2218-1989
www.mdpi.com/journal/metabolites/
Article
Combining Hydrophilic Interaction Chromatography (HILIC) and Isotope Tagging for Off-Line LC-NMR Applications in Metabolite Analysis
Emmanuel Appiah-Amponsah 1, Kwadwo Owusu-Sarfo 1, G.A. Nagana Gowda 1,2, Tao Ye 1 and
Daniel Raftery 1,2,3,*
1 Department of Chemistry, Purdue University, West Lafayette, IN 47907, USA;
E-Mails: [email protected] (E.A.-A.); [email protected] (K.O.-S.);
[email protected] (G.A.N.G.); [email protected] (T.Y.) 2 Northwest Metabolomics Research Center, Department of Anesthesiology and Pain Medicine,
University of Washington, Seattle, WA 98109, USA 3 Fred Hutchinson Cancer Research Center, Seattle, WA 98109, USA
* Author to whom correspondence should be addressed; E-Mail: [email protected];
Tel: +206-543-9709; Fax: +206-616-4819.
Received: 17 May 2013; in revised form: 6 July 2013 / Accepted: 15 July 2013 /
Published: 18 July 2013
Abstract: The complementary use of liquid chromatography (LC) and nuclear magnetic
resonance (NMR) has shown high utility in a variety of fields. While the significant benefit
of spectral simplification can be achieved for the analysis of complex samples, other
limitations remain. For example, 1H LC-NMR suffers from pH dependent chemical shift
variations, especially during urine analysis, owing to the high physiological variation of
urine pH. Additionally, large solvent signals from the mobile phase in LC can obscure
lower intensity signals and severely limit the number of metabolites detected. These
limitations, along with sample dilution, hinder the ability to make reliable chemical shift
assignments. Recently, stable isotopic labeling has been used to detect quantitatively specific
classes of metabolites of interest in biofluids. Here we present a strategy that explores the
combined use of two-dimensional hydrophilic interaction chromatography (HILIC) and
isotope tagged NMR for the unambiguous identification of carboxyl containing metabolites
present in human urine. The ability to separate structurally related compounds
chromatographically, in off-line mode, followed by detection using 1H-15N 2D HSQC
(two-dimensional heteronuclear single quantum coherence) spectroscopy, resulted in the
assignment of low concentration carboxyl-containing metabolites from a library of isotope
OPEN ACCESS
Metabolites 2013, 3
576
labeled compounds. The quantitative nature of this strategy is also demonstrated.
Keywords: metabolite profiling; metabolomics; NMR; HILIC; urine; 15N isotope tagging
1. Introduction
The quantitative measurement of small-molecule metabolites present in complex biological matrices is
pivotal to the field of metabolite profiling [1–7]. This field has garnered tremendous interest, resulting
from the relatively high sensitivity of metabolite profiles to subtle stimuli, which can potentially serve
as indicators of a variety of biological perturbations [8,9]. The field has shown significant potential in
numerous areas, including those of medicine, toxicology, environmental and nutritional sciences, to
name a few [10–16]. An important focus of the field is biomarker discovery in which signals from
several metabolites that correlate, with a particular biological state, are combined into profiles to serve
as accurate diagnostic and prognostic tools. During the process of drug development, the ability to
characterize unambiguously the xenobiotic metabolites that result from the introduction of drug
candidates into animal models forms the basis for advancing the drug developmental pipeline.
Nuclear magnetic resonance (NMR) spectroscopy is a ubiquitous analytical tool in metabolomics
owing to its inherent quantitative, non-destructive, and reproducible nature. NMR based metabolomics
involves the combination of high-resolution spectroscopic data with multivariate statistical methods,
which allows for the exploration of subtle differences in sample cohorts by detecting multiple
metabolites quantitatively and in parallel [17,18]. Notwithstanding the enormous benefits of NMR in
the study and application of metabolomics, the issue of its low sensitivity, coupled with the spectral
complexity, which normally characterizes NMR of biofluids, persistently limits the number of
quantitatively detected metabolites. This limitation consequently hinders the ability to draw meaningful
conclusions from the analytical data. Current advancements in the field aimed at circumventing some
of these issues have included the development of specialized NMR probes such as cryogenically
cooled and micro-coil probes [19–23]. In combination with larger magnetic fields, these probes have
allowed for measurements of lower concentration chemical species to be made, owing to significant
gains in signal-to-noise.
The use of chromatographic methods to simplify sample matrices by isolating metabolites of
interest prior to NMR analysis has high utility for a variety of biological investigations [24–29]. This
approach has also benefited from the use of sample pre-concentration techniques such as solid phase
extraction (SPE) and column trapping to extend NMR detection limits significantly and thus
circumvent the issue of sample dilution attributed to solvent mixing in the chromatographic step [26].
Despite these efforts, the use of LC-NMR for metabolite profiling and metabolite identification suffers
from some drawbacks. The solvents used as the mobile phase for the chromatographic separation
typically include water; however water invariably serves as an impediment during the 1H NMR
measurements as it has an intensity that is 106-fold higher than that of a majority of observable
metabolite signals in bio-fluids. Sequences such as “WATERGATE,” “excitation sculpting”, “WET”,
and “SOGGY” sequences have been employed to reduce solvent signals; however, these solvent
suppression techniques have some limitations, and can attenuate analyte signals [30–33]. Although
Metabolites 2013, 3
577
NOESY-type presaturation does not suffer from these setbacks, it works more effectively when used in
the reduction of a single signal [34]. Thus, any technical innovation that can eliminate the need for one of
these sequences will be extremely beneficial. One-dimensional 1H NMR is widely used in LC-NMR due
to its high sensitivity, arising from the high isotopic abundance of 1H, and its large gyromagnetic ratio.
However, sample pH and ion concentration has been shown to affect the chemical shift values of metabolite
peaks from urine samples as well as those of solvents, which can be reduced but not completely
eliminated [35]. These chemical shift variations may potentially lead to errors in peak assignments and
challenges in solvent suppression.
The emergence of targeted metabolite profiling is potentially promising in addressing some of these
challenges [36]. NMR-based targeted metabolite profiling has been improved by the use of a
chemoselective tag (usually an isotope label) that can specifically target certain classes of metabolites,
including amino acids, lipids, carboxylic acids, and metabolites with active hydrogen moieties. The
common isotopes that are used for this purpose include, but are not limited to, 31P, 13C, 19F, and 15N [37–40].
For example, the use of 15N-ethanolamine to “tag” metabolites with carboxyl groups selectively was
demonstrated recently [40]. This approach allowed the detection of well over 100 metabolites from a
single class with limits of detection of a few M in human urine and serum. The quantitative and
reproducible nature of the derivatization approach provides a basis for routine investigations. A
drawback, however, is that while many signals are readily detected in the 2D HSQC (two-dimensional
heteronuclear single quantum coherence) NMR spectrum of urine, the identity of many of the chemical
species remains unknown. This is due to the fact that new molecules that are synthesized have unique
chemical shifts. Notwithstanding these limitations, the derivatization approach is potentially useful for
the elimination of the problems of pH dependent chemical shift variations and solvent signal overlap
issues that are more prevalent in 1D 1H-NMR, as the detection of the derivatized compounds utilizes
heteronuclear 1H-15N 2D HSQC. Any remaining chemical shift variations are less problematic due to
the improved spectral resolution and reduced overlap of these multi-dimensional experiments.
Additionally, solvent signals have minimal effects on the detection of signals in the heteronuclear 1H-15N 2D HSQC experiment, which makes this approach advantageous for the detection and subsequent
identification of lower concentration metabolites [41].
Hydrophilic interaction chromatography (HILIC) has been featured in a number of metabolite
profiling applications due to its excellent retention of polar metabolites [42,43]. In this work, we
present a reproducible two-dimensional HILIC separation approach for resolving and detecting several
similarly polar and 15N ethanolamine tagged metabolites by 1H-15N 2D HSQC NMR. This approach
facilitated the unambiguous assignment of low concentration metabolites that were not previously
identified. The use of HILIC-NMR for the separation and identification of chemically derivatized
metabolites in human urine encompasses the benefits of traditional LC-NMR of bio-fluids (such as
reduced spectra complexity), while reducing the effects of pH dependent chemical shift variations that
are commonly associated with 1D 1H-NMR detection and the concomitant solvent masking of lower
intensity signals. Additionally, the derivatized compounds appear chemically stable on the
chromatographic column, thus making this approach well suited for metabolic profiling applications.
The ability to quantify 15N ethanolamine derivatized metabolites in human urine is also demonstrated.
Metabolites 2013, 3
578
2. Experimental Section
2.1. Reagents and Biological Samples
Deuterium oxide (D2O, 99.9%) and 15N-ethanolamine were obtained from Cambridge isotope
Laboratories Inc (Andover, MA). HPLC-grade acetonitrile (ACN, 99.8%) and ammonium hydroxide
(28%–30% NH3) were purchased from Mallinckrodt Baker, Inc. (Phillipsburg, NJ, USA), and sodium
azide was obtained from Fischer Scientific (Pittsburgh, PA, USA). Carboxyl containing metabolites
(Table 1), 3-(trimethylsilyl) propionic acid-2,2,3,3-d4 (TSP), and sodium acetate were obtained from
Sigma Aldrich (St Louis, MO, USA). All reagents were used without additional purification.
Deionized water was obtained from an EASY pure II UV water purification system (Barnstead
International, Dubuque, IA, USA). Human urine samples were obtained from a healthy volunteer in
accordance with a protocol approved by the Institutional Review Board at Purdue University. Sodium
azide (0.1%, w/v) was added to freshly collected urine to prevent bacterial growth. Urine was purified
by centrifugation using Centriprep filters with a nominal molecular weight limit of 10,000 (cat, No.
4321, Millipore, Bedford, MA, USA), aliquoted, and frozen at −80 °C until used.
Table 1. 15N and 1H chemical shift values for the identified metabolites in human urine by
combining 2D HILIC-LC and 1H-15N 2D HSQC NMR.
Label Metabolite 1H (ppm) 15N (ppm)
1 Hippuric acid 8.12 114.94 2 Glutamic acid 8.20 115.67 3 Suberic acid 8.01 119.34 4 Cis-aconitic acid 8.18 120.41 5 4-Hydroxylphenyl acetic acid 8.10 120.84 6 3- Hydroxybutyric acid 8.04 122.02 7 Citric acid 8.03 122.77 8 Adipic acid 8.01 119.34 9 2- Hydroxyphenyl acetic acid 7.91 119.68 10 Citraconic acid 8.02 121.07 11 Phenylacetic acid 8.10 120.92 12 L- Tartaric acid 8.35 116.21 13 -Alanine 8.10 120.07
2.2. 15N-Ethanolamine Tagging Procedure
15N-ethanolamine (11 µL, 183 µmol) was added to 1.5 mL of a urine sample that had been concentrated
by a factor of nine in a dry glass vial, and the pH of the mixture was adjusted to 7.0 with 1 M HCl.
DMT-MM 4-[4,6-dimethoxy-1.3.5-triazin-2-yl)-4-methylmorpholinium chloride] (63 mg) was added
to initiate the reaction following the procedure described by Ye et. al. [40,44,45] The mixture was
continuously stirred at room temperature for 4 h to complete the isotope tagging reaction. In order to
maintain the 15N amide protonation for 1H NMR detection, the pH was adjusted to 5.0 by adding 1 M HCl or
1 M NaOH. The reaction is summarized in Figure 1a. Spiking experiments were performed to confirm the
identified peaks using 1.5 mL urine samples that were split in thirds (500 µL each). Two portions were
Metabolites 2013, 3
579
spiked with mixtures of stock solutions of standard compounds (100 µL) and one portion (unspiked) was
used as the control.
2.3. Two Dimensional HILIC Separation and Fraction Collection
The HPLC system was comprised of an LC-10AS Pump, SPD- 10A UV-Vis detector, SCL-10A system
controller (Shimadzu Corporation, Kyoto, Japan), and a 6-port injection valve (Rheodyne, CA, USA).
Fused silica tubes, 125 µm ID, and stainless steel fittings were used as the transfer lines and connectors,
respectively (Upchurch Scientific, WA, USA). The HPLC system was operated using Shimadzu
EZStart 7.2 software. Both dimensions of analytical separation were performed on a 250 mm × 4.6
mm TSKgel Amide-80 normal phase/HILIC column (Tosoh Bioscience, Montgomery, PA, USA). A
gradient elution was utilized for the first dimension separation beginning with an initial solvent
composition A (90% ACN, 10% 100 mM NH4OH in H2O) and changing to composition B (60% ACN,
40% 100 mM NH4OH in H2O) over 12 min. A second gradient to composition C (40% ACN, 60% 100
mM NH4OH in H2O) was achieved in 27 min. A steep linear ramp to composition D (90% ACN, 40%
100 mM NH4OH in H2O) was achieved in 6 min; this solvent mixture was maintained for 5 min. The
flow rate was 0.9 mL/min and a 100 µL injection volume was used. The separation was monitored at
254 nm with the UV-Vis detector. Fractions were collected over 6 min intervals using a Gilson
FC-203B fraction collector (Gilson, Middleton, WI, USA). Fractions were collected 10 times (using 100 µL
injections) and dried with an Eppendorf Vacufuge plus concentrator (Eppendorf, Westbury, NY, USA).
Following the identification of the fraction of interest by NMR (see below for description), another
dimension of separation was necessary. The second protocol utilized was the following: An initial
solvent composition of (85% ACN, 15% sodium acetate buffer, pH 4.0) was changed to a final solvent
composition of (78% ACN, 22% sodium acetate buffer, pH 4.0) over 5 min. A second gradient to
(75% ACN, 25% sodium acetate buffer, pH 4.0) was performed over a time of 7 min. This solvent
composition was maintained for 12 min, followed by a final gradient in order to achieve a solvent
composition of (69% ACN, 31% sodium acetate buffer, pH 4.0) in 2 min. A steep linear ramp to (90%
ACN, 10% sodium acetate buffer, pH 4.0) was achieved in 1 min to serve as the wash step. The
fractions for this dimension were collected over 2 min intervals resulting in a total of 11 fractions.
2.4. NMR Spectroscopy
The samples for NMR analysis consisted of either intact derivatized urine (500 µL) or dried
chromatographic fractions reconstituted in 500 µL H2O. The samples were mixed with 30 µL D2O
containing TSP (0.5 wt %/vol) for locking and chemical shift referencing, and placed in 5 mm NMR
tubes. All NMR experiments were performed on a Bruker Avance DRX 500 MHz spectrometer,
equipped with a 5 mm TXI triple resonance Z-gradient cryoprobe. All spectra were acquired at room
temperature. One-dimensional 1H-NMR spectra were obtained using a 1D NOESY pulse sequence
incorporating presaturation for water suppression during the relaxation delay and mixing time of 2 s
and 100 ms, respectively, with a presaturation power of 50 dB in order to achieve complete water peak
saturation. Thirty-two free induction decays were averaged for each spectrum.
Sensitivity enhanced 1H-15N 2D HSQC experiments utilized an INEPT transfer delay of 5.5 ms
corresponding to a 1JNH of 90 Hz. Phase sensitive data were obtained using acquisition in echo-antiecho

Metabolites 2013, 3
580
mode. Spectral widths of approximately 6 kHz for the 1H dimension and 2 kHz for 15N were used at
500 MHz. A total of 256 free induction decays of 2048 data points were collected in the indirect (t1)
dimension with 32 transients per increment. 15N decoupling during the direct detection dimension (t2)
was achieved with the GARP (globally optimized alternating-phase rectangular pulses) sequence. The
resulting 2D data were zero-filled to 1024 points in the t1 dimension after forward linear prediction to
512 points. A 45°-shifted sine-bell window function was then applied to both dimensions before
Fourier transformation. NMR data were processed using Bruker Topspin 2.0 software on a Redhat
Linux platform. The entire experimental procedure is summarized in Figure 1b.
Figure 1. (a) 15N-ethanolamine derivatization procedure used for isotope tagging of
urine metabolites [40]; (b) Schematic diagram of the experimental procedure for the
two-dimensional LC-2D NMR method.
3. Results and Discussion
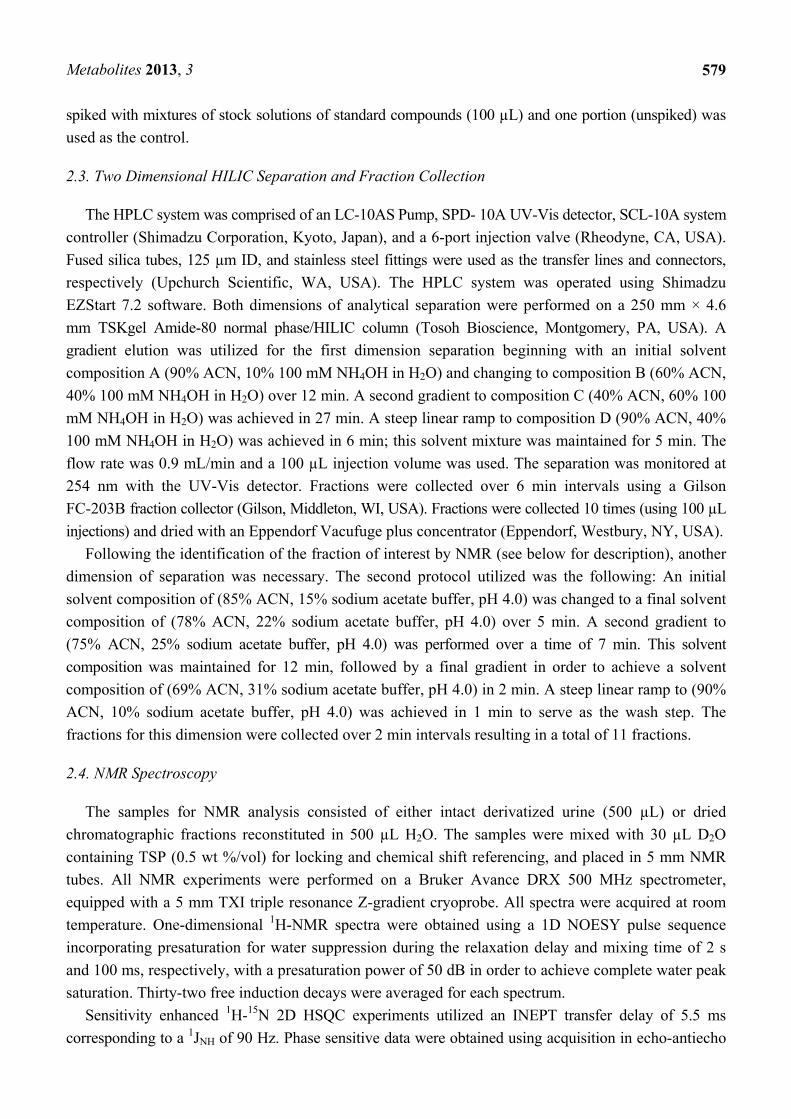
A typical 2D HSQC 1H-15N spectrum of derivatized whole urine is shown in Figure 2. The derivatization
shows a large number of well-resolved peaks, a number of which have been identified [40]. However, the
identity for a majority of the peaks is unknown. Hydrophilic interaction chromatography (HILIC) was
used to fractionate the urine sample to simplify the spectrum and facilitate the unambiguous
assignment of isotope labeled metabolite signals.
Metabolites 2013, 3
581
Figure 2. Typical 2D 1H-15N HSQC spectrum of human urine after isotope tagging using 15N-ethanolamine.
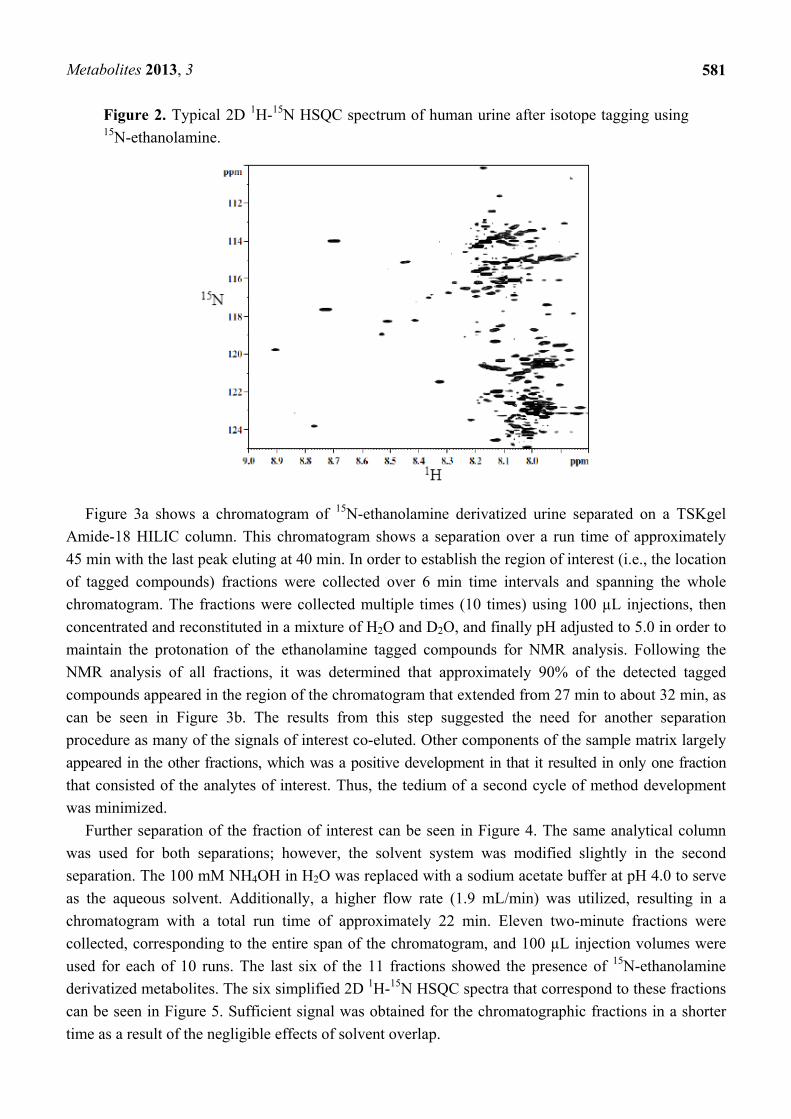
Figure 3a shows a chromatogram of 15N-ethanolamine derivatized urine separated on a TSKgel
Amide-18 HILIC column. This chromatogram shows a separation over a run time of approximately
45 min with the last peak eluting at 40 min. In order to establish the region of interest (i.e., the location
of tagged compounds) fractions were collected over 6 min time intervals and spanning the whole
chromatogram. The fractions were collected multiple times (10 times) using 100 µL injections, then
concentrated and reconstituted in a mixture of H2O and D2O, and finally pH adjusted to 5.0 in order to
maintain the protonation of the ethanolamine tagged compounds for NMR analysis. Following the
NMR analysis of all fractions, it was determined that approximately 90% of the detected tagged
compounds appeared in the region of the chromatogram that extended from 27 min to about 32 min, as
can be seen in Figure 3b. The results from this step suggested the need for another separation
procedure as many of the signals of interest co-eluted. Other components of the sample matrix largely
appeared in the other fractions, which was a positive development in that it resulted in only one fraction
that consisted of the analytes of interest. Thus, the tedium of a second cycle of method development
was minimized.
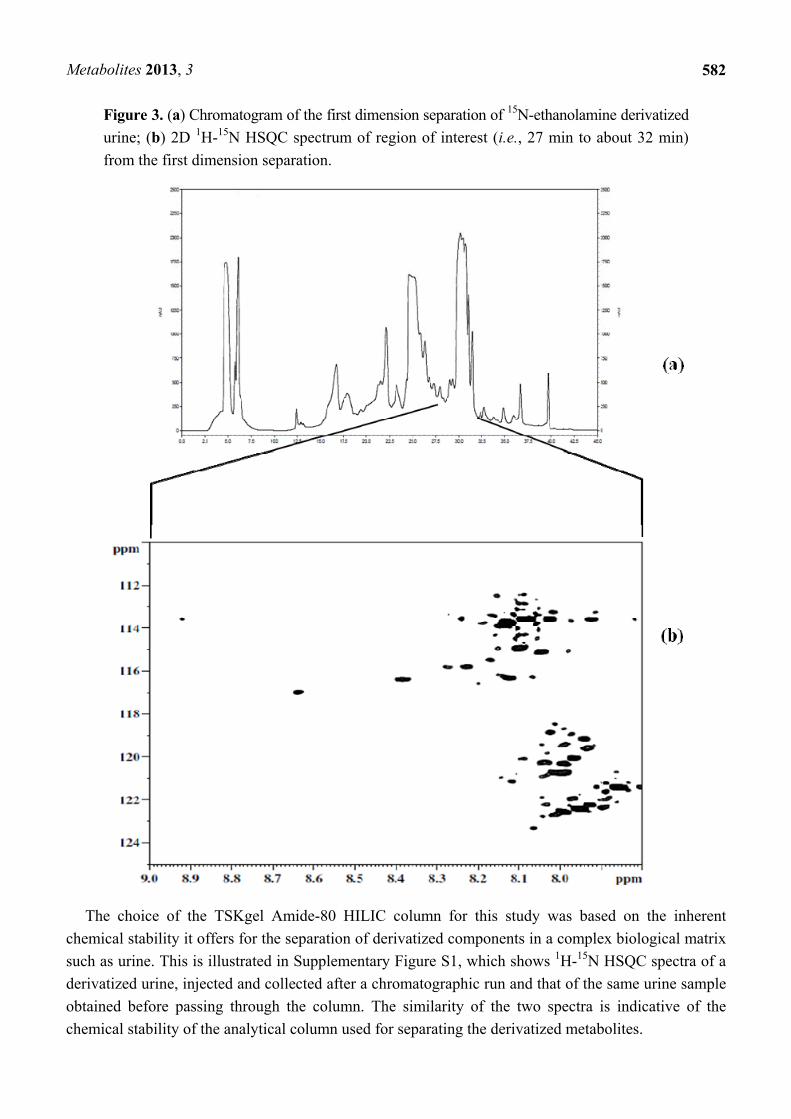
Further separation of the fraction of interest can be seen in Figure 4. The same analytical column
was used for both separations; however, the solvent system was modified slightly in the second
separation. The 100 mM NH4OH in H2O was replaced with a sodium acetate buffer at pH 4.0 to serve
as the aqueous solvent. Additionally, a higher flow rate (1.9 mL/min) was utilized, resulting in a
chromatogram with a total run time of approximately 22 min. Eleven two-minute fractions were
collected, corresponding to the entire span of the chromatogram, and 100 µL injection volumes were
used for each of 10 runs. The last six of the 11 fractions showed the presence of 15N-ethanolamine
derivatized metabolites. The six simplified 2D 1H-15N HSQC spectra that correspond to these fractions
can be seen in Figure 5. Sufficient signal was obtained for the chromatographic fractions in a shorter
time as a result of the negligible effects of solvent overlap.
Metabolites 2013, 3
582
Figure 3. (a) Chromatogram of the first dimension separation of 15N-ethanolamine derivatized
urine; (b) 2D 1H-15N HSQC spectrum of region of interest (i.e., 27 min to about 32 min)
from the first dimension separation.
The choice of the TSKgel Amide-80 HILIC column for this study was based on the inherent
chemical stability it offers for the separation of derivatized components in a complex biological matrix
such as urine. This is illustrated in Supplementary Figure S1, which shows 1H-15N HSQC spectra of a
derivatized urine, injected and collected after a chromatographic run and that of the same urine sample
obtained before passing through the column. The similarity of the two spectra is indicative of the
chemical stability of the analytical column used for separating the derivatized metabolites.
Metabolites 2013, 3
583
Figure 4. Chromatogram of the second dimension separation of a fraction of interest from the 15N-ethanolamine derivatized urine sample.
Metabolite Assignment and Quantitation by Spiking Experiments
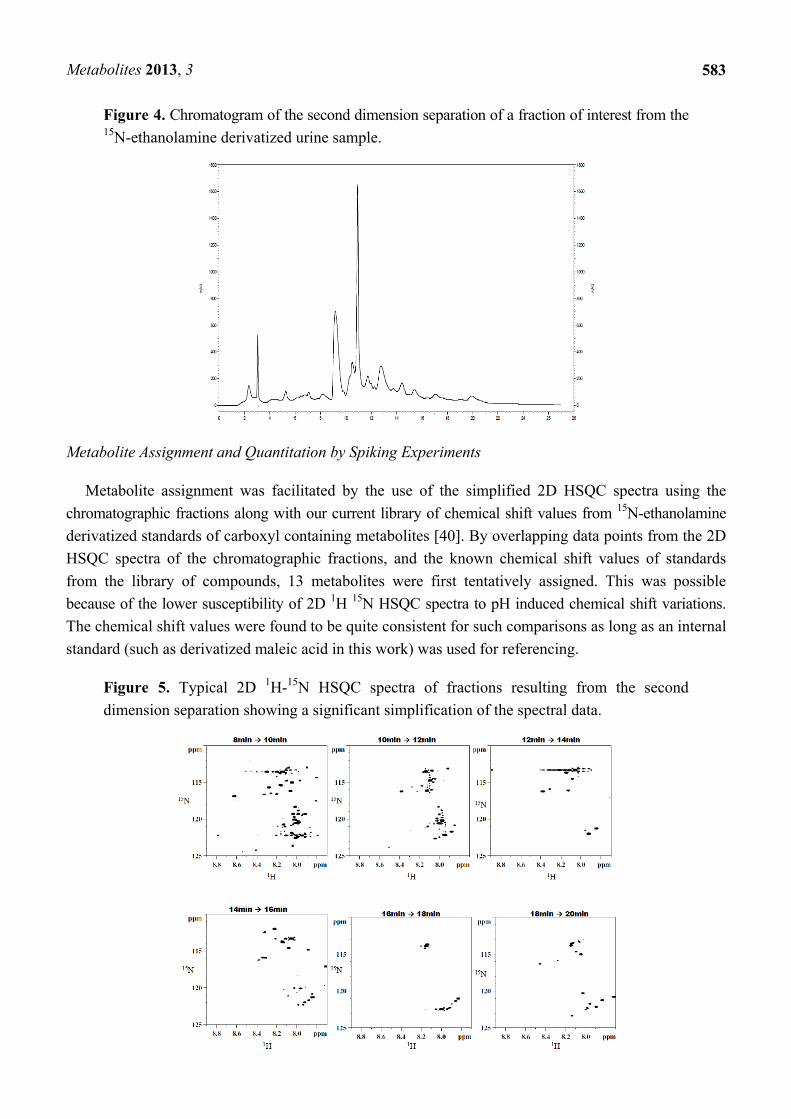
Metabolite assignment was facilitated by the use of the simplified 2D HSQC spectra using the
chromatographic fractions along with our current library of chemical shift values from 15N-ethanolamine
derivatized standards of carboxyl containing metabolites [40]. By overlapping data points from the 2D
HSQC spectra of the chromatographic fractions, and the known chemical shift values of standards
from the library of compounds, 13 metabolites were first tentatively assigned. This was possible
because of the lower susceptibility of 2D 1H 15N HSQC spectra to pH induced chemical shift variations.
The chemical shift values were found to be quite consistent for such comparisons as long as an internal
standard (such as derivatized maleic acid in this work) was used for referencing.
Figure 5. Typical 2D 1H-15N HSQC spectra of fractions resulting from the second
dimension separation showing a significant simplification of the spectral data.

Metabolites 2013, 3
584
Spiking experiments were conducted to confirm the assignments. Spiking was performed using
three pre-concentrated urine samples, of which two were spiked with aliquots from stock solutions of
the tentatively assigned metabolites, while the third sample served as a control. Each control sample
contained an equimolar amount of maleic acid, used as a referencing standard. All samples were then
derivatized with 15N-ethanolamine and 2D HSQC experiments were then performed. The tentatively
assigned metabolites were confirmed by first overlapping the HSQC spectra of the control and the
spiked samples and then observing and measuring the change in intensities of the contours from the 2D
spectra of the spiked samples and the control. Figure 6 shows the overlapped spectra of the control
sample and urine spiked with compounds 1–8 (additional data for spiked compounds 9–13 are shown
in Supplementary Figure S2). The list of metabolites and their assigned chemical shifts are
summarized in Table 1.
Figure 6. 2D 1H-15N HSQC spectra of control urine (Blue) and urine spiked with several
metabolites of interest (Red). Chemical shifts of the spiked compounds are indicated with
boxes and are referenced to the metabolite information appearing in Table 1.
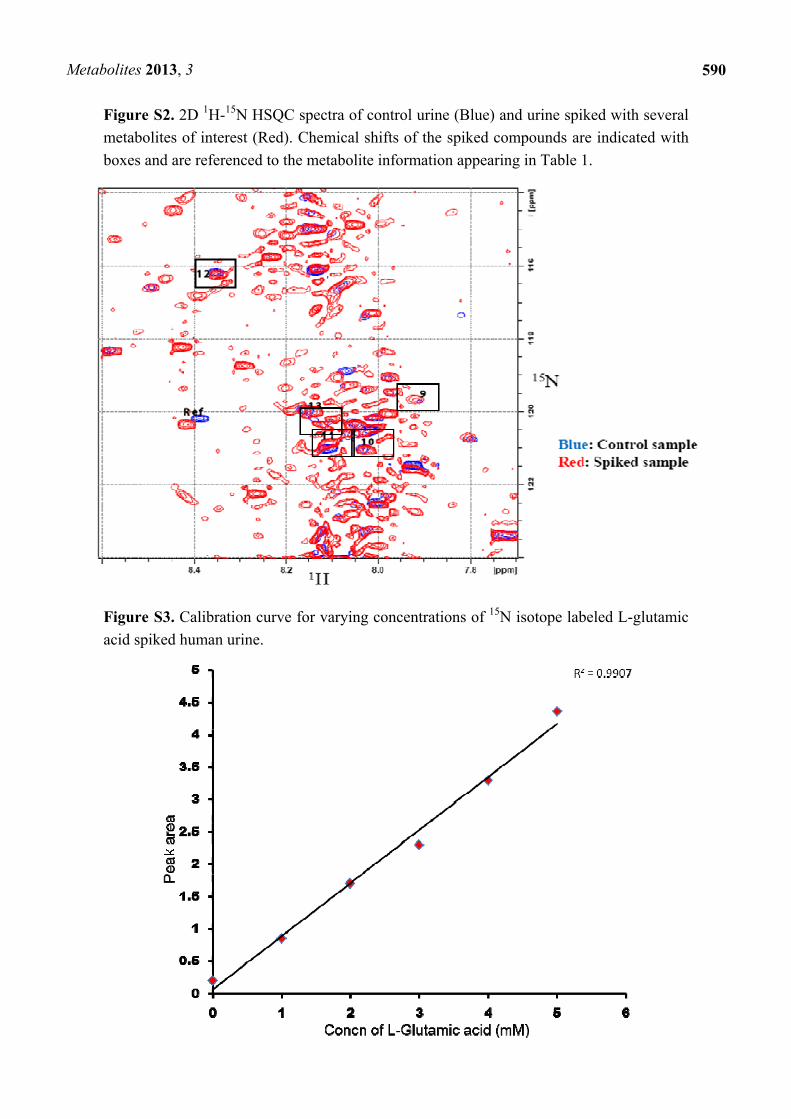
We also investigated the quantitative abilities of our derivatization and LC-NMR method using
glutamic acid in a bio-fluid matrix. L-glutamic acid, a key molecule in cellular metabolism, has signals
that are difficult to detect without ambiguity in the 1H-NMR spectrum of human urine owing to extensive
peak overlap and its low concentration. A calibration curve generated by standard addition of 15N isotope
labeled glutamic acid into a sample of derivatized urine shows a good linear relationship between the
concentration of derivatized L-glutamic acid and the NMR peak area with a coefficient of regression
(R2) of ~0.99 (Figure S3). This implies that the isotopic tagging strategy could be implemented in order to

Metabolites 2013, 3
585
estimate the amounts of endogenous metabolites present in any given urine sample due to two major
factors; namely the accuracy of assignments of the NMR chemical shift values and their improved
detection. The increased resolution afforded by the isotope labeling strategy, combined with the
chromatographic resolution, is highly useful for distinguishing the metabolite signals and allowing
good quantitation.
The chromatographic separation in the first dimension was useful in the elimination of several of
the non-carboxyl containing components of urine and isolation of almost all the tagged components to
a confined region in the chromatogram. The inability to resolve the tagged components in a single
chromatographic step can be attributed mainly to the complexity of the sample matrix that contains
many products of metabolism. In the second chromatographic separation, a sodium acetate buffer of
pH 4.0 was used as the aqueous phase. This approach facilitated the resolution of the structurally
similar metabolites, which eluted in order of their acid dissociation constants. Those metabolites with
lower dissociation constants eluted later in the run owing to an increased retention resulting from their
acquisition of a negative charge, and hence acted as extremely polar molecules. The reproducibility of
the chromatographic runs was a prime factor towards obtaining reliable assignments. While multiple
collections of fractions of interest were made, the NMR spectra of the same fractions from different
cycles of collection showed good consistency in terms of quality and peak content (Figure S4).
1D 1H-NMR-based metabolomics typically and necessarily focuses on metabolites with relatively
high concentrations (>0.1 mM). These metabolites often appear in multiple metabolic pathways and
are often non-specific to different pathological and physiological roles. These issues consequently limit
the ability to draw reliable conclusions from the analytical data. Alternatively, signals from lower
concentration metabolites, which may have improved potential for use as biomarkers, are often buried
beneath the dominant NMR signals of higher concentration metabolites or solvent signals. The use of
chromatographic separation in conjunction with the 15N isotope tagging procedure can potentially
circumvent some of these limitations. The data in Table 1, comprised of unambiguous assignments for
13 metabolites in human urine, represent a significant extension of the library of currently assigned 15N
tagged compounds [40]. Significant improvements in the limits of detection can be inferred from the
assignment of β-alanine, which has typical levels in urine of healthy adults of the order of a few µM,
thus, making its detection in bio-fluids rather difficult by standard NMR. Additionally, several of the
metabolites in Table 1 have potential clinical applications, which represent a highly favorable
development for the future of NMR based metabolite profiling. For example, a high level of phenyl
acetic acid is a marker of end-stage renal disease [46], 4-hydroxyphenylacetatic acid is associated the
metabolic disorder, tyrosinemia [38] and suberic acid is associated with fatty acid oxidation disorder [47].
In the future, we plan to investigate the use of this chromatographic approach in conjunction with
micro-coil NMR probes [20–23], which can potentially offer the ability to improve signal to noise
levels for metabolites in volume limited samples, or to reduce the LOD after sample concentration.
4. Conclusions
The application of a two dimensional HILIC chromatography approach to resolve and identify
several 15N-ethanolamine derivatized carboxyl containing metabolites in human urine in a reproducible
fashion with good sensitivity has been demonstrated. This approach offers good promise for NMR
Metabolites 2013, 3
586
based metabolite profiling applications, in which there is a major requirement for unambiguous assignment
of signals arising from lower concentration species. Care should, however, be exercised, particularly
when identifying peaks in the overlapped spectral regions; in such cases, other means such as detection
by mass spectrometry or additional conventional NMR experiments should be used in addition to spiking
to fully confirm metabolite identity.
Acknowledgments
The authors gratefully acknowledge the NIH 1R01GM085291 and NIH 2R01GM085291 for
financial support.
Conflict of Interest
The authors declare no conflict of interest.
References
1. Nicholson, J.K.; Wilson, I.D. High resolution proton magnetic resonance spectroscopy of
biological fluids. Prog. NMR Spectrosc. 1989, 21, 449–501.
2. Nicholson, J.K.; Lindon, J.C.; Holmes, E. “Metabonomics”: understanding the metabolic responses of
living systems to pathophysiological stimuli via multivariate statistical analysis of biological NMR
spectroscopic data. Xenobiotica 1999, 29, 1181–1189.
3. Fiehn, O.; Kopka, J.; Dörmann, P.; Altmann, T.; Trethewey, R.N.; Willmitzer, L. Metabolite
profiling for plant functional genomics. Nat. Biotechnol. 2000, 18, 1157–1161.
4. De Graaf, R.K.; Behar, K.L. Quantitative 1H NMR spectroscopy of blood plasma metabolites.
Anal. Chem. 2003, 75, 2100–2104.
5. Serkova, N.J.; Niemann, C.U. Pattern recognition and biomarker validation using quantitative 1H-NMR-based metabolomics. Expert. Rev. Mol. Diagn. 2006, 6, 717–731.
6. Fan, T.W.-M.; Lane, A.N. Structure-based profiling of metabolites and isotopomers by NMR.
Prog. Nucl. Magn. Reson. Spectrosc. 2008, 52, 69–117.
7. Wishart, D.S. Quantitative metabolomics using NMR. Trends Anal. Chem. 2008, 27, 228–237.
8. Zhang, S.; Gowda, G.A.N.; Asiago, V.; Shanaiah, N.; Barbas, C.; Raftery, D. Correlative and
quantitative 1H-NMR-based metabolomics reveals specific metabolic pathway disturbances in
diabetic rats. Anal. Biochem. 2008, 383, 76–84.
9. Gowda, G.A.N.; Zhang, S.; Haiwei, G.; Asiago, V.; Shanaiah, D.; Raftery, D. Metabolomics-based
methods for early disease diagnostics. Expert Rev. Mol. Diagn. 2008, 8, 617–633.
10. Nicholson, J.K.; Connely, J.; Lindon, J.C.; Holmes, E. Metabonomics: A platform for studying
drug toxicity and gene function. Nat. Rev. Drug Discov. 2002, 1, 153–161.
11. Kim, Y.S.; Maruvada, P.; Milner, J.A. Metabolomics in biomarker discovery: Future uses for
cancer prevention. Future Oncol. 2008, 4, 93–102.
12. Cevallos-Cevallos, J.M.; Reyes-De-Corcuero, J.I.; Etxeberria, E.; Danyluka, M.D.; Rodrick, G.
Metabolomic analysis in food science: A review. Trends Food. Sci. Technol. 2009, 20, 557–566.
13. Fell, D.A. Enzymes, metabolites and fluxes. J. Exp. Bot. 2005, 56, 267–272.
Metabolites 2013, 3
587
14. Saghatelian, A.; Cravatt, B.F. Global strategies to integrate the proteome and metabolome. Curr.
Opin. Chem. Biol. 2005, 9, 62–68.
15. Assfalg, M.; Bertini, I.; Colangiuli, D.; Luchinat, C.; Schäfer, H.; Schütz, B.; Spraul, M. Evidence
of different metabolic phenotypes in humans. Proc. Natl. Acad. Sci. USA 2008, 105, 1420–1424.
16. Nicholson, J.K.; Lindon, J.C. Systems biology: Metabonomics. Nature 2008, 455, 1054–1056.
17. Van der Greef, J.; Smilde, A.K. Symbiosis of chemometrics and metabolomics: Past, present and
future. J. Chemomet. 2005, 19, 376–386.
18. Lindon, J.C.; Nicholson, J.K. Spectroscopic and statistical techniques for information recovery in
metabonomics and metabolomics. Annu. Rev. Anal. Chem. 2008, 1, 45–69.
19. Spraul, M.; Freund, A.S.; Nast, R.E.; Withers, R.S.; Maas, W.E.; Corcoran, O. Advancing NMR
sensitivity for LC-NMR-MS using a cryoflow probe: Application to the analysis of acetaminophen
metabolites in urine. Anal. Chem. 2003, 75, 1536–1541.
20. Henry, I.D.; Park, G.H.K.; Kc, R.; Tobias, B.; Raftery, D. Design and Construction of a Microcoil
NMR Probe for the Routine Analysis of 20 µL Samples. Concepts Magn. Reson. 2008, 33B, 1–8.
21. Kc, R.; Gowda, Y.N.; Djukovic, D.; Henry, I.D.; Park, G.H.J.; Raftery, D. Susceptibility-matched
plugs for microcoil NMR probes. J. Mag. Reson. 2010, 205, 63–68.
22. Kc, R.; Henry, I.D.; Park, G.H.J.; Aghdasi, A.; Raftery, D. New Solenoidal Microcoil NMR Probe
Using Zero-Susceptibility Wire. Concepts Mag. Reson. B 2010, 37B, 13–19.
23. Kc, R.; Henry, I.D.; Park, G.H.J.; Raftery, D. Design and Construction of a versatile dual volume
heteronuclear double resonance microcoil NMR probe. J. Mag. Reson. 2009, 197, 186–192.
24. Graça, G.; Duarte, I.F.; Goodfellow, B.J.; Carreira, I.M.; Couciero, A.B.; Domingiues, M.;
Spraul, L.; Tseng, L.; Gil, A.M. Metabolite profiling of human amniotic fluid by hyphenated
nuclear magnetic resonance spectroscopy. Anal. Chem. 2008, 80, 6085–6092.
25. Appiah-Amponsah, E.; Shanaiah, N.; Gowda, G.A.N.; Owusu-Sarfo, K.; Ye, T.; Raftery, D.
Identification of 4-deoxythreonic acid present in human urine by combining HPLC and NMR
techniques. J. Pharm. Biomed. Anal. 2009, 50, 878–885.
26. Djukovic, D.; Appiah-Amponsah, E.; Shanaiah, N.; Gowda, G.A.N.; Henry, I.; Everly, M.;
Tobias, B.; Raftery, D. Ibuprofen metabolite profiling using a combination of SPE/column-trapping
and HPLC-micro-coil NMR. J. Pharm. Biomed. Anal. 2008, 47, 328–334.
27. Guo, K.; Ji, C.; Li, L. Stable-isotope dimethylation labeling combined with LC-ESI MS for
quantification of amine-containing metabolites in biological samples. Anal. Chem. 2007, 79,
8631–8638.
28. Sidelmann, U.G.; Bjørnsdottir, I.; Shockor, J.P.; Hansen, S.H.; Lindon, J.C.; Nicholson, J.K.
Directly coupled HPLC-NMR and HPLC-MS approaches for the rapid characterisation of drug
metabolites in urine: Application to the human metabolism of naproxen. J. Pharm. Biomed. Anal.
2001, 24, 569–579.
29. Albert, K.; Nieder, M.; Bayer, E.; Spraul, M. Continuous-flow nuclear magnetic resonance.
J. Chrom. A 1985, 346, 17–24.
30. Dalvit, C.; Shapiro, G.; Bohlen, J.M.; Parella, T. Technical aspects of an efficient multiple solvent
suppression pulse sequence. Magn. Reson. Chem. 1999, 37, 7–14.
31. Ogg, R.J.; Kingsley, P.B.; Taylor, J.S. WET, a T1- and B1-insensitive water-suppression method
for in vivo localized 1H-NMR spectroscopy. J. Magn. Reson. B 1994, 104, 1–10.
Metabolites 2013, 3
588
32. Liu, M.L.; Mao, X.A.; Ye, C.H.; Huang, H.; Nicholson, J.K.; Lindon, J.C. Improved WATERGATE
pulse sequence for solvent suppression in NMR spectroscopy. J. Magn. Reson. 1998, 132, 125–129.
33. Nguyen, B.D.; Meng, X.; Donovan, K.J.; Shaka, A.J. SOGGY: Solvent-optimized double gradient
spectroscopy for water suppression. A comparison with some existing techniques. J. Magn. Reson.
2007, 184, 263–274.
34. Smallcombe, S.H. Solvent suppression with symmetrically-shifted pulses. J. Am. Chem. Soc.
1993, 115, 4776–4785.
35. Asiago, V.M.; Nagana Gowda, G.A.; Zhang. S.; Shanaiah, N.; Clark, J.; Raftery, D. Use of EDTA
to Minimize Ionic Strength Dependent Frequency Shifts in the 1H NMR Spectra of Urine.
Metabolomics 2008, 4, 328–336.
36. Weljie, A.M.; Newton, J.; Mercier, P.; Carlson, E.; Slupsky, C.M. Targeted profiling:
Quantitative analysis of 1H-NMR metabolomics data. Anal. Chem. 2006, 78, 4430–4442.
37. Spraul, M.; Hoffmann, M.; Wilson, I.; Lenz, E.; Nicholson, J.K.; Lindon, J.C. Coupling of HPLC
with 19F- and 1H-NMR spectroscopy to investigate the human urinary excretion of flurbiprofen
metabolites. J. Pharm. Biomed. Anal. 1993, 11, 1009–1015.
38. Shanaiah, N.; De Silva, A.M.; Gowda, G.A.N.; Raftery, M.; Hainline, B.E.; Raftery, D.
Class Selection of Amino Acid Metabolites in Body Fluids Using Chemical Derivatization and
Their 13C NMR Detection. Proc. Natl. Acad. Sci. 2007, 104, 11540–11544.
39. De Silva, A.M.; Shanaiah, N.; Gowda, G.A.N.; Rosa-Pérez, K.; Hanson, B.A.; Raftery, D.
Application of 31P NMR Spectroscopy and Chemical Derivatization Formetabolite Profiling of
Lipophilic Compounds in Human Serum. Magn. Reson. Chem. 2009, 47, 574–580.
40. Ye, T.; Mo, H.; Shanaiah, N.; Gowda, G.A.N.; Zhang, S.; Raftery, D. Chemoselective 15N Tag for
Sensitive and High-Resolution Nuclear Magnetic Resonance Profiling of the Carboxyl-Containing
Metabolome. Anal. Chem. 2009, 81, 4882–4888.
41. Nagana Gowda, G.A.; Tayyari, F.; Ye, T.; Suryani, Y.; Wei, S.; Shanaiah, N.; Raftery, D.
Quantitative Analysis of Blood Plasma Metabolites Using Isotope Enhanced NMR Methods.
Anal. Chem. 2010, 82, 8983–8990.
42. Tolstikov, V.V.; Fiehn, O. Analysis of highly polar compounds of plant origin: Combination of
hydrophilic interaction chromatography and electrospray ion trap mass spectrometry. Anal. Biochem.
2002, 301, 298–307.
43. Godejohann, M. Hydrophilic interaction chromatography coupled to nuclear magnetic resonance
spectroscopy and mass spectroscopy—A new approach for the separation and identification of
extremely polar analytes in bodyfluids. J. Chrom. A 2007, 1156, 87–93.
44. Kunishima, M.; Kawachi, C.; Monta, J.; Terao, K.; Iwasaki, F.; Tani, S. 4-(4, 6-dimethoxy-1, 3,
5-triazin-2-yl)-4-methyl-morpholinium chloride: An efficient condensing agent leading to the
formation of amides and esters. Tetrahedron 1999, 55, 13159–13170.
45. Kunishima, M.; Kawachi, C.; Hioki, K.; Terao, K.; Tani, S. Formation of carboxamides by direct
condensation of carboxylic acids and amines in alcohols using a new alcohol- and water-soluble
condensing agent: DMT-MM. Tetrahedron 2001, 57, 1551–1558.
46. Jankowski, J.; van der Giet, M.; Jankowski, V.; Schmidt, S.; Hemeier, M.; Mahn, B.; Giebing, G.;
Tolle, M.; Luftmann, H.; Schluter, H.; et al. Increased plasma phenylacetic acid in patients with
end-stage renal failure inhibits iNOS expression. J. Clin. Invest. 2003, 112, 256–264.

Metabolites 2013, 3
589
47. Hagen, T.; Korson, M.S.; Sakamoto, M.; Evans, J.E. A GC/MS/MS screening method for multiple
organic acidemias from urine specimens. Clin. Chim. Acta 1999, 283, 77–88.
Supplementary Material
Figure S1. (a) 2D 1H-15N HSQC spectrum of derivatized urine collected after passing
through TSK gel amide80 column; (b) 2D 1H-15N HSQC spectrum of urine taken directly
after derivatization.
Metabolites 2013, 3
590
Figure S2. 2D 1H-15N HSQC spectra of control urine (Blue) and urine spiked with several
metabolites of interest (Red). Chemical shifts of the spiked compounds are indicated with
boxes and are referenced to the metabolite information appearing in Table 1.
Figure S3. Calibration curve for varying concentrations of 15N isotope labeled L-glutamic
acid spiked human urine.
Metabolites 2013, 3
591
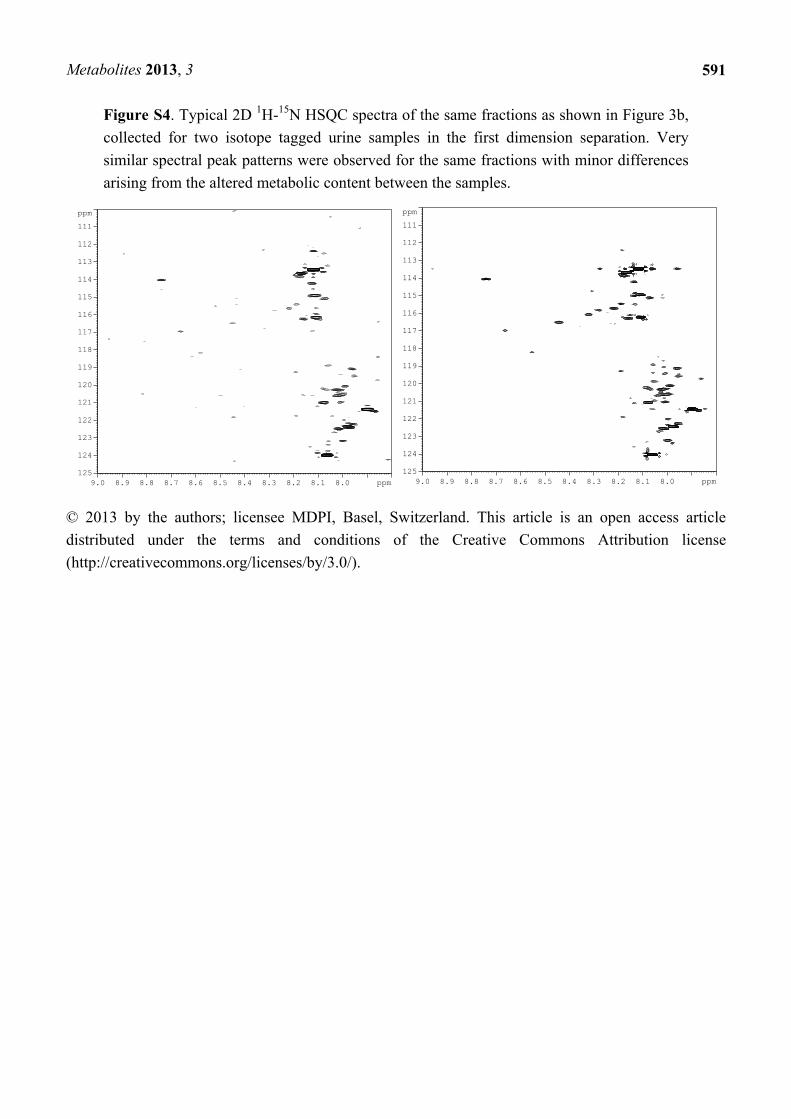
Figure S4. Typical 2D 1H-15N HSQC spectra of the same fractions as shown in Figure 3b,
collected for two isotope tagged urine samples in the first dimension separation. Very
similar spectral peak patterns were observed for the same fractions with minor differences
arising from the altered metabolic content between the samples.
© 2013 by the authors; licensee MDPI, Basel, Switzerland. This article is an open access article
distributed under the terms and conditions of the Creative Commons Attribution license
(http://creativecommons.org/licenses/by/3.0/).
ppm
8.08.18.28.38.48.58.68.78.88.99.0 ppm
111
112
113
114
115
116
117
118
119
120
121
122
123
124
125
ppm
8.08.18.28.38.48.58.68.78.88.99.0 ppm
111
112
113
114
115
116
117
118
119
120
121
122
123
124
125