combining ability, heterosis, genetic distance and their ... · combining ability, heterosis,...
TRANSCRIPT

Combining ability, heterosis, genetic distance and theirintercorrelations for waterlogging tolerance traitsin chrysanthemum
Jiangshuo Su . Fei Zhang . Xincheng Yang . Yixuan Feng .
Xiaodong Yang . Yangyang Wu . Zhiyong Guan . Weimin Fang .
Fadi Chen
Received: 29 August 2016 / Accepted: 5 January 2017 / Published online: 20 January 2017
� The Author(s) 2017. This article is published with open access at Springerlink.com
Abstract Waterlogging tolerance (WT) is a major
objective in chrysanthemum breeding programs, and
although certain genotypes with different tolerance
levels have been identified, their value as parents for
WT breeding is unknown. Here, twelve F1 crosses
derived from an incomplete diallel mating
scheme were conducted to investigate combining
ability and heterosis for WT and their relationships
with parental genetic distance. The results showed that
the membership function value of waterlogging
(MFVW) was controlled by additive and non-additive
gene effects, whereas other growth and biomass traits
were mainly controlled by non-additive gene effects.
The estimated broad and narrow sense heritabilities of
the MFVW were 97.5 and 51.5%, respectively.
Combining ability analyses indicated that ‘Nannong
Xuefeng’ showing the largest general combining
ability (GCA) effect for the MFVW was the best
combiner, and identified several best cross combina-
tions with high positive specific combining ability
(SCA) effects for most WT-related traits. Mid- and
high-parent heterosis occurred widely. The three
distance measures, based on phenotypic traits (PD),
molecular markers (GD) and markers linked with
quantitative trait loci (QTL-GD), presented a non-
significant correlation with combining ability except
for the GDwith GCA for the relative root fresh weight.
The correlations between the QTL-GD and heterosis
were significant for certain traits and generally higher
than that of the PD or GD and heterosis. The SCA
effects were positively correlated with heterosis for
most of the WT traits (0.51 B r B 0.80). The findings
benefit understanding the inheritance mode and then
achieving desirable improvement for WT in
chrysanthemum.
Keywords Chrysanthemum � Combining ability �Flooding tolerance � Heterosis � Inheritance mode
Introduction
Chrysanthemum (Chrysanthemum morifolium Ramat.)
is a traditionally important flower in China and ranks in
the top four cut-flower industriesworldwide (Zhang et al.
2011; Teixeira da Silva et al. 2013). Chrysanthemum is
highly heterozygous and self-incompatible, and usually
regarded as a natural hybrid arising from multiple
Chrysanthemum species (Chen et al. 1996; Dai et al.
1998; Anderson 2007); as a result, it is often vegetatively
propagated. Despite the advent of molecular breeding
designs in chrysanthemum, conventional crossbreeding
Electronic supplementary material The online version ofthis article (doi:10.1007/s10681-017-1837-0) contains supple-mentary material, which is available to authorized users.
J. Su � F. Zhang � X. Yang � Y. Feng � X. Yang �Y. Wu � Z. Guan � W. Fang � F. Chen (&)
College of Horticulture, Nanjing Agricultural University,
Weigang No. 1, Nanjing 210095, Jiangsu, People’s
Republic of China
e-mail: [email protected]
123
Euphytica (2017) 213:42
DOI 10.1007/s10681-017-1837-0
between parental cultivars with contrasting target traits is
the most effective breeding method, in which excellent
F1 hybrids with traits of interest will be selected and
vegetatively cultivated into a cultivar. Waterlogging
stress is a main abiotic constraint that limits chrysanthe-
mum productivity (Yin et al. 2009a, b). Chrysanthemum
is usually cropped in South China during summer, which
is a season that experiences heavy rainfall and frequent
soil waterlogging. In such environments, it is important
to produce cultivars that express an acceptable level of
waterlogging tolerance (WT).
Understanding the gene action of the targeted traits
and selecting suitable parents are two important
strategies for achieving desired genetic improvements
for chry santhemum. Combining ability is an impor-
tant parameter that reflects the breeding value of
cultivars and includes general combining ability
(GCA) and specific combining ability (SCA), which
are usually evaluated based on a series of crosses.
Diallel or factorial (line 9 tester) crossing is most
frequently employed (Ahuja and Dhayal 2007). An
incomplete diallel cross design can significantly
reduce the number of crosses relative to that of a
diallel analysis, which requires less effort and has been
applied in many crops. In chrysanthemum, Zhang
et al. (2010) conducted a 3 9 4 NCII design to explore
the combining ability and genetic parameters for
certain horticultural traits and revealed that plant
height and leaf length are principally controlled by
non-additive genes. However, previous studies were
considerably restricted to agronomic and yield traits
rather than tolerance or resistance traits.
The heterosis effect has been used in breeding both
open-pollinated and self-pollinated plants, such as
maize (Suwarno et al. 2014), tomato (Jindal 2016) and
wheat (Boeven et al. 2016). In chrysanthemum,
heterosis has been widely observed for a few horti-
cultural and resistance traits (Zhang et al. 2011,
2013; Wang et al. 2014). Nevertheless, chrysanthe-
mum is hypothesized to be allohexaploid (2n =
6x = 54), and the species exhibits a complex genetic
background that which increasing the difficulty of
studying the genetic mechanisms underlying quanti-
tative characteristics. Moreover, identifying beneficial
behaviors in progenies via field trials is a time-
consuming and costly process. Thus, the ability to
accurately predict superior hybrids prior to field
evaluations will enhance the efficiency of breeding
activities.
The extent of pair-wise parental genetic distances has
been considered a predictor of hybrid performance and
heterosis (Marsan et al. 1998). Different methods have
been used to evaluate the level of genetic distance,
including morphological markers, isozymes and molec-
ular techniques (Weeden andWendel 1989; Ferriol et al.
2003; Smykal et al. 2008). Significant time and effort are
required to obtain morphological markers, which are
frequently influenced by environmental factors. Various
molecular markers are currently used for estimating
genetic distance, and the SRAP, SSR and SCoT markers
have been reported as markers for the genetic diversity
and QTL mapping of chrysanthemum (Li et al.
2013, 2016; Zhang et al. 2013). Recently, QTL-linked
marker-based GDs (QTL-GDs) have been reported to
facilitate effective predictions of heterosis (Wegary et al.
2013). In our earlier study, evaluation of WT in a
collection of one hundred chrysanthemum cultivars
under three conditions resulted in some genotypes with
contrast waterlogging tolerance that could be used as
potential donors for future improvement of WT, and
some 80 markers (P B 0.05) associated with WT have
been identified using association mapping (Su et al.
2016). Therefore, we attempted to estimate the pair-wise
parental genetic distance with the WT-associated mark-
ers (equivalent to QTL-GD).
Previous attempts to analyze the relationship
among heterosis, GD and combining ability have
resulted in different conclusions for various crop
species. Betran et al. (2003) reported a highly signif-
icant correlation between GD and SCA effects
(r = 0.8) in maize under stress and non-stress condi-
tions. Devi and Singh (2011) demonstrated that SCA
could emerge as an important factor in the determi-
nation of heterosis and per se performance of the
hybrids. However, Ceballos et al. (2016) observed
weak associations between the GD and SCA effects,
which presented r2 values ranging from 0.00 to 0.28.
Ndhlela et al. (2015) and Dreisigacker et al. (2005)
found no explicit correlation between GD and hetero-
sis. Cress (1966) proposed that the extent of GD
between parents is necessary for significant heterosis
but is not sufficient to guarantee it. Betran et al. (2003)
suggested that heterosis can be better predicted only
when GD is smaller than a certain threshold. More-
over, studies have suggested that the correlation is
dependent on the investigated germplasm and GD
calculation methods (Melchinger et al. 1990; Tams
et al. 2006).
42 Page 2 of 15 Euphytica (2017) 213:42
123
Thus, little information is available on the heterosis,
combining ability and parental genetic diversity and
their intercorrelations for WT–related traits in
chrysanthemum. The objectives of the present study
were to (i) estimate the combining ability, heritability
and heterosis of WT, (ii) assess the genetic distance of
parents based on morphological and molecular mark-
ers and (iii) determine the correlations among com-
bining ability, heterosis and genetic distance. The
findings of the present research will provide an in-
depth understanding of the inheritance pattern of WT
in chrysanthemum and facilitate future improvements
of chrysanthemum’s WT.
Materials and methods
Parental selection and hybridization
In 2014, seven spray-cut chrysanthemum cultivars of
different origins (Table 1) were selected according to
an earlier greenhouse-based waterlogging evaluation
trial (Su et al. 2016). During flowering, the four
waterlogging tolerant genotypes (as female parents)
and three waterlogging susceptible genotypes (as male
parents) were crossed in a 4 9 3 incomplete diallel
design (NCII) at the Chrysanthemum Germplasm
Resource Preserving Centre (Nanjing Agricultural
University, China), and they produced 12 cross
combinations. The male parents were strictly bagged,
and the female parents were also bagged immediately
after hand pollination to prevent access by insects
during the crossing process. Mature and plump seeds
were maintained at room temperature after collecting
and then air dried in January 2015.
At the end of March 2015, B400 seeds per cross
were sown and grown in Styrofoam nursery trays
containing field soil under greenhouse conditions. The
seedlings were transplanted to the field after 60 d of
germination with a row spacing of 0.3 m and plant
spacing of 0.2 m. Each line was randomly named
according to the cross name ? Arabic numerals
starting from one. Additionally, the four parents were
planted in the same screen house. To produce enough
cuttings for replicated WT screening, the seedlings
were pinched twice.
Waterlogging treatment and field measurements
From August 2015 to October 2015, the seven parents
and F1 progenies of the 12 crosses were evaluated for
WT in a greenhouse experiment. The trial was
performed in a randomized complete block with three
replicates for the waterlogging treatment and the no
waterlogging treatment. First, strong and uniform
6 cm-long cuttings were obtained from each line, and
their parents were inserted in Styrofoam nursery trays
with 72 caves containing a 1:1 mixture of sterile
perlite and vermiculite and then transplanted in
disposable plastic pots filled with a 3:1:1 mixture of
garden soil, perlite and vermiculite until the cutting
seedlings rooted. The pots intended for the waterlog-
ging treatment were transferred in 45 L plastic bins
until the seedlings had 10–12 nodes. The waterlogging
stress was imposed by injecting running water into
each bin to 3 cm above the soil surface. Furthermore,
additional water was added daily to maintain the water
level, whereas the corresponding parents and F1progenies, irrigated every other day to ensure normal
growth, were used as control plants.
The stress treatments began on October 2, and at the
4th day of treatment, the leaf wilting index was
recorded using a symptom severity scale ranging from
1 to 5, with one representing the least amount of wilt.
At the 10th day, the male parents showed severe
waterlogging injury symptoms, and the percentage of
the dead leaf area was recorded and the different
degrees of damage to the leaf and stem were scored
following the grading standards established by Yin
et al. (2009b). The three traits were only recorded for
the plants under stress because the plants in the no
stress conditions did not show leaf or stem chlorosis.
Table 1 Origin and waterlogging tolerance (WT) grades of
the parental genotypes
Parents Origin MFVW Grades
Female P1 Xiaoli Japan 0.83 I
P2 Winter White Japan 0.94 I
P3 Qx097 Unknown 0.86 I
P4 Nannong
Xuefeng
China 0.91 I
Male P5 Monalisa Europe 0.18 V
P6 Qx096 Unknown 0.49 III
P7 Qx098 Unknown 0.39 IV
I, III, IV and V indicate highly tolerant, moderately tolerant,
susceptible and highly susceptible, respectively
Euphytica (2017) 213:42 Page 3 of 15 42
123
Additionally, the relative shoot height (RSH), relative
root length (RRL), relative shoot fresh weight
(RSFW), relative root fresh weight (RRFW), relative
shoot dry weight (RSDW) and relative root dry weight
(RRDW) were calculated as the ratio of the treatment
plant data to the control plant data. The root data were
recorded after carefully washing the soil from the
roots. The shoots and roots were dried in a forced air
oven for more than 72 h at 105 �C until reaching a
constant weight. During the growing and treating
periods in the greenhouse, the average air temperature
was 20.1 �C, the humidity was 77.9%, and the lighting
time was 16 h.
Statistical analysis
An analysis of variance (ANOVA) for the recorded
traits, combining ability and diallel analysis was
conducted using DPS v 7.05 (Tang and Feng 2002).
The GCA and SCA effects and genetic parameters
were estimated following Model I and Method II of
Griffing’s method (Griffing 1956). The d2GCA : d2SCAratio was used to indicate the relative importance of
the additive or non-additive genes controlling the
evaluated characteristic. Mid-parent heterosis (MPH)
and high-parent heterosis (HPH) were calculated as
follows: MPH = [XF1 – (XP1 ? XP2) / 2] / [(XP1 ? -
XP2)/2]; and HPH = (XF1-XH) / XH, where, XF1 is
the mean performance of the F1 progenies for each
cross, XP1 is the mean performance of parent one, XP2
is the mean performance of parent two and XH is the
mean value of the highest performing parent. The
analysis of genetic distance among the seven parents
was estimated using morphological and molecular
markers. The Euclidean distance was calculated from
the seven traits using SPSS 20.0 software (http://www-
01.ibm.com), and it was treated as a measure of mul-
tivariate phenotypic distance (PD). Nei’s (1972)
genetic distance was calculated based on 707 infor-
mative markers (371, 49, and 406 generated from 39
SRAP, 7 SCoT and 31 EST-SSR, respectively) as
reported by Li et al. (2016) (GD) and 80 markers
significantly associated with WT (QTL-GD)
(P B 0.05, Table S1 and S2) according to a mixed
linear model from a previous association mapping
study (Su et al. 2016). The dendrograms were con-
structed from the three distance matrixes using the
unweighted pair group method with the arithmetic
averages (UPGMA) method of cluster analysis in
NTSYS-pc v2.1 software (Rohlf 1998). The relation-
ships among the genetic distance, heterosis and com-
bining ability were assessed by Pearson’s correlation
coefficients (r) and tested at P = 0.05 and 0.01.
Results
ANOVA and hybrid performance for WT
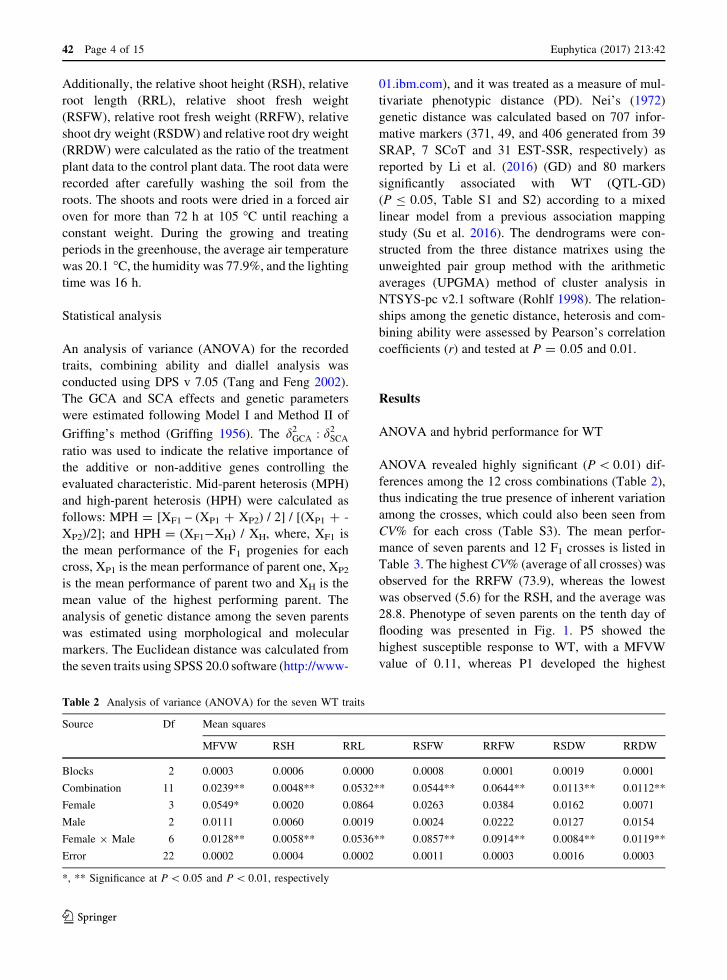
ANOVA revealed highly significant (P\ 0.01) dif-
ferences among the 12 cross combinations (Table 2),
thus indicating the true presence of inherent variation
among the crosses, which could also been seen from
CV% for each cross (Table S3). The mean perfor-
mance of seven parents and 12 F1 crosses is listed in
Table 3. The highest CV% (average of all crosses) was
observed for the RRFW (73.9), whereas the lowest
was observed (5.6) for the RSH, and the average was
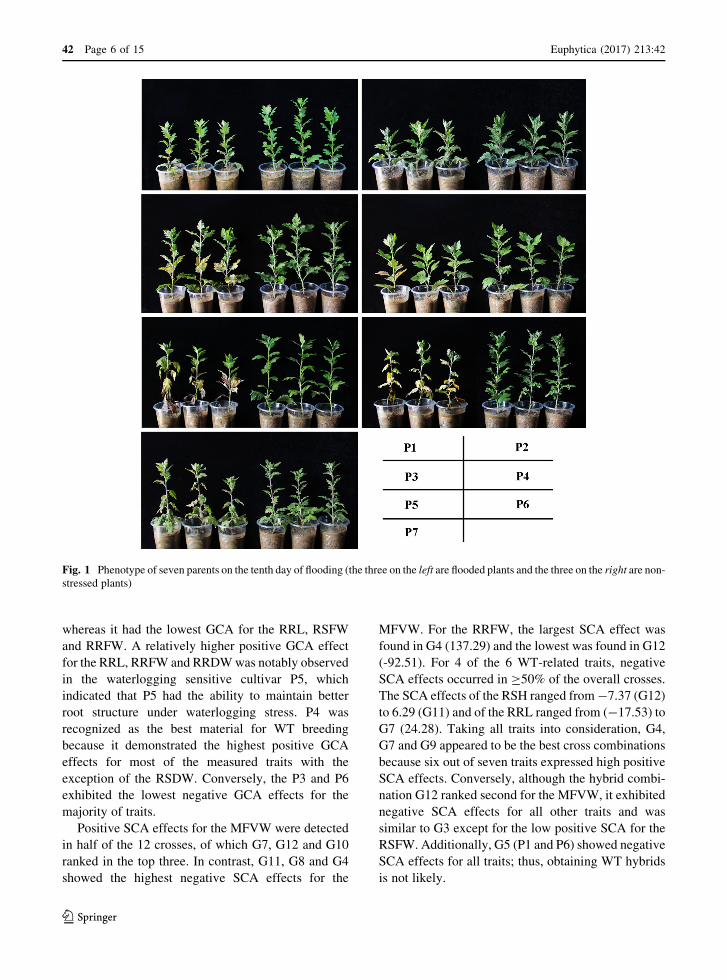
28.8. Phenotype of seven parents on the tenth day of
flooding was presented in Fig. 1. P5 showed the
highest susceptible response to WT, with a MFVW
value of 0.11, whereas P1 developed the highest
Table 2 Analysis of variance (ANOVA) for the seven WT traits
Source Df Mean squares
MFVW RSH RRL RSFW RRFW RSDW RRDW
Blocks 2 0.0003 0.0006 0.0000 0.0008 0.0001 0.0019 0.0001
Combination 11 0.0239** 0.0048** 0.0532** 0.0544** 0.0644** 0.0113** 0.0112**
Female 3 0.0549* 0.0020 0.0864 0.0263 0.0384 0.0162 0.0071
Male 2 0.0111 0.0060 0.0019 0.0024 0.0222 0.0127 0.0154
Female 9 Male 6 0.0128** 0.0058** 0.0536** 0.0857** 0.0914** 0.0084** 0.0119**
Error 22 0.0002 0.0004 0.0002 0.0011 0.0003 0.0016 0.0003
*, ** Significance at P\ 0.05 and P\ 0.01, respectively
42 Page 4 of 15 Euphytica (2017) 213:42
123
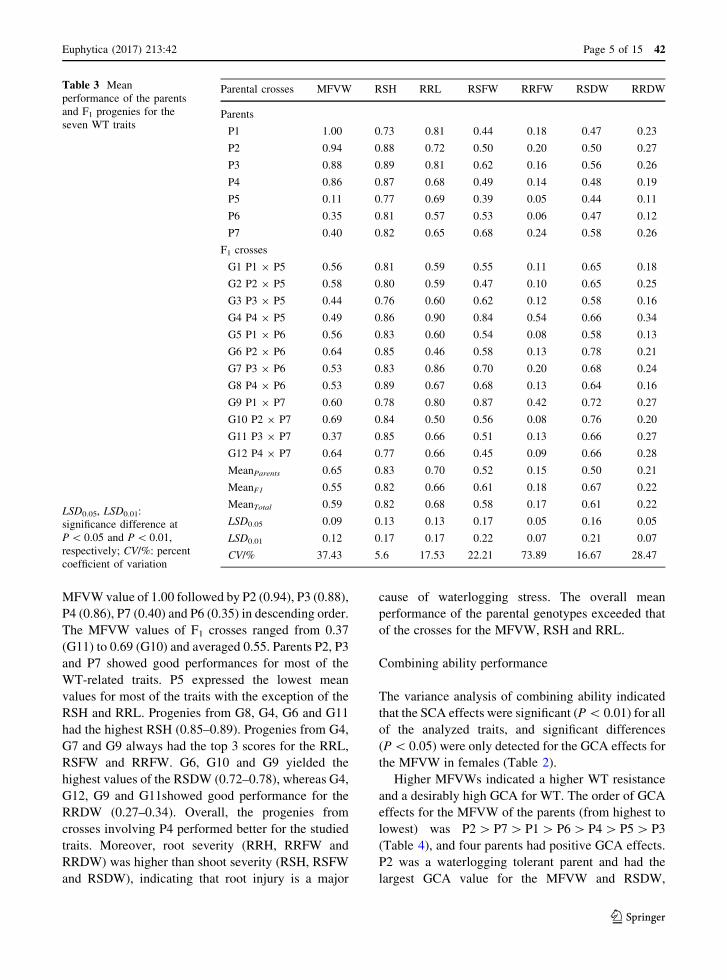
MFVWvalue of 1.00 followed by P2 (0.94), P3 (0.88),
P4 (0.86), P7 (0.40) and P6 (0.35) in descending order.
The MFVW values of F1 crosses ranged from 0.37
(G11) to 0.69 (G10) and averaged 0.55. Parents P2, P3
and P7 showed good performances for most of the
WT-related traits. P5 expressed the lowest mean
values for most of the traits with the exception of the
RSH and RRL. Progenies from G8, G4, G6 and G11
had the highest RSH (0.85–0.89). Progenies from G4,
G7 and G9 always had the top 3 scores for the RRL,
RSFW and RRFW. G6, G10 and G9 yielded the
highest values of the RSDW (0.72–0.78), whereas G4,
G12, G9 and G11showed good performance for the
RRDW (0.27–0.34). Overall, the progenies from
crosses involving P4 performed better for the studied
traits. Moreover, root severity (RRH, RRFW and
RRDW) was higher than shoot severity (RSH, RSFW
and RSDW), indicating that root injury is a major
cause of waterlogging stress. The overall mean
performance of the parental genotypes exceeded that
of the crosses for the MFVW, RSH and RRL.
Combining ability performance
The variance analysis of combining ability indicated
that the SCA effects were significant (P\ 0.01) for all
of the analyzed traits, and significant differences
(P\ 0.05) were only detected for the GCA effects for
the MFVW in females (Table 2).
Higher MFVWs indicated a higher WT resistance
and a desirably high GCA for WT. The order of GCA
effects for the MFVW of the parents (from highest to
lowest) was P2[ P7[P1[ P6[P4[ P5[ P3
(Table 4), and four parents had positive GCA effects.
P2 was a waterlogging tolerant parent and had the
largest GCA value for the MFVW and RSDW,
Table 3 Mean
performance of the parents
and F1 progenies for the
seven WT traits
LSD0.05, LSD0.01:
significance difference at
P\ 0.05 and P\ 0.01,
respectively; CV/%: percent
coefficient of variation
Parental crosses MFVW RSH RRL RSFW RRFW RSDW RRDW
Parents
P1 1.00 0.73 0.81 0.44 0.18 0.47 0.23
P2 0.94 0.88 0.72 0.50 0.20 0.50 0.27
P3 0.88 0.89 0.81 0.62 0.16 0.56 0.26
P4 0.86 0.87 0.68 0.49 0.14 0.48 0.19
P5 0.11 0.77 0.69 0.39 0.05 0.44 0.11
P6 0.35 0.81 0.57 0.53 0.06 0.47 0.12
P7 0.40 0.82 0.65 0.68 0.24 0.58 0.26
F1 crosses
G1 P1 9 P5 0.56 0.81 0.59 0.55 0.11 0.65 0.18
G2 P2 9 P5 0.58 0.80 0.59 0.47 0.10 0.65 0.25
G3 P3 9 P5 0.44 0.76 0.60 0.62 0.12 0.58 0.16
G4 P4 9 P5 0.49 0.86 0.90 0.84 0.54 0.66 0.34
G5 P1 9 P6 0.56 0.83 0.60 0.54 0.08 0.58 0.13
G6 P2 9 P6 0.64 0.85 0.46 0.58 0.13 0.78 0.21
G7 P3 9 P6 0.53 0.83 0.86 0.70 0.20 0.68 0.24
G8 P4 9 P6 0.53 0.89 0.67 0.68 0.13 0.64 0.16
G9 P1 9 P7 0.60 0.78 0.80 0.87 0.42 0.72 0.27
G10 P2 9 P7 0.69 0.84 0.50 0.56 0.08 0.76 0.20
G11 P3 9 P7 0.37 0.85 0.66 0.51 0.13 0.66 0.27
G12 P4 9 P7 0.64 0.77 0.66 0.45 0.09 0.66 0.28
MeanParents 0.65 0.83 0.70 0.52 0.15 0.50 0.21
MeanF1 0.55 0.82 0.66 0.61 0.18 0.67 0.22
MeanTotal 0.59 0.82 0.68 0.58 0.17 0.61 0.22
LSD0.05 0.09 0.13 0.13 0.17 0.05 0.16 0.05
LSD0.01 0.12 0.17 0.17 0.22 0.07 0.21 0.07
CV/% 37.43 5.6 17.53 22.21 73.89 16.67 28.47
Euphytica (2017) 213:42 Page 5 of 15 42
123
whereas it had the lowest GCA for the RRL, RSFW
and RRFW. A relatively higher positive GCA effect
for the RRL, RRFW and RRDWwas notably observed
in the waterlogging sensitive cultivar P5, which
indicated that P5 had the ability to maintain better
root structure under waterlogging stress. P4 was
recognized as the best material for WT breeding
because it demonstrated the highest positive GCA
effects for most of the measured traits with the
exception of the RSDW. Conversely, the P3 and P6
exhibited the lowest negative GCA effects for the
majority of traits.
Positive SCA effects for the MFVW were detected
in half of the 12 crosses, of which G7, G12 and G10
ranked in the top three. In contrast, G11, G8 and G4
showed the highest negative SCA effects for the
MFVW. For the RRFW, the largest SCA effect was
found in G4 (137.29) and the lowest was found in G12
(-92.51). For 4 of the 6 WT-related traits, negative
SCA effects occurred in C50% of the overall crosses.
The SCA effects of the RSH ranged from-7.37 (G12)
to 6.29 (G11) and of the RRL ranged from (-17.53) to
G7 (24.28). Taking all traits into consideration, G4,
G7 and G9 appeared to be the best cross combinations
because six out of seven traits expressed high positive
SCA effects. Conversely, although the hybrid combi-
nation G12 ranked second for the MFVW, it exhibited
negative SCA effects for all other traits and was
similar to G3 except for the low positive SCA for the
RSFW. Additionally, G5 (P1 and P6) showed negative
SCA effects for all traits; thus, obtaining WT hybrids
is not likely.
Fig. 1 Phenotype of seven parents on the tenth day of flooding (the three on the left are flooded plants and the three on the right are non-
stressed plants)
42 Page 6 of 15 Euphytica (2017) 213:42
123

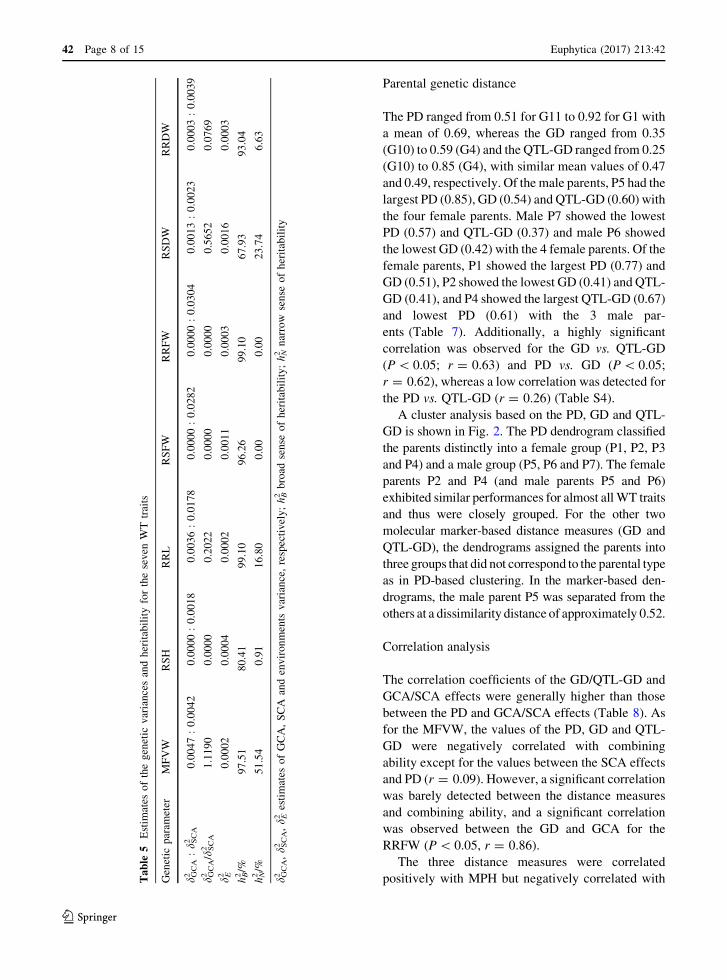
Estimation of genetic parameters
All of the GCA/SCA ratios were lower than 1.0 except
for the MFVW (1.1), and the RSH, RSFW and RRFW
presented ratios of 0 (Table 5). As the integrated
indicator of WT, the MFVW showed high broad sense
heritability (97.5%) as well as the highest narrow sense
heritability (51.5%), which reinforced that the MFVW
was controlled by both additive and non-additive genes,
with the former showing predominance. The other six
WT traits had high broad sense heritability but low
narrow sense heritability, and the narrow sense heri-
tability for the RSFW and RRFW traits were zero, which
suggests that non-additive gene action was primarily or
completely responsible for their inheritance.
Heterosis
The heterosis (MPH and HPH) of the F1 hybrids varied
in magnitude (Table 6). Generally, the mean HPH
values were lower than the MPH values for all traits,
and approximately 59.5 and 38.1% of the crosses
showed positive MPH and HPH, respectively. For the
MFVW, five out of 12 crosses expressed positive
MPH, whereas all the hybrids showed negative HPH.
The MPH values ranged from -42.1% for G11 to
10.2% for G2, whereas the HPH values varied from
-57.6% for G11 to -26.1% for G10 and G12.
Considering all the traits, G4 displayed the highest
positive MPH (482.3%) and HPH (286.6%) and G10
had the highest negative MPH (-63.0%) and HPH
(-66.2%) for the RRFW. The RSH and RRL showed
similar MPH and HPH trends. All of the hybrids
exhibited positive MPH and HPH for the RSDW; the
highest MPH (61.8%) and HPH (55.9%) were
observed in G6, whereas the lowest MPH (16.0%)
and HPH (3.6%) were observed in G3. For the
RSFW, most of heterosis effects were positive, and
the highest MPH (91.2%) and HPH (72.8%) were
observed in G4. For the RRDW, 75 and 33.3% of
crosses showed positive MPH and HPH, respectively,
of which G4 had the best MPH (126.8%) and HPH
(79.3%) and G5 had the lowest MPH (-25.3%) and
HPH (-42.1%).
Table 4 Estimates of the relative GCA and SCA effects for parents and crosses on the seven WT traits
Parental crosses MFVW RSH RRL RSFW RRFW RSDW RRDW
GCA effects for parents
P1 3.87 -1.96 0.51 6.51 14.82 -3.03 -13.54
P2 15.12 0.88 -20.95 -12.12 -41.34 9.41 -2.11
P3 -18.83 -1.01 7.26 -0.90 -16.38 -4.19 -1.12
P4 -0.15 2.10 13.18 6.51 42.90 -2.20 16.77
P5 -6.28 -1.72 1.98 0.90 23.09 -4.89 3.98
P6 2.31 3.14 -1.82 1.72 -25.12 0.08 -17.64
P7 3.97 -1.42 -0.17 -2.62 2.03 4.81 13.66
SCA effects for crosses
G1 P1 9 P5 4.27 2.27 -13.30 -17.90 -74.26 4.89 -12.92
G2 P2 9 P5 -3.97 -1.79 9.16 -11.75 -23.71 -7.05 9.94
G3 P3 9 P5 4.67 -5.17 -17.53 0.36 -39.31 -3.90 -29.81
G4 P4 9 P5 -4.97 4.70 21.66 29.29 137.29 6.05 32.80
G5 P1 9 P6 -4.92 -0.57 -7.98 -19.80 -44.77 -10.53 -9.19
G6 P2 9 P6 -2.31 -0.98 -6.80 4.79 37.60 7.38 12.17
G7 P3 9 P6 13.56 -1.12 24.28 12.57 51.95 5.55 23.11
G8 P4 9 P6 -6.33 2.67 -9.50 2.44 -44.77 -2.40 -26.09
G9 P1 9 P7 0.65 -1.69 21.28 37.70 119.03 5.64 22.11
G10 P2 9 P7 6.28 2.77 -2.36 6.96 -13.88 -0.33 -22.11
G11 P3 9 P7 -18.23 6.29 -6.76 -12.93 -12.64 -1.66 6.71
G12 P4 9 P7 11.30 -7.37 -12.16 -31.74 -92.51 -3.65 -6.71
Euphytica (2017) 213:42 Page 7 of 15 42
123
Parental genetic distance
The PD ranged from 0.51 for G11 to 0.92 for G1 with
a mean of 0.69, whereas the GD ranged from 0.35
(G10) to 0.59 (G4) and the QTL-GD ranged from 0.25
(G10) to 0.85 (G4), with similar mean values of 0.47
and 0.49, respectively. Of the male parents, P5 had the
largest PD (0.85), GD (0.54) and QTL-GD (0.60) with
the four female parents. Male P7 showed the lowest
PD (0.57) and QTL-GD (0.37) and male P6 showed
the lowest GD (0.42) with the 4 female parents. Of the
female parents, P1 showed the largest PD (0.77) and
GD (0.51), P2 showed the lowest GD (0.41) and QTL-
GD (0.41), and P4 showed the largest QTL-GD (0.67)
and lowest PD (0.61) with the 3 male par-
ents (Table 7). Additionally, a highly significant
correlation was observed for the GD vs. QTL-GD
(P\ 0.05; r = 0.63) and PD vs. GD (P\ 0.05;
r = 0.62), whereas a low correlation was detected for
the PD vs. QTL-GD (r = 0.26) (Table S4).
A cluster analysis based on the PD, GD and QTL-
GD is shown in Fig. 2. The PD dendrogram classified
the parents distinctly into a female group (P1, P2, P3
and P4) and a male group (P5, P6 and P7). The female
parents P2 and P4 (and male parents P5 and P6)
exhibited similar performances for almost allWT traits
and thus were closely grouped. For the other two
molecular marker-based distance measures (GD and
QTL-GD), the dendrograms assigned the parents into
three groups that did not correspond to the parental type
as in PD-based clustering. In the marker-based den-
drograms, the male parent P5 was separated from the
others at a dissimilarity distance of approximately 0.52.
Correlation analysis
The correlation coefficients of the GD/QTL-GD and
GCA/SCA effects were generally higher than those
between the PD and GCA/SCA effects (Table 8). As
for the MFVW, the values of the PD, GD and QTL-
GD were negatively correlated with combining
ability except for the values between the SCA effects
and PD (r = 0.09). However, a significant correlation
was barely detected between the distance measures
and combining ability, and a significant correlation
was observed between the GD and GCA for the
RRFW (P\ 0.05, r = 0.86).
The three distance measures were correlated
positively with MPH but negatively correlated withTa
ble
5Estim
ates
ofthegenetic
variancesandheritabilityfortheseven
WTtraits
Genetic
param
eter
MFVW
RSH
RRL
RSFW
RRFW
RSDW
RRDW
d GCA
2:d S
CA
20.0047:0.0042
0.0000:0.0018
0.0036:0.0178
0.0000:0.0282
0.0000:0.0304
0.0013:0.0023
0.0003:0.0039
d GCA
2/d
SCA
21.1190
0.0000
0.2022
0.0000
0.0000
0.5652
0.0769
d E20.0002
0.0004
0.0002
0.0011
0.0003
0.0016
0.0003
hB2/%
97.51
80.41
99.10
96.26
99.10
67.93
93.04
hN2/%
51.54
0.91
16.80
0.00
0.00
23.74
6.63
d GCA
2,d S
CA
2,d E2
estimates
ofGCA,SCA
andenvironments
variance,respectively;hB2broad
sense
ofheritability;hN2narrow
sense
ofheritability
42 Page 8 of 15 Euphytica (2017) 213:42
123

HPH for the MFVW, and the highest correlation was
shown for the PD and MPH (r = 0.45). The PD and
GD did not show a significant correlation with MPH
and HPH for all of the traits, whereas QTL-GD
showed positive and significant correlations with
MPH for the RSFW, RRFW and RRDW and with
HPH for the RRL, RSFW and RRFW.
For the MFVW, the SCA was significantly corre-
lated with HPH (P\ 0.05, r = 0.60) rather than with
MPH (r = 0.52). For the other six WT traits, the
correlation between the SCA effects and MPH were
positive and significant, with values of 0.62 for the
RSDWand 0.75 for theRSFWandRRFW. Similarly, a
positive and significant correlation was found between
the SCA and HPH for all of the WT traits except
RSDW, and the coefficient varied, with values of 0.67
for the RRL and 0.80 for the RRFW.
Discussion
Leaf chlorosis is a direct symptom of flooding that has
been successfully applied in wheat (Boru et al. 2001),
soybean (Cornelious et al. 2005) and barley (Li et al.
2008). In our study, a MFVW that integrates a wilting
index, a chlorosis score and the dead leaf proportion of
waterlogged plants was deployed to measure WT. In aTa
ble
6Heterosisofthe12crosses
fortheseven
WTtraits
F1crosses
MPH
HPH
MFVW
RSH
RRL
RSFW
RRFW
RSDW
RRDW
MFVW
RSH
RRL
RSFW
RRFW
RSDW
RRDW
G1P19
P5
1.24
7.33
-21.63
31.88
-1.35
42.19
3.68
-43.73
4.57
-27.19
25.01
-38.45
37.35
-22.62
G2P29
P5
10.23
-3.28
-16.09
6.52
-17.78
38.03
31.65
-38.34
-9.16
-17.77
-4.57
-49.58
29.80
-6.84
G3P39
P5
-11.21
-9.03
-19.94
22.47
15.60
15.98
-12.48
-49.94
-15.12
-25.74
0.18
-25.53
3.56
-37.74
G4P49
P5
0.85
5.32
31.14
91.24
482.32
44.50
126.80
-43.03
-0.34
29.74
72.83
286.61
39.50
79.27
G5P19
P6
-16.95
6.84
-13.62
12.42
-34.83
23.96
-25.25
-44.05
1.51
-26.37
2.89
-56.97
22.79
-42.09
G6P29
P6
-1.31
-0.09
-28.78
13.11
-3.83
61.76
4.67
-32.41
-3.81
-36.30
9.71
-37.84
55.88
-23.43
G7P39
P6
-12.60
-2.74
24.04
21.76
80.92
32.35
21.92
-38.95
-7.00
5.59
12.91
24.18
20.92
-10.29
G8P49
P6
-11.89
5.68
7.21
33.94
28.16
36.38
1.82
-38.15
2.53
-1.40
28.68
-8.77
35.01
-16.11
G9P19
P7
-14.89
0.35
10.13
56.15
96.03
36.64
12.93
-40.23
-5.06
-0.72
28.67
72.08
24.42
6.46
G10P29
P7
3.37
-1.15
-26.66
-3.59
-63.04
41.37
-22.53
-26.06
-4.42
-30.38
-16.45
-66.24
32.09
-24.39
G11P39
P7
-42.05
-0.57
-9.67
-20.51
-34.79
16.06
3.57
-57.63
-4.52
-18.69
-23.98
-46.23
14.55
1.99
G12P49
P7
0.52
-9.08
0.08
-23.37
-50.80
25.92
22.93
-26.10
-11.40
-2.11
-34.14
-61.35
14.72
7.62 Table 7 Estimates of phenotypic distance (PD) and two
genetic distances (GD and QTL-GD) between parents
Parents P1 P2 P3 P4 Mean
P5
PD 0.92 0.87 0.84 0.77 0.85
GD 0.52 0.53 0.50 0.59 0.54
QTL-GD 0.43 0.58 0.54 0.85 0.60
P6
PD 0.72 0.65 0.62 0.54 0.63
GD 0.49 0.36 0.38 0.44 0.42
QTL-GD 0.50 0.40 0.42 0.71 0.51
P7
PD 0.68 0.58 0.51 0.52 0.57
GD 0.52 0.35 0.43 0.47 0.44
QTL-GD 0.36 0.25 0.40 0.45 0.37
Mean
PD 0.77 0.70 0.66 0.61 0.69
GD 0.51 0.41 0.44 0.50 0.47
QTL-GD 0.43 0.41 0.45 0.67 0.49
Euphytica (2017) 213:42 Page 9 of 15 42
123

previous study, this measure was effective for screen-
ing WT in 100 chrysanthemum cultivars (Su et al.
2016).We also recorded the relative shoot/root growth
and biomass related to WT. The results showed
considerable variations among the seven parents and
F1 crosses for all WT traits, indicating the possibility
of selecting preferred parents and hybrids with high
WT. Among the crosses, the lowest MFVW value was
observed in G11 while the highest was found in G10.
Both of these crosses involved P7, which exhibited the
best WT among the three male parents. Moreover, the
mean MFVW value for G11 was even lower than that
of P7, whereas the mean MFVW value of the other 11
crosses generally ranged between that of the female
and male parents, indicating the complexity of WT
inheritance.
Approximately 60.0% of the crosses showed pos-
itive MPH but negative HPH for the WT traits,
Fig. 2 UPGMA dendrograms of the seven parents constructed based on PD (a), GD (b) and QTL-GD (c)
42 Page 10 of 15 Euphytica (2017) 213:42
123

indicating heterosis in the hybrids. Although the HPH
for the MFVWwas consistently negative, a number of
lines (Table S5) had higher MFVW values than their
tolerant female parents, which indicates that improved
WT lines can be selected. All or most of the crosses
displayed positive MPH and HPH for the RSDW and
RSFW, thereby showing that the hybrids had better
shoot biomass than their parents. Fairly negative or
low positive values of MPH and HPH for the RSH and
RRL indicated that the growth traits might be
predominantly controlled by recessive effects among
the parents.
In chrysanthemum, traditional cross breeding is one
of the most effective methods of cultivating improved
varieties via the exploitation of heterosis. The mag-
nitude of the genetic distance between parental lines is
vital for the utility of heterosis. To provide useful
information for predicting WT heterosis in chrysan-
themum, we investigated genetic distance using
morphological (phenotypic) and molecular markers.
The maximum and minimum distances yielded by the
GD and QTL-GD among the 12 crosses were consis-
tent and moderately high. Significant correlations
were observed between the GD and QTL-GD as well
as between the GD and PD, which is inconsistent with
the results of Wegary et al. (2013), who found a non-
significant correlation between morphological dis-
tance and GD in maize.
The GCA effect is the average performance of a
certain parent over a series of hybrids, and it is
associated with additive gene effects, whereas the
SCA effect reveals deviations in the performance of a
certain cross from the performance predicted by the
parents’ GCA effects, and it is associated with non-
additive gene effects (Musembi et al. 2015). In the
current study, the GCA to SCA variance ratios of the
MFVWwere approximately equal to 1 and the narrow
sense heritability of the MFVW was approximately
51.5%. These results suggest that both additive and
non-additive gene effects are responsible for the
inheritance of WT in chrysanthemum. Similar results
were reported in wheat (Tarekegne 2001) and maize
(Zaidi et al. 2010). Zhou et al. (2007) and Yeboah et al.
(2008) reported that WT was mainly controlled by
additive gene effects, which is inconsistent with the
findings of our study. However, the GCA–SCA
Table 8 Person correlation coefficients among the combining ability, heterosis and parental genetic distance (PD, GD and QTL-GD)
for the seven WT traits
Traits MFVW RSH RRL RSFW RRFW RSDW RRDW
PD
GCA -0.10 -0.49 -0.16 0.07 0.16 -0.39 -0.31
SCA 0.09 -0.11 0.03 0.02 0.02 0.00 0.02
MPH 0.45 0.17 -0.20 0.43 0.22 0.15 0.18
HPH -0.27 0.05 -0.14 0.39 0.17 0.10 -0.05
GD
GCA -0.27 -0.44 0.53 0.66 0.86* -0.70 0.23
SCA -0.19 -0.04 0.18 0.08 0.17 -0.13 0.22
MPH 0.16 0.20 0.33 0.57 0.54 -0.17 0.55
HPH -0.38 0.08 0.45 0.49 0.53 -0.15 0.49
QTL-GD
GCA -0.27 0.37 0.56 0.53 0.66 -0.56 0.30
SCA -0.30 0.17 0.16 0.16 0.20 -0.09 0.15
MPH 0.16 0.28 0.53 0.60* 0.69* 0.02 0.69*
HPH -0.24 0.19 0.63* 0.64* 0.64* 0.12 0.55
SCA
MPH 0.52 0.69* 0.71** 0.75** 0.75** 0.62* 0.69*
HPH 0.60* 0.68* 0.67* 0.68* 0.80** 0.51 0.68*
*, ** Significance at P\ 0.05 and P\ 0.01, respectively
Euphytica (2017) 213:42 Page 11 of 15 42
123
variance ratios and narrow sense heritability of the six
WT traits were relatively small, which indicates that
non-additive gene effects predominantly control these
growth and biomass traits, which is similar to the
results reported by Cheng et al. (2010) for Brassica
napus L. under waterlogging stress conditions.
We found that the GCA and SCA effects varied
between the parents or crosses, and both effects had
positive and negative values for all WT traits.
Generally, the tolerant parents tended to have positive
high values while the susceptible parents had negative
or low positive values for theMFVW. For example, P5
is the most sensitive parent and had most negative
GCA effect. However, exceptions were observed. For
example, although P3 is a tolerant parent with a high
MFVW value, it had the highest negative GCA effect.
Because theGCA effect is controlled by stable additive
gene effects, parents with significant GCA effects are
considered to be good combiners and can accelerate
breeding programs (Comstock et al. 1949; Dar et al.
2016). As a result, parent P4 showed positive effects
for almost all the studied traits and could therefore be
regarded as a promising parent in chrysanthemumWT
breeding. P1 and P5 were also good general combiners
for RRFW. In the current study, P4 and P5 both
expressed positive GCA effects for RRL, RSFW,
RRFW and RRDW, and their cross combination (G4)
had relatively high and positive SCA effects for the
four WT traits. However, positive correlations were
not observed between GCA and SCA for all crosses.
For example, parents P3 and P5 both exhibited
negative GCA effects for the MFVW, although the
SCA effects for the MFVW of G3 (P39P5) were
positive. Similarly, P2 and P6 had positive GCA
effects, although they produced progenies with a
negative SCA effect for the MFVW. The inconsistent
relationship between GCA and SCA effects has
frequently been reported in studies focused on com-
bining abilities (Sincik et al. 2014; Avin et al. 2016)
and is indicative of the complexity of quantitative
traits. Therefore, breeders should pay attention to both
GCA and SCA effects. Overall, the crosses G4, G7 and
G9 showed positive SCA effects for six of the seven
WT traits; specifically, G7 had the highest SCA effect
for the MFVW. Moreover, the above three hybrids
also had positive MPH and HPH for most of the
studied traits, thus indicating their high value for WT
breeding.
Many studies have reported correlations among
genetic distance, heterosis and SCA effects, although
these studies presented inconsistent and context-
specific conclusions because they used different
materials and methods. Heterosis mainly depends on
the paired differences of specific genetic loci between
both parents. Nevertheless, most previous studies used
genome-wide molecular marker data, which lack
specificity and accuracy. Tiede et al. (2015) showed
that segregating informative genome-wide markers
could improve the accuracy of predicting genetic
variance across 40 barley parents.Wegary et al. (2013)
suggested that the genetic distance calculated using
selected markers associated with quantitative trait loci
(QTL) may better predict heterosis. The results of the
present study showed that the magnitude of correlation
coefficients for PD and GD with HPH and MPH for all
the studied traits were not significant. However, the
QTL-GD values were positively and significantly
correlated with MPH for RSFW, RRFW and RRDW
and HPH for RRL, RSFW and RRFW (0.60–0.69),
thus indicating that previously selected molecular
markers associated with WT could be applied in
chrysanthemum cross breeding. The results were
similar to the findings by Hung et al. (2013), who
showed that the QTL-GD values based on 56 SSR
markers linked to targeted QTLs were negatively and
significantly correlated with heterosis for productive
tiller percentage. Although a non-significant correla-
tion was observed for GD and PD with heterosis, GD
generally had greater correlation coefficients than PD
for all of the traits in this study. Wegary et al. (2013)
also reported that morphological distances were less
important than molecular marker-based genetic dis-
tances for predicting the F1 performance of heterosis
and SCA effects for grain traits. Nevertheless, PD was
a better predictor of gene variance than GD across a 26
maize bi-parent group for 19 traits (Hung et al. 2012).
Significant correlations were not observed between
the distance measures and combining abilities except
for GD with GCA for RRFW. However, the distance
measures generally showed stronger correlations with
the GCA effects than with the SCA effects (absolute
coefficients) for almost all traits, and GD and QTL-GD
showed relatively high absolute correlation coefficient
values (0.23–0.86) with GCA. These results indicate
that the three distance measures might not effectively
predict SCA effects, although they indicate that GD
42 Page 12 of 15 Euphytica (2017) 213:42
123
and QTL-GD have a closer relationship with GCA
effects in the set of materials used in this study. In
contrast, Charcosset and Essioux (1994) illustrated
that SCA is a more important than GCA with regards
to the correlation with parental GD.Many studies have
demonstrated that parental GD has a weak and non-
significant correlation with SCA effects (Tams et al.
2006; Ceballos et al. 2016). However, Shamsuddin
(1985) found a significant correlation between GD and
SCA effects for grain yields (r = 0.44, P\ 0.01). El-
Maghraby et al. (2005) also reported that GDs based
on SSR markers were significantly associated with
grain yield and heterosis under drought stress. All of
these results suggest that the correlation between
genetic distance and SCA is complicated. An impor-
tant discovery by our study is that SCA effects had a
stronger positive correlation with MPH and HPH for
all of the traits (0.51–0.80), and most of the correla-
tions were significant, although this result may have
occurred because SCA and heterosis are responses to
non-additive gene effects.
In conclusion, this is the first report on the heterosis,
combining ability and parental genetic distance and
their intercorrelations forWT–related traits in chrysan-
themum. Findings resulted from this study add a brand-
new knowledge to the inheritance mode of WT in
chrysanthemum, and will be beneficial for achieving
new chrysanthemum with desirable WT. Specifically,
it can be predicted that crossbreeding with the iden-
tified parents with strong GCA will enable the
production of chrysanthemum with improved WT,
and the hybrids with extreme WT identified in this
study will serve as important breeding materials or be
cultivated as new cultivar in the near future.
Acknowledgements This work was financially supported by
the Grant from the National Natural Science Foundation of
China (Grant Nos.31425022 and 31272196), and Research
Funds for the Central Universities (Grant No. KYZC201601).
Author’s contributions F.C. and F.Z. conceived and
designed the project; F.C., W.F. and Z.G. provided the materi-
als; J.S., X.Y., Y.F., X.Y., and Y.W. conducted experiments;
J.S. and F.Z. analyzed the data and wrote the manuscript; and
J.S., F.Z. and F.C. revised the manuscript.
Compliance with ethical standards
Conflict of interest The authors declare that they have no
conflict of interest.
Open Access This article is distributed under the terms of the
Creative Commons Attribution 4.0 International License (http://
creativecommons.org/licenses/by/4.0/), which permits unre-
stricted use, distribution, and reproduction in any medium,
provided you give appropriate credit to the original
author(s) and the source, provide a link to the Creative Com-
mons license, and indicate if changes were made.
References
Ahuja SL, Dhayal LS (2007) Combining ability estimates for
yield and fibre quality traits in 4913 line tester crosses of
Gossypium hirsutum. Euphytica 153:87–98
Anderson NO (2007) Chrysanthemum (Dendranthema9gran-
diflora Tzvelv.). In: Anderson NO (ed) Flower breeding
and genetics. Springer, Netherlands, pp 389–437
Avin FA, Bhassu S, Rameeh V, Tan YS, Vikineswary S (2016)
Genetics and hybrid breeding of Pleurotus pulmonarius:
heterosis, heritability and combining ability. Euphytica
209:85–102
Betran FJ, Ribaut JM, Beck D, de Leon DG (2003) Genetic
diversity, specific combining ability, and heterosis in
tropical maize under stress and nonstress environments.
Crop Sci 43:797–806
Boeven PHG, Longin CFH, Wurschum T (2016) A unified
framework for hybrid breeding and the establishment of
heterotic groups in wheat. Theor Appl Genet
129:1231–1245
Boru G, Van Ginkel M, Kronstad WE, Boersma L (2001)
Expression and inheritance of tolerance to waterlogging
stress in wheat. Euphytica 117:91–98
Ceballos H, Lopez-Lavalle LB, Calle F, Morante N, Ovalle TM,
Hershey C (2016) Genetic distance and specific combining
ability in cassava. Euphytica 210:79–92
Charcosset A, Essioux L (1994) The effect of population
structure on the relationship between heterosis and
heterozygosity at marker loci. Theor Appl Genet
89:336–343
Chen FD, Chen PD, Li HJ (1996) Genome analysis and their
phylogenetic relationships of several wild species of
Dendranthema in China. Acta Hortic Sin 23(1):67–72
Cheng Y, Gu M, Cong Y, Zou C, Zhang X, Wang H (2010)
Combining ability and genetic effects of germination traits
of Brassica napus L. under waterlogging stress condition.
Agr Sci China 9:951–957
Comstock RE, Robinson HF, Harvey PH (1949) A breeding
procedure designed to make maximum use of both general
and specific combining ability. Agron J 41:360–367
Cornelious B, Chen P, Chen Y, De Leon N, Shannon JG, Wang
D (2005) Identification of QTLs underlying water-logging
tolerance in soybean. Mol Breed 16:103–112
Cress CE (1966) Heterosis of the hybrid related to gene fre-
quency differences between two populations. Genetics
53:269
Dai SL, Chen JY, Li WB (1998) Application of RAPD analysis
in the study on the origin of Chinese cultivated chrysan-
themum. Acta Bot Sin 40(11):1053–1059
Euphytica (2017) 213:42 Page 13 of 15 42
123

Dar ZA, Wani SA, Wani MA (2016) Heterosis and combining
ability analysis for seed yield and its attributes in Brassica
rapa ssp Brown sarson. J Oilseed Brass 2:21–28
Devi P, Singh NK (2011) Heterosis, molecular diversity, com-
bining ability and their interrelationships in short duration
maize (Zea mays L.) across the environments. Euphytica
178:71–81
Dreisigacker S, Melchinger AE, Zhang P, Ammar K, Flache-
necker C, Hoisington D, Warburton ML (2005) Hybrid
performance and heterosis in spring bread wheat, and their
relations to SSR-based genetic distances and coefficients of
parentage. Euphytica 144:51–59
El-Maghraby MA, Moussa ME, Hana NS, Agrama HA (2005)
Combining ability under drought stress relative to SSR
diversity in common wheat. Euphytica 141:301–308
Ferriol M, Pico B, Nuez F (2003) Genetic diversity of a germ-
plasm collection of Cucurbita pepo using SRAP and AFLP
markers. Theor Appl Genet 107:271–282
Griffing B (1956) Concept of general and specific combining
ability in relation to diallel crossing systems. Aust J Bio Sci
9:463–493
Hung HY, Browne C, Guill K, Coles N, Eller M, Garcia A,
Lepak N, Melia-Hancock S, Oropeza-Rosas M, Salvo S,
Upadyayula N, Buckler ES, Flint-Garcia S, McMullen
MD, Rocheford TR, Holland JB (2012) The relationship
between parental genetic or phenotypic divergence and
progeny variation in the maize nested association mapping
population. Heredity 108:490–499
Hung YX, Liu YZ, Guo JF (2013) Relationship between QTL-
SSR marker based genetic distance, combining ability, and
heterosis of productive tiller percentage in hybrid rice.
J Northwest A&F Univ 41:43–50
Jindal K (2016) Exploiting yield potential in tomato (Solanum
lycopersicum L.) through heterosis breeding. Plant Gene
Trait 7:1–7
Li H, Vaillancourt R, MendhamN, ZhouM (2008) Comparative
mapping of quantitative trait loci associated with water-
logging tolerance in barley (Hordeum vulgare L.). BMC
Genom 9:401
Li P, Jiang J, Chen S, Guan Z, Liao Y, Fang W, Chen F (2013)
Establishment and optimization of SCoTmolecular marker
system in chrysanthemum and its application of analysis on
genetic diversity. Acta Hortic Sin 40:2015–2025
Li P, Zhang F, Chen S, Jiang J, Wang H, Su J, Fang W, Guan Z,
Chen F (2016) Genetic diversity, population structure and
association analysis in cut chrysanthemum (Chrysanthe-
mum morifolium Ramat.). Mol Genet Genomics
291:1117–1125
Marsan PA, Castiglioni P, Fusari F, Kuiper M, Motto M (1998)
Genetic diversity and its relationship to hybrid perfor-
mance in maize as revealed by RFLP and AFLP markers.
Theor Appl Genet 96:219–227
Melchinger AE, Lee M, Lamkey KR, Woodman WL (1990)
Genetic diversity for restriction fragment length polymor-
phisms: relation to estimated genetic effects in maize
inbreds. Crop Sci 30:1033–1040
Musembi KB, Githiri SM, Yencho GC, Sibiya J (2015) Com-
bining ability and heterosis for yield and drought tolerance
traits under managed drought stress in sweetpotato.
Euphytica 201:423–440
Ndhlela T, Herselman L, Semagn K, Magorokosho C, Muti-
maamba C, Labuschagne MT (2015) Relationships
between heterosis, genetic distances and specific combin-
ing ability among CIMMYT and Zimbabwe developed
maize inbred lines under stress and optimal conditions.
Euphytica 204:635–647
Nei M (1972) Genetic distance between populations. Am Nat
106:283–292
Rohlf JF (1998) NTSY-pc: numerical taxonomy and multi-
variate analysis system, version 2.1 Exdler software. New
York: Setauket
Shamsuddin AK (1985) Genetic diversity in relation to heterosis
and combining ability in spring wheat. Theor Appl Genet
70:306–308
SincikM, Sozen E, Goksoy AT, Acikgoz E (2014) Heterosis and
combining ability in a diallel cross of turnip rape geno-
types. Turk J Field Crops 19:219–225
Smykal P, Hybl M, Corander J, Jarkovsky J, Flavell AJ, GrigaM
(2008) Genetic diversity and population structure of pea
(Pisum sativum L.) varieties derived from combined
retrotransposon, microsatellite and morphological marker
analysis. Theor Appl Genet 117:413–424
Su J, Zhang F, Li P, Guan Z, Fang W, Chen F (2016) Genetic
variation and association mapping of waterlogging toler-
ance in chrysanthemum. Planta 244(6):1241–1252
Suwarno WB, Pixley KV, Palacios-Rojas N, Kaeppler SM,
Babu R (2014) Formation of heterotic groups and under-
standing genetic effects in a provitamin A biofortified
maize breeding program. Crop Sci 54:14–24
Tams SH, Bauer E, Oettler G, Melchinger AE, Schon CC (2006)
Prospects for hybrid breeding in winter triticale: iI. Rela-
tionship between parental genetic distance and specific
combining ability. Plant Breed 125:331–336
Tang QY, Feng MG (2002) DPS data processing system for
practical statistics. Science and Publishing House, Beijing
Tarekegne AT (2001) Studies on genotypic variability and inher-
itance of waterlogging tolerance in wheat. PhD Dissertation,
University of Free State, Bloemfontein, South Africa
Teixeira da Silva JA, Shinoyama H, Aida R, Matsushita Y, Raj
SK, Chen F (2013) Chrysanthemum biotechnology: quo
vadis? Crit Rev Plant Sci 32(1):21–52
Tiede T, Kumar L, Mohammadi M, Smith KP (2015) Predicting
genetic variance in bi-parental breeding populations is
more accurate when explicitly modeling the segregation of
informative genomewide markers. Mol Breed 35:1–13
Wang C, Zhang F, Guan Z, Chen S, Jiang J, Fang W, Chen F
(2014) Inheritance and molecular markers for aphid
(Macrosiphoniella sanbourni) resistance in chrysanthe-
mum (Chrysanthemum morifolium Ramat.). Sci Hortic
180:220–226
Weeden NF, Wendel JF (1989) Genetics of plant isozymes. In:
Soltis D, Soltis P (eds) Isozymes in plant biology. Springer
Verlag, Berlin, pp 46–72
Wegary D, Vivek B, Labuschagne M (2013) Association of
parental genetic distance with heterosis and specific com-
bining ability in quality protein maize. Euphytica
191:205–216
Yeboah MA, Chen XH, Liang GH, Gu MH, Xu CW (2008)
Inheritance of waterlogging tolerance in cucumber (Cu-
cumis sativus L.). Euphytica 162:145–154
42 Page 14 of 15 Euphytica (2017) 213:42
123
Yin D, Chen S, Chen F, Guan Z, FangW (2009a) Morphological
and physiological responses of two chrysanthemum culti-
vars differing in their tolerance to waterlogging. Environ
Exp Bot 67(1):87–93
Yin D, Guan Z, Chen S, Chen F (2009b) Establishment of
evaluation system for waterlogging tolerance and identifi-
cation of waterlogging tolerance in chrysanthemum mori-
folium and its related genera plants. J Plant Genet Res
10:399–404
Zaidi PH, Maniselvan P, Srivastava A, Yadav P, Singh RP
(2010) Genetic analysis of water-logging tolerance in
tropical maize (Zea mays L.). Maydica 55:17–26
Zhang F, Fang W, Chen F, Chen S (2010) Combining ability
analysis on ornamental characters of chrysanthemum. Acta
Hortic Sin 37:589–596
Zhang F, Chen S, Chen F, Fang W, Deng Y, Chang Q, Liu P
(2011) Genetic analysis and associated SRAP markers for
flowering traits of chrysanthemum (Chrysanthemum
morifolium). Euphytica 177:15–24
Zhang F, Chen S, Jiang J, Guan Z, Fang W, Chen F (2013)
Genetic mapping of quantitative trait loci underlying
flowering time in chrysanthemum (Chrysanthemum mori-
folium). PLoS ONE 8:e83023
Zhou MX, Li HB, Mendham NJ (2007) Combining ability of
waterlogging tolerance in barley. Crop Sci 47:278–284
Euphytica (2017) 213:42 Page 15 of 15 42
123