combining a probability based telephone sample with an opt-in web panel
TRANSCRIPT

1icfi.com |
Combining a Probability Based Telephone Sample with an Opt-in Web Panel
Randal ZuWallack
James Dayton
Naomi Freedner-Maguire
ICF International
Katherine J. Karriker-Jaffe, PhD Thomas K. Greenfield, PhD
Alcohol Research Group, Public Health Institute

2icfi.com |
Outline
• National Alcohol Survey
• Motivation
• Data Fusion
• Data and Methods
• Results
• Summary
3icfi.com |
Acronyms to Know
• RR – Response Rate• NAS – National Alcohol Survey• N1-N14 = the iteration of the NAS (N1 = the first iteration, N14 = the
14th iteration)• CATI – Computer Assisted Telephone Interview• RDD – Random Digit Dial• F2F = Face to Face interview

4icfi.com |
National Alcohol Survey (NAS)
• Adults ages 18 and older in the United States to measure a number of alcohol related topics
• Questionnaire:– Alcohol consumption and behavior– Effects of alcohol on individual lives and the lives of others– Perceptions about alcohol– Emotional well-being– …and more.
• Length averages 45 min

5icfi.com |
Motivation
1. RDD CostRR • Decrease in coop• Decrease in contacts
Cell phones
$$
2000 2015
Cell phones
6icfi.com |
Motivation
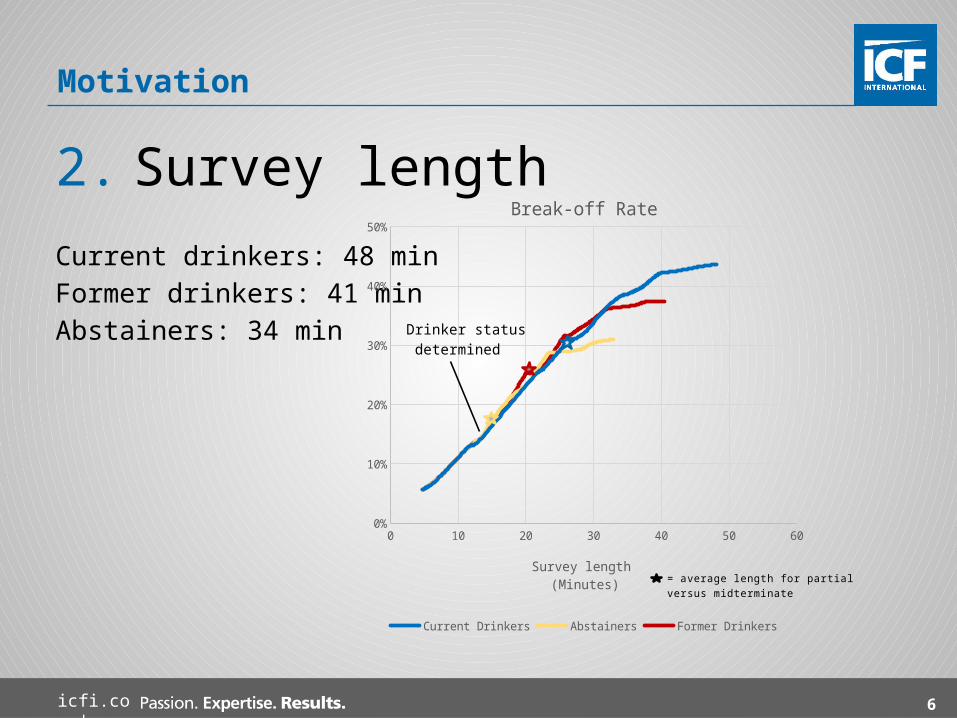
2. Survey length
Current drinkers: 48 min
Former drinkers: 41 min
Abstainers: 34 min
0 10 20 30 40 50 600%
10%
20%
30%
40%
50%
Break-off Rate
Current Drinkers Abstainers Former Drinkers
Survey length (Minutes)
Drinker status determined
= average length for partial versus midterminate

7icfi.com |
Motivation
3. Modernizing NAS
1965
1970
1975
1980
1985
1990
1995
2000
2005
2010
2015
2020
First NAS “N1”1964F2F
N102000RDDCATI
N122009Dual frameCATI
N142019??
New technologies
Emerging methods
“Fit-for-purpose”

8icfi.com |
Proposed approach
• Combine probability-based RDD with nonprobability Web panel using data fusion (aka statistical matching)
Cost
Not ALL IN on Web
• Why Web panel?
• Why data fusion?
• IDEA: 1. Use a probability based RDD to identify who’s who in the
population2. Use Web panel to measure behaviors, attitudes (what, where,
when?)
9icfi.com |
Data Fusion
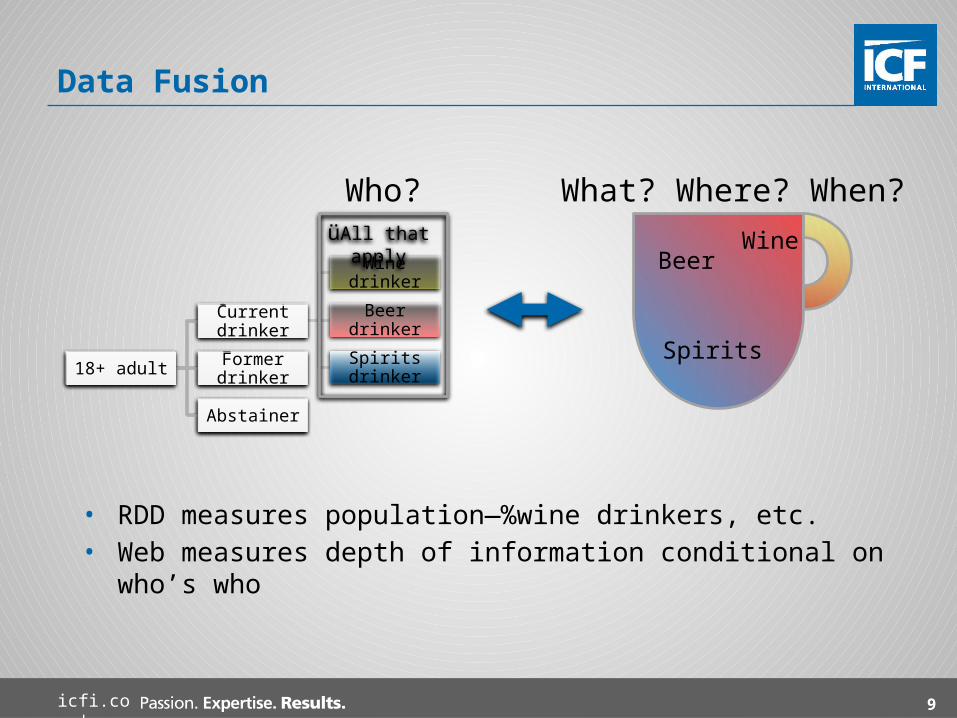
18+ adult
Current drinker
Wine drinker
Beer drinker
Spirits drinkerFormer drinker
Abstainer
üAll that apply
Who? What? Where? When?
WineBeer
Spirits18+ adult
Current drinker
Former drinker
Abstainer
• RDD measures population—%wine drinkers, etc.• Web measures depth of information conditional on who’s who

10icfi.com |
Data Fusion
Survey A
X, Y
Survey B
X, Z
XA = XB
Matched data
X, Y, Z
• Critical: Conditional independence– Y is independent of Z given X

11icfi.com |
Data
• NAS N13 extract– Dual-frame RDD, CATI– Average interview length: nearly 45 minutes – National sample, oversamples in geos with high black or Hispanic
densities – Data collection ongoing since October 2014. Data extracted on
December 23, 2014– 3358 completed interviews (1336 cell phone, 2022 landline).
• NAS Web experiment– Shortened version of the N13 questionnaire focused on alcohol
consumption. – Average interview length: 20 minutes– Conducted Jan 23-27 2014 by Schlesinger Associates (
http://www.schlesingerassociates.com/online_solutions.aspx) – 841 completed surveys

12icfi.com |
Methods
• Focus on – Current drinkers
• 1932 interviews out of 3358 (57%)
• 657 out of 841 (78%)
– Alcohol consumption and behaviors
• How often drinking wine in past 12 months• How often drinking beer in past 12 months• How often drinking spirits in past 12 months• How often drinking any alcohol in past 12 months• Typical number of drinks when drinking wine• Typical number of drinks when drinking spirits• Typical number of drinks when drinking beer• Number of times drinking 12 drinks• Number of times drinking 8-11 drinks• Number of times drinking 5-7 drinks• Number of times getting drunk• Maximum number of drinks in a single day• How often do you drink when spending a quiet evening
at home? • How often do you drink at bars, taverns, or cocktail
lounges? • How often do you drink when spending time with
friends in a public place, such as a park, street, or parking lot?
• How often do you drink at a party in someone’s home?
• Question 1: Are alcohol consumption and behaviors conditionally independent of other topics on the survey?

13icfi.com |
Conditional Independence
Effects of drinkingHelp for drinking problemDrug usePerceptions of drinkingDrinking injuries & illnessesEmotional healthEducationOther people’s drinkingStressful eventsNeighborhood characteristicsEthnic experiences
Correlation Analysis
1. We created 91 “other” variables (+16 drinking behavior variables)
2. Formed variable clusters—oblique principal component cluster analysis (SAS PROC VARCLUS) – Variables assigned to clusters based on
correlation with other variables in the cluster– Used Spearman rank correlation
14icfi.com |
Conditional Independence
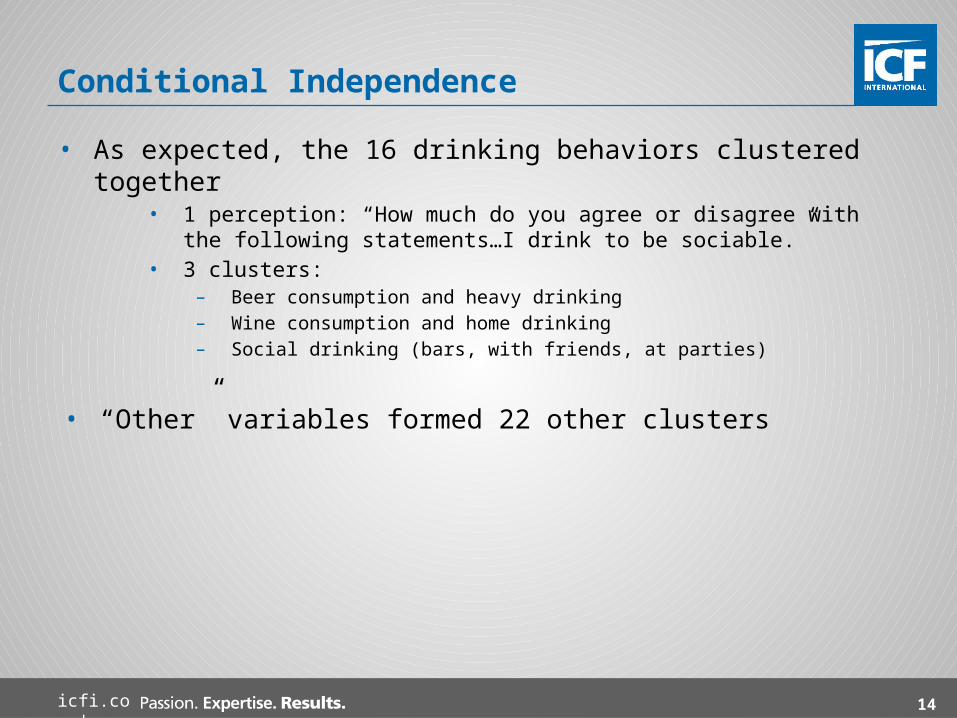
• As expected, the 16 drinking behaviors clustered together• 1 perception: “How much do you agree or disagree with the following
statements…I drink to be sociable.” • 3 clusters:
– Beer consumption and heavy drinking– Wine consumption and home drinking– Social drinking (bars, with friends, at parties)
• “Other” variables formed 22 other clusters

15icfi.com |
Conditional Independence
3. Calculated partial correlations of drinking clusters with “other” clusters– Used 1st principal component scores for each cluster (outcome from
the clustering algorithm) – Imputation– 3 stages for partial correlations
1. Design variables
2. + Wine, beer, spirits indicators and demos and general health status
3. + Key drinking variables
Squared Correlations Mean Min Max
Design variables 0.0260 0.0000 0.1889
Design and demographics 0.0147 0.0000 0.1158
Design, demographics, and drinking variables
0.0069 0.0000 0.0452
Gender General healthAge Quality of lifeRace/ethnicity Physical activityTenure Beer DrinkerFT student under 30 Wine DrinkerPresence of children Spirits DrinkerMarital status Drink quiet eve at homeEducational attainment Kept drinking wanted to stopEmployment status

16icfi.com |
The Split
• Linking variables (X): Wine, beer, spirits indicators and demos and general health status and key drinking variables
• RDD (Y): 52 total variables conditionally independent of drinking behaviors– “Other” clusters where 0 of the 3 partial correlations were significant at
0.05 level (7 clusters representing 28 variables)– Visual inspection: 7 more clusters (24 variables) were marginally
correlated (max<0.08)
• Web (Z): 55 total variables– 3 drinking behavior clusters (17 variables)– 8 clusters correlated with drinking behaviors (38 variables)
• Question 1: Are alcohol consumption and behaviors conditionally independent of other topics on the survey? YES and NO
• Question 2: Conditional on X, does Web = Phone (Zw=Zp)?

17icfi.com |
Web = Phone?
• We explore differences in phone response versus web response using adjusted means and frequencies
• Dependent: drinking variables– Independent:
• Controls--Wine, beer, spirits indicators and demos and general health status and key drinking variables
• Web or phone
• Examine differences between RDD phone or the Web panel after controlling for the matching variables?

18icfi.com |
Adjusted drinker distribution RDD vs Phone
• Differences in the distribution of drinker types—web consistently higher
• But drinker type will be a control in the matching
• What about consumption for these drinker types?
RDD Web RDD Web RDD WebWine Beer Spirits
0%
10%
20%
30%
40%
50%
60%
70%
80%
90%
100%
79%86%
65%72%
67%76%
Drinker types
RDD
Web
19icfi.com |
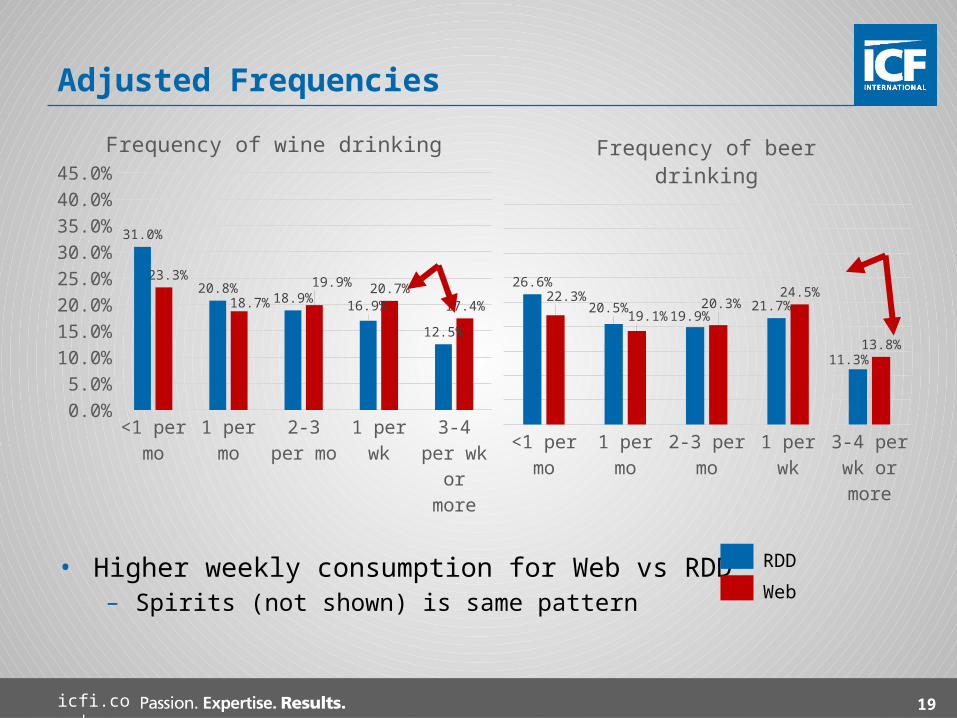
<1 per mo
1 per mo 2-3 per mo
1 per wk 3-4 per wk or more
26.6%
20.5%19.9%
21.7%
11.3%
22.3%
19.1%20.3%
24.5%
13.8%
Frequency of beer drinking
<1 per mo
1 per mo 2-3 per mo
1 per wk 3-4 per wk or more
0.0%
5.0%
10.0%
15.0%
20.0%
25.0%
30.0%
35.0%
40.0%
45.0%
31.0%
20.8%18.9%
16.9%
12.5%
23.3%
18.7%
19.9% 20.7%
17.4%
Frequency of wine drinking
Adjusted Frequencies
• Higher weekly consumption for Web vs RDD– Spirits (not shown) is same pattern
RDD
Web

20icfi.com |
Adjusted Means
<.0001 0.97330.00280.0195
RDD Web RDD Web RDD Web RDD WebWine Drnkrs Beer Drnkrs Spirits Drnkrs Max Drnks
1.0
1.5
2.0
2.5
3.0
3.5
4.0
4.5
5.0
2.012.27
2.572.75
2.382.56
3.51 3.51
Typical drinks on drink day
21icfi.com |
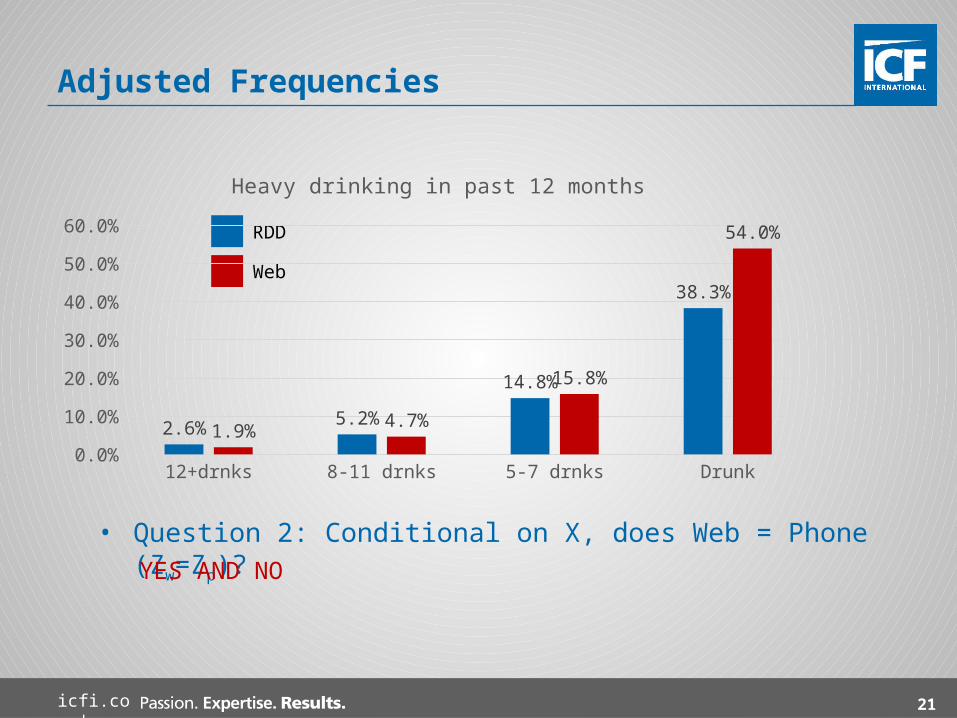
Adjusted Frequencies
• Question 2: Conditional on X, does Web = Phone (Zw=Zp)?YES AND NO
RDD
Web
12+drnks 8-11 drnks 5-7 drnks Drunk0.0%
10.0%
20.0%
30.0%
40.0%
50.0%
60.0%
2.6% 5.2%
14.8%
38.3%
1.9%4.7%
15.8%
54.0%
Heavy drinking in past 12 months

22icfi.com |
Matching
• Used propensity score matching due to small sample sizes and many combinations of age, race/ethnicity, educational attainment, etc.– Allowed multiple matches to Web, but only if Pscore<=0.01– Not all web cases used (distance to far)
• Ex.--Female wine drinkers: 831 RDD, 399 Web
Typical number of wine drinks
RDD 1.46
RDD/Web 1.79
Drank enough to feel drunk (past yr)
RDD 35.5%
RDD/Web 49.9%
<1 per mo
1 per mo 2-3 per mo
1 per wk 3-4 per wk or more
0.0%5.0%
10.0%15.0%20.0%25.0%30.0%35.0%40.0%45.0%
36.2%
19.0%16.6%
14.1% 14.1%
27.6%
13.2%18.0% 20.2% 21.0%
Frequency of wine drinkingRDD
RDD/Web

23icfi.com |
Matching
• Ex.—Male beer drinkers– 682 RDD, 165 Web
<1 per mo
1 per mo 2-3 per mo
1 per wk 3-4 per wk or more
0.0%5.0%
10.0%15.0%20.0%25.0%30.0%35.0%40.0%45.0%
19.9%17.6% 18.6%
26.4%
17.5%18.5%
12.0%14.7%
27.5% 27.3%
Frequency of beer drinking
Typical number of wine drinks
RDD 2.66
RDD/Web 2.66
Drank enough to feel drunk (past yr)
RDD 52.8%
RDD/Web 65.4%
RDD
RDD/Web

24icfi.com |
Cost Benefit
RDD Survey length 45 25
Landline 0.265 0.375
Cell phone 0.175 0.205
Wt avg 40% cell 0.229 0.307
RDD CPI ($30 /hr) $131.00 $97.72
Web CPI $0.00 $7.50
Total CPI $131.00 $105.22
Savings $1.00 $0.80
Recruit more than needed for matching—assume 50% more for cost analysis.

25icfi.com |
Summary
• Data fusion is a model based process of putting two (or more) disparate data sets together if the are conditionally independent
• The second condition to our data fusion model is that the data sources must represent the same population– Web and phone responses are different even after adjusting for the
demographic differences and drinker types.• Is it mode effects or model failure?
• Benefits of this model:– Average interview length reduced– Considerable cost savings

26icfi.com |
Mode Effects
– No “January effect”—Phone data collected in fall 2014, web in Jan 2015.
B2c. And how often do you usually have beer or malt beverages?
02 More than once a day03 Once a day04 Nearly every day05 Three or Four times a week06 Once or twice a week07 Two or three times a month08 About once a month09 Less than once a month but at least once a year10 Less than once a year11 Never
– Order effects?
2015
• Higher consumption on the web– Higher frequency of drinking on web
Web—primacy
Phone—recency
– Social desirability?

27icfi.com |
– Social desirability?• self-administered vs interviewer-administered• direction and magnitude consistent with literature
Mode effects
• Frequency of getting drunk – +16 points on web
B21. How often in the last twelve months did you drink enough to feel drunk?
01 Every day or nearly every day02 Three to four times a week03 Once or twice a week04 Once to three times a month05 Less than once a month06 Once in those 12 months07 Never in those 12 months

28icfi.com |
Next Steps
• Confirm the conditional independence for the 2 variable sets– Based on a second larger sample
• Understand mode effects– Is Web doing a better job at measuring consumption?– Ask the NAS questions to a split sample: 50% CATI, 50% Web
• Must be same population
• Panel variance – Want to explore the consistency of the NAS measures
• Multiple samples from the same panel (within panel variability)• For different panels (between panel variability)

29icfi.com |
Acknowledgements
• Thanks to Schlesinger Associates for recruiting web panelists free of charge for this experiment– Special thanks to Svetla Ninova and Jason Horine from Schlesinger
Associates
• For more information, please contact:– [email protected]
• Visit: icfi.com/SurveyResearch