combined management report for the financial year...
TRANSCRIPT
Combined Management Report
for the Financial Year 2017
• Overview 2017
• PUMA Group Essential Information
➢ Commercial Activities and Organizational Structure
➢ Targets and Strategy
➢ Product Development and Design
➢ Sourcing
➢ Employees
➢ Management System
• Economic Report
➢ General Economic Conditions
➢ Sales
➢ Results of Operations
➢ Dividends
➢ Regional Development
➢ Net Assets and Financial Position
➢ Cash Flow
➢ Managing Director’s Statement regarding the Business
Development and the Overall Situation of the PUMA Group
• Comments on the German GAAP Financial Statements of PUMA
SE
• Compensation Report
• Risk and Opportunity Management
• Supplemental Report and Outlook
• Information Concerning Takeovers
• Corporate Governance Report including the Statement on
Corporate Governance
Combined Management Report:
This report combines the Management Report of the PUMA Group and the Management Report of PUMA
SE.

2
Overview 2017
2017 was another successful year in the history of PUMA, marked by sporting highlights and a visible
improvement in our business. While our athletes were able to draw attention to themselves at the world’s
biggest sporting events, in 2017 we succeeded in passing the symbolic sales mark of four billion Euro for
the first time.
In keeping with PUMA’s goal of becoming the fastest sports brand in the world, our focus was to strengthen
our credibility as a sports brand through partnerships with some of the world’s most successful athletes,
such as athletics legend Usain Bolt, star striker Antoine Griezmann, golf star Rickie Fowler as well as teams
such as Arsenal FC and Borussia Dortmund, to name just a few. In the Sportstyle business, we continued
our collaboration with mega star and style icon Rihanna as well as with top model Cara Delevingne. Through
their individuality and their commitment to the PUMA brand, all of our brand ambassadors played a major
role in increasing our sell-through in 2017. We further strengthened our position as a sports brand and
further increased our brand heat by signing contracts with new sports stars and culturally relevant
influencers. We were extremely proud to welcome singer, actress and producer Selena Gomez as brand
ambassador for our women’s segment in 2017. We have also expanded our portfolio of brand ambassadors
in the men’s segment and started a collaboration with the musicians The Weeknd and Big Sean. In addition,
we have further strengthened our cooperation with Formula One world champion Lewis Hamilton through
our new campaign “24/7”, which redefines the brand’s performance philosophy at a time when workouts
are no longer constricted to the gym.
Overall, the strong demand for PUMA’s Performance and Sportstyle product offerings proved that we have
successfully managed to increase the commercial appeal of our products. Our new product lines such as PUMA
ONE, NETFIT, TSUGI and the latest FENTY PUMA by Rihanna collections received very positive feedback
both from our retail partners and our consumers. This is clear proof that PUMA is on the right path.
PUMA’s Teamsport category looks back on a successful year with exciting product launches and sporting
achievements. Our partnered teams grabbed some of the world’s biggest football trophies at the end of
the 2016/17 football season: Borussia Dortmund snatched the German DFB Cup, while Arsenal FC claimed
the FA Cup and Mexico’s Chivas won the 2017 Liga MX Clausura title. PUMA’s roster of individual players
also reached new heights: Arsenal’s Olivier Giroud was honored with the FIFA best goal award, while Sergio
Agüero broke the goal scoring record for Manchester City. On the product side, innovative products and
technologies hit the shelves. A strategic launch for the Teamsport category being the first PUMA ONE
football boot, which excels in FIT, FAST and FEEL.
In the Running category, the past year was marked by a major sporting event, the 2017 IAAF World
Championships, which also marked the end of Usain Bolt’s active career. The competition put the spotlight
on some of the new generation of PUMA athletes, one of them being the 800 meter gold medalist Pierre-
Ambroise Bosse. PUMA took performance footwear to the next level with the unveiling of its revolutionary
3
NETFIT range, whose uniquely customizable lacing system offers infinite performance and style options in
one shoe.
PUMA’s Motorsport category was driven by a fantastic season in Formula One, which was once again
dominated by our sponsored teams: MERCEDES AMG PETRONAS, Scuderia FERRARI and RED BULL
RACING formed the Top 3 of the Constructors’ Championship, while Lewis Hamilton was crowned F1 world
champion for a fourth time.
PUMA’s golf business continued to deliver stylish, performance-ready golf apparel, footwear and accessories
to the market while Cobra PUMA Golf supplied the market with technologically advanced golf equipment.
Cobra is particularly proud of the launch of its smart drivers KING F7 & F7+, which allow golfers to
automatically track the distance and accuracy of each drive.
Our Women’s business was one of the highest performers of 2017. We have taken our successful and
ongoing “DO YOU” campaign to the next round, aiming to inspire confidence in women around the world
with powerful female ambassadors such as Cara Delevingne and the New York City Ballet. Meanwhile, the
“FENTY PUMA by Rihanna” collections have established themselves among the world’s most anticipated
fashion shows. For Autumn-Winter ’17, PUMA’s women’s Creative Director Rihanna presented her “Fenty
University” collection with great success at the Bibliothèque Nationale de France in Paris. While for her
Spring-Summer ‘18 collection she returned to New York Fashion Week in autumn, introducing her latest
daredevil styles at the majestic Park Armory among dunes of illustrious pink sand and motocross riders in
the air.
With the “Run the Streets” campaign, innovative footwear silhouettes debuted throughout the year and
elevated our sports-inspired streetwear game in 2017. With an innovative and progressive look amped up
with new technologies, the all-new TSUGI range pushed our design to the next level. The highly anticipated
debut of the PUMA x XO collection which was designed in collaboration with The Weeknd caused a
worldwide sensation toward the end of the year.
On the distribution side, we focused on strengthening our relationship with key retailers. It is important to
us to be a reliable partner and to maximize our contribution to their business. We also established new
partnerships with strong retailers both in mature and emerging markets. PUMA’s improved sell-through has
enabled us to gain more shelf space for our products in our partner’s retail stores in 2017. In addition, we
continued to upgrade our owned-and-operated retail store network with the “Forever Faster” look and feel.
We gained further momentum in the eCommerce business, while working on the relaunch of ‘puma.com’
into a more modern and mobile-friendly format that went live in Europe last summer.

4
Operationally, we continued to make progress in key areas including further enhancements of our
International Trading Organization, which manages global order and invoice flows centrally, the roll-out of
new product development tools, further standardization of ERP systems and improvements to the overall
IT infrastructure.
With the expansion of our headquarters, which will be completed this spring, PUMA set out a clear
commitment to our roots in Herzogenaurach. After its completion, the new administrative building will
provide space for up to 550 employees. This will enable us to reunite our workforce in Herzogenaurach for
faster decision-making at this location. The 37-meter pylon of the PUMA bridge, which connects both
buildings, also represents a new landmark for Herzogenaurach as a true gateway to the city.
The consistent implementation of the “Forever Faster” company strategy contributed to PUMA being able
to exceed the sales mark of four billion Euros for the first time in company history in financial year 2017.
This proves that, with regard to increasing our brand heat and improving our product range, we are on the
right path. Sales growth was especially driven by the footwear segment, which has already been showing
increasing sales for fourteen quarters in a row, and which is the main driver of PUMA sales growth.
Accordingly, consolidated sales increased by 15.9% currency-adjusted in 2017. Therefore, the currency-
adjusted sales growth in a high single-digit percentage rate prospected in the previous Annual Report for
2017 was considerably exceeded. The forecast of currency-adjusted sales growth of 14% to 16%, that was
adjusted upwards during the year, was achieved at the upper end. In the reporting currency, the Euro, this
corresponds to an increase in sales of 14.0% from approximately €3.6 billion in the previous year to
approximately €4.1 billion in 2017.
Despite ongoing negative currency effects, the gross profit margin improved in 2017 by 160 basis points
to 47.3% because PUMA was able to compensate for more than the negative effects of the weakness of
individual currencies against the US Dollar due to improvements in sourcing, higher sales with new products
with a higher margin, a higher share of own retail sales, and selective price adjustments. Other operating
income and expenses increased in 2017 by only 11.7%. In terms of sales, this represents a decline in the
cost ratio from 42.6% to 41.7%, and reflects the operating leverage achieved. Overall, both the increase
in sales, the improvement of the gross profit margin and the only moderate growth of other operating
income and expenses in comparison to sales significantly contributed to the increase in the operating result
(EBIT) in financial year 2017.
The operating result increased in 2017 by 91.7% from €127.6 million to €244.6 million and was therefore
considerably above the forecast from the previous Annual Report which had originally forecast an operating
result within a range of €170 million and €190 million. Due to this better-than-expected business
development, the forecast for the 2017 operating result saw an upwards increase several times throughout
the year. The adjusted forecast of an operating result within a range of between €235 million and €245
million could be achieved at the upper end.

5
The considerable increase in profitability in 2017 is also reflected in the development of net earnings and
earnings per share, each of which more than doubled. Net earnings increased in 2017 by 117.7% to €135.8
million (previous year: €62.4 million), and the earnings per share increased accordingly from €4.17 in the
previous year to €9.09.
Due to the very successful business development in 2017 with a considerable increase in profitability and
free cash flow, the Managing Directors and the Administrative Board will propose to the Annual General
Meeting on Thursday, April 12, 2018 to distribute a one-off dividend of €12.50 per share for 2017
(previous year: regular dividend €0.75).
The PUMA share developed very positively in 2017 and was listed at year-end at €363,00, a 45.5% increase
over the share price at the end of the previous year (€249.65). This means that PUMA Group market
capitalization has risen to around €5.4 billion (previous year: €3.7 billion).

6
PUMA Group Essential Information
Commercial Activities and Organizational Structure
The company operates as European corporation, PUMA SE, with Group headquarters in Herzogenaurach,
Germany. Our internal reporting activities are based according to three regions (EMEA, the Americas and
Asia/Pacific) and three product segments (footwear, apparel, and accessories). A detailed description of
the various segments can be found in paragraph 25 of the Notes to the Consolidated Financial Statements.
Our revenues are derived from the sale of products from the PUMA and Cobra Golf brands via the wholesale
and retail trade, as well as from sales in our own retail and online stores. We market and distribute our
products worldwide primarily via our own subsidiaries. There are distribution agreements in place with
independent distributors in some countries.
As of December 31, 2017, 108 subsidiaries were controlled directly or indirectly by PUMA SE. Our
subsidiaries carry out various tasks at the local level, such as sales, marketing, product development,
sourcing and management. A full list of all subsidiaries and an affiliated company can be found in paragraph
2 of the Notes to the Consolidated Financial Statements.

7
Targets and Strategy
PUMA aims to become the fastest sports brand in the world. For this reason, PUMA has been executing a
turnaround strategy over the past few years, which is focused on five priorities: brand heat, a competitive
product range, a leading offer for women, improved distribution quality and organizational speed. Positive
feedback from retail partners around the world, better sell-through as well as improved financial results in
2017 confirm that PUMA is on the right track.
PUMA’s brand draws strength and brand heat from its unique heritage in sports and its high credibility in
the latest Lifestyle trends. The brand is associated with some of the greatest sports legends: Pelé,
Maradona, Tommie Smith, Boris Becker, Lothar Matthäus, Linford Christie, and many more. Today PUMA
continues to strengthen its position as a sports brand through partnerships with some of the most elite
ambassadors: the world’s fastest man and athletics legend Usain Bolt, star striker Antoine Griezmann, golf
stars Lexi Thompson and Rickie Fowler, Arsenal FC, Borussia Dortmund and the Jamaican and Cuban
Olympic Federations. PUMA has also developed a unique way of working with cultural and fashion icons to
connect with young trend-setting audiences. This has made PUMA one of the hottest sports and fashion
brands for young consumers. The partnership that PUMA entered into with Rihanna in 2014 defined a new
way for cultural influencers and brands to interact. In recent times, PUMA has been capitalizing on this
success and has partnered with other global stars such as model Cara Delevingne, artists The Weeknd and
Big Sean and most recently Lewis Hamilton and Selena Gomez.
Also on the product side, PUMA looks back at a unique history full of innovations, designs and products
that continue to influence the sports and sports lifestyle industries to date. This includes the Brush Spikes
shoe from 1968, the lightest ever football shoe (EvoSpeed SL 2015) and the first ever co-lab of a sports
brand with a fashion designer (PUMA x Jil Sander, 1997). One of PUMA’s greatest design icons, the SUEDE
will celebrate its 50th anniversary in 2018. Today, PUMA continues to sharpen its design principles and is
introducing some of the industry’s most eye-catching but also commercial styles such as the FIERCE, the
CREEPER, the TSUGI and the Basket HEART, some of its bestsellers in 2017. For PUMA, innovation is at
the heart of product design. PUMA’s proprietary midsole material IGNITE achieves the highest energy
return of all running shoes. The individual lacing system NETFIT as well as JAMMING, the first ever midsole
made of freely moving eTPU pearls, are two of the most recent examples.
Women are a priority for PUMA. Not only are women increasingly participating in athletic activities
worldwide, but they are also trendsetters in taking inspiration from athletic wear for their everyday
wardrobe. Building on PUMA’s fashion credibility and sports authenticity, as well as a profound
understanding of the modern female athletic consumer, PUMA has positioned its offer for women “where
the gym meets the runway.” The women’s business has further strengthened the brand in 2017 and clearly
outgrown other product segments. With its overproportionate market share among women, PUMA is
uniquely positioned to capitalize on this growing segment within the global sportswear market. In 2017,
PUMA continued with its “DO YOU” campaign, strengthening its commitment to inspire women everywhere
to stay true to themselves, featuring Cara Delevingne, the dancers of the New York City Ballet and many

8
other inspirational women. With the PHENOM, launched with Selena Gomez toward the end of the year,
PUMA laid the foundations for another women’s footwear bestseller in 2018.
PUMA has continuously improved the quality of its distribution and expanded its presence in key sports
performance and Sportstyle accounts around the world. PUMA remains dedicated to strengthening its
relationships with key retailers by being a reliable partner for them and by maximizing PUMA’s contribution
to their business. It is a clear objective for PUMA that retail partners make money with our products.
Improved sell-through has been helping PUMA to gain more shelf space in our partners retail stores in
2017. Furthermore, PUMA continued to upgrade its owned-and-operated retail store network with further
openings and refurbishments. PUMA also worked on the relaunch of its eCommerce presence ‘puma.com’
into a more modern and mobile-friendly format, which initially went live in Europe in June last year.
Operationally, PUMA continued to make progress in key areas including further enhancements of PUMA’s
International Trading Organization, which manages global order and invoice flows centrally, the roll-out of
a new product development system, further standardization of ERP systems and improvements to the
overall IT infrastructure. In 2017, for example, a self-developed integrated product development system
was introduced to replace existing individual solutions. This simplified and accelerated cross-departmental
collaboration between design, product development and product management as well as sourcing, while
increasing flexibility.
In addition to these five priorities, social, economic and environmental sustainability remains a core value
for PUMA. In 2017, PUMA expanded its strategic partnership with the Better Work Program of the
International Finance Corporation (IFC) and the International Labor Organization (ILO). The program,
whose aim is to limit audit fatigue and promote long-term solutions to problems surrounding fair labor
standards, now involves 76 active PUMA suppliers in Vietnam, Cambodia, Indonesia and Bangladesh.
PUMA’s partnership with IFC was further enhanced with the start of the implementation phase of the
Vietnam Improvement Program (VIP), which aims to improve energy efficiency and the use of renewable
energy in the apparel and footwear supply chain. Several major industry peers joined the VIP program
together with PUMA. This sent a unified message to often shared suppliers to start working on reducing
their impact on climate change.
The hard work, the dedication to the PUMA brand and the consistent focus on implementing the “Forever
Faster” corporate strategy contributed significantly to the very positive business development in 2017. This
development confirms PUMA’s commitment to reaffirming its strategic goals and continuing its dedication
to becoming the fastest sports brand in the world.

9
Product Development and Design
Designing, developing, selling and marketing footwear, apparel and accessories, PUMA is one of the world’s
leading sports brands. Since 1948, PUMA has been producing the most innovative products for the fastest
athletes on the planet. The brand has established a reputation for fast and innovative product designs in
its Performance categories such as Football, Running and Training, Golf and Motorsports. In addition, PUMA
offers a Sportstyle range of innovative performance and sports-inspired products as well as classic
silhouettes. With its Sportstyle designs PUMA reaches out to women and men alike who seek authentic
style rooted in sports.
In line with our mission statement Forever Faster, we aim at giving athletes the necessary advantage
to reach their full potential and express themselves through their own style of play. Their equipment should
enable them to reach their full potential. That’s why PUMA is constantly working on innovative technologies
and developing new products that meet the high demands of our top athletes and consumers alike. The
PUMA brand is driven by four values: brave, confident, determined and joyful. These values motivate us to
grow beyond ourselves and to be credible and authentic with our know-how and sporting history as a brand
and also with our products, thus enabling us to experience appreciation.
For us, sport is lifestyle. We believe in the fusion of sport and style, aiming to make our products desirable
through their ability to meet both performance and stylistic needs. The design of our products involves
tenacious attention to what lies ahead while being guided by the consistent visual language, reflecting the
most defining moments of the PUMA legacy. To achieve this, PUMA’s Global Creative Director, Torsten
Hochstetter and his design teams ensure a coherent design language for all our collections, organizing the
product responsibility within our global business units and regional design centers.
In 2017, we further improved our product offering, focusing on our design clarity with clear seasonal
creative directions, while introducing innovative technologies and more commercial products. The improved
financial results and sell-through performance along with the continued positive response of our retail
partners and customers demonstrate that PUMA is on the right path.
A major highlight of 2017 was the introduction of PUMA’s new, uniquely customizable lacing system NETFIT,
a technology that offers infinite performance and style options. NETFIT shoes were first spotted at the
IAAF World Championships in London, where they were worn by our world class athletes. The NETFIT
technology allows runners to fully adapt to their individual needs based on foot shape and running style.
At the same time, it allows its consumers to express their individual style through various lacing techniques.
NETFIT has been extended into the Sportstyle category as well as our football shoes 365 NETFIT and
FUTURE.
In the Teamsport category we introduced two completely new football boots. PUMA ONE suits all aspects
a player needs - FIT, FAST and FEEL. Under the mantra ‘Play Perfect’ we have combined the best and
latest technologies to support technical players with the ideal equipment. PUMA FUTURE, which will hit

10
stores in early 2018, is designed for those players that change the game in an instant, those that play with
instinct, and invent play on the pitch. It is first football boot with a truly customizable fit thanks to our
proprietary NETFIT technology.
With our “Run The Streets” concept, we have offered products that cross the line between performance
and style. We launched the IGNITE EVOKNIT, IGNITE Limitless and the new Sportstyle franchise TSUGI.
All of them feature PUMA’s proprietary IGNITE midsole technology, but at the same time they have a
progressive fresh look inspired by urban culture and street style.
In our Women’s category, we have continued our successful “DO YOU” campaign around celebrities such
as Cara Delevingne, the New York City Ballet and Selena Gomez by introducing new feminine styles. Basket
HEART, a classic silhouette with a unique feminine touch was one of the best-selling shoes of the year and
a big driver behind our women’s footwear business. New footwear styles for 2018 such as MUSE and
PHENOM began hitting stores late last year with promising early results. One highlight on the women’s
apparel side was the “Velvet Rope” collection, which featured tech-infused Sportstyle and Training pieces
for women with the perfect mixture of performance and luxury, sport and fashion.
The much-hyped “FENTY PUMA by Rihanna” line returned with two new seasonal collections, which were
celebrated by the global fashion crowd. Once again, FENTY PUMA by RIHANNA made waves and fused
luxury and sport in a way that only Rihanna and PUMA can. At the Paris Fashion Week, PUMA’s women’s
Creative Director presented “FENTY University” – a rebellious and daring collection for Autumn-Winter ‘17,
paying homage to the kids gone rogue, who hit honor roll and serve detention in style. While for her Spring-
Summer ‘18 collection, presented in New York, Rihanna continued to play with gender-fluid silhouettes and
oversized shapes paired with sexy bodycon styles. The very successful FENTY CREEPER was released in
new styles and colorways, while the FENTY PUMA BOW was searched for on the internet every seven
seconds in March, making it the most wanted sneaker of 2017.
Research and product development at PUMA mainly comprises the areas of innovation (new technologies),
product design and model and collection development. The research and product development activities
range from the analysis of scientific studies and customer surveys through the generation of creative ideas
to the implementation of innovations in commercial products. The activities in research and product
development are directly linked to sourcing activities.
As of December 31, 2017, a total of 894 employees were engaged in research and development/ product
management (previous year: 888). Expenses for research and development/ product management totaled
€98.5 million in 2017 (previous year: €93.7 million) of which €53.4 million (previous year: €52.0 million)
were related to research and development.

11
Sourcing
The Sourcing Organization
Sourcing refers to the central management of the purchasing of products for PUMA and the Group’s own
brand, Cobra. All necessary sourcing functions of the Group are merged in PUMA Group Sourcing (PGS).
PUMA International Trading GmbH (PIT), PUMA's globally active trading company which has its head office
in Herzogenaurach (Germany), is the Group company mainly responsible for PUMA Group Sourcing. PIT
coordinates product sourcing from independent manufacturers by sourcing products itself from the
manufacturers and selling them to PUMA distribution subsidiaries or supporting PUMA distribution
subsidiaries directly in the local sourcing of products via local manufacturers. In addition, through its service
companies in Hong Kong, PIT manages cooperation with suppliers worldwide and also oversees the
production processes at the sourcing sites in China, Vietnam, Bangladesh, India, Turkey, South Africa,
Brazil, and Mexico. Hedging is also centralized at PIT. The centralized control of these processes guarantees
a high degree of transparency within the supply chain, reduces sourcing complexity and creates efficiencies
through largely automated processes.
PGS's worldwide production network, which is the main focus of PIT's efforts, helps to optimize the supply
chain by working with independent manufacturers. The aim is to offer an optimum service so as to meet
global requirements for service, quality and safety, along with environmental and social aspects in the
supply chain. Under the six core principles of partnership, transparency, flexibility, speed, simplicity, and
effectiveness, the central sourcing responsibility allows for continuous improvements with regard to
sourcing costs, sourcing flexibility and the necessary delivery reliability. This guarantees distribution
subsidiaries high-level service and a sustainable production and supply chain.
PUMA’s sustainability function (Corporate Sustainability Department, formerly PUMA SAFE) was successfully
integrated into the PGS organization in 2016. This ensures that social and environmental issues and
standards of good corporate governance are integrated into day-to-day sourcing activities. The service
companies in Hong Kong that are managed by PIT are mainly responsible for compliance with PUMA's own
standards and statutory standards.
In 2017, further operating improvements could be implemented in sourcing, in particular with regard to
the centralization and standardization of processes and systems. In this way, PIT has also acted as a central
import company for EU countries since the start of the year, in addition to its tasks previously described.
Sourcing effectiveness could subsequently be further increased. Provided it made sense from an economic
and sustainability perspective, local sourcing was expanded further in some markets, for example in Mexico,
so as to be able to react even more flexibly to market developments. Furthermore, 2017 saw the successful
continuation of the innovative financing program for PUMA suppliers. This program, which was financed by
the World Bank and BNP Paribas, and which has received a number of awards, allows for receivables of
the suppliers from goods delivered to PUMA to be paid more quickly provided they meet the sustainability

12
criteria. As a result, financial scope was created for new investments for suppliers. In addition, the program
for suppliers also acts as a financial incentive for complying with its standards regarding ecology, labor law
and society, as well as continuously improving them.
The Sourcing Markets
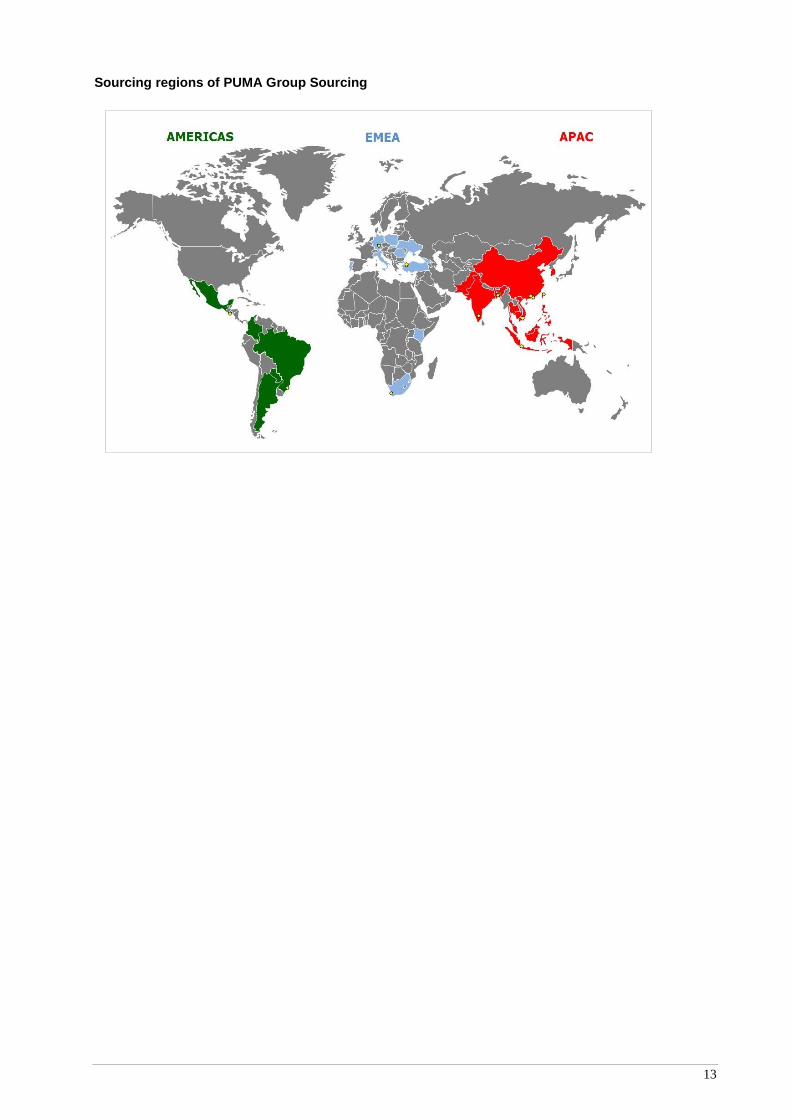
During the financial year 2017, PGS worked with 160 suppliers in 34 countries via PIT. PIT's supplier base
has therefore largely remained stable. The strategic cooperation with long-term partners was one of the
key competitive advantages in 2017, ensuring stable sourcing in continuing turbulent market conditions.
Asia remains the strongest sourcing region overall with 92% of the total volume, followed by Europe with
4%, America with 3%, and Africa with 1%.
As a result, the six most important sourcing countries (89% of the total volume) are all located on the
Asian continent. Once more, Vietnam was the strongest production country with a total of 32%. China
followed at 24%, an increase of 1 percentage point from 2016. Cambodia was in third place at 13%.
Bangladesh, which focuses on apparel, is in fourth place at 10%. Indonesia, which focuses on footwear
production, produces 6% of the total volume and is in fifth place. India is in sixth place at 4%.
Rising wage costs and macroeconomic influences have continued to influence sourcing markets in 2017.
This increases the need to take into account the risks of these factors when allocating production. This is
a crucial component of our sourcing strategy so as to ensure the secure and competitive sourcing of
products and, furthermore, to successfully manage the increasing sourcing volumes due to the positive
company development.
Sourcing Markets 2017 [Quantity]
America EMEA Europe Asia
3% 1% 4% 92%
13
Sourcing regions of PUMA Group Sourcing

14
Employees
Number of employees
The global number of employees on a yearly average was 11,389 employees in 2017 compared to 11,128
in the previous year. The increase mainly results from the higher number of the company’s own retail
stores.
Personnel expenses in 2017 increased overall by 11.4% from €493.1 million to €549.1 million. On average,
personnel expenses were €48.2 thousand compared to €44.3 thousand in the previous year.
As of December 31, 2017, the number of employees was 11,787, compared to 11,495 in the previous
year. This represents a 2.5% increase in the number of employees compared to the previous year. The
development in the number of employees per area is as follows:
5

15
Talent Recruitment and Development
Our employees represent the core of our business. In order to continue to expand our position in the
market, it is essential that we have highly qualified and motivated personnel. Our recruitment strategy
allows for external talent to be recruited in advance, appropriate to the target group, via various channels,
including in particular through proactive direct conversations, thereby boosting our workforce.
This year we introduced “Workday”, one of the leading human capital management systems, across the
world. This software includes all personnel processes and functions such as recruiting, talent, performance
and absence management, time recording, and payroll accounting in the USA and Canada, meaning that
all information relevant to human resources is available on a single platform.
In addition to the performance assessment and time agreement, a systematic succession plan is created
as part of talent management. Talent available in the company is identified in the annual employee
interviews. Our aim is to individually develop our employees, even in an international environment, and at
the same time successfully and sustainably keep them loyal to our company as they are an important factor
for success. As a central component of current competitiveness, long-term loyalty from motivated and
competent employees allows us both as a company and as an employer to maintain a dynamic environment
and to be able to keep up with market changes.
The continuous professional and personal development of our employees also ensures that our workforce
has the necessary skills to ensure steady growth and market expertise. In our efforts to provide adequate
entry-level and development opportunities to talented individuals at all levels, in addition to the range of
different training and dual-track (combined work-study) programs, we also promote the systematic training
of our professionals and managers. The range of training we provided includes a number of training courses
and workshops, both online and offline, and standardized or personally tailored to individual needs. The
continuous development of our PUMA training offers guarantees that our employees have at all times
innovative and diverse opportunities to add to their qualifications, build on existing knowledge and acquire
new skills. This approach helps employees achieve their personal goals and helps the company achieve its
goals as well.
In particular, we also offer a large number of seminars with the aim of developing employees and managers
over the longer term, giving them the opportunity to apply their newly acquired knowledge in practice
between the individual modules and then to discuss this with other seminar participants. Our internal
leadership program, ILP, consisting of several modules was expanded by the ILP2 seminar series.
Management was therefore given new instruments to be able to manage the company better in a world
changing at increasingly greater speed, and to be able to manage its employees in an even more strategic
and effective manner. The topic of "mindful leadership" was of particular focus. Management was made
aware of its own stress patterns and learned mindfulness-based methods to actively combat stress and
construct suitable alternative actions. Learning mindful communication supports clear thinking and being
able to act in a more conscientious fashion.

16
Our new Speed Up2 personnel development program was successfully continued this year. A group of top
talent received intensive preparation for the next step in their careers by taking on interdisciplinary projects
and tasks, target training courses, mentoring, and coaching in addition to job rotations. Increased visibility
to upper management, the creation of cross-function cooperation and establishing a strong network are
also important components of this program.
Compensation
We at PUMA offer our employees a targeted and competitive compensation system, which consists of
several components. In addition to a fixed base salary, the PUMA bonus system, profit-sharing programs
and various social benefits and intangible benefits form part of a performance-based compensation system.
We also offer long-term incentive programs for senior management levels that honor the sustainable
development and performance of the business.

17
Management System
We use a variety of indicators to manage our performance in relation to our top corporate goals. We
have defined growth and profitability as being key targets within finance-related areas. Our focus
therefore is on improving sales, the gross profit margin, and operating income (EBIT). These are the
financial control parameters that are of particular significance. Moreover, we aim to minimize working
capital and improve free cash flow. Our Group’s Planning and Management System has been designed
to provide a variety of instruments in order to assess current business developments and derive future
strategy and investment decisions. This involves the continuous monitoring of key financial indicators within
the PUMA Group along with a monthly comparison with budget targets. Any deviations from the targets
are analyzed in detail and appropriate countermeasures are taken should such deviations have a negative
impact.
Changes in sales revenues are also influenced by currency exchange effects. This is why we also state
any changes in sales in Euro, the reporting currency, adjusted for currency exchange effects in order to
provide information that is relevant to the decision-making process when assessing the revenue position.
Currency-adjusted sales volumes are used for comparison purposes and are based on the values that would
arise if the foreign currencies included in the consolidated financial statements were not translated at the
average rates for the previous reporting year but were instead translated at the corresponding average
rates for the current year. As a result, currency-adjusted figures are not to be regarded as a substitute or
as superior financial indicators, but should instead always be regarded as additional information.
We use the indicator free cash flow in order to determine the change in cash and cash equivalents after
deducting all expenses incurred to maintain or expand the organic business of the PUMA Group. Free cash
flow is calculated from the cash flow from operating activities and investment activities. We also use the
indicator free cash flow before acquisitions, which goes beyond free cash flow and includes an
adjustment for payments that are associated with investments in companies.
We use the indicator working capital to assess the financial position. Working capital is the difference
between other current assets - including in particular inventories and trade receivables - and current
liabilities. Amounts that are received in connection with financing activities are not included in working
capital.
Non-financial performance indicators are of only minor importance at PUMA as control variables.

18
Economic Report
General Economic Conditions
Global Economy
According to the Winter forecast of the Kieler Institut für Weltwirtschaft (ifw Kiel - Kiel Institute for World
Economics) of December 13, 2017 the expansion of the global economy saw an evident acceleration in
2017. The solid upswing is a result of the economy in virtually all the large national economies taking an
upwards trajectory. In this process, GDP growth in advanced economies has reached a high level, but the
economic situation has also considerably improved in emerging countries. Global GDP rose by 3.8% in
2017. Growth therefore amounted to 0.3 percentage points above the previous year’s forecast (2016 Winter
forecast) or 0.2 percentage points over the 2017 Summer forecast. This represents the strongest increase
in global GDP since 2011. The large-scale expansion of foreign trade in Asia and the considerable increase
of investments due to favorable investment conditions was particularly crucial for this global revival.
Sporting goods industry
Increased consumer spending due to greater income, both in emerging countries and in advanced
economies, led to considerable growth in the sporting goods industry in 2017. Among other things, the
increase in health consciousness across the world and the associated rise in sporting activity was crucial
for this development. The trend towards more and more women being active in sports contributed to this
positive performance. Moreover, the global sports fashion trend continued.
With regard to distribution channels, it was observed that the e-commerce business continued to expand
rapidly. Various commercial opportunities, such as mobile technologies and social media were used for this
purpose. Nevertheless, the sporting goods industry faced some challenges in individual markets in 2017,
such as the continued consolidation among retail stores in the United States.
19
Sales
Illustration of Sales Development in 2017 Compared to the Outlook
In the 2016 Annual Report, PUMA forecast a currency-adjusted increase in consolidated sales in the high
single-digit percentage range for the financial year 2017. This forecast was increased several times
throughout the year and PUMA now expects a currency-adjusted sales increase of between 14% and 16%
for financial year 2017. PUMA was able to reach the upper end of the adjusted forecast in 2017, thereby
exceeding the original sales growth target significantly.
More details on sales development are provided below.
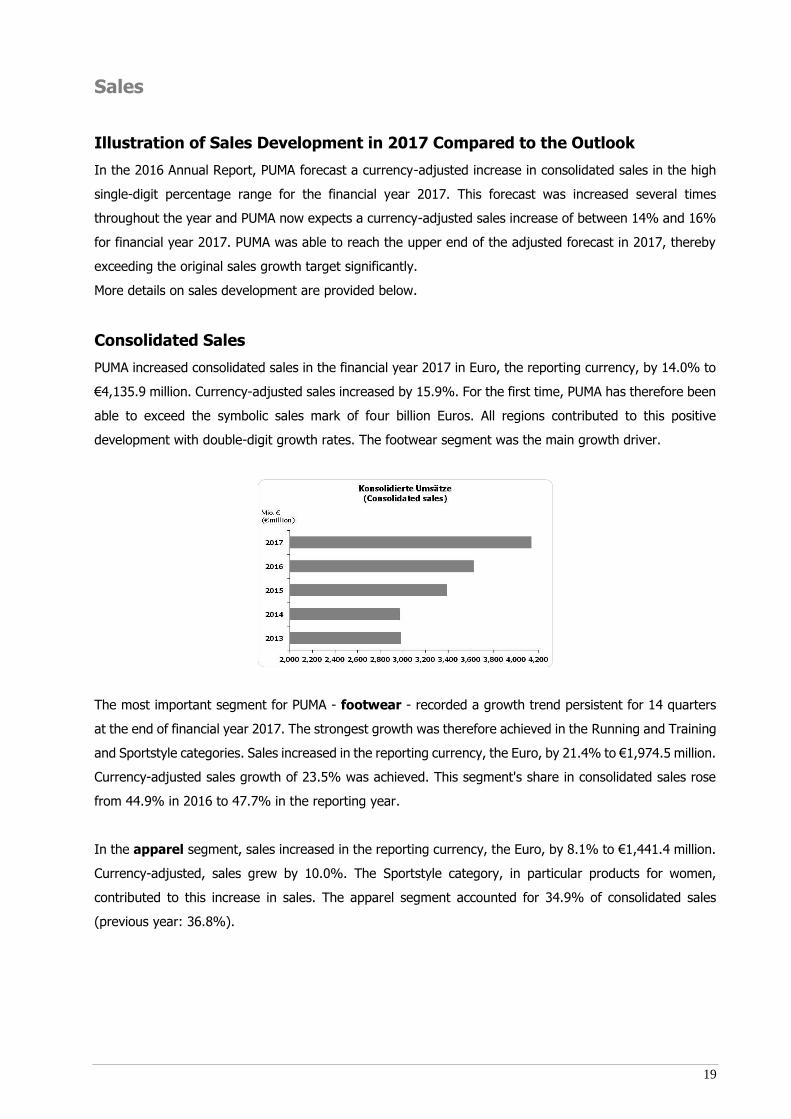
Consolidated Sales
PUMA increased consolidated sales in the financial year 2017 in Euro, the reporting currency, by 14.0% to
€4,135.9 million. Currency-adjusted sales increased by 15.9%. For the first time, PUMA has therefore been
able to exceed the symbolic sales mark of four billion Euros. All regions contributed to this positive
development with double-digit growth rates. The footwear segment was the main growth driver.
The most important segment for PUMA - footwear - recorded a growth trend persistent for 14 quarters
at the end of financial year 2017. The strongest growth was therefore achieved in the Running and Training
and Sportstyle categories. Sales increased in the reporting currency, the Euro, by 21.4% to €1,974.5 million.
Currency-adjusted sales growth of 23.5% was achieved. This segment's share in consolidated sales rose
from 44.9% in 2016 to 47.7% in the reporting year.
In the apparel segment, sales increased in the reporting currency, the Euro, by 8.1% to €1,441.4 million.
Currency-adjusted, sales grew by 10.0%. The Sportstyle category, in particular products for women,
contributed to this increase in sales. The apparel segment accounted for 34.9% of consolidated sales
(previous year: 36.8%).

20
In the accessories segment, sales increased in the reporting currency, the Euro, by 8.0% to €719.9
million. This correspond to a currency-adjusted increase of 9.2%. The increase results from increased sales
in the areas of socks and underwear, while sales of golf clubs remained almost stable in the reporting year.
The share of consolidated sales decreased to 17.4% (previous year: 18.4%).
Retail Businesses
The company's own retail store activities include PUMA stores, factory outlets and online sales, each with
direct sales to our customers (“direct-to-customer business”). In addition to regional availability, they
ensure controlled sales of PUMA products and the presentation of the PUMA brand in an environment
suitable for our market positioning.
The sales of the company’s own retail store activities improved in financial year 2017, currency-adjusted
by 22.9% to €961.0 million. This corresponds to a share of 23.2% of total sales (previous year: 21.9%).
The sales growth was achieved both on a comparable area basis in our own retail stores and through the
targeted expansion of the portfolio of the company's own retail stores. In addition to the opening of
additional retail stores, optimizing the portfolio also included modernizing existing retail stores in line with
the “Forever Faster” store concept. This makes it possible to present PUMA products and related
technologies in an even more attractive environment, and strengthens PUMA's position as a sports brand.
The e-commerce business recorded an above-average strong growth due to the expansion of the product
range in the online stores as well as due to the relaunch of “puma.com” in a more modern and mobile
format. Our sales promotions on special days in the online business such as, for example, on November
11, singles’ day in China and also the biggest online shopping day in the world, known as “black Friday”,
turned out to be particularly successful. In addition, the introduction of our new products and collections,
for example “FENTY PUMA by Rihanna”, resonated extraordinarily with our online customers.

21
Licensing Business
For various product segments, such as fragrances, eyewear, and watches, PUMA issues licenses authorizing
independent partners to design, develop, manufacture, and sell these products. Revenue from license
agreements also includes some sales licenses for various markets.
Licensing sales increased in 2017 in the reporting currency, the Euro, by 8.8% (currency-adjusted by 9.3%)
to €113.5 million. The resulting royalty and commission income was €15.8 million (previous year: €15.7
million).

22
Results of Operations
Income Statement 2017 2016
€ million % € million % +/- %
Sales 4,135.9 100.0% 3,626.7 100.0% 14.0%
Cost of sales -2,181.5 -52.7% -1,970.3 -54.3% 10.7%
Gross profit 1,954.3 47.3% 1,656.4 45.7% 18.0%
Royalty and Commission Income 15.8 0.4% 15.7 0.4% 1.1%
Other Operating Income and Expenses -1,725.6 -41.7% -1,544.5 -42.6% 11.7%
Operating income (EBIT) 244.6 5.9% 127.6 3.5% 91.7%
Financial result/Income from affiliated companies -13.4 -0.3% -8.7 -0.2% 52.8%
Earnings before taxes (EBT) 231.2 5.6% 118.9 3.3% 94.5%
Income taxes -63.3 -1.5% -30.5 -0.8% 107.4%
Tax rate -27.4% -25.7%
Net Earnings Attributable to Non-controlling Interests -32.2 -0.8% -26.0 -0.7% 23.7%
Consolidated Net Earnings 135.8 3.3% 62.4 1.7% 117.7%
Weighted average shares outstanding 14.943 14.940 0.0%
Weighted average shares outstanding, diluted 14.943 14.940 0.0%
Earnings per share in € 9.09 4.17 117.7%
Earnings per share, diluted in € 9.09 4.17 117.7%
Illustration of Earnings Development in 2017 Compared to the Outlook
In the outlook of the 2016 Annual Report, PUMA forecasted a slight improvement in the gross profit margin
to around 46.0% for financial year 2017. PUMA expected an increase in a mid-to-high single-digit
percentage rate for other operating income and expenses. The forecast for the operating income (EBIT)
was within a range of between €170 million and €190 million. Furthermore, a significant improvement in
consolidated net earnings was expected.
These forecasts were increased several times throughout the year due to the better-than-expected business
development, and PUMA now expects an improvement in the gross profit margin to approximately 46.5%,
an increase in other operating income and expenses in the low double-digit percentage area and an
operating result (EBIT) within a range of between €235 million and €245 million. In accordance with
previous forecasts, management continued to expect a significant improvement in consolidated net
earnings in 2017.
PUMA was able to fully reach the increased forecasts in 2017, and even slightly exceed them with regard
to the gross profit margin. As a result, PUMA was able to considerably exceed the improvement in operating
income and in operating margin that were the original target for 2017.
More details on earnings development are provided below.

23
Gross Profit Margin
In the financial year 2017, gross profit increased by 18.0% from €1,656.4 million to €1,954.3 million.
The gross profit margin increased by 160 base points from 45.7% to 47.3%, as PUMA was able to more
than compensate for the negative currency exchange effects based on the weakness of individual currencies
against the US Dollar through improvements in sourcing, higher sales of new products with higher margins,
a higher share of its own retail store sales and selective price adjustments.
The gross profit margin in the footwear segment increased considerably from 42.5% in the previous year
to 45.5%. The apparel gross profit margin increased from 48.4% to 49.0% and in accessories it increased
from 47.9% to 48.5%.
Other Operating Income and Expenses
The consistent focus on the strict monitoring of other operating income and expenses continued to be top
priority for PUMA in financial year 2017.
Nevertheless, further investment was made in a targeted manner in marketing so as to increase PUMA’s
brand heat and to position PUMA as the fastest sports brand in the world. Likewise, there was continued
investment in modernizing the company’s own retail stores. The opening of new retail stores contributed
to the increase in other operating income and expenses. Furthermore, progress was made in modernizing
our IT infrastructure.
Other operating income and expenses increased in financial year 2017 by 11.7% from €1,544.5 million to
€1,725.6 million. In percent of sales, the cost ratio improved from 42.6% to 41.7%. The decline in the cost
ratio reflects the operating leverage achieved and significantly contributes to the increase in operating
result.

24
Within the distribution expenses, there was an increase in expenses for marketing/retail by 12.4% from
€732.3 million to €822.9 million. This development is primarily in connection with the consistent
implementation of the “Forever Faster” brand campaign and the increased number of the company’s own
retail stores. Due to the strong sales growth, the cost ratio nevertheless reduced from 20.2% to 19.9%.
Other sales and distribution expenses stood at €497.5 million, an increase of 10.5%. The expense ratio
decreased from 12.4% to 12.0%.
Expenditure for research and development/ product management increased overall by 5.1% to €98.5
million in 2017 (previous year: €93.7 million). The cost ratio reduced slightly to 2.4% (previous year: 2.6%).
Other operating income reduced from €0.9 million in the previous year to €0.3 million in 2017.
The administration and general expenses increase by 14.0% from €269.3 million to €307.0 million. The
increase resulted inter alia from higher expenses for warehouses and IT. The cost ratio of administration
and general expenses was unchanged at 7.4%.
Depreciation/ amortization totaling €70.3 million (previous year: €59.9 million) is included under the
respective cost items. This represents a 17.5% increase in depreciation/ amortization compared to the
previous year.
Operating income (EBIT)
The operating result improved in 2017 by 91.7% from €127.6 million to €244.6 million. This result is at the
upper end of the adjusted EBIT forecast (range of between €235 million and €245 million).
The operating margin therefore considerably improved from 3.5% in 2016 to 5.9% in the reporting year.
This is mainly due to the sales growth in connection with a moderate increase in other operating income
and expenses and the simultaneous improvement of the gross profit margin.

25
Financial Result
The financial result reduced in 2017 from €-8.7 million to €-13.4 million, with almost stable financial income
of €10.3 million (previous year: €10.5 million) and almost unchanged expenses from currency conversion
differences from €6.9 million (previous year: €6.4 million). Interest rate expenses increased in the financial
year due to the increased financing expenses in connection with currency hedging contracts from €13.4
million to €17.8 million. The result from the associated company Wilderness Holdings Ltd., which also flows
into the financial result, increased in financial year 2017 to €1.6 million (previous year: €1.2 million).
Earnings before taxes (EBT)
In the financial year 2017, PUMA generated earnings before taxes of €231.2 million, an improvement of
94.5% from the previous year (€118.9 million). Tax expenses were €63.3 million compared to €30.5 million
in the previous year, and the tax ratio increased slightly from 25.7% to 27.4% in 2017.
Net Earnings Attributable to Non-controlling Interests
Earnings attributed to non-controlling interests are based on our joint ventures in the North American
market and increased in 2017 by 23.7% to €32.2 million (previous year: €26.0 million). These companies
concern Janed, which distributes socks and bodywear, PUMA Accessories North America and PUMA Kids
Apparel that focuses on selling clothing for children.
Consolidated Net Earnings
Consolidated net earnings more than doubled in financial year 2017 and increased by 117.7% from €62.4
million to €135.8 million. Strong sales growth in connection with the moderate increase in other operating
income and expenses with the simultaneous improvement of the gross profit margin were in particular
crucial for the considerable improvement. In contrast, the financial result declined and there was a slight
increase in the tax ratio.
Earnings per share as well as diluted earnings per share increased accordingly by 117.7% to €9.09 in
comparison to €4.17 in the previous year.

26
Dividends
The Managing Directors and the Administrative Board will propose to the Annual General Meeting on
Thursday, April 12, 2018 to distribute a one-off dividend of €12.50 per share from PUMA SE’s retained
earnings for financial year 2017 (previous year: regular dividend €0.75). The dividends will be distributed
in the days following the Annual General Meeting at which the resolution on the distribution is adopted.

27
Regional Development
Consolidated sales increased in 2017, currency-adjusted by 15.9%. All regions contributed to this
development with double-digit growth rates.
Growth momentum was particularly high in the EMEA region. Sales increased in the reporting currency,
the Euro, by 19.1% to €1,646.2 million. This correspond to a currency-adjusted increase of 19.5%.
Particularly strong momentum came from France, the DACH region (Germany, Austria, and Switzerland)
and the UK which recorded double-digit sales growth. Moreover, Russia and South Africa also developed
very positively with double-digit sales growth. The EMEA region accounted for 39.8% of consolidated sales
in comparison to 38.1% in the previous year.
In the product segments sales of footwear recorded a currency-adjusted increase by 34.8%. Sales of
apparel increased, currency-adjusted by 8.2%, and a sales increase of 10.4%, currency-adjusted, could be
achieved in accessories.
Sales in the Americas region increased in the reporting currency, the Euro, by 11.6% to €1,494.8 million.
Currency-adjusted, sales increased by 14.3% where both North and Latin America contributed to the sale
increase with double-digit growth rates. The share of the Americas region in Group sales reduced slightly
from 36.9% in the previous year to 36.1% in 2017.
Looking at the product segments, both Footwear (currency-adjusted +17.6%), Apparel (+11.2%), as well
as Accessories (+11.0%) showed very strong double-digit growth.

28
In the Asia/Pacific region, sales rose in the reporting currency, the Euro, by 10.0% to €994.9 million.
The currency-adjusted sales increase was 12.7%. The main driver of growth in the region was in particular
China followed by Australia, which each recorded double-digit growth rates. In contrast, sales in Japan
declined slightly compared to the previous year. The share of the Asia/Pacific region in Group sales reduced
slightly from 24.9% in the previous year to 24.1% in 2017.
In relation to the product segments, the footwear segment was able to continue strong growth. Currency-
adjusted footwear sales rose by 17.4%. Currency-adjusted apparel sales were up by 11.1%. In contrast,
Accessories only recorded close to stable sales progression compared to the previous year (currency-
adjusted -0.8%), which is mainly due to sales of golf clubs.

29
Net Assets and Financial Position
Balance Sheet 12/31/2017 12/31/2016
€ million % € million % +/- %
Cash and Cash Equivalents 415.0 14.5% 326.7 11.8% 27.0%
Inventories 778.5 27.3% 718.9 26.0% 8.3%
Trade Receivables 503.7 17.7% 499.2 18.1% 0.9%
Other Current Assets (Working Capital) 164.0 5.7% 141.4 5.1% 15.9%
Other Current Assets 23.6 0.8% 79.2 2.9% -70.2%
Current Assets 1,884.8 66.0% 1,765.4 63.8% 6.8%
Deferred Taxes 207.9 7.3% 229.5 8.3% -9.4%
Other Non-current Assets 761.1 26.7% 770.2 27.9% -1.2%
Non-current Assets 969.0 34.0% 999.7 36.2% -3.1%
Total Assets 2,853.8 100.0% 2,765.1 100.0% 3.2%
Current Financial Liabilities 29.0 1.0% 25.3 0.9% 14.5%
Trade liabilities 646.1 22.6% 580.6 21.0% 11.3%
Other Current Liabilities (Working Capital) 306.1 10.7% 242.3 8.8% 26.3%
Other Current Liabilities 75.2 2.6% 46.6 1.7% 61.3%
Current Liabilities 1,056.5 37.0% 894.9 32.4% 18.1%
Deferred Taxes 37.6 1.3% 63.1 2.3% -40.4%
Pension Provisions 29.7 1.0% 31.6 1.1% -5.8%
Other Non-current Liabilities 73.3 2.6% 53.3 1.9% 37.6%
Non-current Liabilities 140.7 4.9% 148.0 5.4% -4.9%
Equity 1,656.7 58.1% 1,722.2 62.3% -3.8%
Total Liabilities and Shareholders' Equity 2,853.8 100.0% 2,765.1 100.0% 3.2%
Working Capital 493.9 536.6 -7.9%
- in % of consolidated sales 11.9% 14.8%
Equity Ratio
PUMA continues to have an extremely solid capital base. Total assets increased as at December 31, 2017,
by 3.2% from €2,765.1 million to €2,853.8 million. As equity reduced by 3.8% from €1,722.2 million to
€1,656.7 million due to negative effects from currency conversion which are directly recorded in the other
comprehensive income and therefore in equity, this resulted in a reduction of the equity ratio by 4.2
percentage points from 62.3% to 58.1%.

30
Working Capital
Our continued focus on working capital management and currency exchange effects led to a reduction in
the working capital by 7.9% to €493.9 million. In order to ensure the availability of products, even with
increased demand, and to cover the increased need for products due to new retail stores, inventories
increased compared to the previous year by 8.3% from €718.9 million to €778.5 million. Trade receivables
increased slightly by 0.9% from €499.2 million to €503.7 million. Trade liabilities increased by 11.3% and
amounted to €646.1 million as at December 31, 2017, compared to €580.6 million in the previous year.
Other Assets and Other Liabilities
Other current assets, which include the positive market value of derivative financial instruments, decreased
compared to the previous year by 70.2% to €23.6 million.
Other non-current assets, consisting mainly of intangible assets and property, plant and equipment,
remained broadly stable at €761.1 million.
Other current liabilities, which include the negative market value of derivative financial instruments,
increased compared to the previous year from €46.6 million to €75.2 million.
Pension provisions reduced slightly in 2017 by 5.8% to €29.7 million.
Other non-current liabilities increased compared to the previous year by 37.6% to €73.3 million. The
increase is connected with the long-term loan to expand the building at the Herzogenaurach location.

31
Cash Flow
Cash flow statement 2017 2016
€ million € million +/- %
Earnings before taxes (EBT) 231.2 118.9 94.5%
Financial result and non cash effected expenses and income 99.7 64.1 55.6%
Gross cash flow 330.9 182.9 80.9%
Change in current assets, net -50.6 -0.2 -
Tax, Interest, and Dividend Payments -53.1 -51.6 2.9%
Net cash from operating activities 227.2 131.1 73.3%
Payment for acquisition of shareholdings 0.0 -6.8 -
Payments for investing in fixed assets -122.9 -84.3 45.7%
Other investing activities 12.7 9.8 29.3%
Net cash used in investing activities -110.3 -81.4 35.5%
Free cash flow 116.9 49.7 135.2%
Free cash flow (before acquisitions) 116.9 56.5 106.8%
- in % of consolidated sales 2.8% 1.6% -
Net cash used in financing activities -23.4 -61.1 -
Effect of exchange rate on cash -5.3 -0.7 -
Change in cash and cash equivalents 88.3 -12.1 -
Cash and cash equivalents at beginning of the financial year 326.7 338.8 -3.6%
Cash and cash equivalents at the end of the financial year 415.0 326.7 27.0%
Gross cash flow improved in financial year 2017 due to the higher pre-tax profit by 80.9% from €182.9
million to €330.9 million. The financial result and non-cash effected expenses and income, which in
particular include depreciation and amortization of property, plant, and equipment, amounted to €99.7
million in 2017.

32
The focus on working capital management significantly contributed to the improvement of cash flow from
operating business activity. In financial year 2017, net cash from operating activities increased from €131.1
million in the previous year to €227.2 million. The considerable improvement is due to the higher pre-tax
profit as well as due to the decline of net working capital* in 2017. By contrast, the cash outflow from tax,
interest, and dividend payments increased by 2.9% to €53.1 million.
The cash outflow from investing activities increased in the reporting year by 35.5% from €81.4 million to
€110.3 million. Investment in fixed assets mainly involved investment in the company’s own retail stores,
IT infrastructure, and the expansion of the building in Herzogenaurach in financial year 2017. Investments
increased from €84.3 million in the previous year to €122.9 million. Other investing activities are associated
with incoming payments from disposals of assets.
The free cash flow before acquisitions is the balance of the cash inflows and outflows from current operating
and investing activities. Furthermore, an adjustment for payments in association with acquisitions is made.
As a result of the higher pre-tax profit and the improvement of the cash flow from working capital, free
cash flow before acquisitions improved by 106.8% from €56.5 million to €116.9 million. In percent of
consolidated sales, free cash flow before acquisitions amounted to 2.8% compared to 1.6% in the previous
year.
________________________________________________________________________________________________________
* Net working capital includes normal working capital line items plus current assets and liabilities, which
are not normally part of the working capital calculation.

33
Cash flow from financing activities for financial year 2017 mainly resulted from dividend payments to PUMA
SE shareholders of €11.2 million and dividend payments to non-controlling interests of €13.4 million. Net
cash used in financing activities totaled €23.4 million (previous year: cash outflow of €61.1 million).
As of December 31, 2017, PUMA had cash and cash equivalents of €415.0 million, an increase in cash and
cash equivalents of 27.0% compared to the previous year (€326.7 million). The PUMA Group also had
credit facilities totaling €497.1 million as of December 31, 2017 (previous year: €487.6 million). Unutilized
credit lines totaled €440.2 million on the reporting date, compared to €433.1 million in the previous year.

34
Managing Director’s Statement regarding the Business
Development and the Overall Situation of the PUMA Group
We are extremely satisfied with the course of business and economic development in the last financial year.
In 2017 sales and profitability have developed significantly better than originally expected. As a result, our
forecast for financial year 2017 saw an upwards increase several times throughout the year. At the end of
2017, the increased financial targets were fully achieved and were even slightly exceeded with regard to
the development of the gross profit margin. This success gives us confirmation that we are on the right
path with the consistent implementation of the “Forever Faster” company strategy.
The strong sales growth in 2017 (currency-adjusted +15.9%) led to PUMA being able to exceed the
symbolic sales mark of four billion Euros for the first time in the company’s history. This meant that the
sale of our products in our own retail stores and to our wholesale customers continued to improve. In our
opinion, this is attributable above all to the increase in our brand heat and the improvement of our product
range. With a view to profitability in 2017, we also improved significantly and achieved a considerable
improvement in the operating result (EBIT), consolidated net earnings and the earnings per share. The
operating result increased in the past financial year due to increased sales and thanks to the improved
gross profit margin, as well as the improved operating leverage, by 91.7% from €127.6 million to €244.6
million. Consolidated net earnings and earnings per share more than doubled in 2017.
With regard to the consolidated balance sheet, we believe that PUMA has continued to have an extremely
solid capital base (equity of approximately €1.7 billion, equity ratio 58.1%). Furthermore, the ongoing focus
on working capital management contributed to the fact that working capital reduced by 7.9% compared to
the previous year despite the significant increase in sales.
The improvement of the income situation and focus on working capital also led to a considerable
improvement in cash flow in the past financial year. Free cash flow before acquisitions more than doubled
from €56.5 million in the previous year to €116.9 million. Cash and cash equivalents amount to €415.0
million on the reporting date.
As a result, the PUMA group is characterized by an overall solid asset, financial, and income situation at
the time the Group management report was prepared. This enables us and the Administrative Board to
propose a one-off dividend of €12.50 per share for financial year 2017 (previous year: regular dividend
€0.75 per share) to the Annual General Meeting on Thursday, April 12, 2018.

35
Comments on the German GAAP Financial Statements
of PUMA SE
PUMA SE’s financial statements have been prepared pursuant to the rules of the German
Handelsgesetzbuch (HGB - German Commercial Code).
PUMA SE is the parent company of the PUMA Group. PUMA SE's results are significantly influenced by the
directly and indirectly held subsidiaries and shareholdings. The business development of PUMA SE is
essentially subject to the same risks and opportunities as the PUMA Group.
PUMA SE is responsible for wholesale business in the DACH region, consisting of the home market of
Germany, Austria, and Switzerland. Furthermore, PUMA SE is also responsible for managing global
distributors in the area of motorsport, the pan-European distribution for individual key accounts and
sourcing products from European production companies as well as global licensing management. In
addition, PUMA SE acts as a holding company within the PUMA Group and is as such responsible for
international product development, marketing, and the areas of finance, operations and PUMA’s strategic
direction.
Results of Operations
Profit and Loss Statement (German GAAP, HGB) 2017 2016
€ million % € million % +/- %
Net Sales 629.2 100.0% 540.3 100.0% 16.4%
Other Operating Income 60.7 9.6% 57.4 10.6% 5.7%
Material Expenses -201.9 -32.1% -154.5 -28.6% 30.7%
Personnel Expenses -105.5 -16.8% -86.1 -15.9% 22.5%
Depreciation -15.8 -2.5% -14.1 -2.6% 12.6%
Other Operating Expenses -507.8 -80.7% -406.1 -75.2% 25.0%
Total Expenses -831.0 -132.1% -660.8 -122.3% 25.8%
Financial Result 279.1 44.4% 145.3 26.9% 92.1%
Income Before Tax 137.9 21.9% 82.2 15.2% 67.8%
Income Tax -9.3 -1.5% -3.5 -0.6% 164.8%
Net Income 128.7 20.4% 78.7 14.6% 63.5%

36
Sales (including royalties and commission income) overall increased in financial year 2017 by 16.4% to
€629.2 million. The increase was a result of increased sales in the DACH region, strong sales growth in
individual regions, and higher royalties and commission income. Product sales in the DACH region increased
by 24.1% to €227.4 million. At the same time, product sales in the other regions increased to €73.2 million.
Subsequently, PUMA SE sales from the sale of products increased overall by 34.2% to €300.6 million. The
royalties and commission income included in sales increased by 3.0% to €289.7 million, and other sales
increased by 11.1% to €38.8 million.
Other operating income amounted in 2017 to €60.7 million (previous year: €57.4 million) and in
particular includes realized and unrealized income from currency conversion with regard to the reporting
date valuation of receivables and payables in foreign currencies.
The total expenditure from material expenses, personnel expenses, depreciations/amortizations and
other operating expenses increased compared to the previous year by 25.8% to €831.0 million (2016: total
€660.8 million). The increase in material expenses was associated with the increase in sales. Personnel
expenses increased among other things due to the increased number of employees. Other operating
expenses increased due to targeted further investment in marketing.
The financial result increased compared to the previous year by 92.1% to €279.1 million. The cause for
the increase was higher income from profit transfer agreements and decreasing expenses from loss
absorption. In addition, write-ups on financial investments were made in 2017 which contrast the
depreciations/amortizations on financial investments in the previous year.
The income before tax increased by 67.8% from €82.2 million to €137.9 million. Expenses for income
taxes increased from €3.5 million to €9.3 million. Net income amounted to €128.7 million compared to
€78.7 million in the previous year.
37
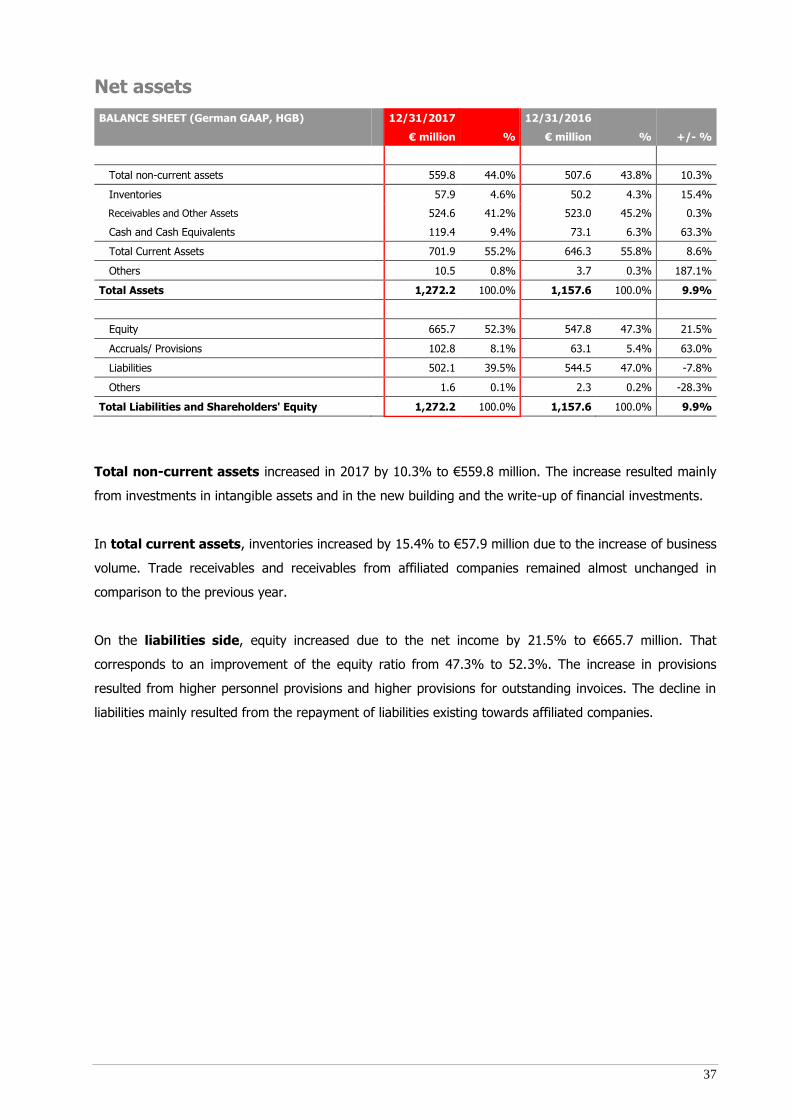
Net assets
BALANCE SHEET (German GAAP, HGB) 12/31/2017 12/31/2016
€ million % € million % +/- %
Total non-current assets 559.8 44.0% 507.6 43.8% 10.3%
Inventories 57.9 4.6% 50.2 4.3% 15.4%
Receivables and Other Assets 524.6 41.2% 523.0 45.2% 0.3%
Cash and Cash Equivalents 119.4 9.4% 73.1 6.3% 63.3%
Total Current Assets 701.9 55.2% 646.3 55.8% 8.6%
Others 10.5 0.8% 3.7 0.3% 187.1%
Total Assets 1,272.2 100.0% 1,157.6 100.0% 9.9%
Equity 665.7 52.3% 547.8 47.3% 21.5%
Accruals/ Provisions 102.8 8.1% 63.1 5.4% 63.0%
Liabilities 502.1 39.5% 544.5 47.0% -7.8%
Others 1.6 0.1% 2.3 0.2% -28.3%
Total Liabilities and Shareholders' Equity 1,272.2 100.0% 1,157.6 100.0% 9.9%
Total non-current assets increased in 2017 by 10.3% to €559.8 million. The increase resulted mainly
from investments in intangible assets and in the new building and the write-up of financial investments.
In total current assets, inventories increased by 15.4% to €57.9 million due to the increase of business
volume. Trade receivables and receivables from affiliated companies remained almost unchanged in
comparison to the previous year.
On the liabilities side, equity increased due to the net income by 21.5% to €665.7 million. That
corresponds to an improvement of the equity ratio from 47.3% to 52.3%. The increase in provisions
resulted from higher personnel provisions and higher provisions for outstanding invoices. The decline in
liabilities mainly resulted from the repayment of liabilities existing towards affiliated companies.

38
Financial position
Cash Flow Statement (German GAAP, HGB) 2017 2016
€ million € million +/- %
Cash flow from operating activities -2.2 -21.3 -
Cash flow from investing activities -68.3 -63.0 8.5%
Free cash flow -70.5 -84.3 -
Cash flow from financing activities 116.8 109.8 6.4%
Change in cash and cash equivalents 46.3 25.5 -
Cash and cash equivalents at beginning of the financial year 73.1 47.6 53.6%
Cash and cash equivalents at year-end 119.4 73.1 63.3%
The positive development of working capital significantly contributed to the improvement of cash flow
from operating business activity. Cash outflow from investing activities increased slightly from
€-63.0 million to €-68.3 million. This resulted in an overall improvement in free cash flow of €-84.3 million
in the previous year to €-70.5 million in 2017.
The cash flow from financing activity showed a cash inflow of €116.8 million in 2017 (previous year:
€109.8 million). The increase compared to the previous year resulted from taking out a loan to finance the
new building.
This led to an overall increase in cash and cash equivalents from €73.1 million to €119.4 million. Moreover,
PUMA SE also has various financing credit lines at its disposal. As at December 31, 2017, the credit lines
amounted to €320.7 million and were not used as at the reporting date.
Outlook
For the financial year 2018 PUMA SE expects a slight increase in net sales and income before tax.
The proposal of a one-off dividend of € 12.50 per share for the financial year 2017 will lead to a significant
reduction in the equity ratio in the financial statements of PUMA SE according to German Commercial Code.

39
Combined non-financial report
Due to the CSR Guideline Implementation Law, PUMA was obligated to submit a non-financial explanation
for the first time in financial year 2017.
Sustainability is an important element in PUMA’s company strategy. Social, economic and, environmental
sustainability have been core values at PUMA for years. Therefore, PUMA publishes its Annual Report each
year on the day of the Annual General Meeting, which contains the sustainability report for the past year,
including the combined non-financial report, in addition to the Combined Management Report and the
Consolidated Financial Statements. Furthermore, important sustainability information can be found on
PUMA's website under the sustainability section (http://about.puma.com/en/sustainability).
PUMA is planning to publish its sustainability report for financial year 2017 on Thursday, April 12, 2018,
the day of PUMA SE’s Annual General Meeting.
Relationships with affiliated companies
At the end of the dependent company report given by the Managing Directors for the financial year 2017,
the following statement was given: “Under the circumstances which were known to the Managing Directors
at the time when the transactions listed in the report on relationships with affiliated companies were made,
PUMA SE received an appropriate consideration in all cases. There were no reportable measures taken or
not taken in the reporting period”.

40
Compensation Report
The Managing Directors
The compensation of the Managing Directors, which is determined by the Administrative Board, consists of
non-performance-based and performance-based components. The non-performance-based components
consist of a fixed salary and non-cash compensation, whereas the performance-based components consist
of bonuses and components with a long-term incentive effect. Along with job assignments and performance
of each individual Managing Director, the criteria for calculating the total remuneration are the economic
situation, long-term strategic planning and related targets, the long-term durability of targeted results and
the company's long-term prospects.
A fixed salary is paid out monthly as non-performance-based basic compensation. In addition, the Managing
Directors receive non-cash compensation, such as company cars, pension contributions and insurance
premiums. In principle, these benefits are granted to all Managing Directors in an equal manner and are
included in the non-performance-based compensation. The fixed compensation for the three Managing
Directors amounted to €2.1 million in the financial year (previous year: €1.9 million). Non-cash
compensation totaled €0.1 million (previous year: €0.1 million).
The bonus component of performance-related compensation is mainly based on the PUMA Group's
operating income (EBIT) and free cash flow and is staggered according to the degree to which targets are
met. In addition, qualitative individual goals are set. An upper limit is also agreed. In the financial year,
variable bonuses came to €3.9 million (previous year: €2.5 million).
Pro-rata provisions totaling €8.4 million (previous year: €2.1 million) were set up for the existing
compensation program (virtual shares/monetary units) with long-term incentives (from the years 2014 to
2017) for Managing Directors in financial year 2017 according to the vesting periods. Under the
performance-based program, 70% of the compensation will be based on the medium-term performance of
PUMA SE’s share and 30% will be based on the medium-term performance of Kering SA’s share in relation
to benchmark companies. Further information on this program can be found in Section 19 of the Notes to
the Consolidated Financial Statements. In addition, a payment of €0.4 million (previous year:
€0.0 million) was made in connection with the Stock Option Program 2012, which expired at the end of
April 2017.

41
Managing Directors have pension commitments as part of deferred compensation, which are paid from the
aforementioned performance-based and/or non-performance-based remuneration for which the company
has taken out reinsurance for pension commitments. The proportion of the pension capital that is already
financed through contributions to the pension liability insurance is deemed to be vested. During the financial
year, €0.4 million was allocated for Managing Directors (previous year: €0.4 million). The present value of
the pension benefits granted to active Managing Directors in the amount of €4.5 million as of December
31, 2017 (previous year: €2.6 million) was offset against the pledged asset value of the pension liability
insurance policy, which was of an equal amount.
There are performance-based pension obligations to former members of the Board of Management and
their widows/widowers amounting to €3.3 million (previous year: €3.5 million), and contribution-based
pension obligations in association with deferred payment from previous members of the Board of
Management and Managing Directors of €10.3 million (previous year: €10.1 million). Both items are
accordingly recognized as liabilities under pension provisions, unless they are offset against asset values of
an equal amount. Pension obligations to former members of the Board of Management and their
widows/widowers amounted to €0.2 million (previous year: €0.2 million).
Administrative Board
In accordance with the Articles of Association, the Administrative Board has at least three members; it
currently consists of six members. The compensation of the Administrative Board is comprised of a fixed
and a performance-based component. The total fixed compensation amounted to €0.3 million (previous
year: €0.3 million).
In accordance with the Articles of Association, each member of the Administrative Board receives a fixed
annual compensation in the amount of €25.0 thousand The fixed compensation is increased by an additional
fixed annual amount of €25.0 thousand for the Chairman of the Administrative Board, €12.5 thousand for
the Vice-Chairman of the Administrative Board, €10.0 thousand for each committee chairman (excluding
the Nominating Committee) and €5.0 thousand for each committee member (excluding the Nominating
Committee).
In addition, each Administrative Board member receives performance-based compensation equal to €20.00
for each €0.01 by which the earnings per share figure exceeds a minimum amount of €16.00 per share.
The performance-based compensation amounts to a maximum of €10.0 thousand per year. The Chairman
of the Administrative Board receives twice this amount (maximum €20.0 thousand) and the Vice Chairman
receives one and a half times this amount (maximum €15.0 thousand) in compensation. Since earnings per
share are below the minimum amount in the financial year, no performance-based compensation will be
paid.

42
Risk and Opportunity Management
Entrepreneurial activities are always associated with uncertainties and risks. This is particularly true for the
fast-paced sports and lifestyle industry in which PUMA operates. Due to the global nature of business in
this industry, PUMA is constantly exposed to risks and opportunities that must be identified and managed.
Here, we need an effective risk and opportunity management through which risks and opportunities can
be systematically recognized and monitored. A risk is defined as one or more future events with unplanned,
negative effects for plans through to the continued existence of the company. Similarly, an opportunity is
defined as one or more events with unplanned, positive consequences for PUMA.
The Managing Directors of PUMA SE have overall responsibility for the risk and opportunity management
system. The “Risk Management Committee” (hereinafter “RMC”) is a management-level committee
responsible for the design and monitoring of the risk and opportunity management system, thereby acting
as the first point of contact for risk report preparation. The task of the operational coordination and
implementation of the Group-wide risk and opportunity management system has been transferred to Group
Internal Audit & GRC (Governance, Risk Management & Compliance). Structured individual interviews (risk
interviews) are conducted regularly across the group (currently twice annually) with executives at the
management level below the Managing Directors (risk owners). The objective of these interviews is to
systematically identify, validate and categorize risks. The Group Internal Audit & GRC department provides
a uniform framework for the assessment of risks. The assessment considers probability of occurrence, the
potential effect, and the control of the risk in question.
The risks identified and assessed during the risk interviews are presented to the RMC in an aggregated
form (the risk heat map). The RMC consists of a fixed group of executives from various corporate divisions,
including the Managing Directors. The position of RMC Chairman is always filled by a Managing Director.
The results of the RMC meetings are reported to the Audit Committee (sub-committee of the Administrative
Board) by the Chair of the RMC and the Head of the Group Internal Audit & GRC department. An integrated
GRC tool used to document the risk management processes is available to the Group Internal Audit & GRC
department and to the risk owners.
PUMA also has a comprehensive reporting and controlling system, which is an essential component of its
risk management approach. PUMA’s reporting and controlling system is based on monthly financial
reporting as well as the review and plausibility reports on reported information issued by Controlling.
Managers analyze opportunities and risks in annual planning discussions around the world, setting targets
and defining courses of action based on the results. The comprehensive reporting system continuously
monitors and generates reports on compliance with the set targets. This enables PUMA to promptly identify
any deviations or negative developments, and to initiate any necessary countermeasures in a timely
manner.

43
Risk and Opportunity Categories
Macroeconomic Developments
As an internationally acting Group, PUMA is exposed to global macroeconomic developments and the
associated risks. For example, economic developments in important sales markets may have an effect on
consumer behavior. This can have positive or negative effects on the planned sales and results. Likewise,
political changes, exchange rate fluctuations, changes to the legal framework, and social developments
may have an effect.
Overall, PUMA manages these challenges with geographic diversification and the development of alternative
scenarios for the possible occurrence of serious events. This applies in particular to political development
and possible change of legal framework conditions which are continuously observed by PUMA.
Brand Image
Brand image and brand desirability are of key importance for PUMA, as consumer behavior can have a
negative effect on the brand as well as a positive one. Accordingly, PUMA has formulated the guiding
principle of “We want to be the fastest sports brand in the world” in order to underline the company’s long-
term direction and strategy. The “Forever Faster” brand promise does not just stand for PUMA’s product
range as a sports company, but also applies to all company processes.
PUMA faces the brand image risks in particular through cooperating with brand ambassadors who embody
the core of the brand and PUMA’s brand values (“courageous”, “confident”, “determined” and “fun-loving”),
and have a large potential for influencing our target group.
For example, we have far-reaching cooperations with Rihanna and The Weekend for the area of sport style
and with the Italian national football team, Arsenal FC and Borussia Dortmund in the area of sport
performance. In 2017, the portfolio was also expanded with internationally important brand ambassadors
like Selena Gomez, Big Sean, and Lewis Hamilton. Furthermore, long-term sponsoring agreements have
been concluded with Borussia Mönchengladbach and Olympique Marseille football clubs.
Counterfeit Products
Counterfeit products can cause damage to consumer confidence in the brand and can devalue PUMA's
brand image. For this reason, PUMA has made fighting brand piracy a top priority. PUMA’s intellectual
property team does more than just protect a strong global intellectual property portfolio of trademarks,
designs and patents. PUMA also works closely with customs and other law-enforcement authorities around
the world and provides input regarding the implementation of effective laws to protect intellectual property.

44
Sourcing and the Supply Chain
The majority of PUMA products is produced in selected markets in Asia (in particular China, Vietnam,
Bangladesh, and India). Production in these countries and transport in distribution countries is associated
with significant risks for PUMA. For instance, certain risks may result from factors such as fluctuations in
exchange rates, changes in taxes and customs duties, trade restrictions, natural disasters and political
instability, as well as the international threat of terrorism.
Risks may also result from an overdependence on individual manufacturers.
The portfolio is regularly reviewed and adjusted to avoid creating a dependence on individual suppliers and
sourcing markets. To ensure that the necessary future production capacity will be available, framework
agreements are generally concluded for extended periods.
There is also the risk of a breach of ILO (International Labor Organization) core labor standards by our
suppliers. In addition, there is a risk that suppliers will not adhere to environmental standards or use
hazardous chemicals in production, resulting in negative reporting. Inter alia, the PUMA Sustainability Team
is also therefore tasked with verifying compliance with the applicable standards in regular audits of
suppliers.
Product and Market Environment
Recognizing and taking advantage of relevant consumer trends early on is key to countering the risk posed
by market-specific product influences, in particular the risk of substitutability in the competitive sport and
lifestyle market. Only those companies that identify these trends at an early stage will be able to gain an
edge over their competitors.
PUMA's targeted investments in product design and development ensures that the characteristic PUMA
design of the entire product range is consistent with the overall brand strategy (Forever Faster), thereby
creating a unique level of brand recognition. In particular, PUMA is focusing on the expansion and
improvement of the product range for women as part of the “The future is female” initiative.
Retail and e-commerce
PUMA operates various distribution channels (including traditional trade, PUMA’s own retail stores and e-
commerce platforms) in order to reduce dependent on individual distribution paths. The focus on the
company's own retail stores and its own e-commerce platforms should furthermore ensure that PUMA
products are presented in an exclusive brand environment.
Distribution through the company's own retail stores and e-commerce platforms is, however, also
associated with various risks for PUMA. This includes the necessary investments in expansion and
infrastructure, setting up stores, higher fixed costs and leases with long-term lease obligations which can
impact on profitability should business decline. On the other hand, extending the value chain can deliver
higher gross margins and provide better control over distribution. In addition, PUMA-owned retail stores
can deliver PUMA brand experience directly to the end customer.
To avoid risks and take advantage of opportunities, PUMA performs in-depth location and profitability
analyses before making investment decisions. As a result of the company’s controlling and key performance
indicator system, negative trends can be detected early on, and the countermeasures required to manage

45
individual stores can be taken accordingly. In e-commerce, there was a particular harmonization of global
activities and further investment in the IT platform so as to further optimize purchase transaction
settlement, thereby improving the purchasing experience for consumers.
Reporting in the Media
A negative media report about PUMA, such as a product recall, infringement of laws, or internal or external
requirements, can also do significant damage to the brand and ultimately result in the loss of sales and
profit, regardless of whether these events actually happened or were just rumors. PUMA manages this risk
by way of careful press and PR work, which is managed from the Group’s headquarters in Herzogenaurach,
Germany. In addition, PUMA regularly seeks an open dialog with key external stakeholders (e.g. NGOs)
and this has been institutionalized in the "Talks at Banz", which have been held annually since 2003.
Organizational Challenges and Project Risks
The organizational structure of PUMA with the Group's headquarters in Herzogenaurach, a central sourcing
organization in Hong Kong and globally positioned distribution companies, gives the Group a global
orientation. This results in a risk for PUMA that the flow of goods and information are not sufficiently
supported by modern IT infrastructure. For this reason, existing business processes must be continually
optimized and adapted. This is carried out systematically through targeted optimization projects, which are
planned and managed centrally by a staff member.
Personnel Department
Creative potential and the commitment and performance of our employees are important factors for the
success of any business and the source of significant opportunities as well. PUMA encourages independent
thinking and acting, which are key in an open corporate culture with a flat hierarchy.
PUMA’s human resources strategy seeks to ensure the long-term sustainability of this successful philosophy.
To achieve this goal, a control process is in place to detect and assess human-resource risks. Accordingly,
special attention has been paid to managing talent, identifying key positions and high-potential individuals,
and optimizing talent placement and succession planning. PUMA has instituted additional national and
global regulations and guidelines to ensure compliance with legal provisions.
PUMA will continue to make targeted investments in the human-resource needs of particular functions or
regions in order to meet the future requirement of our corporate strategy.
Legal risks
As an international company, the PUMA Group is exposed to various legal risks. These include contractual
risks or risks that a third party could assert claims and litigation for infringement of its trademark rights,
patent rights or other rights. The continuous monitoring of our contractual obligations and the integration
of internal and external legal experts in contractual matters should ensure that any legal risks are avoided.

46
Compliance risks
PUMA is exposed to the risk that employees violate laws, directives and company standards (compliance
violations). These risks, such as theft, fraud, breach of trust, embezzlement and corruption, as well as
deliberate misrepresentations in financial reporting, may lead to significant monetary and reputational
damage. PUMA therefore makes use of various tools to manage these risks. They include an integrated
compliance management system, the internal control system, Group controlling and the internal audit
department. As part of the Compliance Management System, awareness measures are carried out on
important compliance subjects (for example corruption prevention, cartel law) and corresponding guidelines
introduced. The employees of PUMA also have access to an integrity hotline for reporting unethical
behavior.
Currency Risks
As an international company, PUMA is subject to currency risks resulting from the disparity between the
respective amounts of currency used on the purchasing and sales sides and from exchange-rate
fluctuations.
PUMA’s biggest sourcing market is Asia, where most payments are settled in US dollars (USD), while sales
of the PUMA Group are mostly invoiced in other currencies. PUMA manages currency risk in accordance
with internal guidelines. Currency forward contracts are used to hedge existing and future financial liabilities
denominated in foreign currencies.
To hedge signed or pending contracts against currency risk, PUMA only concludes currency forward
contracts on customary market terms with reputable international financial institutions and Kering Finance
SNC. As of the end of 2017, the net requirements for the 2018 planning period were adequately hedged
against currency effects.
Foreign exchange risks may also arise from intra-group loans granted for financing purposes. Currency
swaps and currency forward transactions are used to hedge currency risks when converting intra-group
loans denominated in foreign currencies into the functional currencies of the Group companies (Euro).
In order to disclose market risks, IFRS 7 requires sensitivity analyses that show the effects of hypothetical
changes in relevant risk variables on earnings and equity. The periodic effects are determined by relating
the hypothetical changes caused by the risk variables to the balance of the financial instruments held as of
the balance sheet date. The underlying assumption is that the balance as of the balance sheet date is
representative for the entire year.
Currency risks as defined by IFRS 7 arise on account of financial instruments being denominated in a
currency that is not the functional currency and is monetary in nature. Differences resulting from the
conversion of the individual financial statements to the Group currency are not taken into account. All non-
functional currencies in which PUMA employs financial instruments are generally considered to be relevant
risk variables.
47
Currency sensitivity analyses are based on the following assumptions:
Material primary monetary financial instruments (cash and cash equivalents, receivables, interest-bearing
debt, liabilities from finance leases, non-interest-bearing liabilities) are either denominated directly in the
functional currency or transferred into the functional currency through the use of currency forward
contracts.
Currency forward contracts used to hedge against payment fluctuations caused by exchange rates are part
of an effective cash-flow hedging relationship pursuant to IAS 39. Changes in the exchange rate of the
currencies underlying these contracts have an effect on the hedge reserve in equity and the fair value of
these hedging contracts.
If, as of December 31, 2017, the USD had appreciated (devalued) against all other currencies by 10%, the
hedge reserve in equity and the fair value of the hedging contracts would have been €120.4 million higher
(lower) (December 31, 2016: €106.2 million higher (lower)).
Counterparty Risks
Because of its business activities, PUMA is exposed to default risk that is managed by continuously
monitoring outstanding receivables and recognizing impairment losses, where appropriate. The default risk
is limited where possible by credit insurance and the maximum default risk is reflected by the carrying
amounts of the financial assets recognized on the balance sheet. Furthermore, default risks from other
contractual financial obligations of the counterparty, such as cash at bank and derivative financial
instruments result to a lower extent.
Liquidity Risk
A liquidity reserve in the form of cash or cash equivalents as well as confirmed credit lines is maintained in
order to ensure the company’s solvency at all times, its financial flexibility, and the presence of a strategic
liquidity buffer. Confirmed credit lines are made available until further notice or with a maturity period of
less than one year. Furthermore, there is a loan for financing a new building with a residual term of up to
four years.
PUMA continually analyzes short-term capital requirements through rolling cash flow planning at the level
of the individual companies in coordination with the central Treasury Department. Thanks to the adequate
liquidity of the PUMA Group and a central financing approach, any capital requirements are covered by
internal financing, where and whenever possible. The central Treasury conducts medium-term liquidity
planning as part of its budget process.
Interest-Rate Risks
At PUMA, changes in interest rates do not have a significant impact on interest rate sensitivity and therefore
do not require the use of interest rate hedging instruments.

48
Summary
PUMA’s risk management system allows the company to fulfill the legal requirements pertaining to
corporate control and transparency. The Management believes that, in an overall evaluation of the
company’s risk situation, risk is limited and manageable. Due to the extremely solid balance sheet structure,
in particular the high equity ratio and the positive business prospects, management does not see any
particular endangerment of the continued existence of the PUMA Group.

49
Main features of the internal control and risk management system
as it relates to the Group’s accounting process
PUMA SE's Managing Directors are responsible for the preparation and accuracy of the Consolidated
Financial Statements and the combined management report. The Consolidated Financial Statements were
prepared in accordance with the International Financial Reporting Standards that apply in the EU, the
requirements of the German Commercial Code (HGB), and the German SE Implementation Act (SEAG).
Certain disclosures and amounts are based on current estimates by management.
The company's Managing Directors are responsible for maintaining and regularly monitoring a suitable
internal control and risk management system covering the consolidated financial statements and the
disclosures in the combined management report. This control and risk management system is designed to
ensure the compliance and reliability of the internal and external accounting records, the presentation and
accuracy of the consolidated financial statements, and the combined management report and the
disclosures contained therein. It is based on a series of process-integrated monitoring steps and
encompasses the measures necessary to accomplish these, internal instructions, organizational and
authorization guidelines, the PUMA Code of Ethics, a clear separation of functions within the Group and the
dual-control principle. The adequacy and operating effectiveness of these measures are regularly reviewed
by the Group Internal Audit & GRC department.
For monthly financial reporting and consolidation, PUMA has a Group-wide reporting and controlling system
that allows it to regularly and promptly detect deviations from projected figures and accounting
irregularities and, where necessary, to take countermeasures.
The risk management system can regularly, as well as on an ad-hoc basis, identify events that could affect
the company’s economic performance and its accounting process so that it can analyze and evaluate the
resulting risks and take the necessary actions to counter them.
In preparing the consolidated financial statements and the combined management report, it is also
sometimes necessary to make assumptions and estimates that are based on the information available on
the balance sheet date and which will affect the reported amounts and recognition of assets and liabilities,
income and expenses, contingent liabilities, and other data that must be reported, as well as how these
are classified.
The Administrative Board’s Audit Committee meets regularly with the independent, statutory auditors, the
Managing Directors, and the Group Internal Audit & GRC department to discuss the results of the statutory
audits of the financial statements and of the audit review with regard to the internal control and risk
management system as it relates to the accounting process. The auditor reports to the Board of
Management during the balance-sheet meeting on the results of annual and consolidated financial
statements.

50
In addition to the risk and opportunity management described, the Group Internal Audit & GRC department
carries out so-called "internal control self assessments" (ICSA) at the process level for all essential business
processes. In these, process owners evaluate the existing control framework on the basis of best-practice
standards. The objective is to continuously improve the internal control system and to identify specific risks
at process level. The results of the ICSA are reported to the Audit Committee and are used specifically by
the Group Internal Audit & GRC department in risk-oriented audit planning.

51
Supplemental Report and Outlook
Supplemental Report
There were no events after the balance sheet date which may have a material effect on the net assets,
financial position and results of operations of PUMA Group.
With regard to the future development of PUMA’s shareholder structure, we would like to make reference
to the ad-hoc communication from PUMA SE on January 11, 2018.
Outlook
Global Economy
Due to the stimulating monetary and financial policy, experts from the Kieler Institut für Wirtschaft expect
a further strong increase in global GDP for 2018 in its winter forecast of December 13, 2017. After a growth
in global GDP of 3.8% in 2017, an increase of 3.9% is forecasted for 2018. This is a slight increase of
growth prospects by 0.2 percentage points compared to the summer forecast in 2017 (GDP growth in 2018
+ 3.7%). Improvement compared to the summer forecast, may, in advanced economies, result on the one
hand from persistently good investment conditions for companies, that contribute to increasing profits due
to more favorable financial conditions and, on the other hand, should have a positive influence on the good
mood among consumers and the increasing available income in private households.
With regard to emerging countries, higher raw material prices and a robust foreign economy justify the
slight increase in growth prospects.
Risks for the forecast appear in particular to exist in the financial environment in connection with the
persistent normalization of monetary policy. In contrast, the uncertainties originating from the political
environment appear overall to have diminished somewhat compared to the previous year’s forecast.
Sporting goods industry
If there are no significant negative effects on the part of macroeconomic development, we continue to
expect stable growth in the sporting goods industry in 2018. It must be assumed that the interest in
sporting activity and health awareness will continue to increase, thereby strengthening the demand for
sporting articles. Higher wages and increasing domestic consumption in emerging countries should continue
to stimulate the global consumption of sporting articles in 2018. Furthermore, the football World Cup in
Russia in 2018 should contribute to supporting growth in the sporting goods industry.

52
Outlook 2018
Based on the positive business development in 2017 with strong sales growth and a significant
improvement in profitability, the management is confident that 2018 will be another positive year for the
company and that PUMA is well positioned to carry forward the brand’s momentum.
For the full year 2018, we expect that currency-adjusted net sales will increase by approximately 10%. The
gross profit margin is forecasted to improve slightly (2017: 47.3%). Operating expenses (OPEX) are
expected to increase at a mid to high single-digit rate, as PUMA will continue to invest in marketing, retail
and IT.
At the current exchange rate levels, PUMA’s management expects that the operating result (EBIT) in 2018
will improve significantly due to higher sales and a slightly improved gross profit margin. The EBIT is
therefore expected to come in between €305 million and €325 million (2017: €244.6 million). Net earnings
will also continue to improve significantly in 2018.
Investments
Investments totaling around €125 million are planned for 2018. The significant part of investments concern
investments in infrastructure in order to create the operating requirements for planned long-term growth.
Likewise, further investments are made in the new building and the expansion and modernization of the
company's own retail stores.
Foundation for Long-Term Growth
The Managing Directors and the Administrative Board have established long-term strategic priorities. Action
plans are being implemented in a targeted, value-oriented manner. PUMA’s management believes that the
Forever Faster corporate strategy will lay the foundations for positive mid-term and long-term development.

53
Information Concerning Takeovers
The following information, valid December 31, 2017, is presented in accordance with Art. 9 p. 1 c) (ii) of
the SE Regulation and Section 22 p. 6 of the German SE Implementation Act (SEAG), in conjunction with
Sections 289a, 315a German Commercial Code (HGB). Details under Sections 289a, 315a HGB which do
not apply at PUMA SE are not mentioned.
Composition of the subscribed capital (Sections 289a [1][1][1], 315a [1][1][3] HGB)
On the balance sheet date, subscribed capital totaled € 38,611,107.84 and was divided into 15,082,464
no-par-value shares. As of the balance sheet date, the Company held 136,108 treasury shares.
Shareholdings exceeding 10% of the voting rights (Sections 289a [1][1][3], 315a [1][1][3]
HGB)
As of December 31, 2017 there was one shareholding in PUMA SE that exceeded 10% of the voting rights.
It was held by the Pinault family via several companies controlled by them (ranked by size of stake held by
the Pinault family: Financière Pinault S.C.A., Artémis S.A., Kering S.A. and SAPARDIS SE). The shareholding
of Kering S.A. in PUMA SE amounted to 86.3% according to Kering’s ad hoc announcement from January
11, 2018.
Statutory provisions and regulations of the Articles of Association on the appointment and
dismissal of the Managing Directors and on amendments to the Articles of Association
(Sections 289a [1][1][6], 315a [1][1][6] HGB)
Regarding the appointment and dismissal of Managing Directors, reference is made to the applicable
statutory requirements of Art. 40 SEAG. Moreover, Section 13[1] of PUMA SE’s Articles of Association
stipulates that the Administrative Board shall appoint one or several Managing Director(s). It may appoint
one of these Managing Directors as Chief Executive Officer and one or two as Deputy Chief Executive
Officers. Pursuant to Section 13[4] of PUMA SE’s Articles of Association, Managing Directors may be
dismissed only for good cause, within the meaning of Section 84[3] of the German Stock Corporation Act
(AktG) or if the employment agreement is terminated, in which case a resolution must be adopted by the
Administrative Board with a simple majority of the votes cast. Art. 59 SE Regulation and Sections 133[1],
179 [2] [1] German Stock Corporation Act (AktG) (i.e. a simple majority of votes and a majority of at least
three quarters of the share capital represented at the time the resolution is adopted) are applicable for an
amendment to the Articles of Association. The Company has not made use of Section 51 SEAG. Pursuant
to Art. 9(1)c(ii) of the SE Regulation (SE-VO), the requirements for changing the Articles of Association are
governed by Sections 133 and 179 of the German Stock Corporation Act (AktG). The Administrative Board
is authorized to make changes to the Articles of Association that affect only the text (Article 9(3) of PUMA
SE’s Articles of Association).

54
Authority of the Administrative Board to issue or repurchase shares (Sections 289a [1][1][7],
315a [1][1][7] HGB)
The authority of the Administrative Board to issue shares result from Section 4 of the Articles of
Association and from the statutory provisions:
- The Administrative Board shall be authorized to increase the share capital of the Company by up to
EUR 15,000,000.00 by issuing, once or several times, new no par-value bearer shares against
contributions in cash and/or kind until 11 April 2022 (Authorized Capital 2017). In case of capital
increases against contributions in cash, the new shares may be acquired by one or several banks,
designated by the Administrative Board, subject to the obligation to offer them to the shareholders
for subscription (indirect pre-emption right).The shareholders shall generally be entitled to pre-
emption rights. However, the Administrative Board shall be authorized to partially or completely
exclude pre-emption rights to avoid peak amounts;
- in case of capital increases against contributions in cash if the pro-rated amount of the share capital
attributable to the new shares for which pre-emption rights have been excluded does not exceed 10%
of the share capital and the issue price of the newly created shares is not significantly lower than the
relevant exchange price for already listed shares of the same class, Section 186 (3) sentence 4 AktG.
The 10% limit of the share capital shall apply at the time of the resolution on this authorization by the
Annual General Meeting as well as at the time of exercise of the authorization. Shares of the Company
(i) which are issued or sold during the term of the Authorised Capital 2017 excluding shareholders’
pre-emption rights directly or respectively applying Section 186 (3) sentence 4 AktG or (ii) which are
or can be issued to service option and convertible bonds applying Section 186 (3) sentence 4 AktG
while excluding shareholders’ pre-emption rights during the term of the Authorised Capital 2017, shall
be counted towards said limit of 10%.;
- in case of capital increases against contributions in cash insofar as it is required to grant pre-emption
rights regarding the Company’s shares to holders of option or convertible bonds which have been or
will be issued by the Company or its direct or indirect subsidiaries to such an extent to which they
would be entitled after exercising option or conversion rights or fulfilling the conversion obligation as
a shareholder;
- in case of capital increases against contributions in kind for carrying out mergers or for the (also
indirect) acquisition of companies, participation in companies or parts of companies or other assets
including intellectual property rights and receivables against the Company or any companies controlled
by it in the sense of Section 17 AktG.
- The total amount of shares issued or to be issued based upon this authorization while excluding
shareholders’ pre-emption rights may neither exceed 20% of the share capital at the time of the
authorization becoming effective nor at the time of exercising the authorization; this limit must include
all shares which have been disposed of or issued or are to be issued during the term of this
authorization based on other authorizations while excluding pre-emption rights or which are to be
issued because of an issue of option or convertible bonds during the term of this authorization while
excluding pre-emption rights.

55
The Administrative Board shall be entitled to determine the remaining terms of the rights associated with
the new shares as well as the conditions of the issuance of shares.
The resolution adopted by the Annual General Meeting on May 6, 2015 authorized the company to purchase
treasury shares up to a value of 10% of the share capital until May 5, 2020.
Significant agreements of the Company which are subject to a change of control as a result of
a takeover bid and the resulting effects (Section 289a [1][1][8], 315a [1][1][8] HGB)
Material financing agreements of PUMA SE with its creditors contain the standard change-of-control clauses.
In the case of change of control the creditor is entitled to termination and early calling-in of any outstanding
amounts.
For more details, please refer to the relevant disclosures in the Notes to the Consolidated Financial
Statements (Section 18).

56
Corporate Governance Report including the Statement on
Corporate Governance in accordance with Section 289f
and Section 315d HGB.
Effective implementation of the principles of corporate governance is an important aspect of PUMA's
corporate policy. Transparent and responsible corporate governance is a key prerequisite for achieving
corporate targets and for increasing the Company’s value in a sustainable manner. The Administrative
Board and the Managing Directors work closely with each other in the interests of the entire Company to
ensure that the Company is managed and monitored in an efficient way that will ensure sustainable added
value through good corporate governance. In the following the Administrative Board and the Managing
Directors report on the corporate governance at PUMA SE in accordance with Section 3.10 of the German
Corporate Governance Code. This section also includes the Statement of Compliance in accordance with
Art. 9(1)c(ii) of the SE Regulation (SE-VO) and Section 22(6) of the German SE Implementation Act (SEAG),
in conjunction with Section 289f and Section 315d HGB.
Under Art. 9(1)c(ii) of the SE Regulation (SE-VO) and Section 22(6) of the German SE Implementation Act
(SEAG), in conjunction with § 161 AktG the Administrative Board of a listed German SE is required to issue
a statement at least once a year stating whether the German Corporate Governance Code has been and is
being observed and which of the Code’s recommendations have not been or are not being applied and
why. The Administrative Board of PUMA SE issued the following statement of compliance on November 9,
2017:
Statement of Compliance pursuant to Section 161 AktG for 2017:
Pursuant to Art. 9 p. 1 c) (ii) of the SE Regulation (SE-VO) and Section 22 p. 6 of the German SE
Implementation Act (SEAG), in conjunction with Section 161 AktG PUMA SE’s Administrative Board declares
that PUMA SE has been and will be in compliance with the recommendations issued by the “Government
Commission on the German Corporate Governance Code” (the “Code”) (code version dated May 05, 2015
and February 07, 2017), since the last Statement of Compliance from November 9, 2016 in consideration
of the particulars of PUMA SE’s single-tier system described under item 1. with the exceptions mentioned
under item 2., and where it is not in compliance, explains why not.
1st Particulars of the Single-Tier Corporate Governance System
According to Artt. 43 - 45 SE-VO, in conjunction with Sections 20 et seq. SEAG, under the single-tier
system, the management of the SE is the responsibility of a single company organ, the Administrative
Board (see Para. 7 of the Code’s Preamble). The Administrative Board manages the Company,
determines the Company’s basic business strategies and monitors the implementation of said
strategies by the managing directors. The managing directors manage the Company’s business,
represent the Company in and out of court and are bound by instructions from the Administrative
Board.

57
Basically, PUMA SE takes those parts of the Code that used to apply to the Supervisory Board and
applies them to the Administrative Board and takes those parts of the Code that used to apply to the
Board of Management and applies them to its managing Directors. The following exceptions apply
with respect to the legal framework for the single-tier system:
- In derogation of No. 2.2.1 s. 1 of the Code, the Administrative Board must submit the annual
financial statements and the consolidated financial statements to the Annual General Meeting,
Section 48 p. 2 s. 2 SEAG.
- In derogation of Nos. 2.3.1 s. 1 and 3.7 p. 3 of the Code, the Administrative Board is responsible
for convening the Annual General Meeting, Sections 48 and 22 p. 2 SEAG.
- The duties of the Board of Management listed in Nos. 4.1.1 (Corporate Governance), 4.1.2 in
conjunction with 3.2 half-sentence 1 (Development of the Company’s Strategic Orientation) of the
Code are the responsibility of the Administrative Board, Section 22 p. 1 SEAG.
- The powers of the Board of Management governed by Nos. 2.3.2 s. 2 (Proxy Bound by
Instructions), 3.7 p. 1 (Statement on a Takeover Bid) and 3.7 p. 2 (Conduct during a Takeover
Bid), as well as 3.10 (Corporate Governance Report), 4.1.3 (Compliance) and 4.1.4 (Risk
Management and Controlling) of the Code shall be the responsibility of PUMA SE’s Administrative
Board, Section 22 p. 6 SEAG.
- In derogation of Nos. 5.1.2 p. 2 s. 1 and 2 of the Code, managing directors, unlike members of the
Board of Management, are not subject to a fixed, maximum term of office, Section 40 p. 1 s. 1
SEAG.
- In derogation of Nos. 5.4.2 s. 2 and 5.4.4 of the Code, members of the Administrative Board may
be appointed as managing directors, provided that the majority of the Administrative Board
continues to consist of non-executive managing directors, Section 40 p. 1 s. 2 SEAG.
2nd Exceptions to the Code’s recommendations
- In derogation of No. 3.8 p. 3 of the Code, members of the Administrative Board are provided with
D&O insurance with no deductible. The Administrative Board feels that it can dispense with a
deductible for members of the Administrative Board, because the D&O insurance is group insurance
for people in Germany and abroad, and a deductible is fairly unusual abroad.
- In derogation of No. 4.2.3 p. 2 s. 6 of the Code the compensation of the managing directors does
not show the maximum amount limits in total or their variable compensation components. The
employment contracts of the managing directors were concluded in accordance with the then
current version of the Code and are deemed to be proper and correct by PUMA SE.

58
- In derogation of No. 4.2.3 p. 5 of the Code no limits on severance payments for premature
termination as a managing director due to a change of control have been agreed, because an
agreement drawn up in advance would not be able to take into account the specific situation that
gave rise to a premature termination or the other circumstances of the individual case of
termination.
- In accordance with the authorization by the Annual General Meeting on May 07, 2013, pursuant to
Section 286 p. 5 HGB, the Company shall not publish the amounts of compensation for individual
managing directors until the authorization expires (Nos. 4.2.4 and 4.2.5 of the Code). The
managing directors shall adhere to the authorization when they prepare the annual financial
statements. Based on the authorization of the Annual General Meeting, and in derogation of No.
4.2.5 p. 3 of the Code the information stated in this Section regarding the compensation of the
managing directors is not included in the Compensation Report.
- In derogation of No. 5.4.6 p. 2 s. 2 of the Code, members of the Administrative Board receive
performance-based compensation that is not linked to the sustainable success of the Company.
The compensation was authorized by the Annual General Meeting on April 14, 2011, it is stipulated
in the Articles of Association and is deemed to be proper and correct by PUMA SE.
- In derogation of No. 5.4.6. p. 3 of the Code, the compensation of the Administrative Board
members is not shown individually. In the opinion of PUMA SE, this is not additional information
relevant to the capital market as the respective remuneration regulations included in the Articles
of Association are in the public domain.
Herzogenaurach, November 9, 2017
PUMA SE
For the Administrative Board
Jean-François Palus
The Statement of Compliance is available at any time on the Company’s website at
http://about.puma.com/de/investor-relations/corporate-governance/declaration-of-compliance/.

59
Relevant disclosures of corporate governance practices that are applied
beyond the regulatory requirements
CORPORATE SOCIAL RESPONSIBILITY
In order to fulfill our ecological and social responsibility as a global sporting goods manufacturer, PUMA
has developed groupwide guidelines on environmental management and on compliance with workplace
and social standards. PUMA is convinced that only on such a foundation can a lasting and sustainable
corporate success be achieved. That is why PUMA is committed to the principles of the UN Global Compact.
The PUMA Code of Conduct prescribes ethical and environmental standards with which both employees
and suppliers are required to comply. The PUMA Code of Conduct was revised in 2016 and explicitly
addresses PUMA's obligation and commitment in respect of human rights and combating corruption.
Detailed information on the company's corporate social responsibility strategy can be found in the
Sustainability section of the Annual Report or on the company's homepage (http://about.PUMA.com under
"SUSTAINABILITY").
COMPLIANCE MANAGEMENT SYSTEM
Compliance with laws and internal regulations and values are of key importance for PUMA’s corporate
governance. For this reason, PUMA has introduced a compliance management system (CMS) to identify,
control and monitor compliance risks at an early stage. By developing policies as well as advising and
training employees, the CMS aims to prevent potential financial losses or reputational damage from the
company and to prevent misconduct.
The Code of Ethics of the PUMA Group sets out the principles governing our actions and values. In addition
to the general principles of conduct described as well in the PUMA Code of Conduct, among other things,
the policy contains rules on the handling of conflicts of interest, personal data, insider information and
prohibits anti-competitive behavior as well as corruption in any form. The Code of Ethics is an integral part
of every employment contract. In order to further reduce the risk of misconduct, the PUMA Code of Ethics
is accompanied by concrete guidelines governing selected risk areas in detail.
With the help of various measures such as risk-based face-to-face trainings and e-learnings, the employees
of the PUMA Group are familiarized with the relevant legal regulations and internal guidelines and trained.
In the past financial year, training was provided in particular in the areas of anti-corruption and antitrust
law. In 2017, all PUMA employees were instructed by the CEO of PUMA SE to complete an e-learning course
on the Code of Ethics as well as on the fight against bribery and corruption. The clear tone from the top
led to 99% of PUMA employees successfully completing the e-learning on the Code of Ethics and 98%
successfully completing the e-learning on the fight against bribery and corruption.
The Administrative Board and the Managing Directors have overall responsibility for the proper functioning
of the CMS. They are supported by a compliance organization consisting of a Chief Compliance Officer and
compliance officers in the most important Group companies. The Audit Committee of the Administrative
Board of PUMA SE is regularly informed about the current status of the implementation of the compliance

60
structures and serious compliance violations. The Chief Compliance Officer works closely with the Legal
Department and Internal Audit. In addition, regular meetings of the PUMA SE Risk & Compliance Committee
are held. This consists of a fixed circle of executives including the managing directors of PUMA SE. Among
other things, the committee analyses and evaluates compliance risks and defines and adopts appropriate
measures (policies, training courses, etc.).
A whistleblower hotline operated by an external provider is available to PUMA employees throughout the
Group, to whom unethical, illegal or criminal activities can be reported - if desired, anonymously as well.
In addition to the complaint system for PUMA employees, there is a worldwide hotline for external
whistleblowers from the supply chain.
Description of the working practices of the Administrative Board and the
Managing Directors
PUMA SE has a single-tier management and control structure. According to Articles 43 – 45 SE-VO, in
conjunction with Sections 20 et seqq. SEAG, under the single-tier system, management of the SE is the
responsibility of a single body, the Administrative Board. The Managing Directors manage the Company’s
daily business. Another corporate body is the Annual General Meeting.
The Administrative Board of PUMA SE manages the Company, determines the Company’s basic business
strategies and monitors the implementation of said strategies by the Managing Directors. It appoints and
dismisses the Managing Directors, decides on the compensation system and establishes the compensation.
In accordance with the Articles of Association, the Administrative Board consists of at least three members.
It currently consists of six members according to the Articles of Association of the company. At least one
independent member of the Administrative Board must have expertise in the areas of finance, accounting
or auditing. The members of the Administrative Board are appointed by the Annual General Meeting, a
third of them pursuant to the German Codetermination Act based on binding nominations by employee
representatives. The members of the Administrative Board are appointed for a period up to the close of
the Annual General Meeting that adopts the resolution approving the actions of the Administrative Board
for the financial year 2021 and for a maximum of six years after the respective Administrative Board
member was appointed. Administrative Board members may be reappointed.
The Administrative Board had eight members until the Annual General Meeting on April 12, 2017. One
member died on March 12, 2017. The Administrative Board has consisted of six members since April 12,
2017. Further information on the members of the Administrative Board can be found in the Notes to the
Consolidated Financial Statements (last chapter).
Meetings of the Administrative Board must be held at least every three months. Meetings must also be held
if required for the Company’s well-being or if a member of the Administrative Board demands that a meeting
be convened. The Board of Directors held four ordinary meetings and two extraordinary meetings in 2017.

61
The Managing Directors manage the Company’s business with the goal of creating sustainable value
with shared responsibility. They implement the guidelines and targets issued by the Administrative Board.
The Board currently consists of three members and has a chairman. The Managing Directors inform the
Administrative Board regularly, comprehensively, and in a timely manner regarding all company-related
issues with respect to planning, business development, the risk situation, risk management and compliance.
They provide details on and reasons for deviations of business performance from established plans and
objectives. Further information on the Managing Directors can be found in the Notes to the Consolidated
Financial Statements (last chapter).
The Managing Directors are required to disclose conflicts of interest to the Administrative Board immediately
and inform the other Managing Directors about any such conflicts. They are permitted to carry out
additional activities, especially Supervisory Board or similar mandates outside the PUMA Group, only with
the prior approval of the Administrative Board. In the past year, Managing Directors of PUMA SE had no
conflicts of interest.
The principles of cooperation of the Managing Directors of PUMA SE are laid down in the Rules of Procedure
for the Managing Directors, which can be viewed at http://about.PUMA.com under "Corporate Governance".
Diversity Concept
a) Objectives for the composition of the Administrative Board
The Administrative Board of PUMA SE is composed in such a way that its members as a group possess the
appropriate knowledge, skills and professional experience necessary for the proper performance of their
duties. The composition of the Administrative Board is primarily determined by appropriate qualification,
taking into account diversity and the appropriate involvement of women. Based on Section 5.4.1 of the
Code, the Administrative Board has set targets for his composition that have been fulfilled. In detail:
• The members of the Administrative Board as a group have the experience and knowledge in the
field of management and/or monitoring market-oriented companies as well as in the business
segments and sales markets of PUMA.
• A sufficient number of members have strong international backgrounds.
• Including the employees' representative on the Administrative Board, the Administrative Board has
an appropriate number of independent members.
• The Chairman of the Audit Committee has specialist knowledge and experience in the application
of accounting principles and internal control procedures and is independent.
• The members have sufficient time to perform his/her mandate in the Administrative Board.
• The Administrative Board prevents potential significant and not only temporary conflicts of interest
of its members by regularly monitoring and critically scrutinizing its members' other activities.
• According to Section 1(4) of the Rules of Procedure for the Administrative Board, Administrative
Board members may, in principle, not be over 70 years of age and their maximum term of office
may not exceed three terms.

62
b) Profile of skills and expertise
The Administrative Board has determined a competence profile for the entire Board. It stipulates that the
members of the Administrative Board as a whole must cover the following professional competencies:
• Managing of large or mid-sized international companies
• Leadership experience in the sporting or luxury goods industry
• International corporate background
• Leadership experience with various disribution channels, including e-commerce
• Expertise in building strong international brands
• Marketing, sales and digital know how
• Financial expertise (accounting, treasury, risk management, corporate governance)
• Expertise in serving on the supervisory or administrative boards of publicly listed companies
• Experience with mergers & acquisitions
• Understanding of the industrial constitution law and advocating the interests of the employees
• HR expertise
• IT expertise
The Administrative Board of PUMA SE is currently composed in such a way that it has the competence
profile as an overall body.
c) Commitments to promote the participation of women in management positions in
accordance with Art. 9(1)c(ii) of the SE Regulation (SE-VO) and Section 22(6) of the
German SE Implementation Act (SEAG) in connection Section 76(4), Section 111(5) AktG
The Administrative Board has adopted new targets for the proportion of women on the Administrative
Board, at the level of the Managing Directors and the two management levels below the Managing
Directors. For the Administrative Board of PUMA SE a target of 30% women was set; for the level of the
Managing Directors a target of 20% was set, on the condition that PUMA SE has five or more Managing
Directors. The Administrative Board adopted targets of 25% for the first management level below the
Managing Directors and 30% for the second management level. At Group level, the proportion of women
is expected to increase to 30% for the first management level below the Managing Directors and to 40%
for the second management level.
All implementation deadlines run until October 31, 2021.
The targets set by PUMA in 2015 have been achieved partially. As only one member of the Administrative
Board is a woman, the target for the Administrative Board has not been reached by June 30, 2017. The
body of Managing Directors was not extended until June 30, 2017 and continues to consist of Messrs.
Gulden, Lämmermann and Sørensen. The target figures of 20% and 30%, respectively, for the first two
management levels below the Managing Directors were achieved at Group level, but not at the level of
PUMA SE.
In the future, the inclusion of women among the Managing Directors shall be guaranteed in the event of a
new appointment, in particular by giving special consideration to women from among several equally

63
qualified applicants. If a position must be filled by outside candidates, special care should be taken to
consider properly qualified female candidates. The same applies when filling management positions. In
order to include even more women in management positions in the future, PUMA SE is using part-time and
half-day models, as well as flexible working hours and the provision of more childcare places to promote a
better balance between work and family life.
Description of the composition and the working practices of the committees
of the Administrative Board
The Administrative Board has established four committees to perform its duties and receives regular reports
on their work. The principles of cooperation of the Administrative Board of PUMA SE and the duties of the
committees are set out in the Rules of Procedure for the Administrative Board, which can be viewed at
http://about.PUMA.com under "Corporate Governance".
The Personnel Committee consists of three members. The Personnel Committee is responsible for entering
into and making changes to Managing Directors’ employment contracts and for establishing policies for
Human Resources and personnel development. The entire Administrative Board decides on issues involving
the Managing Directors’ compensation based on recommendations from the Personnel Committee.
The Audit Committee consists of three members. The Chairman of the Audit Committee must be an
independent shareholder representative and must have expertise in the fields of accounting and auditing
in accordance with Section 100(5) AktG. In particular, the Audit Committee is responsible for accounting
issues and monitoring the accounting process, the effectiveness of the internal control system, the risk
management system, internal audits, compliance and the statutory audit of the financial statements, with
particular regard to the required independence of the statutory auditors, issuing the audit mandate to the
statutory auditors, defining the audit areas of focus, any additional services to be performed by the auditors
and the fee agreement. The recommendation of the Administrative Board on the selection of the statutory
auditors must be based on a corresponding recommendation by the Audit Committee. Once the Annual
General Meeting has appointed the statutory auditors, and the Administrative Board has issued the audit
assignment, the Audit Committee shall work with the statutory auditors to specify the scope of the audit
and the audit areas of focus. The statutory auditors shall attend a meeting to review the annual financial
statements and the consolidated financial statements and shall report on the key findings of their audit.
They shall also inform the Committee about other services they have provided in addition to auditing
services and shall confirm their independence. Each month, the Audit Committee shall receive financial
data on the PUMA Group, which will allow the tracking of developments in net assets, financial position,
results of operations and the order books on a continual basis. The Audit Committee shall also deal with
issues relating to the balance sheet and income statement and shall discuss these with Management. In
addition, when the internal audit projects are completed, the Audit Committee shall receive the audit
reports, which must also include any actions taken.
64
The Sustainability Committee consists of three members and is responsible for promoting business
sustainability as well as awareness of the need to act fairly, honestly, positively and creatively in every
decision made and every action taken.
The Nominating Committee has three members, who may only be representatives of the shareholders on
the Administrative Board. The Nominating Committee proposes suitable shareholder candidates to the
Administrative Board for its voting recommendations to the Annual General Meeting.
The current composition of the committees can be found in the Notes to the Consolidated Financial
Statements (last chapter).
Directors’ Dealings
In the reporting year, the Managing Directors and the members of the Administrative Board have acquired
no PUMA shares. No sales were reported to us.
Declaration by the Legal Representatives
Regarding the Affirmation pursuant to Section 315(1)(5) of the German Commercial Code (HGB)
(Responsibility Statement/Bilanzeid), please refer to the Notes.
Herzogenaurach, February 9, 2018
The Managing Directors
Gulden Lämmermann Sørensen

CONSOLIDATED FINANCIAL STATEMENTS
PUMA SE
for the Financial Year 2017
- International Financial Reporting Standards - IFRS

2
Consolidated Statement of Financial Position 12/31/2017 12/31/2016
Notes € million € million
ASSETS
Cash and cash equivalents 3 415.0 326.7 Inventories 4 778.5 718.9
Trade receivables 5 503.7 499.2
Income tax receivables 22 26.8 37.4 Other current financial assets 6 66.7 114.1
Other current assets 7 94.1 69.2
Current assets 0 1,884.8 1,765.4 0
Deferred income taxes 8 207.9 229.5 Property, plant and equipment 9 260.1 252.1
Intangible assets 10 412.9 423.1 Investments in associates 11 16.6 16.5
Other non-current financial assets 12 51.7 59.8
Other non-current assets 12 19.8 18.7
Non-current assets 0 969.0 999.7
0
Total assets 0 2,853.8 2,765.1
0
LIABILITIES AND SHAREHOLDERS' EQUITY 0
0 Current financial liabilities 13 29.0 25.3
Trade payables 13 646.1 580.6 Income taxes 22 54.7 41.4
Other current provisions 16 86.2 56.0
Other current financial liabilities 13 94.9 70.0 Other current liabilities 13 145.5 121.5
Current liabilities 0 1,056.5 894.9 0
Deferred income tax liabilities 8 37.6 63.1
Pension provisions 15 29.7 31.6 Other non-current provisions 16 34.6 29.8
Liabilities from acquisitions 17 4.8 5.0 Other non-current financial liabilities 13 31.0 16.2
Other non-current liabilities 13 3.0 2.3
Non-current liabilities 0 140.7 148.0 0
Subscribed capital 18 38.6 38.6
Group reserves 18 50.7 203.2 Retained earnings 18 1,566.1 1,496.6
Treasury stock 18 -30.0 -31.4 Equity attributable to the shareholders of the parent 0 1,625.5 1,706.9
Non-controlling interest 18 31.2 15.3
Shareholders' equity 0 1,656.7 1,722.2 0
Total liabilities and shareholders' equity 0 2,853.8 2,765.1

3
Consolidated Income Statement 2017 2016
Notes € million € million Sales 25 4,135.9 3,626.7
Cost of sales 25 -2,181.5 -1,970.3
Gross profit 25 1,954.3 1,656.4 0
Royalty and commission income 0 15.8 15.7
Other operating income and expenses 20 -1,725.6 -1,544.5
Operating income (EBIT) 0 244.6 127.6
0
Result from associated companies 21 1.6 1.2 Financial income 21 10.3 10.5
Financial expenses 21 -25.3 -20.4
Financial result 0 -13.4 -8.7
0
Earnings before taxes (EBT) 0 231.2 118.9 0
Taxes on income 22 -63.3 -30.5
Consolidated net earnings for the year 0 168.0 88.4 attributable to: 0
Non-controlling interest 18 -32.2 -26.0 Equity holders of the parent (net earnings) 0 135.8 62.4
Earnings per share (€) 23 9.09 4.17 Earnings per share (€) - diluted 23 9.09 4.17
Weighted average shares outstanding (million) 23 14.943 14.940
Weighted average shares outstanding, diluted (million) 23 14.943 14.940
Consolidated Statement of After tax Tax impact Before tax After tax Tax impact Before tax
Comprehensive Income 2017 2017 2017 2016 2016 2016
€ million € million € million € million € million € million Net earnings before attribution 168.0 168.0 88.4 88.4
Currency changes -114.9
-114.9 11.9
11.9 Cashflow hedge
Release to the income statement -43.8 0.1 -43.9 -17.4 5.2 -22.6 Market value for cashflow hedges -55.0 4.2 -59.1 51.1 -0.6 51.7
Net result of available-for-sale financial assets 3.8
3.8 4.9 -0.8 5.7 Share in the other comprehensive income of at equity
accounted investments -0.4
-0.4 -0.1
-0.1 Items expected to be reclassified to the income
statement in the future -210.3 4.2 -214.5 50.4 3.8 46.6
Remeasurements of the net defined benefit liability 1.0 -0.3 1.3 -9.1 2.3 -11.3 Items not expected to be reclassified to the
income statement in the future 1.0 -0.3 1.3 -9.1 2.3 -11.3
Other result -209.3 3.9 -213.2 41.3 6.1 35.2
Comprehensive income -41.4 3.9 -45.2 129.7 6.1 123.6 attributable to: Non-controlling interest 29.2 29.2 26.6 26.6
Equity holder of the parent -70.6 3.9 -74.5 103.1 6.1 97.0

4
Consolidated Statement of Cashflows 2017 2016
Notes € million € million Operating activities
Earnings before tax (EBT) 0 231.2 118.9
Adjustments for: 0 Depreciation 9, 10 70.4 59.9
Non-realized currency gains/losses, net 0 15.7 -0.7 Result from associated companies 11 -1.6 -1.2
Financial income 21 -10.1 -10.2
Financial expenses 21 18.5 14.0 Changes from the sale of fixed assets 0 1.7 0.6
Changes to pension accruals 15 -0.4 -3.2 Other non-cash effected expenses/income 0 5.6 4.8
Gross Cashflow 26 330.9 182.9
0 0
Changes in receivables and other current assets 5, 6, 7 -92.8 -16.8 Changes in inventories 4 -117.2 -57.7
Changes in trade payables and other 0
current liabilities 13 159.4 74.2
Cash inflow from operating activities 0 280.3 182.7
0
Dividends received 11, 12 1.0 1.0 Interest paid 21 -11.6 -11.6
Income taxes paid 22 -42.6 -41.0
Net cash from operating activities 26 227.2 131.1
Investing activities 0
Payment for acquisitions 17 0.0 -6.8 Purchase of property and equipment 9, 10 -122.9 -84.3
Proceeds from sale of property and equipment 0 12.6 1.5
Payment for other assets 12 -1.7 -0.5 Interest received 21 1.8 8.8
Cash outflow from investing activities 0 -110.3 -81.4
Financing activities 0 Changes in leasing liabilities 13 -0.2 -0.1
Raising/ (-) Repayment of current financial liabilities 13 -12.1 -43.4 Raising of non-current financial liabilities 13 15.4 9.2
Dividend payments to equity holders of the parent 18 -11.2 -7.5
Dividend payments to non-controlling interests 18 -13.4 -19.3 Other changes 0 -2.0 0.0
Cash outflow from financing activities 26 -23.4 -61.1
0 Exchange rate-related changes in cashflow 0 -5.3 -0.7
Change in cash and cash equivalents 0 88.3 -12.1
Cash and cash equivalents at beginning of the financial year 0 326.7 338.8
Cash and cash equivalents at the end of the financial year 3, 26 415.0 326.7
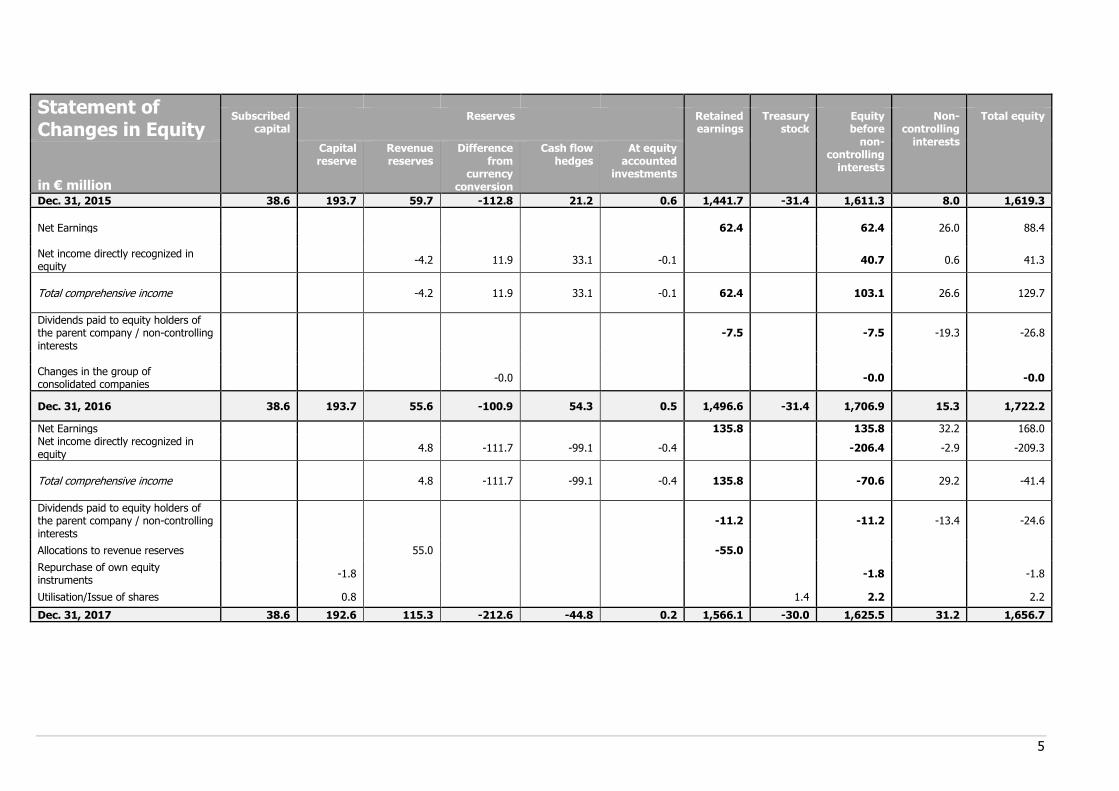
5
Statement of Changes in Equity
Subscribed capital
Reserves Retained earnings
Treasury stock
Equity before
non-controlling
interests
Non-controlling
interests
Total equity
in € million
Capital reserve
Revenue reserves
Difference from
currency conversion
Cash flow hedges
At equity accounted
investments
Dec. 31, 2015 38.6 193.7 59.7 -112.8 21.2 0.6 1,441.7 -31.4 1,611.3 8.0 1,619.3
Net Earnings 62.4
62.4 26.0 88.4
Net income directly recognized in equity
-4.2 11.9 33.1 -0.1
40.7 0.6 41.3
Total comprehensive income -4.2 11.9 33.1 -0.1 62.4 103.1 26.6 129.7
Dividends paid to equity holders of the parent company / non-controlling interests
-7.5 -7.5 -19.3 -26.8
Changes in the group of consolidated companies
-0.0
-0.0
-0.0
Dec. 31, 2016 38.6 193.7 55.6 -100.9 54.3 0.5 1,496.6 -31.4 1,706.9 15.3 1,722.2
Net Earnings 135.8
135.8 32.2 168.0 Net income directly recognized in equity
4.8 -111.7 -99.1 -0.4
-206.4 -2.9 -209.3
Total comprehensive income 4.8 -111.7 -99.1 -0.4 135.8 -70.6 29.2 -41.4
Dividends paid to equity holders of the parent company / non-controlling interests
-11.2 -11.2 -13.4 -24.6
Allocations to revenue reserves 55.0 -55.0
Repurchase of own equity instruments
-1.8
-1.8
-1.8
Utilisation/Issue of shares 0.8 1.4 2.2
2.2
Dec. 31, 2017 38.6 192.6 115.3 -212.6 -44.8 0.2 1,566.1 -30.0 1,625.5 31.2 1,656.7

6
Notes to the Consolidated Financial Statements 1. General
Under the “PUMA” brand name, PUMA SE and its subsidiaries are engaged in the development and sale of a broad range of sports and sports lifestyle products, including footwear, apparel and accessories. The
company is a European stock corporation (Societas Europaea/SE) and parent company of the PUMA Group;
its registered office is on PUMA WAY 1, 91074 Herzogenaurach, Germany. The competent registry court is in Fürth (Bavaria).
The PUMA Group is included in the consolidated financial statements of Kering S.A., Paris, which are
available on the website www.kering.com and are published by the Autorité des Marchés Financiers (AMF).
The Kering Group, in turn, is included in the consolidated financial statements of Financière Pinault S.C.A., which are not published.
The consolidated financial statements of PUMA SE and its subsidiaries (hereinafter shortly referred to as the
“Group” or “PUMA”) were prepared in accordance with the “International Financial Reporting Standards
(IFRS)” accounting standards issued by the International Accounting Standards Board (IASB), as they are to be applied in the EU, and the supplementary accounting principles to be applied in accordance with Section
315e (1) of the German Commercial Code. The IASB standards and interpretations, as they are to be applied in the EU, which are mandatory for financial years as of January 1, 2017 have been applied.
The following new and amended standards and interpretations have been used for the first time in the
current financial year:
Standard Title
First-time adoption in the current financial year
Amendment IAS 12 Recognition of Deferred Tax Assets for Unrealized Losses
Amendment IAS 7 Disclosure Initiative
The standards and interpretations used for the first time as of January 1, 2017 did not have any significant
effect on the consolidated financial statements.
The following standards and interpretations have been released, but will only take effect in later reporting
periods and are not applied earlier by the group:
Standard Titel Date of adoption *
Planned adoption
Endorsed
IFRS 9 Financial Instruments 01.01.2018 01.01.2018
Amendment IFRS 4 Applying IFRS 9 Financial Instruments with IFRS 4 Insurance Contracts
01.01.2018 01.01.2018
IFRS 15 Revenue from Contracts with Customers 01.01.2018 01.01.2018
IFRS 16 Leases 01.01.2019 01.01.2019
Endorsement pending
Amendment IAS 40 Transfers of Investment Property 01.01.2018 01.01.2018
Amendment IFRS 2 Classification and Measurement of Share-based Payment Transactions
01.01.2018 01.01.2018
IFRIC 22 Foreign Currency Transactions and Advanced Consideration 01.01.2018 01.01.2018
AIP 2014 - 2016 Improvements to IFRS 01.01.2018 01.01.2018
Amendment IAS 28 Long-term Interests in Associates and Joint Ventures 01.01.2019 01.01.2019
Amendment IFRS 9 Prepayment Features with Negative Compensation 01.01.2019 01.01.2019
AIP 2015 - 2017 Improvements to IFRS 01.01.2019 01.01.2019
IFRIC 23 Uncertainty Transactions and Advance Consideration 01.01.2019 01.01.2019
IFRS 17 Insurance Contracs 01.01.2021 01.01.2021
* Adjusted by EU endorsement, if applicable

7
IFRS 9 contains regulations for the recognition, measurement and derecognition as well as for hedge
accounting. This means that the accounting of financial instruments carried out previously under IAS 39 (Financial Instruments: Recognition and Measurement) can now be completely replaced by accounting under
IFRS 9. This includes, among other things, a new impairment model based on expected credit defaults. IFRS 9 also contains new regulations on the application of hedge accounting.
The new standard is to be applied for financial years beginning on or after January 1, 2018. PUMA will apply IFRS 9 for the first time for the financial year beginning on January 1, 2018; the adjustment of the previous
year's figures is waived in accordance with the transitional provisions of IFRS 9.
PUMA does not expect any significant effects from the first-time application of IFRS 9. With regard to the
new impairment model of IFRS 9 for the value adjustment of debt instruments, PUMA does not expect any significant change in the amount of the value adjustments, as PUMA mainly has current trade receivables
with no interest component. In addition, the majority of trade receivables are insured against credit risk, which limits the amount of the expected loss. PUMA will apply the hedge accounting rules prospectively as of
January 1, 2018. It is expected that all existing hedge accounting relationships will also meet the requirements for hedge accounting in accordance with IFRS 9.
The introduction of IFRS 9 is accompanied by changes to IFRS 7, which will lead to additional disclosures in the notes to the financial statements in the future.
IFRS 15 prescribes when and in what amount revenues are to be recognized. The standard provides a
single, principle-based, five-step model that applies to all contracts with customers. In the future, the date of
revenue recognition will be determined by the transfer of control to the customer. In each case, a check must be carried out as to whether the power of disposition is transferred to the customer on a period or
specific time basis. In addition, more comprehensive disclosures in the notes to the financial statements require that more informative and relevant information be made available to users of the financial
statements than previously.
The standard and the clarifications published in April 2016 must be applied to financial years beginning on or
after January 1, 2018. PUMA will apply IFRS 15 for the first time for the financial year beginning on January 1, 2018; the adjustment of the previous year's figures is waived in accordance with the transitional
provisions of the modified retrospective approach in IFRS 15. The transitional facilitations available for modified retrospective application are to be utilized. Based on the analyses carried out, no reconciliation
effects are to be expected in the opening balance sheet in 2018 when IFRS 15 is applied for the first time.
Further findings in the course of the implementation of IFRS 15 confirm that there will be no material effects
on the consolidated financial statements of PUMA as PUMA has not concluded any long-term contracts and multi-component agreements. In addition, the following key statements can be made:
• For revenues from the sale of products, no conversion effects are expected, since control is
generally transferred to the customer when the products are delivered and sales revenues and thus
income continue to be recognized at this point in time.
• The accounting for licensing of trademark rights does not result in any changes to the previous accounting treatment, as the previous presentation corresponds to future regulations.
• With regard to the new requirements for the disclosure of payments to customers, it is expected
that in individual cases there may be differences in accounting, which will lead to the disclosure of payments to customers as a reduction in sales revenue rather than the recognition of operating
expenses. Overall, however, this is not expected to have a significant effect on accounting.
• With regard to the balance sheet presentation, IFRS 15 results in a shift in connection with reimbursement liabilities, which were previously reported under other provisions. The amount of the
reimbursement liabilities will continue to be disclosed separately in the notes to the financial
statements. Overall, however, this is not expected to have a significant effect on accounting.
• The sales-related warranty services cannot be purchased separately and do not lead to services that go beyond the assurance of the specifications at the time of the transfer of risk. They therefore fall
under assurance type warranties, which continue to be accounted for in accordance with IAS 37.
However, the new IFRS 15 will require additional quantitative and qualitative disclosures in the notes.

8
The new standard IFRS 16 Leases will mean that, in the future, all leases will have to be accounted for in
the form of a right of use and a corresponding leasing obligation. In all cases, the presentation in the income statement is made as a financing transaction, i.e. the right of use is generally depreciated on a straight-line
basis and the lease liability is carried forward using the effective interest method. However, it is expected that the application facilitation for short-term leases with a term of less than 12 months and leased assets of
low value will be utilized.
The new standard is to be applied for financial years beginning on or after January 1, 2019. No decision has
been made yet with regard to the method of first-time application. It is planned that PUMA will make its decision on the first-time application of IFRS 16 in the first half of 2018 and announce its decision in the
financial report for the first half of 2018.
PUMA mainly concludes leasing contracts as an operating lessee. The application of IFRS 16 has the
following effects on the presentation of the Group's net assets, financial position and results of operations: With regard to the minimum lease payments from operating leases reported under other financial
obligations, the first-time application of IFRS 16 will lead to an increase in non-current assets due to the recognition of rights of use. Accordingly, financial liabilities will increase as a result of the disclosure of the
corresponding liabilities. This will therefore lead to a significant increase in balance sheet total and a
corresponding reduction in the equity ratio of the PUMA Group. In addition, the nature of the expenses arising from these leases will change, as IFRS 16 replaces the operating lease expenses previously
recognized on a straight-line basis with depreciation of rights of use and interest expenses for liabilities. This will therefore have a positive effect on operating income (EBIT) in the income statement. In addition, IFRS
16 requires the repayment share of lease payments that are not classified as short-term or low-value leases
to be shown as part of the cash flow from financing activities, with the result that the cash flow from operating activities will improve.
This year, a project group was set up to deal intensively with the effects and implementation of the new
requirements during the course of the project. The quantitative effects on the PUMA consolidated financial statements cannot yet be reliably described. The current operating lease volume is shown under Note 28
(Other Financial Obligations: Obligations from Operating Leases). It is currently expected that the conversion
effect will mainly affect the properties leased by PUMA (retail, offices and warehouses).
The company does not anticipate the remaining standards mentioned above to have a significant impact on
the consolidated financial statements.
The preparation of the consolidated financial statements was based on historical acquisition and manufacturing costs, with the exception of the profit or loss assessment of financial assets and liabilities at
fair value.
The items contained in the financial statements of the individual Group companies are measured based on
the currency that corresponds to the currency of the primary economic environment in which the company operates. The consolidated financial statements are prepared in Euros (EUR or €). The presentation of
amounts in millions of Euros with one decimal place may lead to rounding differences since the calculation of
individual items is based on figures presented in thousands.
The cost of sales method is used for the income statement.

9
2. Significant Consolidation, Accounting and Valuation Principles Consolidation Principles
The consolidated financial statements were prepared as of December 31, 2017, the reporting date of the
annual financial statements of the PUMA SE parent company, on the basis of uniform accounting and valuation principles according to IFRS, as applied in the EU.
Subsidiaries are companies in which the Group has existing rights that give it the current ability to direct the
relevant activities. The main activities are those that have a significant influence on the profitability of the company. Control is therefore considered to exist if the Group is exposed to variable returns from its
relationship with a company and has the power to govern those returns through its control of the relevant
activities. As a rule, control is based on PUMA's direct or indirect majority of the voting rights. Consolidation begins at the point in time from which control is possible. It ends when this no longer exists.
The capital consolidation of the subsidiaries acquired after January 1, 2005 is based on the acquisition
method. Upon initial consolidation, the assets, debts and contingent liabilities that can be identified as part
of a business combination are stated at their fair value as of the acquisition date, regardless of the non-controlling interests (previously referred to as minority interest). At the time of the acquisition, there is a
separately exercisable right to vote on whether the interests of the non-controlling shareholders are valued at fair value or at proportional net asset value.
The surplus of the acquisition costs arising from the purchase that exceeds the Group’s share in the net assets stated at fair value is reported as goodwill. If the acquisition costs are lower than the amount of the
net assets stated at fair value, the difference is reported directly in the income statement.
Pursuant to the contractual arrangement with the “joint venture partners”, PUMA is already the beneficial owner of controlling interests. The companies are fully included in the consolidated financial statements and,
therefore, non-controlling interests are not disclosed. The present value of the capital shares attributable to
the non-controlling shareholders and the present value of the residual purchase prices expected due to corporate performance are included in the capital consolidation as acquisition costs for the holdings. If there
are any subsequent deviations, for acquisitions before January 1, 2010, these lead to a subsequent adjustment of the acquisition costs not affecting income. For business combinations as of January 1, 2010,
the costs that can be directly allocated to the acquisition as well as subsequent deviations in the present
value of expected residual purchase prices are recognized in the income statement pursuant to the application of the amended IFRS 3.
With respect to the remaining controlling interests, losses attributable to non-controlling interests are
allocated to the latter even if this results in a negative balance in non-controlling interests.
Receivables within the Group are offset against internal liabilities. As a general rule, any set-off differences
arising from exchange rate fluctuations are recognized in the income statement to the extent that they accrued during the reporting period. If receivables and liabilities are long-term and capital-replacing in
nature, the currency difference is recognized directly in equity and under Other Comprehensive Income.
In the course of the expense and income consolidation, inter-company sales and intra-group income are
offset against the expenses attributable to them. Interim profits not yet realized within the Group as well as intra-group investment income are eliminated by crediting them in the income statement.

10
Group of consolidated companies
In addition to PUMA SE, the consolidated financial statements include all subsidiaries in which PUMA SE directly or indirectly holds existing rights that give it the current ability to direct the relevant activities. At
present, control of all Group companies is based on a direct or indirect majority of voting rights. Associated companies are accounted for in the Group using the equity method. The changes in the number of Group
companies (including the parent company PUMA SE) were as follows:
As of 12/31/2016 108
Formation of companies
2
As of 12/31/2017 110
The following changes occurred within the group of consolidated companies in financial year 2017:
The additions to the group of consolidated companies relate to the establishment of the companies PUMA
North America Accessories Canada, LLC and Dobotex Nordic AB.
Furthermore, the company PUMA Information Technology Services Philippines Company Limited Inc. was
renamed PUMANILA IT Services Inc. during the financial year.
These changes in the group of consolidated companies did not have a significant effect on the net assets, financial position and results of operations.
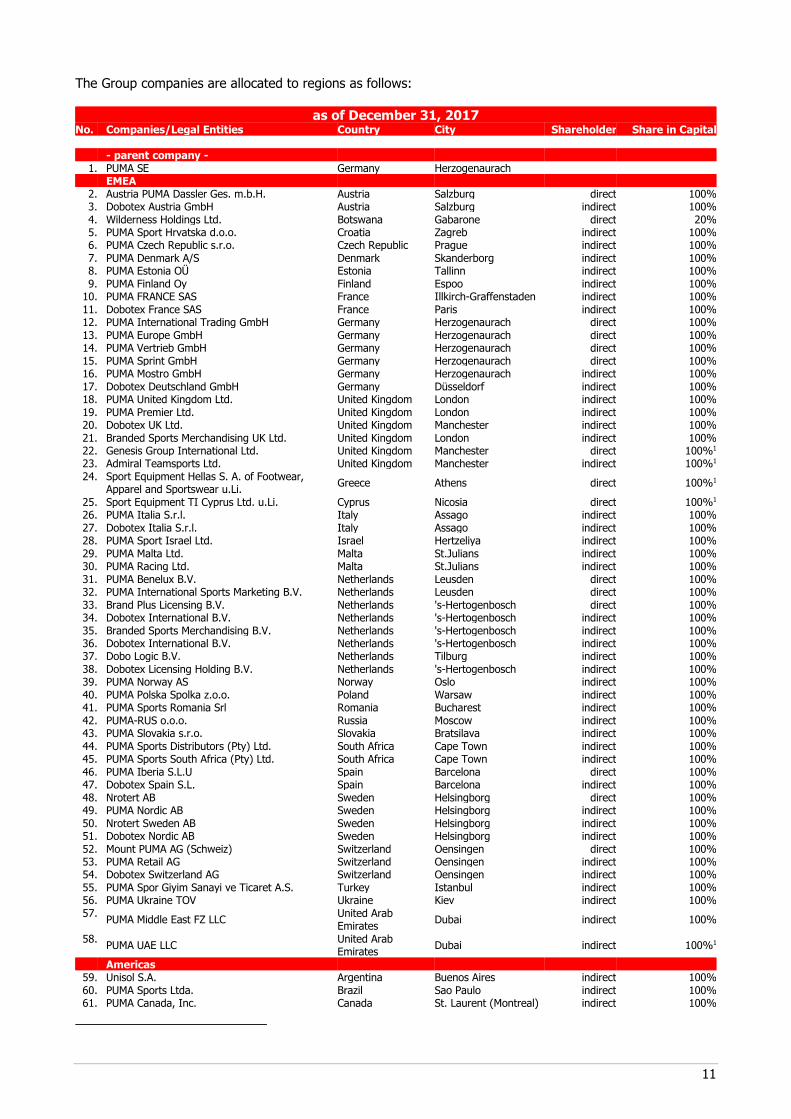
11
The Group companies are allocated to regions as follows:
as of December 31, 2017
No. Companies/Legal Entities Country City Shareholder Share in Capital - parent company -
1.
PUMA SE Germany Herzogenaurach
EMEA 2.
Austria PUMA Dassler Ges. m.b.H. Austria Salzburg direct 100%
3.
Dobotex Austria GmbH Austria Salzburg indirect 100% 4.
Wilderness Holdings Ltd. Botswana Gabarone direct 20%
5.
PUMA Sport Hrvatska d.o.o. Croatia Zagreb indirect 100% 6.
PUMA Czech Republic s.r.o. Czech Republic Prague indirect 100%
7.
PUMA Denmark A/S Denmark Skanderborg indirect 100% 8.
PUMA Estonia OÜ Estonia Tallinn indirect 100%
9.
PUMA Finland Oy Finland Espoo indirect 100% 10.
PUMA FRANCE SAS France Illkirch-Graffenstaden indirect 100%
11.
Dobotex France SAS France Paris indirect 100% 12.
PUMA International Trading GmbH Germany Herzogenaurach direct 100%
13.
PUMA Europe GmbH Germany Herzogenaurach direct 100% 14.
PUMA Vertrieb GmbH Germany Herzogenaurach direct 100%
15.
PUMA Sprint GmbH Germany Herzogenaurach direct 100% 16.
PUMA Mostro GmbH Germany Herzogenaurach indirect 100%
17.
Dobotex Deutschland GmbH Germany Düsseldorf indirect 100% 18.
PUMA United Kingdom Ltd. United Kingdom London indirect 100%
19.
PUMA Premier Ltd. United Kingdom London indirect 100% 20.
Dobotex UK Ltd. United Kingdom Manchester indirect 100%
21.
Branded Sports Merchandising UK Ltd. United Kingdom London indirect 100% 22.
Genesis Group International Ltd. United Kingdom Manchester direct 100%1
23.
Admiral Teamsports Ltd. United Kingdom Manchester indirect 100%1 24.
Sport Equipment Hellas S. A. of Footwear, Apparel and Sportswear u.Li.
Greece Athens direct 100%1
25.
Sport Equipment TI Cyprus Ltd. u.Li. Cyprus Nicosia direct 100%1 26.
PUMA Italia S.r.l. Italy Assago indirect 100%
27.
Dobotex Italia S.r.l. Italy Assago indirect 100% 28.
PUMA Sport Israel Ltd. Israel Hertzeliya indirect 100%
29.
PUMA Malta Ltd. Malta St.Julians indirect 100% 30.
PUMA Racing Ltd. Malta St.Julians indirect 100%
31.
PUMA Benelux B.V. Netherlands Leusden direct 100% 32.
PUMA International Sports Marketing B.V. Netherlands Leusden direct 100%
33.
Brand Plus Licensing B.V. Netherlands 's-Hertogenbosch direct 100% 34.
Dobotex International B.V. Netherlands 's-Hertogenbosch indirect 100%
35.
Branded Sports Merchandising B.V. Netherlands 's-Hertogenbosch indirect 100% 36.
Dobotex International B.V. Netherlands 's-Hertogenbosch indirect 100%
37.
Dobo Logic B.V. Netherlands Tilburg indirect 100% 38.
Dobotex Licensing Holding B.V. Netherlands 's-Hertogenbosch indirect 100%
39.
PUMA Norway AS Norway Oslo indirect 100% 40.
PUMA Polska Spolka z.o.o. Poland Warsaw indirect 100%
41.
PUMA Sports Romania Srl Romania Bucharest indirect 100% 42.
PUMA-RUS o.o.o. Russia Moscow indirect 100%
43.
PUMA Slovakia s.r.o. Slovakia Bratsilava indirect 100% 44.
PUMA Sports Distributors (Pty) Ltd. South Africa Cape Town indirect 100%
45.
PUMA Sports South Africa (Pty) Ltd. South Africa Cape Town indirect 100% 46.
PUMA Iberia S.L.U Spain Barcelona direct 100%
47.
Dobotex Spain S.L. Spain Barcelona indirect 100% 48.
Nrotert AB Sweden Helsingborg direct 100%
49.
PUMA Nordic AB Sweden Helsingborg indirect 100% 50.
Nrotert Sweden AB Sweden Helsingborg indirect 100%
51.
Dobotex Nordic AB Sweden Helsingborg indirect 100% 52.
Mount PUMA AG (Schweiz) Switzerland Oensingen direct 100%
53.
PUMA Retail AG Switzerland Oensingen indirect 100% 54.
Dobotex Switzerland AG Switzerland Oensingen indirect 100%
55.
PUMA Spor Giyim Sanayi ve Ticaret A.S. Turkey Istanbul indirect 100% 56.
PUMA Ukraine TOV Ukraine Kiev indirect 100%
57.
PUMA Middle East FZ LLC United Arab Emirates
Dubai indirect 100%
58.
PUMA UAE LLC United Arab Emirates
Dubai indirect 100%1
Americas 59.
Unisol S.A. Argentina Buenos Aires indirect 100%
60.
PUMA Sports Ltda. Brazil Sao Paulo indirect 100% 61.
PUMA Canada, Inc. Canada St. Laurent (Montreal) indirect 100%

12
62.
PUMA CHILE S.A. Chile Santiago direct 100% 63.
PUMA SERVICIOS SPA Chile Santiago indirect 100%
64.
PUMA México Sport, S.A. de C.V. Mexico Mexico City direct 100% 65.
Servicios Profesionales RDS, S.A. de C.V. Mexico Mexico City indirect 100%
66.
Importaciones RDS, S.A. de C.V. Mexico Mexico City direct 100% 67.
Dobotex de México, S.A. de C.V. Mexico Mexico City indirect 100%
68.
Importationes Brand Plus Licensing, S.A. de C.V. Mexico Mexico City indirect 100% 69.
Distribuidora Deportiva PUMA S.A.C. Peru Lima indirect 100%
70.
Distribuidora Deportiva PUMA Tacna S.A.C. Peru Tacna indirect 100% 71.
PUMA Retail Peru S.A.C Peru Lima indirect 100%
72.
PUMA Sports LA S.A. Uruguay Montevideo direct 100% 73.
PUMA Suede Holding, Inc. USA Westford indirect 100%
74.
PUMA North America, Inc. USA Westford indirect 100% 75.
Cobra Golf Incorporated USA Carlsbad indirect 100%
76. PUMA Accessories North America, LLC USA New York indirect 85% 77. PUMA North America Accessories Canada, LLC USA New York indirect 85% 78. Janed, LLC USA New York indirect 51% 79.
Janed Canada, LLC USA New York indirect 51%
80. PUMA Kids Apparel North America, LLC USA New York indirect 51% 81.
PUMA Kids Apparel Canada, LLC USA New York indirect 51%
Asia/Pacific
82.
PUMA Australia Pty. Ltd. Australia Melbourne indirect 100% 83.
White Diamond Australia Pty. Ltd. Australia Melbourne indirect 100%
84.
White Diamond Properties Pty. Ltd. Australia Melbourne indirect 100% 85.
Kalola Pty. Ltd. Australia Melbourne indirect 100%
86.
Liberty China Holding Ltd. British Virgin Islands Road Town, Tortola indirect 100% 87.
PUMA China Ltd. China Shanghai indirect 100%
88.
Dobotex China Ltd. China Shanghai indirect 100% 89.
Guangzhou World Cat Information Consulting Services Company Ltd.
China Guangzhou indirect 100%
90.
World Cat Ltd. Hong Kong
direct 100% 91.
Development Services Ltd. Hong Kong
direct 100%
92.
PUMA International Trading Services Ltd. Hong Kong
indirect 100% 93.
PUMA Asia Pacific Ltd. Hong Kong
direct 100%
94.
PUMA Hong Kong Ltd. Hong Kong
indirect 100% 95.
Dobotex Ltd. Hong Kong
indirect 100%
96.
PUMA Sports India Private Ltd. India Bangalore indirect 100% 97.
PUMA India Corporate Services Private Ltd. India Bangalore indirect 100%
98.
World Cat Sourcing India Private Ltd. India Bangalore indirect 100% 99.
PT PUMA Cat Indonesia Ltd. Indonesia Jakarta indirect 100%
100.
PUMA JAPAN K.K. Japan Tokyo indirect 100% 101.
PUMA Korea Ltd. Korea (South) Seoul direct 100%
102.
Dobotex Korea Ltd. Korea (South) Seoul indirect 100% 103.
PUMA Sports Goods Sdn. Bhd. Malaysia Kuala Lumpur indirect 100%
104.
PUMA New Zealand Ltd. New Zealand Auckland indirect 100% 105.
PUMANILA IT Services Inc. Philippines Manila indirect 100%
106.
PUMA Sports SEA Trading Pte. Ltd. Singapore
indirect 100% 107.
PUMA SEA Holding Pte. Ltd. Singapore
indirect 100%
108.
PUMA Taiwan Sports Ltd. Taiwan Taipei indirect 100% 109.
World Cat Vietnam Co. Ltd. Vietnam Long An Province indirect 100%
110.
World Cat Vietnam Sourcing & Development Services Co. Ltd. Vietnam
Ho Chi Minh City indirect 100%
1 Subsidiaries which are assigned to be economically 100% PUMA Group
PUMA Vertrieb GmbH, PUMA Mostro GmbH, PUMA Sprint GmbH, PUMA International Trading GmbH and PUMA Europe GmbH have made use of the exemption under Section 264 (3) of the HGB.

13
Currency Conversion
As a general rule, monetary items in foreign currencies are converted in the individual financial statements of the Group companies at the exchange rate valid on the balance sheet date. Any resulting currency gains
and losses are immediately recognized in the income statement. Non-monetary items are converted at historical acquisition and manufacturing costs.
The assets and liabilities of foreign subsidiaries, the functional currency of which is not the Euro, have been converted to Euros at the average exchange rates valid on the balance sheet date. Expenses and income
have been converted at the annual average exchange rates. Any differences resulting from the currency conversion of net assets relative to exchange rates that had changed in comparison with the previous year,
were adjusted against equity.
The significant conversion rates per Euro are as follows:
2017 2016
Currency Reporting date exchange rate
Average exchange rate
Reporting date exchange rate
Average exchange rate
USD 1.1993 1.1297 1.0541 1.1069
CNY 7.8044 7.6290 7.3202 7.3522
JPY 135.0100 126.7112 123.4000 120.1967
GBP 0.8872 0.8767 0.8562 0.8195
Derivative Financial Instruments/Hedge Accounting Derivative financial instruments are recognized at fair value at the time a contract is entered into and
thereafter. At the time a hedging instrument is concluded, PUMA classifies the derivatives either as hedges
of a planned transaction (cash flow hedge) or as hedges of the fair value of a recognized asset or liability (fair value hedge).
At the time when the transaction is concluded, the hedging relationship between the hedging instrument and
the underlying transaction as well as the purpose of risk management and the underlying strategy are documented. In addition, assessments as to whether the derivatives used in the hedge accounting
compensate effectively for a change in the fair value or the cash flow of the underlying transaction are
documented at the beginning of and continuously after the hedge accounting.
Changes in the market value of derivatives that are intended and suitable for cash flow hedges and that prove to be effective are adjusted against equity, taking into account deferred taxes. If there is no complete
effectiveness, the ineffective part is recognized in the income statement. The amounts recognized in equity
are recognized in the income statement during the same period in which the hedged planned transaction affects the income statement. If, however, a hedged future transaction results in the recognition of a non-
financial asset or a liability, gains or losses previously recorded in equity are included in the initial valuation of the acquisition costs of the respective asset or liability.
Changes in the fair value of derivatives that qualify for and are designated as fair value hedges are recognized directly in the consolidated income statement, together with changes in the fair value of the
underlying transaction attributable to the hedged risk. The changes in the fair value of the derivatives and the change in the underlying transaction attributable to the hedged risk are reported in the consolidated
income statement under the item relating to the underlying transaction.
The fair values of the derivative instruments used to hedge planned transactions and to hedge the fair value
of a recognized asset or liability are shown under other current financial asserts or other current financial liabilities.
Leasing
Leases are to be classified either as finance leases or operating leases. Leases where the Company, in its
capacity as the lessee, is responsible for all significant opportunities and risks that arise from the use of the lease object are treated as finance leases. All other leases are classified as operating leases. The lease
payments from operating leases are recorded as an expense over the term of the contract.

14
Cash and Cash Equivalents
Cash and cash equivalents include cash and bank balances. To the extent that bank deposits are not immediately required to finance current assets, they are invested as risk-free fixed-term deposits, presently
for a term of three months. The total amount of cash and cash equivalents is consistent with the cash and cash equivalents stated in the cash flow statement.
Inventories Inventories are valued at acquisition or manufacturing costs or at the lower net realizable values derived
from the selling price on the balance sheet date. As a general rule, the acquisition cost of the merchandise is determined using the average cost method. Value adjustments are adequately recorded, depending on age,
seasonality and realizable market prices, in a manner that is standard throughout the Group.
Receivables and Other Assets
Receivables and other assets are initially stated at fair value, taking into account transaction costs, and subsequently valued at amortized costs after deduction of value adjustments. In the case of value
adjustments, all identifiable risks in the form of an individual risk assessment are adequately taken into account on the basis of empirical values and, if credit insurance exists, this is also included in the amount of
the value adjustment.
Adjustments are conducted in principle if, after the entry record of the financial asset, there are objective
indications for an adjustment, which has an effect on the expected future cash flow from that financial instrument. Significant financial difficulties of a debtor, an increased probability that a creditor becomes
insolvent or enters into a clean-up procedure, as well as a breach of contract, e.g. a cancellation or delay in
interest or amortization payments, all count as indicators for an existing adjustment. The amount of the adjustment loss corresponds to the difference between the carrying amount and the cash value of the
expected cash flows.
The non-current assets contain loans and other assets. Non-taxable non-current assets are discounted in principle at cash value if the resulting effect is significant.
Non-current investments The investments reported under non-current financial assets are classified as "available for sale". This
category includes financial instruments that do not represent loans and receivables or held-to-maturity investments and are not measured at fair value through profit or loss. The categories "held-to-maturity
investments" and "financial assets at fair value through profit or loss" are not applied within the PUMA
Group.
All purchases and disposals of non-current investments are recorded on the trade date. Non-current investments are initially recognized at fair value plus transaction costs. They are also recognized at fair value
in subsequent periods if this can be reliably determined. Unrealized gains and losses are recognized in the
overall result, taking into account deferred taxes. The gain or loss on disposal of long-term investments is recognized in profit or loss.
If there is material objective evidence of impairment of the non-current investments, they are written down
in the income statement. In the case of equity investments categorized as available-for-sale, a significant or prolonged decline in the fair value of the assets below their acquisition cost is to be regarded as objective
evidence of impairment. The same applies if there is no longer an active market for listed shares.
Property, Plant and Equipment
Property, plant and equipment are stated at acquisition costs, net of accumulated depreciation. The depreciation period depends on the expected useful life of the respective item. The straight-line method of
depreciation is applied. The useful life depends on the type of the assets involved. Buildings are subject to a
useful life of between ten and fifty years, and a useful life of between three to ten years is assumed for moveable assets. The acquisition costs of property, plant and equipment also include interest on borrowings
in accordance with IAS 23, insofar as these accrue and the effect is significant.
Repair and maintenance costs are recorded as an expense as of the date on which they were incurred. Substantial improvements and upgrades are capitalized to the extent that the criteria for capitalization of an
asset item apply.
15
As a general rule, lease objects, the contractual basis of which is to be classified as a finance lease are
shown under property, plant and equipment; initially they are accounted for at fair value or the lower present value of the minimum lease payments and net of accumulated depreciation in subsequent
accounting periods.
Goodwill
Goodwill resulting from a business acquisition is calculated based on the difference between the purchase price and the fair value of the acquired asset and liability items. Goodwill from acquisitions is largely
attributable to the intangible infrastructure acquired and the associated opportunity to make a positive contribution to corporate value.
Goodwill amounts are allocated to the Group’s cash-generating units that are expected to benefit from the synergy effects resulting from the business combination.
An impairment test of goodwill per cash-generating unit (usually the countries) is performed once a year as
well as whenever there are indicators of impairment and can result in an impairment loss. There is no reversal of an impairment loss for goodwill.
Other Intangible Assets Acquired intangible assets largely consist of concessions, intellectual property rights and similar rights. These
are valued at acquisition costs, net of accumulated amortization. The useful life of intangible assets is between three and ten years. Depreciation is done on a straight-line basis.
If the capitalization requirements of IAS 38.57 "Intangible Assets" are met cumulatively, expenses in the development phase for internally generated intangible assets are capitalized at the time they arise. In
subsequent periods, internally generated intangible assets and acquired intangible assets are measured at cost less accumulated amortization and impairment losses. In the Group, own work capitalized is generally
depreciated on a straight-line basis over a useful life of 3 years.
The item also includes acquired trademark rights, which are assumed to have an indefinite useful life in light
of the history of the brands and due to the fact that the brands are continued by PUMA.
Impairment of Assets Intangible assets with an indefinite useful life are not written down according to schedule, but are subjected
to an annual impairment test. Property, plant and equipment and other intangible assets with finite useful
lives are tested for impairment if there is any indication of impairment in the value of the asset concerned. In order to determine whether there is a requirement to record the impairment of an asset, the recoverable
amount of the respective asset (the higher amount of the fair value less costs to sell and value in use) is compared with the carrying amount of the asset. If the recoverable amount is lower than the carrying
amount, the difference is recorded as an impairment loss. The test for impairment is performed, if possible,
at the level of the respective individual asset, otherwise at the level of the cash-generating unit. Goodwill, on the other hand, is tested for impairment only at the cash-generating unit level. If it is determined within the
scope of the impairment test that an asset needs to be written down, then the goodwill, if any, of the cash- generating unit is written down initially and, in a second step, the remaining amount is distributed
proportionately over the remaining assets. If the reason for the recorded impairment no longer applies, a reversal of impairment loss is recorded to the maximum amount of the written down cost. There is no
reversal of an impairment loss for goodwill.
Impairment tests are performed using the discounted cash flow method. For determining the fair value less
costs to sell and value in use, the expected cash flows are based on corporate planning data. Expected cash flows are discounted using an interest rate in line with market conditions.
Holdings in associated companies Associated companies represent shareholdings, over which PUMA has a significant influence, but which do
not qualify as subsidiaries or joint ventures. Significant influence is generally assumed when PUMA holds, directly or indirectly, at least 20 percent, but less than 50 percent, of the voting rights.
Holdings in associated companies are accounted for using the equity method. Here, the shares are initially
recognized at their acquisition cost and are subsequently adjusted for the pro rata changes in the Company’s
net assets that are attributable to PUMA. Any recognized goodwill is shown in the carrying amount of the associated company.

16
Within the scope of the impairment test, the carrying amount of a company valued at equity is compared
with its recoverable amount provided that there is an indication that the asset has decreased in value. If the recoverable amount is lower than the carrying amount, the difference is recorded as an impairment loss. If
the reasons for the previously recorded impairment no longer apply, a write-up is recognized in the income statement.
Financial Debt, Other Financial Liabilities and Other Liabilities As a general rule, these entries are recognized at their acquisition cost, taking into account transaction costs
and subsequently recognized at amortized cost. Non-interest or low-interest-bearing liabilities with a term of at least one year are recognized at present value, taking into account an interest rate in line with market
conditions, and are compounded until their maturity at their repayment amount. Liabilities from finance
lease agreements are recorded as of the beginning of the lease transaction at the amount of the present value of the minimum lease amount, or at the lower fair value, and are adjusted by the repayment amount
of the lease installments.
As a general rule, current financial liabilities also include those long-term loans that that have a maximum residual term of up to one year.
Provisions for Pensions and Similar Obligations In addition to defined benefit plans, some companies apply defined contribution plans, which do not result in
any additional pension commitment other than the current contributions. The pension provision under defined benefit plans is generally calculated using the projected unit credit method. This method takes into
account not only known pension benefits and pension rights accrued as of the reporting date, but also
expected future salary and pension increases. The defined benefit obligation (DBO) is calculated by discounting expected future cash outflows at the rate of return on senior, fixed-rate corporate bonds. The
currencies and maturity periods of the underlying corporate bonds are consistent with the currencies and maturity periods of the obligations to be satisfied. In some of the plans, the obligation is accompanied by a
plan asset. In that case, the pension provision shown is reduced by the plan asset.
Revaluations, consisting of actuarial profits and losses, changes resulting from use of the asset ceiling and
return on plan assets (without interest on the net debt) are immediately recorded under Other Comprehensive Income. The revaluations recorded in Other Comprehensive Income are part of the retained
earnings and are no longer reclassified into calculation of profit and loss. Past service costs are recorded as an expense if changes are made to the plan.
Other Provisions Provisions are recognized if the Group, as a result of a past event, has a current obligation and this
obligation is likely to result in an outflow of resources with economic benefits, the amount of which can be reliably estimated. The provisions are recognized at their settlement value as determined on the basis of the
best possible assessment and are not offset by income. Provisions are discounted if the resulting effect is
significant.
Provisions for the expected expenses from warranty obligations pursuant to the respective national sales contract laws are recognized at the time of sale of the relevant products, according to the best estimate in
relation to the expenditure needed in order to fulfill the Group’s obligation.
Provisions are also recognized to account for onerous contracts. An onerous contract is assumed to exist
where the unavoidable costs for fulfilling the contract exceed the economic benefit arising from this contract.
Provisions for restructuring measures are also recorded if a detailed, formal restructuring plan has been produced, which has created a justified expectation that the restructuring measures will be carried out by
those concerned due to its implementation starting or its major components being announced.
Treasury shares
Treasury stock is deducted from equity at its market price as of the date of acquisition, plus incidental acquisition costs. Pursuant to the authorization of the Annual General Meeting, treasury stock can be
repurchased for any authorized purpose, including the flexible management of the Company's capital requirements.

17
Equity Compensation Plans/Management Incentive Program
In accordance with IFRS 2, stock-based compensation systems are recognized at fair value and recorded under personnel costs. PUMA has stock-based compensation systems in the form of stock options (SOP)
involving compensation in shares and in the form of virtual shares with cash compensation.
The expenses associated with the SOP are determined from the fair value of the options as of the grant
date, without taking into account the impact of non-market-oriented exercise hurdles (e.g. forfeited options if the eligible employee leaves the company prematurely). The expense is recorded by distributing it as
personnel costs over the vesting period until the options are vested and is recognized as a capital reserve. Non-market-oriented exercise hurdles are adjusted in accordance with current expectations and the
assessment of expected exercisable options is reviewed on each balance sheet date. The resulting gains and
losses are recognized in the income statement and recorded through a corresponding adjustment in equity over the remaining period up to the vesting date.
For share-based remunerations with cash compensation, a liability is recorded for the services received and
measured with its fair value upon addition. Until the debt is cleared, its fair value is recalculated on every balance sheet date and on the settlement date and all changes to the fair value are recognized in the
income statement.
Recognition of Sales Revenues
Revenues from the sale of products (sales revenues) are recognized at the time of the transfer of the significant opportunities and risks associated with the ownership of the goods and products sold to the buyer
if it is likely that the Group will derive the economic benefit from the sale. The amount of the recognized
sales revenues is based on the fair value of the consideration received or to be received, taking into account returns, discounts and rebates.
Royalty and Commission Income
Income from royalties is recognized in the income statement in accordance with the invoices to be submitted by the license holders. In certain cases, values must be estimated in order to permit accounting on an
accrual basis. Commission income is invoiced if the underlying purchase transaction is classified as realized.
Advertising and Promotional Expenses
Advertising expenses are recognized in the income statement as of the date of their accrual. As a general rule, promotional expenses stretching over several years are recognized as an expense over the contractual
term on an accrual basis. Any expenditure surplus resulting from this allocation of expenses after the
balance sheet date are recognized in the form of an impairment of assets or a provision for anticipated losses in the financial statements.
Product Development
PUMA continuously develops new products in order to meet market requirements and market changes.
Research costs are expensed in full at the time they are incurred. Development costs are also recognized as an expense when they do not meet the recognition criteria of IAS 38 "Intangible Assets".
Financial Result
The financial results include the results from associated companies as well as interest income from financial investments and interest expense from loans and financial instruments. Financial results also include interest
expenses from discounted non-current liabilities and from pension provisions that are associated with
acquisitions of business enterprises or arise from the valuation of pension commitments.
Exchange rate effects that can be directly allocated to an underlying transaction are shown in the respective income statement item.
Income Taxes Current income taxes are determined in accordance with the tax regulations of the respective countries
where the Company conducts its operations.

18
Deferred Taxes
Deferred taxes resulting from temporary valuation differences between the IFRS and tax balance sheets of individual Group companies and from consolidation procedures are charged to each taxable entity and
shown either as deferred tax assets or deferred tax liabilities. Deferred tax assets may also include claims for tax reductions that result from the expected utilization of existing losses carried forward to subsequent years
and which is sufficiently certain to materialize. Deferred tax assets or liabilities may also result from
accounting treatments that do not affect net income. Deferred taxes are calculated on the basis of the tax rates that apply to the reversal in the individual countries and that are in force or adopted as of the balance
sheet date.
Deferred tax assets are shown only to the extent that the respective tax advantage is likely to materialize.
Value adjustments are recognized on the basis of the past earnings situation and the business expectations for the foreseeable future, if this criterion is not fulfilled.
Assumptions and Estimates
The preparation of the consolidated financial statements requires some assumptions and estimates that have an impact on the amount and disclosure of the recognized assets and liabilities, income and expenses, as
well as contingent liabilities. The assumptions and estimates are based on premises, which in turn are based
on currently available information. In individual cases, the actual values may deviate from the assumptions and estimates made; as a result there is a risk of adjustments to the carrying amount of the assets and
liabilities concerned in future periods. Consequently, future periods involve a risk of adjustment to the carrying amount of the assets and liabilities concerned.
All assumptions and estimates are continuously reassessed. They are based on historical experiences and other factors, including expectations regarding future global and industry-related trends that appear
reasonable under the current circumstances. Assumptions and estimates are made in particular in the measurement of goodwill and brands, pension obligations, derivative financial instruments and taxes. The
most significant forward-looking assumptions and sources of estimation and uncertainty as of the reporting date concerning the above-mentioned items are discussed below.
Goodwill and Brands A review of the impairment of goodwill is based on the calculation of the value in use. In order to calculate
the value in use, the Group must estimate the future cash flows from those cash-generating units to which the goodwill is allocated. To this end, the data used were from the three-year plan, which is based on
forecasts of the overall economic development and the resulting industry-specific consumer behavior.
Another key assumption concerns the determination of an appropriate interest rate for discounting the cash flow to present value (discounted cash flow method). The “Relief from royalty method” is used to value
brands. See paragraph 10 for further information, in particular regarding the assumptions used for the calculation.
Pension Obligations Pension obligations are determined using an actuarial calculation. This calculation is contingent on a large
number of factors that are based on assumptions and estimates regarding the discount rate, the expected return on plan assets, future wage and salary increases, mortality and future pension increases. Due to the
long-term nature of the commitments made, the assumptions are subject to significant uncertainties. Any change in these assumptions has an impact on the carrying amount of the pension obligations. The Group
determines at the end of each year the discount rate applied to determine the present value of future
payments. This discount rate is based on the interest rates of corporate bonds with the highest credit rating that are denominated in the currency in which the benefits are paid and the maturity of which corresponds
to that of the pension obligations. See paragraph 15 for further information, in particular regarding the parameters used for the calculation.

19
Taxes
Tax items are determined taking into account the various prevailing local tax laws and the relevant administrative opinions and, due to their complexity, may be subject to different interpretations by persons
subject to tax on the one hand and the tax authorities on the other hand. Differing interpretations of tax laws may result in subsequent tax payments for past years; depending on the management’s assessment,
these differing opinions may be taken into account.
The recognition of deferred taxes, in particular with respect to tax losses carried forward, requires that
estimates and assumptions be made concerning future tax planning strategies as well as expected dates of initial recognition and the amount of future taxable income. The taxable income from the relevant corporate
planning is derived for this judgment. This takes into account the past financial position and the business
development expected in the future. Active deferred tax assets on losses carried forward are recorded in the event of companies incurring a loss only if it is highly likely that future positive income will be achieved that
can be offset against these tax losses carried forward. Please see paragraph 8 for further information and detailed assumptions.
Derivative Financial Instruments
The assumptions used for estimating derivative financial instruments are based on the prevailing market
conditions as of the balance sheet date and thus reflect the fair value. See paragraph 24 for further information.
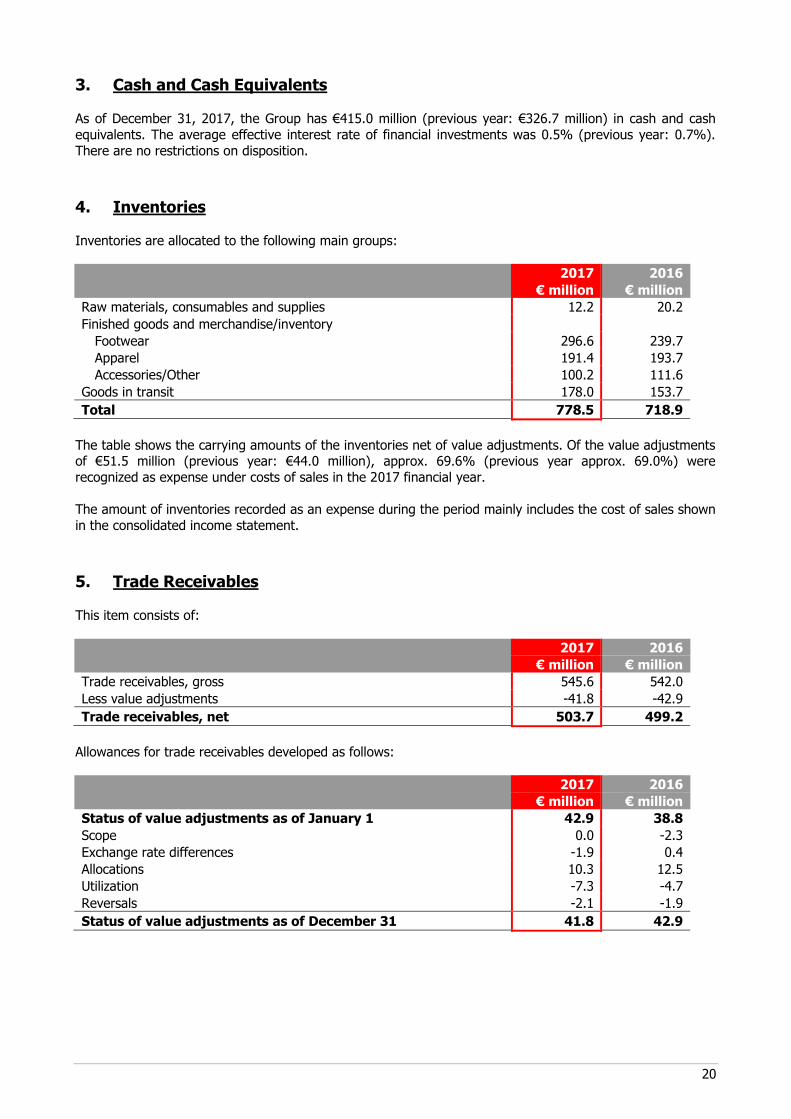
20
3. Cash and Cash Equivalents As of December 31, 2017, the Group has €415.0 million (previous year: €326.7 million) in cash and cash
equivalents. The average effective interest rate of financial investments was 0.5% (previous year: 0.7%).
There are no restrictions on disposition.
4. Inventories
Inventories are allocated to the following main groups:
2017 2016
€ million € million
Raw materials, consumables and supplies 12.2 20.2
Finished goods and merchandise/inventory
Footwear 296.6 239.7
Apparel 191.4 193.7
Accessories/Other 100.2 111.6
Goods in transit 178.0 153.7
Total 778.5 718.9
The table shows the carrying amounts of the inventories net of value adjustments. Of the value adjustments of €51.5 million (previous year: €44.0 million), approx. 69.6% (previous year approx. 69.0%) were
recognized as expense under costs of sales in the 2017 financial year.
The amount of inventories recorded as an expense during the period mainly includes the cost of sales shown
in the consolidated income statement.
5. Trade Receivables
This item consists of:
2017 2016
€ million € million
Trade receivables, gross 545.6 542.0
Less value adjustments -41.8 -42.9
Trade receivables, net 503.7 499.2
Allowances for trade receivables developed as follows:
2017 2016
€ million € million
Status of value adjustments as of January 1 42.9 38.8
Scope 0.0 -2.3
Exchange rate differences -1.9 0.4
Allocations 10.3 12.5
Utilization -7.3 -4.7
Reversals -2.1 -1.9
Status of value adjustments as of December 31 41.8 42.9

21
The age structure of the trade receivables is as follows:
Gross values
2017 Total of which not written down
of which
written down
Not 0–30
days
31–90
days
91–180
days Over
€ million 545.6 382.5 42.8 17.9 4.3 2.7 95.4
Gross values
2016 Total of which not written down of which
written
down
Not 0–30 days
31–90 days
91–180 days
Over
€ million 542.0 370.3 37.8 26.1 6.8 1.0 100.0
With respect to trade receivables that were not written down, PUMA assumes that the debtors will satisfy
their payment obligations.
6. Other Current Financial Assets This item consists of:
2017 2016
€ million € million
Fair value of derivative financial instruments 23.5 78.8
Other financial assets 43.2 35.2
Total 66.7 114.1
The amount shown is due within one year. The fair value corresponds to the carrying amount.
The decrease of derivative financial instruments is mainly due to the decline of the US-Dollar exchange rate.
7. Other Current Financial Assets This item consists of:
2017 2016
€ million € million
Prepaid expense relating to the subsequent period 42.8 31.6
Other receivables 51.3 37.6
Total 94.1 69.2
The amount shown is due within one year. The fair value corresponds to the carrying amount.
Other receivables mainly include VAT receivables amounting to €35.9 million (previous year: €17.8 million).

22
8. Deferred Taxes Deferred taxes relate to the items shown below:
2017 2016
€ million € million
Tax loss carryforwards 92.2 110.3
Non-current assets 29.0 30.7
Current assets 43.5 38.0
Provisions and other liabilities 60.2 65.7
Deferred tax assets (before netting) 224.8 244.8
Non-current assets 42.1 65.9
Current assets 5.6 8.8
Provisions and other liabilities 6.8 3.7
Deferred tax liabilities (before netting) 54.5 78.4
Deferred tax assets, net 170.4 166.4
€97.9 million of the deferred tax assets are current (previous year: €85.3 million) and €10.7 million of the deferred tax liabilities are current (previous year: €11.3 million).
As at December 31, 2017, tax losses carried forward amounted to a total of €542.9 million (previous year:
€596.9 million). This results in a deferred tax asset of €148.2 million (previous year: €171.8 million). Deferred tax liabilities were recognized for these items in the amount at which the associated tax
advantages are likely to be realized in the form of future profits for income tax purposes. As a result
deferred tax assets of €56.0 million for tax loss carryforwards (previous year: €61.5 million) were not recognized; of this amount €54.4 million (previous year: €59.3 million) are vested, but €13.4 million
(previous year: €13.4 million) can never be used due to a lack of future expectations. The remaining unrecognized deferred tax assets of €1.6 million will expire within the next seven years.
In addition, no deferred taxes were recognized for deductible temporary differences amounting to €13.9 million (previous year: €5.0 million).
The effects of the US tax reform finally resolved at the end of 2017 on tax loss carryforwards and temporary
differences were taken into account when measuring deferred tax assets and liabilities as of December 31,
2017. Due to the tax rate reduction, an adjustment of €0.9 million was recorded in the income statement.
Deferred tax liabilities for withholding taxes from possible dividends on retained earnings of subsidiaries that serve to cover the financing needs of the respective company were not accumulated, since it is most likely
that such temporary differences will not be cleared in the near future.
Deferred tax assets and liabilities are netted if they relate to a taxable entity and can in fact be netted.
Accordingly, they are shown in the balance sheet as follows:
2017 2016
€ million € million
Deferred tax assets 207.9 229.5
Deferred tax liabilities 37.6 63.1
Deferred tax assets, net 170.4 166.4
The changes in deferred tax assets were as follows:
2017 2016
€ million € million
Deferred tax assets, previous year 229.5 219.8
Recognition in the income statement -11.5 4.2
Adjustment against Other Comprehensive Income -10.0 5.4
Deferred tax assets 207.9 229.5

23
The changes in deferred tax liabilities were as follows:
2017 2016
€ million € million
Deferred tax liabilities, previous year 63.1 64.2
Recognition in the income statement -19.0 -3.6
Adjustment against Other Comprehensive Income -6.5 2.4
Deferred tax liabilities 37.6 63.1
9. Property, Plant and Equipment Property, plant and equipment at their carrying amounts consist of:
2017 2016
€ million € million
Land and buildings, including buildings on
third-party land 89.7 108.4
Technical equipment and machinery 10.1 10.4
Other equipment, factory and office equipment 122.0 116.1
Assets under construction 38.3 17.3
Total 260.1 252.1
The carrying amount of property, plant and equipment is derived from the acquisition costs. Accumulated
depreciation of property, plant and equipment amounted to €289.5 million (previous year: €307.5 million).
Other equipment, operating and office equipment includes leased assets (finance leases) amounting to €0.2 million (previous year: €0.3 million) and in technical equipment and machinery, €0.4 million (previous year:
€0.5 million) relates to finance leases.
The changes in property, plant and equipment in the 2017 financial year are shown in “Changes in Fixed
Assets” in Appendix 1 to the notes of the consolidated financial statemens. As in the previous year, there were no impairment expenses that exceed current depreciation during the reporting year.
10. Intangible Assets
This item mainly includes goodwill, intangible assets with indefinite useful lives and assets associated with the Company’s own retail activities.
Goodwill and intangible assets with indefinite useful lives are not amortized according to schedule.
Impairment tests were performed in the past financial year using the discounted cash flow method. These
was based on data from the respective three-year plan. The recoverable amount was determined on the basis of the value in use. This did not result in an impairment loss.
The cash-generating unit 'CPG – Cobra PUMA Golf' includes intangible assets in association with the Cobra
brand, with an indefinite useful life of €118.6 million (previous year: €134.9 million). The carrying amount of the Cobra brand is significant in comparison to the overall carrying amount of the intangible assets with an
indefinite useful life. This is allocated to the Central Unit segment. The recoverable amount of the Cobra
brand (level 3) was determined using the relief from royalty method. A discount rate of 7.3% p.a. was applied (previous year: 6.8% p.a.) and, unchanged from the previous year, a license rate of 8% and a 3%
growth rate were used.
In 2017, development costs in connection with COBRA brand golf clubs amounting to €1.8 million (previous
year: €1.9 million) were capitalized. Development costs are allocated to the item "Other Intangible Assets" in "Changes in Fixed Assets". Current amortization of development costs amounted to €0.6 million in 2017
(previous year: €0.0 million).

24
The changes in intangible assets in the 2017 financial year are shown in “Changes in Fixed Assets” of
Appendix 1 to the notes of the consolidated financial statemens. Other intangible assets include advance payments in the amount of €8.7 million (previous year: €2.0 million).
Current amortization of intangible assets amounting to €14.3 million (previous year: €11.3 million) are
included in Other operating expenses. Distribution expenses accounted for €2.1 million of this amount
(previous year: €2.2 million), €0.1 million was attributable to product management/merchandising expenses (previous year: €0.0 million), €0.6 million to development (previous year: €0.0 million) and
€ 11.5 million to administrative and general expenses (previous year: €9.1 million). As in the previous year, there were no impairment expenses that exceed current depreciation.
Goodwill is allocated to the Group’s identifiable cash-generating units (CGUs) according to the country where the activity is carried out. Summarized by regions, goodwill is allocated as follows:
2017 2016
€ million € million
PUMA UK 1.6 1.7
PUMA South Africa 2.4 2.5
Dobotex 139.4 139.4
Genesis 6.9 7.1
Subtotal EMEA 150.3 150.6
PUMA Canada 9.5 10.0
PUMA Argentina 14.6 16.6
PUMA Chile 0.5 0.5
PUMA Mexico 9.6 10.5
Janed 1.8 2.1
Subtotal Americas 36.0 39.7
PUMA Japan 40.6 44.4
PUMA China 2.5 2.5
PUMA Taiwan 12.6 13.2
Subtotal Asia/Pacific 55.7 60.1
Total 241.9 250.4
Assumptions used in conducting the impairment test in 2017:
Tax rate (range) WACC before tax
(range)
WACC after tax (range)
EEA 17.0%-25.0% 8.7%-9.6% 7.6%
EEMEA* 28.0% 17.4% 13.3%
EMEA 17.0%-28.0% 8.7%-17.4% 7.6%-13.3%
North America* 26.4% 8.6% 7.0%
Latin America 25.5%-35.0% 11.0%-26.4% 8.9%-22.7%
Americas 25.5%-35.0% 8.6%-26.4% 7.0%-22.7%
Asia/Pacific 17.0%-30.0% 9.0%-10.7% 7.6%-8.5% * The figures for the EEMEA and North America regions relate to only one cash-generating unit (CGU) each.
The tax rates used for the impairment test correspond to the actual tax rates in the respective countries.
The cost of capital (WACC) was derived from observable market data.
In addition, a growth rate of 3% is generally assumed. A growth rate of less than 3% was only used in
justified exceptional cases.
The cash-generating unit 'Dobotex' includes goodwill of €139.4 million (previous year: €139.4 million), which
is significant in comparison to the total carrying amount of goodwill. The cash-generating unit corresponds to a business area of PUMA which is allocated to the Central Unit. The recoverable amount was determined
by calculating the value in use using a discount rate of 7.6% p.a. (previous year: 6.5% p.a.) and a growth rate of 2% (previous year: 2%).

25
Sensitivity analyses with regard to the impairment tests carried out at the balance sheet date show that an
increase in discount rates of one percentage point each and a reduction in growth rates of one percentage point each result in an indication of impairment with regard to intangible assets with an indefinite or
indefinite useful life of €11.8 million. The corresponding sensitivity analyses with regard to goodwill do not provide any indication of impairment.
The sensitivity analysis with a one percentage point increase in the discount rate and the sensitivity analysis
with a one percentage point reduction of the growth rate do not show any indication of impairment.
The following table contains the assumptions for the performance of the impairment test in the previous year:
Tax rate (range) WACC before tax (range)
WACC after tax (range)
EEA 17.0%-25.0% 8.0%-8.1% 6.5%-7.0%
EEMEA* 28.0% 16.6% 12.7%
EMEA 17.0%-28.0% 8.0%-16.6% 6.5%-12.7%
North America* 26.4% 8.1% 6.5%
Latin America 25.5%-35.0% 10.3%-26.9% 8.3%-23.3%
Americas 25.5%-35.0% 8.1%-26.9% 6.5%-23.3%
Asia/Pacific 16.5%-30.0% 8.5%-9.5% 7.0%-8.3%
* The figures for the EEMEA and North America regions relate to only one cash-generating unit (CGU) each.
A growth rate of 3% was generally assumed, and a growth rate of under 3% has only been used in
exceptional cases where this is justified.
11. Holdings in associated companies
The 19.6% interest in Wilderness Holdings Ltd. is shown under holdings in associated companies. It is accounted for using the equity method, as there is a significant influence. The carrying amount of the shares
amounts to €16.6 million (previous year: €16.5 million).
The following overview shows the aggregated benchmark data of the associated companies recognized at
equity. The values represent the values based on the entire company and do not relate to the shares attributable to the PUMA-Group.
2017 2016
€ million € million
Gains relating to continuing operations 8.3 5.9
Other result -0.1 -0.3
Comprehensive income 8.2 5.6
PUMA’s share of the net earnings of Wilderness Holdings Ltd. amounts to €1.6 million (previous year: €1.2
million). Dividends received amount to €0.8 million (previous year: €0.7 million).
The balance sheet date of Wilderness Holdings Ltd. is February 28, 2017. The above information relates to the Company's financial information as at December 31.

26
12. Other Non-Current Assets Other non-current financial and non-financial assets consist of:
2017 2,016.0
€ million € million
Non-current investments 28.0 24.2
Fair value of derivative financial instruments 1.6 12.9
Other financial assets 22.1 22.6
Total of other non-current financial assets 51.7 59.8
Other non-current non-financial assets 19.8 18.7
Other non-current assets, total 71.5 78.5
The non-current investments relate to the 5.0% shareholding in Borussia Dortmund GmbH & Co.
Kommanditgesellschaft auf Aktien (BVB) with registered office in Dortmund, Germany.
Other financial assets mainly include rental deposits in the amount of €19.2 million (previous year: €19.9
million). The other non-current non-financial assets mainly include deferrals in connection with promotional and advertising agreements.
In the 2017 financial year, there were no indicators of impairment of other non-current assets.
13. Liabilities
The residual terms of liabilities are as follows:
2017 2016
Residual term of Residual term of
Total
up to 1 year
1 to 5 years
over 5 years
Total up to 1
year 1 to 5 years
over 5 years
€ million
€ million € million € million €
million € million € million € million
Financial liabilities 56.8 29.0 27.9 0.0 40.1 25.3 14.8 0.0
Trade payables 646.1 646.1 0.0 0.0 580.6 580.6 0.0 0.0
Liabilities from acquisitions 4.8 0.0 4.8 0.0 5.0 0.0 5.0 0.0
Other liabilities 0.0 0.0 0.0 0.0 0.0 0.0 0.0 0.0
Liabilities from other taxes 35.6 35.6 0.0 0.0 33.8 33.8 0.0 0.0
Liabilities relating to social security 7.1 7.1 0.0 0.0 6.7 6.7 0.0 0.0
Payables to employees 96.1 96.1 0.0 0.0 74.3 74.3 0.0 0.0
Liabilities from market valuation of forward exchange transactions
75.2 72.3 2.9 0.0 25.8 24.7 1.1 0.0
Liabilities from finance leases 0.4 0.3 0.1 0.0 0.7 0.4 0.2 0.0
Other liabilities 32.0 29.0 1.9 1.2 53.9 51.5 2.1 0.3
Total 954.3 915.5 37.6 1.2 820.8 797.4 23.2 0.3
PUMA has confirmed credit facilities amounting to a total of €497.1 million (previous year: €487.6 million). There were no changes in the financial liabilities (previous year: €4.6 million) from lines of credit granted
only until further notice. Unutilized credit lines totaled €440.2 million as of December 31, 2017, compared to
€433.1 million the previous year.
The effective interest rate of the financial liabilities ranged between 1.0% and 14.7% (previous year: 1.0% to 12.25%).

27
The table below shows the cash flows of the original financial liabilities and of the derivative financial
instruments with a positive and negative fair value:
Cash flows from non-derivative
Carrying amount
Cashflow 2018 Cashflow 2019 Cashflow 2020 et
seq.
and derivative financial 2017 Interest Repayment Interest Repayment Interest Repayment
liabilities € million € million € million € million € million € million € million
Non-derivative financial liabilities
Financial liabilities 56.8 1.3 29.0 0.3 10.1 0.1 17.7
Trade payables 646.1
646.1
Liabilities from finance leases 0.4
0.3 0.1 0.1
Liabilities from acquisitions 4.8 4.8
Other liabilities 22.4 22.3 0.0
Derivative financial liabilities and assets
Cash-inflow from derivate financial instruments
2,152.9 383.0
Cash-outflow from derivate financial instruments
2,197.0 380.6
The current financial liabilities can be repaid at any time.
The following values were determined in the previous year:
Cash flows from non-derivative
Carrying amount
Cashflow 2017 Cashflow 2018 Cashflow 2019 et
seq.
and derivative financial 2016 Interest Repayment Interest Repayment Interest Repayment
liabilities € million € million € million € million € million € million € million
Non-derivative financial liabilities
Financial liabilities 40.1 0.2 25.3 0.1 11.8 0.0 3.0
Trade payables 580.6
580.6
Liabilities from finance leases 0.7
0.4 0.1 0.1
Liabilities from acquisitions 5.0 5.0
Other liabilities 44.9 0.3 44.8 0.0 0.1
Derivative financial liabilities and assets
Cash-inflow from derivate financial instruments
1,886.5 345.5
Cash-outflow from derivate financial instruments
1,835.6 332.1

28
14. Additional Disclosures on Financial Instruments
Measurement Carrying
amount
Fair
value
Carrying
amount
Fair
value
categories 2017 2017 2016 2016
under IAS 39 € million €
million € million
€
million
Assets
Cash and cash equivalents 1)LAR 415.0 415.0 326.7 326.7
Trade receivables LAR 503.7 503.7 499.2 499.2
Other current financial assets LAR 43.2 43.2 35.2 35.2
Derivatives with hedging relationship
(fair value) (current and non-current) n.a. 25.0 25.0 91.8 91.8
Derivatives without hedging relationship (fair value)
HfT 0.1 0.1 0.0 0.0
Other non-current fin. assets LAR 22.1 22.1 22.6 22.6
Non-current investments 3) AfS 28.0 28.0 24.2 24.2
Liabilities
Financial liabilities 2) OL 56.8 56.8 40.1 40.1
Trade payables OL 646.1 646.1 580.6 580.6
Liabilities from acquisitions OL 4.8 4.8 5.0 5.0
Liabilities from finance leases n.a. 0.4 0.4 0.7 0.7
Other financial liabilities OL 22.4 22.4 44.9 44.9
Derivatives with hedging relationship
(fair value) (current and non-current) n.a. 75.2 75.2 25.6 25.6
Derivatives without hedging relationship (fair value)
4) HfT 0.0 0.0 0.3 0.3
Total LAR 984.0 984.0 883.7 883.7
Total OL 730.1 730.1 670.6 670.6
Total AfS 28.0 28.0 24.2 24.2
1) LAR: Loans and Receivables; 2) OL: Other Liabilities; 3) AfS: Available for Sale; 4) HfT: Held for Trading
Financial instruments that are measured at fair value in the balance sheet were determined using the
following hierarchy:
Level 1: Use of prices quoted on active markets for identical assets or liabilities.
Level 2: Use of input factors that do not involve the quoted prices stated under Level 1, but can be observed for the asset or liability either directly (i.e., as price) or indirectly (i.e., derivation of
prices). Level 3: Use of factors for the valuation of the asset or liability that are based on non-observable
market data.
The fair value of financial assets classified as available-for-sale was determined in accordance with Level 1.
The market values of derivative assets or liabilities were determined on the basis of Level 2.
Cash and cash equivalents, trade receivables and other assets have a short residual maturity. Accordingly, as of the reporting date, the carrying amount approximates fair value. Receivables are stated at nominal value,
taking into account deductions for default risk.
Accordingly, as of the reporting date, the carrying amount of loans receivable approximates fair value.
The fair values of other financial assets correspond to their carrying amount, taking into account prevailing
market interest rates. Other financial assets include €22.6 million (previous year: €22.6 million) that were pledged as rental deposits at usual market rates.

29
The current liabilities to banks can be repaid at any time. Accordingly, as of the reporting date, the carrying
amount approximates fair value. The non-current bank liabilities consist of fixed-interest loans. The reported carrying amounts correspond to the repayment amounts. Non-current bank loans are reported under other
non-current financial liabilities.
Trade payables have a short residual maturity. The recognized values approximate fair value.
Pursuant to the contracts entered into, purchase price liabilities associated with acquisitions of business
enterprises lead to payments. The resulting nominal amounts were discounted at a reasonable market interest rate, depending on the expected date of payment. As of the end of the financial year, the market
interest rate only affects one company and is 0.6% (previous year: 0.4%).
The fair values of other financial liabilities are determined based on the present values, taking into account
the prevailing interest rate parameters.
The fair values of derivatives with a hedging relationship at the balance sheet date are determined on the basis of current market parameters, i.e. reference prices observable on the market, taking into account
forward premiums and discounts. The discounted result of the comparison of the forward price on the
reporting date with the forward price on the valuation date is included in the measurement. The fair values are also checked for the counterparty's non-performance risk. In doing this, PUMA calculates credit value
adjustments (CVA) or debt value adjustments (DVA) on the basis of an up/down method, taking current market information into account. No material deviations were found, so that no adjustments were made to
the fair value determined.
Net income by measurement categories:
2017 2016
€ million € million
Loans and receivables (LAR) -3.2 -8.1
Other liabilities (OL) -15.3 -20.8
Derivatives without hedging relationship -0.3 1.3
Non-current financial assets (AfS) 3.8 5.7
Total -15.0 -21.9
The net income was determined by taking into account interest rates, currency exchange effects, impairment losses as well as gains and losses from sales.
General administrative expenses include write-downs of receivables.
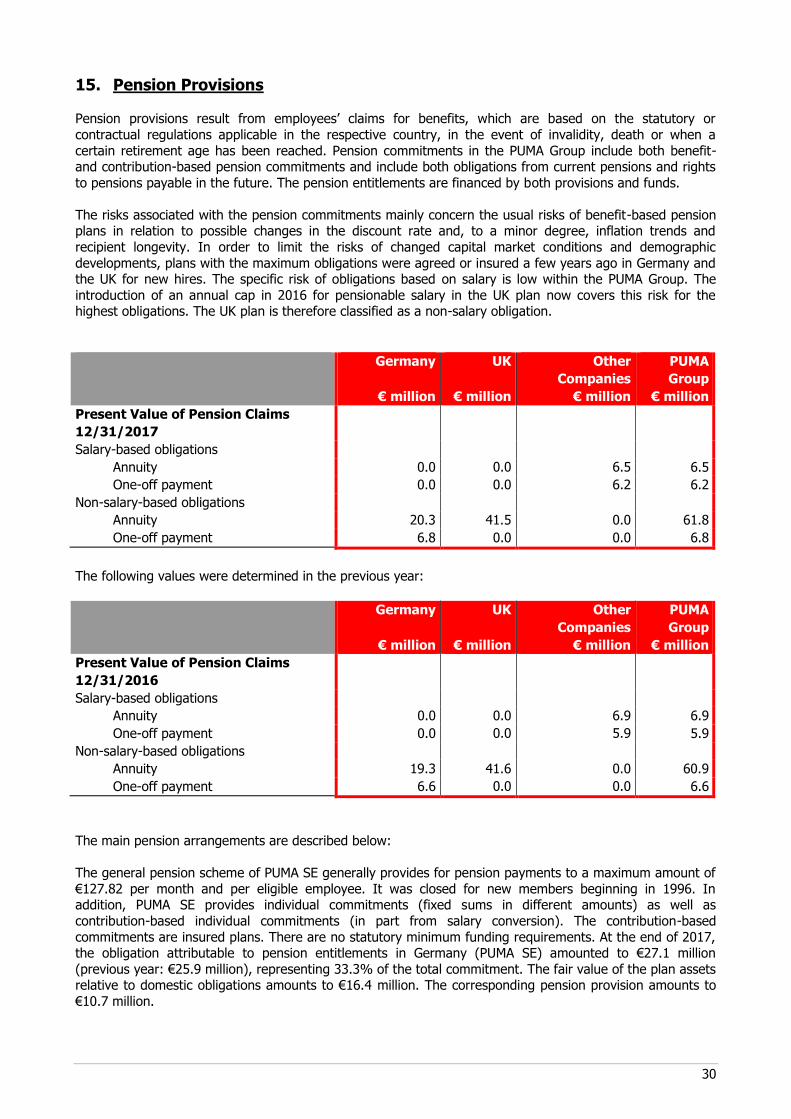
30
15. Pension Provisions Pension provisions result from employees’ claims for benefits, which are based on the statutory or
contractual regulations applicable in the respective country, in the event of invalidity, death or when a
certain retirement age has been reached. Pension commitments in the PUMA Group include both benefit- and contribution-based pension commitments and include both obligations from current pensions and rights
to pensions payable in the future. The pension entitlements are financed by both provisions and funds.
The risks associated with the pension commitments mainly concern the usual risks of benefit-based pension plans in relation to possible changes in the discount rate and, to a minor degree, inflation trends and
recipient longevity. In order to limit the risks of changed capital market conditions and demographic
developments, plans with the maximum obligations were agreed or insured a few years ago in Germany and the UK for new hires. The specific risk of obligations based on salary is low within the PUMA Group. The
introduction of an annual cap in 2016 for pensionable salary in the UK plan now covers this risk for the highest obligations. The UK plan is therefore classified as a non-salary obligation.
Germany
€ million
UK
€ million
Other
Companies
€ million
PUMA
Group
€ million
Present Value of Pension Claims
12/31/2017
Salary-based obligations
Annuity 0.0 0.0 6.5 6.5
One-off payment 0.0 0.0 6.2 6.2
Non-salary-based obligations
Annuity 20.3 41.5 0.0 61.8
One-off payment 6.8 0.0 0.0 6.8
The following values were determined in the previous year:
Germany
€ million
UK
€ million
Other
Companies
€ million
PUMA
Group
€ million
Present Value of Pension Claims
12/31/2016
Salary-based obligations
Annuity 0.0 0.0 6.9 6.9
One-off payment 0.0 0.0 5.9 5.9
Non-salary-based obligations
Annuity 19.3 41.6 0.0 60.9
One-off payment 6.6 0.0 0.0 6.6
The main pension arrangements are described below:
The general pension scheme of PUMA SE generally provides for pension payments to a maximum amount of
€127.82 per month and per eligible employee. It was closed for new members beginning in 1996. In addition, PUMA SE provides individual commitments (fixed sums in different amounts) as well as
contribution-based individual commitments (in part from salary conversion). The contribution-based
commitments are insured plans. There are no statutory minimum funding requirements. At the end of 2017, the obligation attributable to pension entitlements in Germany (PUMA SE) amounted to €27.1 million
(previous year: €25.9 million), representing 33.3% of the total commitment. The fair value of the plan assets relative to domestic obligations amounts to €16.4 million. The corresponding pension provision amounts to
€10.7 million.

31
The defined benefit plan in the United Kingdom has not been available to new hires since 2006. This defined
benefit plan includes salary and length of service-based commitments to provide old age, invalidity and surviving dependents' retirement benefits. In 2016, a growth cap of 1% p.a. was introduced on the
pensionable salary. Partial capitalization of the old-age pension is permitted. There are statutory minimum funding requirements. The obligations regarding pension claims under the defined benefit plan in the UK
amount to €41.5 million at the end of 2017 (previous year: €41.6 million) and represents 51.1% of the total
obligation. The obligation is covered by assets amounting to €32.0 million. The provision amounts to €9.5 million.
The changes in the present value of pension claims are as follows:
2017
€ million
2016
€ million
Present Value of Pension Claims January 1 80.3 74.3
Cost of the pension claims earned in the reporting year 3.4 2.3
Past service costs 0.0 -2.3
(Profits) and losses from settlements 0.0 0.0
Interest expense on pension claims 1.7 2.1
Employee contributions 0.2 0.2
Benefits paid -2.3 -3.0
Effects from transfers 0.2 -0.4
Actuarial (gains) and losses -0.2 13.1
Currency exchange effects -2.0 -6.0
Present Value of Pension Claims December 31 81.3 80.3
The changes in the plan assets are as follows:
2017
€ million
2016
€ million
Plan Assets January 1 48.8 50.7
Interest income on plan assets 1.1 1.5
Actuarial gains and losses (-) 1.1 1.7
Employer contributions 3.1 1.9
Employee contributions 0.2 0.2
Benefits paid -1.4 -2.0
Effects from transfers 0.0 -0.3
Currency exchange effects -1.4 -5.0
Plan Assets December 31 51.6 48.7

32
The pension provision for the Group is derived as follows:
2017
€ million
2016
€ million
Present value of pension claims from benefit plans 81.3 80.3
Fair value of plan assets -51.6 -48.7
Financing Status 29.7 31.6
Amounts not recorded due to the maximum limit applicable to assets 0.0 0.0
Pension Provision December 31 29.7 31.6
In 2017, benefits paid amounted to €2.3 million (previous year: €3.0 million). Contributions in 2018 are expected to amount to €2.2 million. Of this, €0.9 million is expected to be paid directly by the employer.
Contributions to external plan assets amounted to €3.1 million in 2013 (previous year: €1.9 million).
Contributions in 2018 are expected to amount to €1.7 million.
The changes in pension provisions are as follows:
2017
€ million
2016
€ million
Pension Provision January 1 31.6 23.6
Pension expense 4.0 0.6
Actuarial gains (-) and losses recorded in Other Comprehensive Income
-1.3
11.4
Employer contributions -3.1 -1.9
Direct pension payments made by the employer -0.9 -0.9
Transfer values 0.2 -0.2
Currency exchange differences -0.7 -1.0
Pension Provision December 31 29.7 31.6
of which assets 0.0 0.0
of which liabilities 29.7 31.6
The expenses in the 2017 financial year are structured as follows:
2017
€ million
2016
€ million
Cost of the pension claims earned in the reporting year 3.4 2.3
Past service costs 0.0 -2.3
Income (-) and expenses from plan settlements 0.0 0.0
Interest expense on pension claims 1.7 2.1
Interest income on plan assets -1.1 -1.5
Administration costs 0.0 0.1
Expenses for Defined Benefit Plans 4.0 0.7
of which personnel costs 3.4 0.1
of which financial costs 0.6 0.6
In addition to the defined benefit pension plans, PUMA also makes contributions to defined contribution
plans. Payments for the financial year 2017 amounted to €11.7 million (previous year: €11.0 million).

33
Actuarial gains and losses recorded in Other Comprehensive Income:
2017
€ million
2016
€ million
Revaluation of Pension Commitments 0.0 0.0
Actuarial gains (-) and losses resulting from changes in demographic
assumptions -0.6 -0.7
Actuarial gains (-) and losses resulting from changes in financial
assumptions -0.1 13.3
Actuarial gains (-) and losses due to adjustments based on
experience 0.5 0.5
Revaluation of Plan Assets -1.1 -1.7
Amounts not recorded due to the maximum limit applicable to assets 0.0 0.0
Adjustment of administration costs 0.0 0.0
Total Revaluation Amounts Recorded Directly in Other
Comprehensive Income -1.3 11.4
Plan assets investment classes:
2017
€ million
2016
€ million
Cash and cash equivalents 0.3 0.1
Equity instruments 0.0 0.1
Bonds 1.3 12.4
Investment funds 18.5 17.2
Derivatives 7.1 0.0
Real estate 3.5 3.7
Insurance 16.4 14.2
Other 4.5 1.0
Total Plan Assets 51.6 48.7
Of which investment classes with a quoted market price:
2017
€ million
2016
€ million
Cash and cash equivalents 0.3 0.2
Equity instruments 0.0 0.1
Bonds 1.3 12.4
Investment funds 18.3 16.9
Derivatives 7.1 0.0
Real estate 3.2 3.4
Insurance 0.0 0.0
Other 4.5 1.0
Plan Assets with a Quoted Market Price 34.7 34.0
Plan assets still do not include the Group’s own financial instruments or real estate used by Group
companies.
The plan assets are used exclusively to fulfill defined pension commitments. Legal requirements exist in
some countries for the type and amount of financial resources that can be chosen; in other countries (for
example Germany) they can be chosen freely. In the UK, a board of trustees made up of Company
representatives and employees is in charge of asset management. Its investment strategy is aimed at long-
term profits and low volatility. It was revised in 2017 and the risk profile was reduced.

34
The following assumptions were used to determine pension obligations and pension expenses:
2017 2016
Discount rate 2.30% 2.18%
Future pension increases 2.42% 2.46%
Future salary increases 1.55% 1.50%
The indicated values are weighted average values. A standard interest rate of 1.75% was applied for the
Euro zone (previous year: 1.25%).
The following overview shows how the present value of pension claims from benefit plans would have been
affected by changes to significant actuarial assumptions.
2017
€ million
2016
€ million
Effect on present value of pension claims if
the discount rate were 50 basis points higher -7.4 -7.4
the discount rate were 50 basis points lower 6.0 6.3
Salary and pension trends have only a negligible effect on the present value of pension claims due to the
structure of the benefit plans.
The weighted average duration of pension commitments is 19 years.
16. Other Provisions
2016 2017
Currency
adjustments, retransfers
Addition Utilization Reversal
€ million € million € million € million € million € million
Provisions for:
Warranties/ Returns 12.6 -0.5 46.7 -7.8 -0.2 50.7
Purchasing risks 8.5 -0.1 7.2 -7.9 -0.4 7.2
Other 64.8 -9.5 27.6 -15.0 -5.0 62.9
Total 85.9 -10.1 81.5 -30.8 -5.6 120.8
The warranty/return provision is determined on the basis of the historical value of sales generated during
the past six months. It is expected that the majority of these expenses will fall due within the first six months of the next financial year. The warranty/return provision does not include any non-current provisions
(previous year: €1.9 million).
Purchasing risks relate primarily to materials and molds that are required for the manufacturing of shoes.
The other provisions consist of risks in connection with litigation amounting to €30.0 million (previous year:
€28.7 million) and provisions for anticipated losses from pending transactions and other risks in the amount
of €32.9 million (previous year: €36.1 million). Other provisions include €34.6 million (previous year: €27.9 million) in non-current provisions.
Short-term provisions are expected to be paid out in the following year, while long-term provisions are not
expected to be paid out until the end of the following year at the earliest.

35
17. Liabilities from the Acquisition of Business Entities Pursuant to the contracts entered into, purchase price liabilities associated with acquisitions of business
enterprises lead to payments. The resulting nominal amounts were discounted at a reasonable market
interest rate, depending on the expected date of payment.
The existing purchase price liability relates to the acquisition of Genesis Group International Ltd. and is made up as follows:
2017 2016
€ million € million
Due within one year 0.0 0.0
Due in more than one year 4.8 5.0
Total 4.8 5.0
18. Shareholders’ equity Subscribed Capital
The subscribed capital corresponds to the subscribed capital of PUMA SE. As of the balance sheet date, the
subscribed capital amounted to €38.6 million and is divided into 15,082,464 bearer shares. Each no-par-value share corresponds to €2.56 of the subscribed capital (share capital).
Changes in the circulating shares:
2017 2016
Circulating Shares as of January 1 Shares 14,939,913 14,939,913
Issue of treasury stock Shares 6,443 0
Stock buyback Shares 0 0
Circulating Shares as of December 31 Shares 14,946,356 14,939,913
Capital Reserve
The capital reserve includes the premium from issuing shares, as well as amounts from the grant, conversion and expiration of share options.
Retained Earnings and Net Profit
Retained earnings and net profit include the net income of the financial year as well as the income of the
companies included in the consolidated financial statements achieved in the past to the extent that it was not distributed.
Reserve from the Difference Resulting From Currency Conversion
The equity item for currency conversion serves to record the differences from the conversion of the financial
statements of subsidiaries with non-Euro accounting compared to the date of first consolidation of the subsidiaries.
Cash Flow Hedges
The “cash flow hedges” item includes the market valuation of derivative financial instruments. The item in
the amount of €-44.8 million (previous year: €54.3 million) is offset by deferred taxes in the amount of €3.7 million (previous year: €-0.5 million).

36
Treasury Stock
The resolution adopted by the Annual General Meeting on May 6, 2015 authorized the company to purchase treasury shares up to a value of ten percent of the share capital until May 5, 2020. If purchased through the
stock exchange, the purchase price per share may not exceed or fall below 10% of the closing price for the Company's shares with the same attributes in the XETRA trading system (or a comparable successor system)
during the last three trading days prior to the date of purchase. The Company did not make use of the authorization to purchase treasury stock during the reporting period.
As of the balance sheet date, the Company holds a total of 136,108 PUMA shares in its own portfolio, which corresponds to 0.9% of the subscribed capital.
Authorized Capital As of December 31, 2017, the Company's Articles of Association provide for authorized capital totaling
€15,000,000:
Pursuant to Section 4.2. of the Articles of Association, the Administrative Board is authorized to increase the Company's share capital by April 11, 2022 by up to €15,000,000 (Authorized Capital 2017) by issuing new
no-par value bearer shares against cash and/or non-cash contributions on one or more occasions. In the
event of capital increases against cash contributions, the new shares can also be acquired in whole or in part by one or several banks as determined by the Administrative Board, subject to the obligation to offer these
to the shareholders for subscription (indirect subscription right). The shareholders are basically entitled to a subscription right. However, the Administrative Board is authorized to exclude shareholders' subscription
rights in whole or in part in the cases specified in Paragraph 4.2. of the Articles of Association.
The Administrative Board of PUMA SE did not make use of the existing authorized capital in the current
reporting period.
Dividends The amounts eligible for distribution relate to the net income of PUMA SE, which is determined in
accordance with German Commercial Law.
The Managing Directors and the Administrative Board will propose to the Annual General Meeting that a one-
off dividend of €12.50 per circulating share, or a total of €186.8 million (with respect to the circulating shares as of December 31), be distributed to the shareholders from the net income of PUMA SE for the 2017
financial year.
Appropriation of the Net Income of PUMA SE:
2017 2016
Net income of PUMA SE as of December 31 € million 268.1 205.6
Net income available for distribution € million 268.1 205.6
Dividend per share € 12.50 0.75
Number of circulating shares * share 14,946,356 14,939,913
Total dividend * € million 186.8 11.2
Carried forward to the new accounting period * € million 81.3 194.4
* Previous year's values adjusted to the outcome of the Annual General Meeting
Non-controlling interests
The non-controlling interests remaining as of the balance sheet date relate to PUMA Accessories North America, LLC with €4.9 million (previous year: €1.1 million), Janed, LLC with €21.3 million (previous year:
€11.9 million), PUMA Kids Apparel North America, LLC with €1.3 million (previous year: €0.6 million), Janed Canada, LLC, with €2.4 million (previous year: €0.8 million), PUMA North America Accessories Canada, LLC
with €0.5 million, and PUMA Kids Apparel Canada, LLC, with €0.8 million (previous year: €0.9 million).

37
Capital Management
The Group’s objective is to retain a strong equity base in order to maintain both investor and market confidence and to strengthen future business performance.
Capital management relates to the consolidated equity of PUMA. This is shown in the consolidated balance
sheet as well as the reconciliation statement concerning “Changes in Equity.”
19. Equity Compensation Plans/Management Incentive Program In order to provide long-term incentives and thereby retain the management staff in the Company, PUMA
uses share-based compensation systems in the form of stock option programs (SOP) and in the form of virtual shares with cash compensation.
The current programs are described below:
Explanation of “SOP” Pursuant to the resolution of the Annual General Meeting of April 22, 2008, a stock option program, “SOP
2008”, was accepted in the form of a “Performance Share Program”. Conditional capital was created for this
purpose and the Supervisory Board and the Board of Management of PUMA AG (as of July 25, 2011 change of form into SE) were authorized to grant subscription rights to the members of the Board of Management
and other executives of the Company and of affiliated subsidiary companies for five years (after the registration of the conditional capital in the commercial register), but for at least three months after the end
of the Annual General Meeting in 2013. The term of the subscription rights issued and to be issued is five years and these subscription rights can be
exercised after two years at the earliest, provided, however, that the price of the PUMA share has increased
by at least 20% as of the date granted. In contrast to traditional stock option programs, the equivalent amount of the increase in value of the PUMA share since the date granted is serviced with shares, whereby
the beneficiary pays an option price of €2.56 per share granted if the share was issued as part of a capital increase. If employees leave the company, then their options rights expire.
Furthermore, pursuant to the authorization, the Administrative Board, in accordance with the recommendations of the Corporate Governance Code, may limit, fully or partially, the scope and contents of
subscription rights issued to the company’s Managing Directors in the event of extraordinary, unforeseen developments. This option is also available to the Board of Management with respect to the other executives
concerned.
The programs were valued using a binomial model or a Monte Carlo simulation.
The following parameters were used to determine the fair value:
SOP 2008 2008 2008 2008 2008
Tranche I Tranche II Tranche III Tranche IV Tranche V
Share price as of the date
granted
€199.27 €147.27 €250.50 €199.95 €265.00
Expected volatility 29.1% 47.7% 34.5% 29.2% 26.8%
Expected dividend payment 1.50% 2.31% 1.30% 1.30% 0.8%
Risk-free interest rate, former members of the Board of
Management/current Managing
Directors
4.60% 1.97% 1.60% 2.40% 0.3%
Risk-free interest rate, executive
staff
4.60% 1.97% 1.60% 2.40% 0.3%
The historical volatility during the year prior to the date of valuation was used to determine the expected
volatility.

38
Changes in the “SOP” during the financial year:
SOP 2008 2008 2008 2008 2008
Tranche I Tranche II Tranche III Tranche IV Tranche V
Issue date 7/21/2008 4/14/2009 4/22/2010 4/15/2011 4/30/2012
Amount issued 113,000 139,002 126,184 151,290 145,375
Exercise price €0.00 €0.00 €2.56 €2.56 €2.56
Residual term 0.00 years 0.00 years 0.00 years 0.00 years 0.00 years
Circulating as of 1/1/2017 0 0 0 0 98,484
Exercised 0 0 0 0 0
Ø Share price when exercised €220.83 €214.57 n.a. n.a. n.a.
Compensated/ Expired 0 0 0 0 -98,484
Circulating as of 12/31/2017
0 0 0 0 0
Exercisable options as of the
reporting date
0 0 0 0 0
Pursuant to Section 5 of the Option Terms and Conditions, every year the options are subject to a vesting
period from December 15 for up to ten trading days after the Annual General Meeting. Accordingly, no options can be exercised as of the reporting date.
As of the date of allocation, the average fair value per option was €49.44 for "Tranche I – 2008". Taking into
account the vesting period, there are no expenses for the current financial year. Of the options in circulation,
0 options belong to the previous members of the Board of Management of PUMA AG or the current Managing Directors.
Pursuant to the allocation, the average fair value per option was €53.49 for “Tranche II – 2008”.Taking into
account the vesting period, there are no expenses for the current financial year. Of the options in circulation, 0 options belong to the previous members of the Board of Management of PUMA AG or the current
Managing Directors.
Pursuant to the allocation, the average fair value per option was €61.81 for “Tranche III – 2008”.Taking into
account the vesting period, there are no expenses for the current financial year. Of the options in circulation, 0 options belong to the previous members of the Board of Management of PUMA AG or the current
Managing Directors.
Pursuant to the allocation, the average fair value per option was €40.14 for “Tranche IV – 2008”. Taking into
account the vesting period and the expiration, there are no expenses for the current financial year. A total of 0 options belong to the previous members of the Board of Management of PUMA AG or the current
Managing Directors at the end of the year.
Pursuant to the allocation, the average fair value per option was €44.59 for “Tranche V – 2008”.Taking into
account the vesting period, there are no expenses for the current financial year. Tranche V was terminated against payment of a cash settlement. A total of 0 options belonged to the current Managing Directors at the
end of the year.
The "SOP 2008" stock option program expired at the end of the 2017 financial year.
Explanation of "virtual shares", termed "monetary units"
Monetary units were granted on an annual basis in 2013 as part of a management incentive program. Monetary units are based on the PUMA and Kering share performance. Each of these monetary units entitles
the holder to a cash payment at the end of the term. This is dependent on the year-end price determined for
the PUMA share (component 1), which is weighted at 70%, and on the year-end price determined for the Kering share (component 2), which is weighted at 30%. Component 1 compares the success with the
average virtual stock appreciation rights of the last 30 days of the previous year. Component 2, on the other hand, measures success by comparing the performance of the Kering share against the average
performance of a reference portfolio in the luxury and sports sector over the same period. These monetary units are subject to a vesting period of three years. After that, there is an exercise period of two years (in
the period in April and October) which can be freely used by participants for the purposes of execution. The
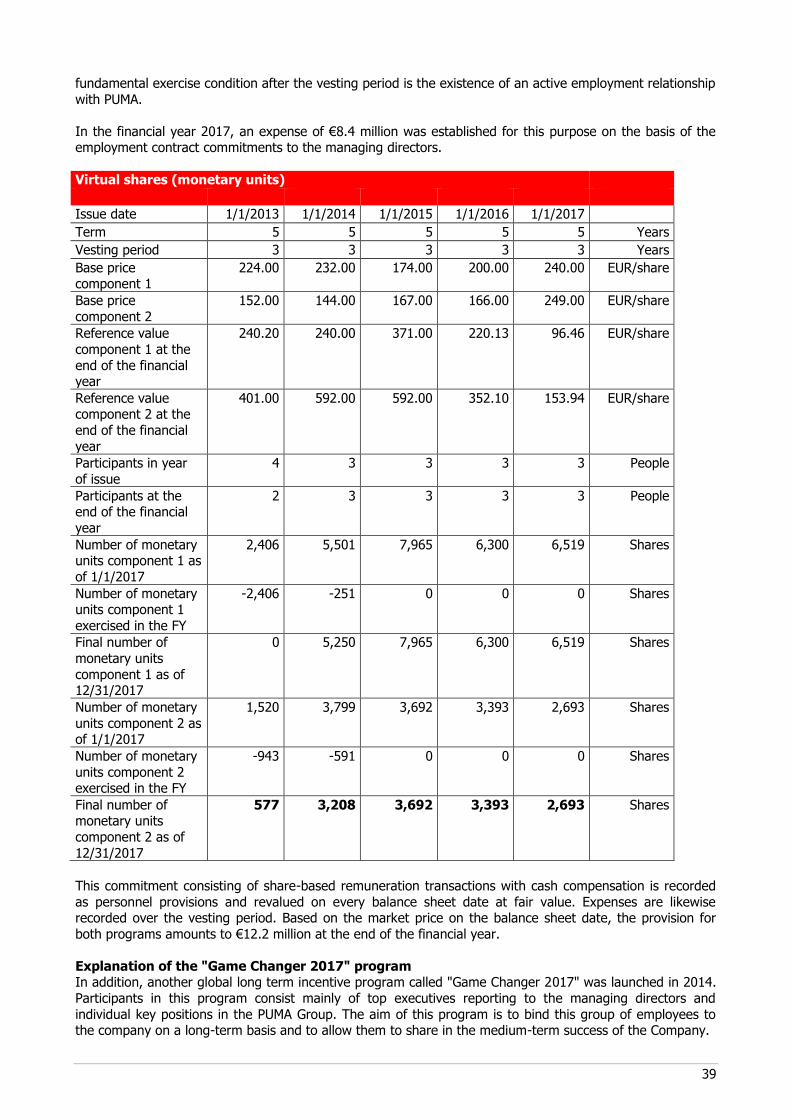
39
fundamental exercise condition after the vesting period is the existence of an active employment relationship
with PUMA.
In the financial year 2017, an expense of €8.4 million was established for this purpose on the basis of the employment contract commitments to the managing directors.
Virtual shares (monetary units)
Issue date 1/1/2013 1/1/2014 1/1/2015 1/1/2016 1/1/2017
Term 5 5 5 5 5 Years
Vesting period 3 3 3 3 3 Years
Base price component 1
224.00 232.00 174.00 200.00 240.00 EUR/share
Base price
component 2
152.00 144.00 167.00 166.00 249.00 EUR/share
Reference value
component 1 at the
end of the financial year
240.20 240.00 371.00 220.13 96.46 EUR/share
Reference value component 2 at the
end of the financial
year
401.00 592.00 592.00 352.10 153.94 EUR/share
Participants in year
of issue
4 3 3 3 3 People
Participants at the end of the financial
year
2 3 3 3 3 People
Number of monetary units component 1 as
of 1/1/2017
2,406 5,501 7,965 6,300 6,519 Shares
Number of monetary units component 1
exercised in the FY
-2,406 -251 0 0 0 Shares
Final number of
monetary units
component 1 as of 12/31/2017
0 5,250 7,965 6,300 6,519 Shares
Number of monetary
units component 2 as of 1/1/2017
1,520 3,799 3,692 3,393 2,693 Shares
Number of monetary
units component 2 exercised in the FY
-943 -591 0 0 0 Shares
Final number of monetary units
component 2 as of
12/31/2017
577 3,208 3,692 3,393 2,693 Shares
This commitment consisting of share-based remuneration transactions with cash compensation is recorded
as personnel provisions and revalued on every balance sheet date at fair value. Expenses are likewise recorded over the vesting period. Based on the market price on the balance sheet date, the provision for
both programs amounts to €12.2 million at the end of the financial year.
Explanation of the "Game Changer 2017" program In addition, another global long term incentive program called "Game Changer 2017" was launched in 2014.
Participants in this program consist mainly of top executives reporting to the managing directors and
individual key positions in the PUMA Group. The aim of this program is to bind this group of employees to the company on a long-term basis and to allow them to share in the medium-term success of the Company.

40
The term of the program is 3 years and is based on the medium-term objectives of the PUMA Group in
terms of EBIT (70%), working capital (15%) and gross profit margin (15%). For this purpose, a corresponding provision is set up each year when the respective currency-adjusted targets are met. The
resulting savings were paid out to the participants in March 2017. The payment was subject to the condition that the individual participant was in an unterminated employment relationship with a company of the PUMA
Group as of December 31, 2016. No further expenses were incurred for this program in the year under
review.
Explanation of the "Game Changer 2018" program In 2015, the global "Game Changer 2018" program was launched, which is subject to the same parameters
as the "Game Changer 2017" program (employment relationship until 12/31/2017 and payout March 2018).
Provisions of €1.0 million were set aside for this program in the year under review.
Explanation of the "Game Changer 2019" program In 2016, the global "Game Changer 2019" program was launched, which is subject to the same parameters
as the "Game Changer 2017" program (employment relationship until 12/31/2018 and payout March 2019).
Provisions of €1.4 million were set aside for this program in the year under review.
Explanation of the "Game Changer 2020" program In 2017, the global "Game Changer 2020" program was launched, which is subject to the same parameters
as the "Game Changer 2017" program (employment relationship until 12/31/2019 and payout March 2020).
Provisions of €1.4 million were set aside for this program in the year under review.
Explanation of the Momentum 2020 program In addition, a global program called "Momentum" was launched in 2017, which is subject to the same
parameters (employment until December 31, 2019 and payout in March 2020) as the Game Changer programs. The difference to the Game Changer programs lies in the different participants. While the
participants in the Game Changer programs consist of top executives, the "Momentum" program includes
employees who are not part of this group. Provisions of €0.9 million were set aside for this program in the year under review.
20. Other Operating Income and Expenses According to the respective functions, other operating income and expenses include personnel, advertising,
sales and distribution expenses as well as rental and leasing expenditure, travel costs, legal and consulting
expenses and other general expenses. Typical operating income that is associated with operating expenses was offset. Rental and lease expenses associated with the Group’s own retail stores include sales-dependent
rental components.
Other operating income and expenses are allocated based on functional areas as follows:
2017 2016
€ million € million
Sales and distribution expenses 1,320.4 1,182.4
Product management/merchandising 45.1 41.7
Research and development 53.4 52.0
Administrative and general expenses 307.0 269.3
Other operating expenses 1,725.9 1,545.4
Other operating income 0.3 0.9
Total 1,725.6 1,544.5
Of which scheduled depreciation 70.3 59.9
Of which impairment expenses 0.0 0.0
Within the sales and distribution expenses, marketing/retail expenses account for a large proportion of the
operating expenses. In addition to advertising and promotional expenses, they also include expenses
associated with the Group’s retail activities. Other sales and distribution expenses include logistic expenses and other variable sales and distribution expenses.

41
Administrative and general expenses include expenses for the statutory auditor of PUMA SE in the amount of
€0.9 million (previous year: €0.9 million). Of this, €0.7 million is allocated to auditing expenses (previous year: €0.6 million), €0.2 million to other assurance services (previous year: €0.2 million) and €0.0 million to
tax advisory services (previous year: €0.1 million).
Other operating income includes other income of €0.3 million (previous year: €0.2 million). In the previous
year, this item also included allocations of development costs amounting to €0.7 million.
Overall, other operating expenses include personnel costs, which consist of:
2017 2016
€ million € million
Wages and salaries 428.3 398.9
Social security contributions 57.3 50.7
Expenses from share-based remuneration with cash compensation 8.4 2.1
Expenses for retirement pension and other personnel expenses 55.1 41.3
Total 549.1 493.1
In addition, cost of sales includes personnel costs in the amount of €12.8 million (previous year: €15.3
million).
The average number of employees for the year was as follows:
2017 2016
Marketing/retail/sales 7,986 7,527
Research & Development/product management 891 882
Administrative and general units 2,511 2,719
Total annual average 11,389 11,128
As of the end of the year, a total of 11,787 individuals were employed (previous year: 11,495).
21. Financial Result This financial result consists of:
2017 2016
€ million € million
Income from associated companies 1.6 1.2
Financial income 10.3 10.5
Interest expense -17.8 -13.4
Interest accrued on liabilities from acquisitions 0.0 0.0
Valuation of pension plans -0.6 -0.6
Expenses from currency-conversion differences, net -6.9 -6.4
Financial expenses -25.3 -20.4
Financial Result -13.4 -8.7
Income from associated companies results exclusively from the shareholding in Wilderness Holdings Ltd.
(see also paragraph 11).
Financial income includes only interest income.
Interest expenses result from financial liabilities and expenses in connection with currency derivatives. Moreover, the financial result includes a total of €6.9 million in expenses from currency conversion
differences (previous year: expense of €6.4 million), which are attributable to financing activities.

42
22. Income Taxes
2017 2016
€ million € million
Current income taxes
Germany 9.3 3.5
Other countries 61.5 34.8
Total current income taxes 70.7 38.3
Deferred taxes -7.5 -7.8
Total 63.3 30.5
In general, PUMA SE and its German subsidiaries are subject to corporate income tax, plus a solidarity
surcharge and trade tax. Thus, a weighted mixed tax rate of 27.22% continued to apply for the financial year.
Reconciliation of the theoretical tax expense with the effective tax expense:
2017 2016
€ million € million
Earnings before income tax 231.2 118.9
Theoretical tax expense
Tax rate of the SE = 27.22% (previous year: 27.22%) 62.9 32.4
Taxation difference with respect to other countries -7.1 -8.1
Other tax effects:
Income tax for previous years 4.1 1.9
Losses and temporary differences for which no tax claims were recognized
4.0 5.0
Changes in tax rate 8.7 0.1
Non-deductible expenses for tax purposes and non-taxable income and
other effects -9.3 -0.8
Effective tax expense 63.3 30.5
Effective tax rate 27.4% 25.7%
The tax effect resulting from items that are directly credited or debited to equity is shown directly in the
statement of comprehensive income.
Other effects include withholding tax expenses in the amount of €9.7 million (previous year: €11.0 million).
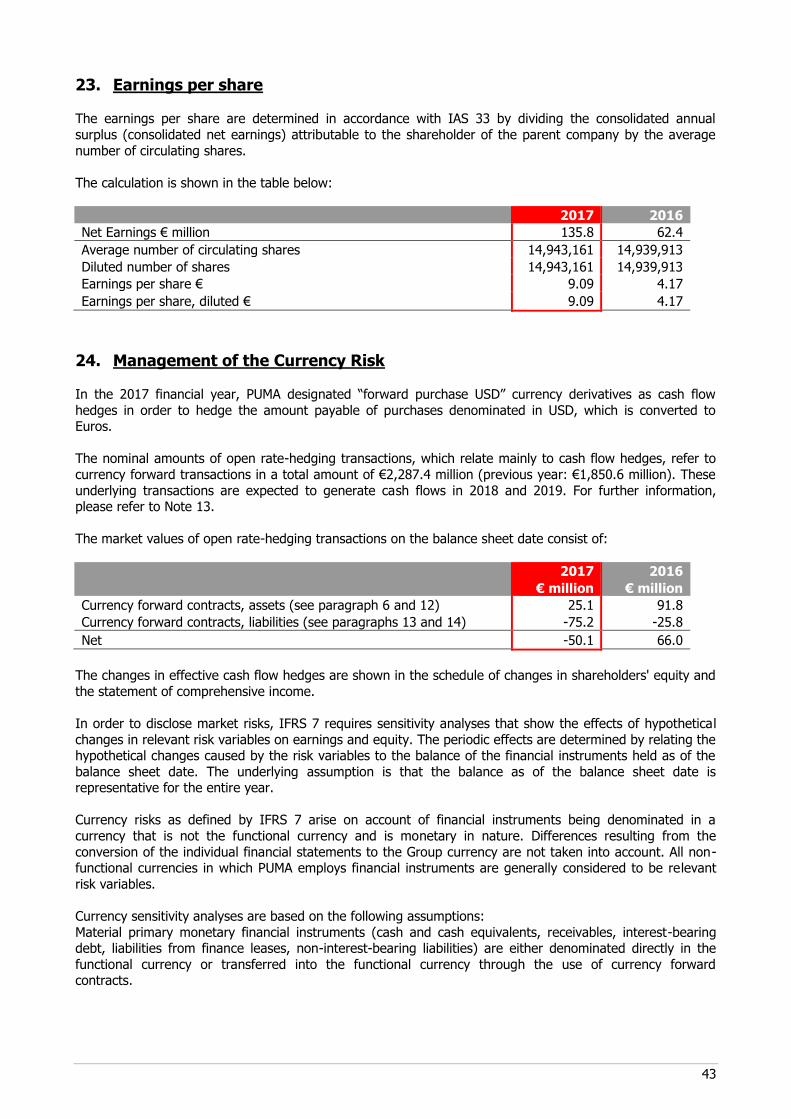
43
23. Earnings per share The earnings per share are determined in accordance with IAS 33 by dividing the consolidated annual
surplus (consolidated net earnings) attributable to the shareholder of the parent company by the average
number of circulating shares.
The calculation is shown in the table below:
2017 2016
Net Earnings € million 135.8 62.4
Average number of circulating shares 14,943,161 14,939,913
Diluted number of shares 14,943,161 14,939,913
Earnings per share € 9.09 4.17
Earnings per share, diluted € 9.09 4.17
24. Management of the Currency Risk
In the 2017 financial year, PUMA designated “forward purchase USD” currency derivatives as cash flow
hedges in order to hedge the amount payable of purchases denominated in USD, which is converted to Euros.
The nominal amounts of open rate-hedging transactions, which relate mainly to cash flow hedges, refer to
currency forward transactions in a total amount of €2,287.4 million (previous year: €1,850.6 million). These
underlying transactions are expected to generate cash flows in 2018 and 2019. For further information, please refer to Note 13.
The market values of open rate-hedging transactions on the balance sheet date consist of:
2017 2016
€ million € million
Currency forward contracts, assets (see paragraph 6 and 12) 25.1 91.8
Currency forward contracts, liabilities (see paragraphs 13 and 14) -75.2 -25.8
Net -50.1 66.0
The changes in effective cash flow hedges are shown in the schedule of changes in shareholders' equity and
the statement of comprehensive income.
In order to disclose market risks, IFRS 7 requires sensitivity analyses that show the effects of hypothetical
changes in relevant risk variables on earnings and equity. The periodic effects are determined by relating the hypothetical changes caused by the risk variables to the balance of the financial instruments held as of the
balance sheet date. The underlying assumption is that the balance as of the balance sheet date is representative for the entire year.
Currency risks as defined by IFRS 7 arise on account of financial instruments being denominated in a
currency that is not the functional currency and is monetary in nature. Differences resulting from the
conversion of the individual financial statements to the Group currency are not taken into account. All non-functional currencies in which PUMA employs financial instruments are generally considered to be relevant
risk variables.
Currency sensitivity analyses are based on the following assumptions:
Material primary monetary financial instruments (cash and cash equivalents, receivables, interest-bearing debt, liabilities from finance leases, non-interest-bearing liabilities) are either denominated directly in the
functional currency or transferred into the functional currency through the use of currency forward contracts.

44
Currency forward contracts used to hedge against payment fluctuations caused by exchange rates are part
of an effective cash-flow hedging relationship pursuant to IAS 39. Changes in the exchange rate of the currencies underlying these contracts have an effect on the hedge reserve in equity and the fair value of
these hedging contracts.
If, as of December 31, 2017, the USD had appreciated (devalued) against all other currencies by 10%, the
hedge reserve in equity and the fair value of the hedging contracts would have been €120.4 million higher (lower) (December 31, 2016: €106.2 million higher (lower)).
Currency risks and other risk and opportunity categories are discussed in greater detail in the Combined
Management Report under the Risk and Opportunity Management section as well as in paragraphs 2 and 13
of the Notes to the consolidated financial statements.
25. Segment Reporting
Segment reporting is based on geographical regions in accordance with our internal reporting structure. Sales revenues and operating income (EBIT) are shown according to the head office of the respective Group
company of the corresponding region. The inter-company sales of the respective region are eliminated. The
allocation of the remaining segment information is also determined on the basis of the respective Group company’s head office. The totals equal the amounts at the time in the income statement and the balance
sheet.
The regions are subdivided into EMEA (Europe, Middle East and Africa), Americas (North and Latin America) and Asia/Pacific.
The segments’ internal sales are generated on the basis of market prices. They are not considered in the representation, as they are not relevant for controlling.
Investments and depreciation/amortization relate to additions and depreciation/amortization of property,
plant and equipment and intangible assets during the current financial year. As in the previous year, no total
impairment losses were recognized in the segments.
Since PUMA is active in only one business area, the sports equipment industry, products are allocated according to the footwear, apparel and accessories product segments in accordance with the internal
reporting structure. According to this reporting structure, except the allocation of sales revenue and of the
gross profit there is no other allocation of the operating result as well as of the asset and liability items.
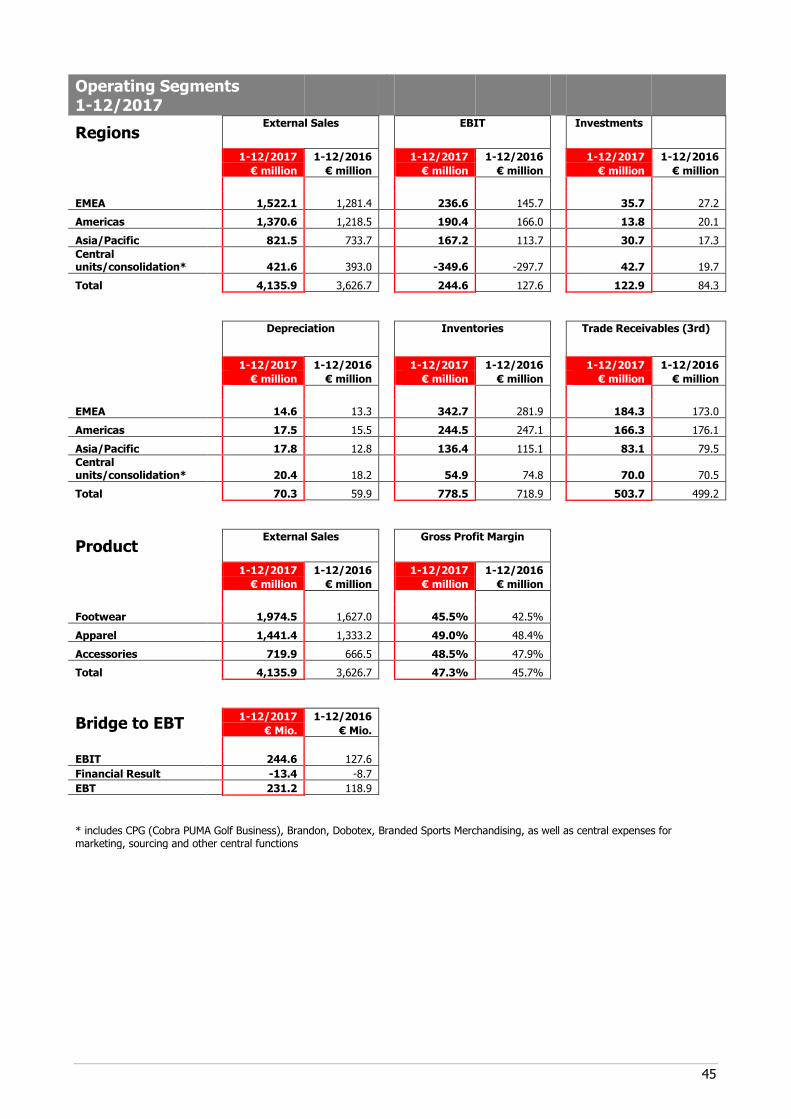
45
Operating Segments 1-12/2017
Regions
External Sales EBIT
Investments
1-12/2017 1-12/2016 1-12/2017 1-12/2016
1-12/2017 1-12/2016
€ million € million € million € million
€ million € million
EMEA 1,522.1 1,281.4 236.6 145.7 35.7 27.2
Americas 1,370.6 1,218.5 190.4 166.0 13.8 20.1
Asia/Pacific 821.5 733.7 167.2 113.7 30.7 17.3
Central units/consolidation* 421.6 393.0
-349.6 -297.7 42.7 19.7
Total
4,135.9 3,626.7 244.6 127.6
122.9 84.3
Depreciation Inventories
Trade Receivables (3rd)
1-12/2017 1-12/2016 1-12/2017 1-12/2016
1-12/2017 1-12/2016
€ million € million € million € million
€ million € million
EMEA 14.6 13.3 342.7 281.9 184.3 173.0
Americas 17.5 15.5 244.5 247.1 166.3 176.1
Asia/Pacific 17.8 12.8 136.4 115.1 83.1 79.5
Central units/consolidation* 20.4 18.2
54.9 74.8 70.0 70.5
Total
70.3 59.9 778.5 718.9
503.7 499.2
Product
External Sales Gross Profit Margin
1-12/2017 1-12/2016 1-12/2017 1-12/2016
€ million € million € million € million
Footwear 1,974.5 1,627.0 45.5% 42.5%
Apparel 1,441.4 1,333.2 49.0% 48.4%
Accessories 719.9 666.5 48.5% 47.9%
Total
4,135.9 3,626.7 47.3% 45.7%
Bridge to EBT
1-12/2017 1-12/2016
€ Mio. € Mio.
EBIT
244.6 127.6
Financial Result -13.4 -8.7
EBT 231.2 118.9
* includes CPG (Cobra PUMA Golf Business), Brandon, Dobotex, Branded Sports Merchandising, as well as central expenses for marketing, sourcing and other central functions
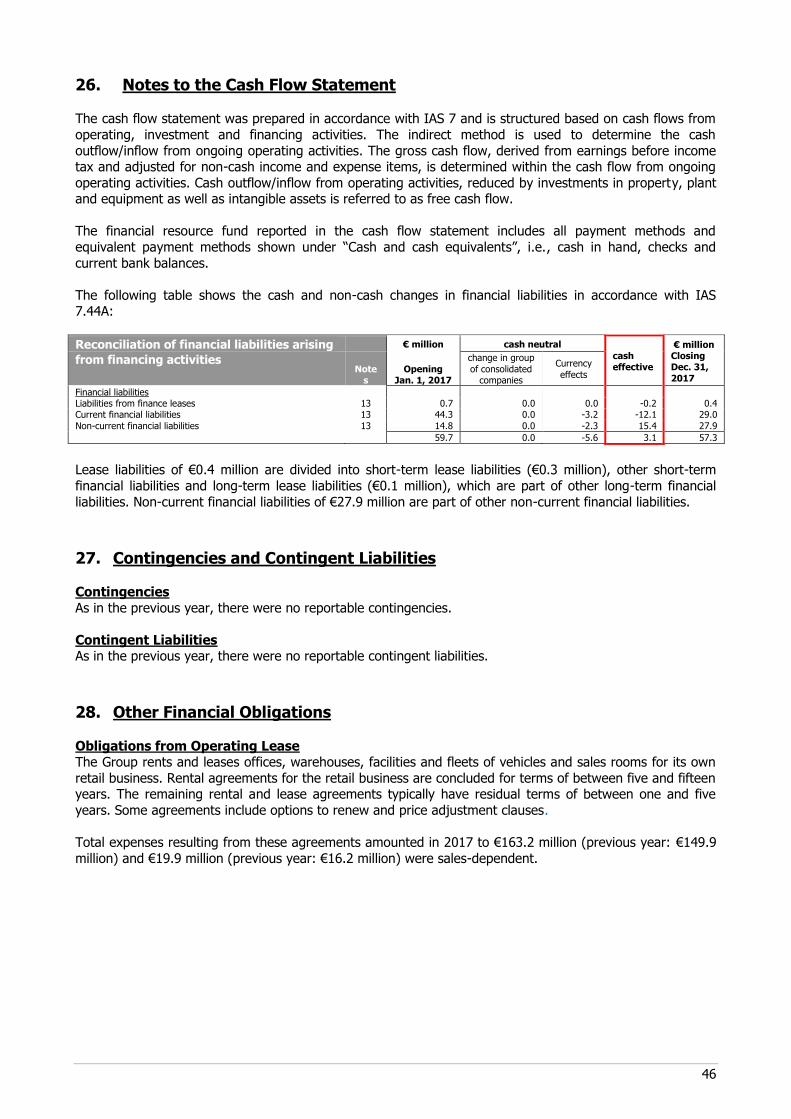
46
26. Notes to the Cash Flow Statement The cash flow statement was prepared in accordance with IAS 7 and is structured based on cash flows from
operating, investment and financing activities. The indirect method is used to determine the cash
outflow/inflow from ongoing operating activities. The gross cash flow, derived from earnings before income tax and adjusted for non-cash income and expense items, is determined within the cash flow from ongoing
operating activities. Cash outflow/inflow from operating activities, reduced by investments in property, plant and equipment as well as intangible assets is referred to as free cash flow.
The financial resource fund reported in the cash flow statement includes all payment methods and
equivalent payment methods shown under “Cash and cash equivalents”, i.e., cash in hand, checks and
current bank balances.
The following table shows the cash and non-cash changes in financial liabilities in accordance with IAS 7.44A:
Reconciliation of financial liabilities arising € million cash neutral
cash effective
€ million Closing Dec. 31,
2017
from financing activities Note
s Opening
Jan. 1, 2017
change in group
of consolidated companies
Currency
effects
Financial liabilities 0
Liabilities from finance leases 13 0.7 0.0 0.0 -0.2 0.4 Current financial liabilities 13 44.3 0.0 -3.2 -12.1 29.0
Non-current financial liabilities 13 14.8 0.0 -2.3 15.4 27.9
59.7 0.0 -5.6 3.1 57.3
Lease liabilities of €0.4 million are divided into short-term lease liabilities (€0.3 million), other short-term
financial liabilities and long-term lease liabilities (€0.1 million), which are part of other long-term financial
liabilities. Non-current financial liabilities of €27.9 million are part of other non-current financial liabilities.
27. Contingencies and Contingent Liabilities
Contingencies
As in the previous year, there were no reportable contingencies.
Contingent Liabilities As in the previous year, there were no reportable contingent liabilities.
28. Other Financial Obligations
Obligations from Operating Lease The Group rents and leases offices, warehouses, facilities and fleets of vehicles and sales rooms for its own
retail business. Rental agreements for the retail business are concluded for terms of between five and fifteen years. The remaining rental and lease agreements typically have residual terms of between one and five
years. Some agreements include options to renew and price adjustment clauses.
Total expenses resulting from these agreements amounted in 2017 to €163.2 million (previous year: €149.9
million) and €19.9 million (previous year: €16.2 million) were sales-dependent.

47
As of the balance sheet date, the obligations from future minimum rental payments for operating lease
agreements are as follows:
2017
€ million
Under rental and lease agreements:
2018 (2017) 128.1
2019 – 2022 (2018 – 2021) 286.6
from 2023 (from 2022) 86.8
Total 501.4
Further Other Financial Obligations Furthermore, the Company has other financial obligations associated with license, promotional and
advertising agreements, which give rise to the following financial obligations as of the balance sheet date:
2017
€ million
Under license, promotional and advertising agreements:
2018 (2017) 181.8
2019 – 2022 (2018 – 2021) 542.6
from 2023 (from 2022) 367.6
Total 1,092.0
As is customary in the industry, the promotional and advertising agreements provide for additional payments
on reaching pre-defined goals (e.g. medals, championships). Although these are contractually agreed upon, they naturally cannot be exactly foreseen in terms of their timing and amount.
In addition, there are other financial obligations totaling €26.1 million, of which €13.1 million relate to the years from 2019. These include service agreements of €25.5 million and other obligations of €0.6 million.
29. Managing Directors and Administrative Board Disclosures pursuant to Section 314 (1)(6) of the HGB (German Commercial Code)
In accordance with the Act on Disclosure of Management Board Compensation of August 3, 2005, the disclosure of the individual earnings of the members of the Board of Management and Managing Directors
may be dispensed with for a period of 5 years pursuant to Section 285(9)(a) sentences 5 - 8; Section 314 (1)(6)(a) sentences 5 - 8 of the HGB, if the Annual General Meeting passes a resolution in this regard by a
75% majority.
Pursuant to the resolution of the Annual General Meeting of May 7, 2013, the Company was authorized to
refrain from disclosures pursuant to Section 285(9)(a) sentences 5 - 8 and Section 314 (1)(6)(a) sentences 5-8 of the HGB with respect to the financial year beginning on January 1, 2013 and all subsequent financial
years ending December 31, 2017 at the latest.
The Managing Directors and the Administrative Board are of the opinion that the shareholders' justified
interest in information is sufficiently accounted for by the disclosure of the total compensation of the Managing Directors. The Administrative Board will ensure that individual compensation is appropriate in
accordance with its statutory duties.
The Managing Directors The compensation of the Managing Directors, which is determined by the Administrative Board, consists of
non-performance-based and performance-based components. The non-performance-based components consist of a fixed salary and non-cash compensation, whereas the performance-based components consist of
bonuses and components with a long-term incentive effect. Along with job assignments and performance of
each individual Managing Director, the criteria for calculating the total remuneration are the economic

48
situation, long-term strategic planning and related targets, the long-term durability of targeted results and
the company's long-term prospects.
A fixed salary is paid out monthly as non-performance-based basic compensation. In addition, the Managing Directors receive non-cash compensation, such as company cars, pension contributions and insurance
premiums. In principle, these benefits are granted to all Managing Directors in an equal manner and are
included in the non-performance-based compensation. The fixed compensation for the three Managing Directors amounted to €2.1 million in the financial year (previous year: €1.9 million). Non-cash
compensation totaled €0.1 million (previous year: €0.1 million).
The bonus component of performance-related compensation is mainly based on the PUMA Group's operating
income (EBIT) and free cash flow and is staggered according to the degree to which targets are met. In addition, qualitative individual goals are set. An upper limit is also agreed. In the financial year, variable
bonuses came to €3.9 million (previous year: €2.5 million).
Pro-rata provisions totaling €8.4 million (previous year: €2.1 million) were set up for the existing compensation program (virtual shares/monetary units) with long-term incentives (from the years 2014 to
2017) for Managing Directors in financial year 2017 according to the vesting periods. Under the
performance-based program, 70% of the compensation will be based on the medium-term performance of PUMA SE’s share and 30% will be based on the medium-term performance of Kering SA’s share in relation to
benchmark companies. Further information on this program can be found in Section 19 of the Notes to the Consolidated Financial Statements. In addition, a payment of €0.4 million (previous year: €0.0 million) was
made in connection with the Stock Option Program 2012, which expired at the end of April 2017.
Managing Directors have pension commitments as part of deferred compensation, which are paid from the
aforementioned performance-based and/or non-performance-based remuneration for which the company has taken out reinsurance for pension commitments. The proportion of the pension capital that is already
financed through contributions to the pension liability insurance is deemed to be vested. During the financial year, €0.4 million was allocated for Managing Directors (previous year: €0.4 million). The present value of
the pension benefits granted to active Managing Directors in the amount of €4.5 million as of Sunday,
December 31, 2017 (previous year: €2.6 million) was offset against the pledged asset value of the pension liability insurance policy, which was of an equal amount.
There are performance-based pension obligations to former members of the Board of Management and their
widows/widowers amounting to €3.3 million (previous year: €3.5 million, and contribution-based pension
obligations in association with deferred payment from previous members of the Board of Management and Manging Directors of €10.3 million (previous year: €10.0 million). Both items are accordingly recognized as
liabilities under pension provisions, unless they are offset against asset values of an equal amount. Pension obligations to former members of the Board of Management and their widows/widowers amounted to €0.2
million) (previous year: €0.2 million).
Administrative Board
In accordance with the Articles of Association, the Administrative Board has at least three members; it currently consists of six members. The compensation of the Administrative Board is comprised of a fixed and
a performance-based component. The total fixed compensation amounted to €0.3 million (previous year: €0.3 million).
In accordance with the Articles of Association, each member of the Administrative Board receives a fixed annual compensation in the amount of € 25.0 thousand. The fixed compensation is increased by an
additional fixed annual amount of €25.0 thousand for the Chairman of the Administrative Board, €12.5 thousand for the Vice-Chairman of the Administrative Board, €10.0 thousand for each committee chairman
(excluding the Nominating Committee) and €5.0 thousand for each committee member (excluding the
Nominating Committee).
In addition, each Administrative Board member receives performance-based compensation equal to €20.00 for each €0.01 by which the earnings per share figure exceeds a minimum amount of €16.00 per share. The
performance-based compensation amounts to a maximum of €10.0 thousand per year. The Chairman of the Administrative Board receives twice this amount (maximum €20.0 thousand) and the Vice Chairman receives
one and a half times this amount (maximum €15.0 thousand) in compensation. Since earnings per share are
below the minimum amount in the financial year, no performance-based compensation will be paid.

49
30. Related Party relationships In accordance with IAS 24, relationships to related companies and parties that control or are controlled by
the PUMA Group must be reported, unless such related parties are already included as consolidated
companies in the consolidated financial statements of PUMA SE. Control is defined as the ability to determine an entity's financial and business policies and benefit from its activities.
At the balance sheet date, SAPARDIS SE, Paris, a wholly owned subsidiary of Kering S.A., holds over 75% of
the subscribed capital of PUMA SE. Kering S.A. is controlled by Artémis S.A., Paris, which in turn is a wholly-owned subsidiary of Financière Pinault S.C.A., Paris. Consequently, all companies that are directly or
indirectly controlled by Artémis S.A. and are not included in the consolidated financial statements of PUMA
SE are considered related companies.
In addition, the disclosure obligation pursuant to IAS 24 extends to transactions with associated companies as well as transactions with other related companies and parties. These include non-controlling shareholders
in particular.
Transactions with related companies and parties largely concern the sale of goods and services. These sales
were concluded under normal market conditions that are also customary with third parties.
The following overview illustrates the scope of the business relationships:
Deliveries and services rendered
Deliveries and services received
2017 2016
2017 2016
€ million € million
€ million € million
Artémis-Group consolidated companies 0.0 0.0
0.0 0.0
Kering-Group consolidated companies 3.6 3.3
5.7 6.7
Other related parties 0.3 0.1
16.6 16.5
Total 3.9 3.4
22.4 23.2
Net receivables from
Payables to
2017 2016
2017 2016
€ million € million
€ million € million
Artémis-Group consolidated companies 0.0 0.0
0.0 0.0
Kering-Group consolidated companies 1.3 1.3
2.3 19.7
Other related parties 0.1 0.0
2.8 0.1
Total 1.4 1.3
5.1 19.8
In addition, dividend payments of €13.3 million were made to non-controlling shareholders in the financial year 2017 (previous year: €19.3 million).
Apart from dividend income of €0.8 million (previous year: €0.7 million) there were no further transactions
with associated companies.
Receivables from related companies and parties are, with one exception, not subject to value adjustments.
Only with respect to the receivables from a non-controlling shareholder and its group of companies were gross receivables in the amount of €52.2 million adjusted in value for a subsidiary of Puma SE in Greece as
of December 31, 2017 (previous year: €52.2 million). As in the previous year, no expenses were recorded in this respect in the financial year 2017.
As of December 31, 2017, there were no liabilities to companies included in the Kering Group arising from financing activities (previous year: €19.0 million). In the previous year, this item was reported under other
current financial liabilities.

50
The Managing Directors as well as the members of the Administrative Board of the PUMA Group are related
parties within the meaning of IAS 24. The services and compensation of this group of individuals is shown in paragraph 29.
As part of consulting, service and employment contracts, members of the Administrative Board received
compensation from PUMA in the amount of €0.1 million (previous year: €0.3 million).
31. Corporate Governance In November 2017, the Managing Directors and the Administrative Board submitted the required compliance
declaration with respect to the recommendations issued by the Government Commission German Corporate Governance Code pursuant to Section 161 of the AktG (Aktiengesetz, German Stock Corporation Act) and
published it on the Company's website (www.puma.com). Please also refer to the Corporate Governance
Report in the Combined Management Report of PUMA SE.
32. Events after the Balance Sheet Date
There were no events after the balance sheet date that had any material impact on the net assets, financial
position and results of operations of the PUMA Group.
With regard to the future development of PUMA’s shareholder structure, we refer to the ad hoc
announcement of PUMA SE on January 11, 2018.
33. Declaration by the Legal Representatives
We state to the best of our knowledge that the consolidated financial statements give a true and fair view of the net assets, financial position and results of operations of the Group in accordance with the applicable
accounting principles, and the management report summarized in the management report of the parent
company for the 2017 financial year provides a true and fair view of the course of the development and performance of the business and the position of the Group, together with a description of the principal risks
and opportunities associated with the expected performance of the Group.
Date of Release
The Managing Directors of PUMA SE released the consolidated financial statements on February 9, 2018 for distribution to the Administrative Board. The task of the Administrative Board is to review the consolidated
financial statements and state whether it approves them.
Herzogenaurach, February 9, 2018
The Managing Directors
Gulden Lämmermann Sørensen
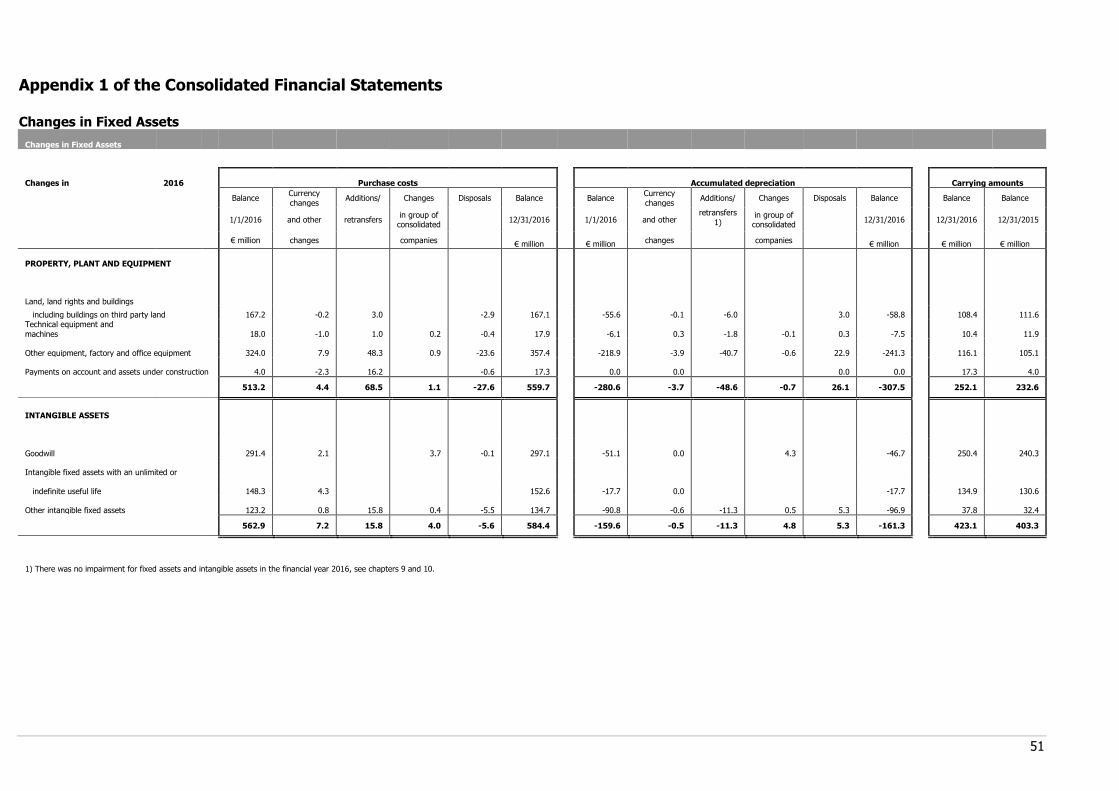
51
Appendix 1 of the Consolidated Financial Statements Changes in Fixed Assets
Changes in Fixed Assets
Changes in 2016 Purchase costs Accumulated depreciation
Carrying amounts
Balance
Currency
changes Additions/ Changes Disposals Balance Balance
Currency
changes Additions/ Changes Disposals Balance Balance Balance
1/1/2016 and other retransfers
in group of consolidated
12/31/2016 1/1/2016 and other retransfers
1)
in group of consolidated
12/31/2016 12/31/2016 12/31/2015
€ million changes companies € million € million changes companies € million € million € million
PROPERTY, PLANT AND EQUIPMENT
Land, land rights and buildings
including buildings on third party land 167.2 -0.2 3.0 -2.9 167.1 -55.6 -0.1 -6.0 3.0 -58.8 108.4 111.6 Technical equipment and
machines 18.0 -1.0 1.0 0.2 -0.4 17.9 -6.1 0.3 -1.8 -0.1 0.3 -7.5 10.4 11.9
Other equipment, factory and office equipment 324.0 7.9 48.3 0.9 -23.6 357.4 -218.9 -3.9 -40.7 -0.6 22.9 -241.3 116.1 105.1
Payments on account and assets under construction 4.0 -2.3 16.2 -0.6 17.3 0.0 0.0 0.0 0.0 17.3 4.0
513.2 4.4 68.5 1.1 -27.6 559.7 -280.6 -3.7 -48.6 -0.7 26.1 -307.5 252.1 232.6
INTANGIBLE ASSETS
Goodwill 291.4 2.1 3.7 -0.1 297.1 -51.1 0.0 4.3 -46.7 250.4 240.3
Intangible fixed assets with an unlimited or
indefinite useful life 148.3 4.3 152.6 -17.7 0.0 -17.7 134.9 130.6
Other intangible fixed assets 123.2 0.8 15.8 0.4 -5.5 134.7 -90.8 -0.6 -11.3 0.5 5.3 -96.9 37.8 32.4
562.9 7.2 15.8 4.0 -5.6 584.4 -159.6 -0.5 -11.3 4.8 5.3 -161.3 423.1 403.3
1) There was no impairment for fixed assets and intangible assets in the financial year 2016, see chapters 9 and 10.

52
Changes in 2017 Purchase costs Accumulated depreciation
Carrying amounts
Balance Currency changes Additions/ Changes Disposals Balance Balance Currency changes Additions/ Changes Disposals Balance Balance Balance
1/1/2017 and other retransfers in group of
consolidated 12/31/2017 1/1/2017 and other
retransfers
1)
in group of
consolidated 12/31/2017 12/31/2017 12/31/2016
€ million changes companies € million € million changes companies € million € million € million
PROPERTY, PLANT AND EQUIPMENT
Land, land rights and buildings
including buildings on third party land 167.1 -8.4 2.0 -29.0 131.8 -58.8 3.4 -5.3 18.5 -42.1 89.7 108.4
Technical equipment and machines 17.9 0.4 1.9 -0.9 19.2 -7.5 -0.1 -2.1 0.6 -9.1 10.1 10.4
Other equipment, factory and office equipment 357.4 -21.0 62.4 -38.5 360.2 -241.3 15.1 -48.7 36.6 -238.2 122.0 116.1
Payments on account and assets under construction 17.3 -4.5 25.6 -0.1 38.3 0.0 0.0 -0.0 38.3 17.3
559.7 -33.6 92.0 0.0 -68.5 549.5 -307.5 18.5 -56.1 0.0 55.7 -289.5 260.1 252.1
INTANGIBLE ASSETS
Goodwill 297.1 -8.9 288.2 -46.7 0.4 -46.3 241.9 250.4
Intangible fixed assets with an unlimited or
indefinite useful life 152.6 -16.3 136.3 -17.7 -17.7 118.5 134.9
Other intangible fixed assets 134.7 -3.6 31.0 -6.1 156.0 -96.9 2.9 -14.3 4.6 -103.7 52.4 37.8
584.4 -28.8 31.0 0.0 -6.1 580.5 -161.3 3.3 -14.3 0.0 4.6 -167.7 412.8 423.1
1) There was no impairment for fixed assets and intangible assets in the financial year 2017, see chapters 9 and 10.

53
Appendix 2 of the Consolidated Financial Statements
Managing Directors
Bjørn Gulden Chief Executive Officer (CEO)
Membership of other supervisory boards and controlling bodies:
• Tchibo GmbH, Hamburg
• Borussia Dortmund GmbH & Co. KGaA, Dortmund
• Dansk Supermarked A/S, Højbjerg/Denmark
• Pandora A/S, Copenhagen/Denmark
Michael Lämmermann
Chief Financial Officer (CFO)
Lars Radoor Sørensen
Chief Operating Officer (COO) Membership of other supervisory boards and controlling bodies:
• Scandinavian Brake Systems A/S, Svendborg/Denmark
• Hoyer Group A/S, Copenhagen/Denmark

54
Appendix 3 of the Consolidated Financial Statements
Administrative Board
Jean-François Palus
(Chairman)
London, United Kingdom Group Managing Director and member of the Administrative Board of Kering S.A., Paris/France, responsible
for Strategy, Operations and Organization
Membership of other supervisory boards and controlling bodies:
• Kering Americas, Inc., New York/USA
• Volcom, LLC., Costa Mesa/USA
• Kering Tokyo Investment Ltd., Tokyo/Japan
• Pomellato S.p.A, Milan/Italy
• Volcom Luxembourg Holding S.A., Luxembourg/Luxembourg
• Sowind Group S.A., La Chaux-de-Fonds/Switzerland
• Guccio Gucci SpA., Florence/Italy
• Gucci America, Inc., New York/USA
• Christopher Kane Ltd., London/United Kingdom
• Manufacture et fabrique de montres et chronomètres Ulysse Nardin Le Locle S.A., Le
Locle/Switzerland
• Kering Eyewear S.p.A., Padua/Italy • Yugen Kaisha Gucci LLC, Tokyo/Japan
• Birdswan Solutions Ltd., Haywards Heath/West Sussex/United Kingdom
• Paintgate Ltd., Haywards Heath/West Sussex/United Kingdom
• Stella McCartney Ltd., Haywards Heath/West Sussex/United Kingdom
• Kering Asia Pacific Ltd., Hong-Kong/China
• Kering South East Asia PTE Ltd., Singapore
• Altuzarra LLC, New York/USA
• Tomas Maier Holding LLC, New York/USA
• Tomas Maier Distribution LLC, New York/USA
• Tomas Maier LLC, New York/USA
François-Henri Pinault (Deputy Chairman until 12 April 2017)
Paris, France
CEO and Chairman of the Administrative Board of Kering S.A., Paris/France
Member until 12 April 2017
Membership of other supervisory boards and controlling bodies:
• Artémis S.A., Paris/France
• Collection Pinault, Paris/France
• Financière Pinault S.C.A., Paris/France
• Société Civile du Vignoble de Château Latour S.C., Pauillac/France
• Sonova Mangement (SAS), Paris/France
• Sonova SCS, Paris/France
• Soft Computing S.A., Paris/France
• Yves Saint Laurent S.A.S., Paris/France
• Sapardis SE, Paris/France
• Volcom, LLC, Costa Mesa/USA
• Stella McCartney Ltd., Haywards Heath/West Sussex/United Kingdom
• Kering International Ltd., London/United Kingdom
• Manufacture et fabrique de montres et chronomètres Ulysse Nardin Le Locle S.A., Le Locle/Switzerland
• Kering Eyewear S.p.A., Padua/Italy
• Kering UK Services Ltd., London/United Kingdom
• Bucheron Holding SAS, Paris/France

55
Thore Ohlsson
(Deputy Chairman since 12 April 2017) Falsterbo, Sweden
President of Elimexo AB, Falsterbo/Sweden
Membership of other supervisory boards and controlling bodies:
• Docktricks AB, Uppsala/Sweden
• Elite Hotels AB, Stockholm/Sweden
• Tomas Frick AB, Vellinge/Sweden
• Tjugonde AB, Malmö/Sweden
• Dahlqvists Fastighetsförvaltning AB, Kristianstad/Sweden
Todd Hymel Santa Ana, USA
Chief Executive Officer (CEO) of Volcom, Inc., Costa Mesa/ USA
Member until 12 April 2017
Jean-Marc Duplaix Paris, France
Chief Financial Officer (CFO) of Kering S.A., Paris/France
Membership of other supervisory boards and controlling bodies:
• Sapardis SE, Paris/France,
• Redcats S.A., Paris/France
• E_lite S.p.A., Milan/Italy
• Kering Italia S.p.A., Florence/Italy
• Pomellato S.p.A., Milan/Italy
• Kering Japan Ltd., Tokyo/Japan
• Kering Tokyo Investment Ltd., Tokyo/Japan
• Kering Luxembourg S.A., Luxembourg/Luxembourg
• Qeelin Holding Luxembourg S.A., Luxembourg/Luxembourg
• E-Kering Lux S.A., Luxembourg/Luxembourg
• Luxury Fashion Luxembourg S.A., Luxembourg/Luxembourg
• Kering Spain S.L. (previously named Noga Luxe S.L.), Barcelona/Spain
• Kering Eyewear S.p.A., Padua/Italy
• GPo Holding S.A.S., Paris/France
• Design Management Srl, Florence/Italy
• Design Management 2 Srl, Florence/Italy
• Kering Studio S.A.S., Paris/France
• Balenciaga Asia Pacific Ltd., Hong Kong/China
• Kering Eyewear Japan Ltd., Tokyo/Japan
• Redcats International Holding S.A.S., Paris/France
• Redcats Management Services S.A.S., Paris/France
• Balenciaga S.A., Paris/France
• Kering Investments Europe B.V., Amsterdam/Netherlands
• Altuzarra LLC, New York/USA

56
Béatrice Lazat,
Paris, France Human Resources Director, Kering S.A., Paris/France
Membership of other supervisory boards and controlling bodies:
• Sapardis SE, Paris/France
• Castera S.A.R.L., Luxembourg/Luxembourg
• Luxury Goods Services S.A., Cadempino/Switzerland
• Augustin S.A.R.L., Paris/France
• Prodistri S.A., Paris/France
• Conseil et Assistance S.N.C., Paris/France
Martin Koeppel
(Employees’ Representative) Weisendorf, Germany
Chairman of the Works Counsel of PUMA SE
Gernot Heinzel
(Employees’ Representative) Hausen, Deutschland
Key Account Manager Shoe Chains Germany South
Member since 12 April 2017
Bernd Illig (Employees’ Representative)
Bechhofen, Germany
Administrator IT Systems of PUMA SE
Member until 12 April 2017
Guy Buzzard (Employees’ Representative)
West Kirby, Great Britain
Field Account Manager at PUMA United Kingdom Ltd.
Member until 12 March 2017

57
Administrative Board Committees
Personnel Committee
• Jean-François Palus (Chairman)
• Béatrice Lazat
• Martin Köppel
Audit Committee
• Thore Ohlsson (Chairman)
• Jean-Marc Duplaix
• Gernot Heinzel
Sustainability Committee
• Jean-François Palus (Chairman)
• Béatrice Lazat
• Martin Koeppel
Nominating Committee
• Jean-François Palus (Chairman)
• Jean-Marc Duplaix
• Béatrice Lazat
This is a translation of the German version. In case of doubt, the German version shall apply.

INDEPENDENT AUDITOR’S REPORT
To PUMA SE, Herzogenaurach
REPORT ON THE AUDIT OF THE CONSOLIDATED FINANCIAL STATEMENTS AND OF THE
COMBINED MANAGEMENT REPORT
Audit Opinions
We have audited the consolidated financial statements of PUMA SE, Herzogenaurach, and its
subsidiaries (the Group), which comprise the consolidated balance sheet as at 31 December 2017,
the consolidated income statement, the consolidated statement of comprehensive income, the
consolidated statement of changes in equity and the consolidated cash flow statement for the
financial year from 1 January to 31 December 2017 as well as the notes to the consolidated financial
statements, including a summary of significant accounting policies. In addition, we have audited the
combined management report of PUMA SE for the financial year from 1 January to 31 December
2017. In accordance with the German legal requirements, we have not audited the content of those
parts of the notes to the consolidated financial statements and of the combined management report
as specified in the Chapter “Other information” of our independent auditor´s report.
In our opinion, on the basis of the knowledge obtained in the audit
• the accompanying consolidated financial statements comply, in all material respects, with the
International Financial Reporting Standards (IFRS) as adopted by the EU, and the additional
requirements of German commercial law pursuant to Section 315e (1) German Commercial Code
(HGB) and, in compliance with these requirements, give a true and fair view of the assets,
liabilities, and financial position of the Group as at 31 December 2017, and of its financial
performance for the financial year from 1 January to 31 December 2017, and
• the accompanying combined management report as a whole provides an appropriate view of the
Group’s position. In all material respects, this combined management report is consistent with
the consolidated financial statements, complies with German legal requirements and appropriately
presents the opportunities and risks of future development.
Our audit opinions on the consolidated financial statements and on the combined management report
do not cover the content of those parts of the notes to the consolidated financial statements and of
the combined management report as specified in the Chapter “Other information” of our independent
auditor´s report.
Pursuant to Section 322 (3) Sentence 1 German Commercial Code (HGB), we declare that our audit
has not led to any reservations relating to the legal compliance of the consolidated financial
statements and of the combined management report.

Basis for the Audit Opinions
We conducted our audit of the consolidated financial statements and of the combined management
report in accordance with Section 317 German Commercial Code (HGB) and the EU Audit Regulation
(No. 537/2014; referred to subsequently as “EU Audit Regulation”) and in compliance with German
Generally Accepted Standards for Financial Statement Audits promulgated by the Institut der
Wirtschaftsprüfer (IDW). Our responsibilities under those requirements and principles are further
described in the “Auditor’s Responsibilities for the Audit of the Consolidated Financial Statements and
of the Combined Management Report” section of our auditor’s report. We are independent of the
group entities in accordance with the requirements of European law and German commercial and
professional law, and we have fulfilled our other German professional responsibilities in accordance
with these requirements. In addition, in accordance with Article 10 (2) Point (f) of the EU Audit
Regulation, we declare that we have not provided non-audit services prohibited under Article 5 (1)
of the EU Audit Regulation. We believe that the audit evidence we have obtained is sufficient and
appropriate to provide a basis for our audit opinions on the consolidated financial statements and on
the combined management report.
Key Audit Matters in the Audit of the Consolidated Financial Statements
Key audit matters are those matters that, in our professional judgment, were of most significance in
our audit of the consolidated financial statements for the financial year from 1 January to 31
December 2017. These matters were addressed in the context of our audit of the consolidated
financial statements as a whole and in forming our audit opinion thereon; we do not provide a
separate audit opinion on these matters.
In the following we present the key audit matters we have determined in the course of our audit:
1. Recoverability of goodwill
2. Recoverability of the Cobra brand
3. Deferred taxes on tax loss carry forwards
Our presentation of these key audit matters has been structured as follows:
a. Description (including reference to corresponding information in the consolidated financial
statements)
b. Auditor’s response

1. Recoverability of goodwill
a. The consolidated financial statements of PUMA SE show goodwill in the amount of mEUR 241.9
corresponding to approximately 8.5 % of the consolidated balance sheet total or 14.6 % of the
group equity.
Each financial year or in case of respective signs of impairment, goodwill is subject to impairment
tests. The impairment tests are performed by PUMA SE by applying the “discounted cash flow
method”. The valuation is based on the present values of the future cash flows. The company’s
valuation model is based on future cash flows, which are in turn based on the effective three-year
plan and valid at the date the impairment test. This detailed planning phase is extended with the
assumption of long-term growth rates. The discounting is performed using the weighted average
cost of capital (WACC). Here, the realizable amount is determined on the basis of the value in use
and a possible need for impairment is determined by comparing the value in use with the carrying
amount.
The outcome of this valuation highly depends on the managing directors’ assessment of future
cash flows, the WACC rate applied and the long-term growth rate and therefore involves
uncertainties and discretion. Thus, the assessment of the recoverability of the goodwill was
classified as a key audit matter within the scope of our audit.
Information on the goodwill, provided by the managing directors, is disclosed in Chapter 2
“Significant Consolidation, Accounting and Valuation Principles” and in Chapter 10 “Intangible
Assets” of the notes to the consolidated financial statements.
b. Within the scope of our audit, we gained an understanding of the systematic approach applied
when performing the impairment test. We assessed whether the valuation model adequately
presents the requirements of the relevant standards, whether the necessary input data are
completely and accurately determined and whether the calculations within the model are
performed correctly. We satisfied ourselves of the appropriateness of the future cash flows used
for the computation by reconciling these cash flows particularly with the effective three-year plan
as well as by interviewing the managing directors with regard to the material assumptions
underlying this plan. In addition, we performed a critical assessment of the plan under
consideration of general and industry-specific market expectations.
Since a material portion of the value in use results from the forecasted cash flows for the period
after the three-year plan (phase of perpetuity), we in particular critically assessed the sustainable
growth rate used within the perpetuity phase by means of general and industry-specific market
expectations. Since relatively low changes of the discounting rate may materially affect the
amount of the realizable value, we have also checked the parameters used when determining the
WACC rate involving internal valuation experts from the financial advisory sector and reproduced
the computation scheme.
Due to the material significance and taking into account the fact that the assessment of the
goodwill also depends on the economic framework conditions that cannot be influenced by the

Group, we performed in addition a critical assessment of the sensitivity analyses performed by
PUMA SE for the cash-generating units (so-called CGUs) with low headroom (present values
compared to the carrying amount) in order to be able to assess a possible impairment risk in case
of change of a material valuation assumption.
2. Recoverability of the Cobra brand
a. The consolidated financial statements of PUMA SE disclose for the Cobra brand a brand value of
mEUR 118.6 corresponding to approximately 4.2 % of the consolidated balance sheet total or 7.2
% of the group equity.
The Cobra brand is subject to an impairment test conducted annually or in case of a triggering
event. The impairment test is conducted by PUMA SE based on the relief from royalty method.
According to this approach, the value of the brand results from future royalty that a company
would have to pay for the use of the brand if they had to license it. The approach uses forecasted
revenue generated with the Cobra brand based on the effective three-year plan, valid at the time
the impairment test is conducted. Subsequently, the projection period is extended assuming long-
term growth rates. The discounting is performed by means of the weighted average cost of capital
(WACC). The recoverable amount and the need for impairment is determined by comparing the
value in use with the carrying amount.
The outcome of this valuation highly depends on the managing directors’ assumption of future
revenue to be generated with the Cobra brand, the royalty rate and the long-term growth rate as
well as the WACC rate applied and therefore involves uncertainties and discretion. Thus, the
assessment of the recoverability of the Cobra Brand was classified as key audit matter within the
scope of our audit.
Information on the Cobra brand, provided by the managing directors, is disclosed in Chapter 2
“Significant Consolidation, Accounting and Valuation Principles” and in Chapter 10 “Intangible
Assets” of the notes to the consolidated financial statements.
b. Within the scope of our audit, we gained an understanding of the systematic approach applied to
the impairment test. We assessed, whether the valuation model adequately reflects the concept
requirements of the relevant standards, whether the necessary input data are completely and
accurately determined and whether the calculations applied to the model are made correctly. We
satisfied ourselves of the appropriateness of the assumed future revenue underlying the
computation (Cobra branded sales) by reconciling these sales particularly with the effective three-
year plan as well as by interviewing the managing directors with regard to the material
assumptions underlying this plan. In addition, we performed a critical assessment of the plan
taking into account general and industry-specific market expectations.
Since a material portion of the value in use results from the forecasted revenue for the period
following the three-year plan (phase of perpetuity), we particularly reviewed the sustainable

growth rate applied to the perpetuity phase by means of general and industry-specific market
expectations. As even relatively small changes of the expected royalty rate and the used discount
rate may have a material effect on the value in use, we also assessed the parameters involved in
the assumed royalty rate and determination of the discount rate involving internal valuation
experts from the financial advisory sector and recalculated the computation scheme. Additionally,
we reviewed the applied royalty rate based on industry-specific average rates.
Due to the material significance and as the measurement of the brand also depends on general
economic conditions that are beyond the Group’s control, we additionally reviewed the sensitivity
analyses concerning the Cobra brand originally conducted by Puma SE in order to be able to
determine a potential impairment risk in case a material assumption underlying the measurement
changes.
3. Deferred taxes on tax loss carry forwards
a. Within the consolidated financial statements of PUMA SE, the deferred tax assets include a total
amount of mEUR 92.2 for tax losses carried forward. The Group assesses the future utilization of
the tax losses carried forward based on the tax plans for the respective companies. The tax plan
is derived from the corporate plan prepared by the managing directors. From our point of view,
the deferred tax assets were of special importance, since the corporate plan as basis for the
recoverability of the deferred tax assets strongly depends on the assessment and assumptions of
the managing directors and is thus subject to uncertainties and discretion.
Information on the deferred tax assets on tax loss carry forwards, provided by the managing
directors, is disclosed in Chapter 2 “Significant Consolidation, Accounting and Valuation Principles”
and in Chapter 8 “Deferred Taxes” of the notes to the consolidated financial statements.
b. Within the scope of our audit of the tax facts, we assessed the recognition and valuation of the
deferred taxes under involvement of our internal tax experts. In doing so, we evaluated the
established internal processes and controls for the recognition of tax facts as well as for the
determination of the tax loss carry forwards. We assessed the recoverability of the deferred tax
assets on tax loss carry forwards based on the current corporate plan and internal forecasts taking
into account the future tax income situation of the concerned group companies and valued the
appropriateness of the applied assumptions. Furthermore, we reproduced the reconciliation of the
taxable income and the arithmetical correctness. In addition, we checked the completeness and
accuracy of the disclosures required under IAS 12.

Other information
The managing directors are responsible for the other information. The other information comprises:
• the Group’s statement on corporate governance pursuant to Section 315d German Commercial
Code (HGB) specified in Chapter “Corporate Governance Report including the Statement on
Corporate Governance” of the combined management report,
• the corporate governance report pursuant to No. 3.10 of the German Corporate Governance
Code specified in Chapter “Corporate Governance Report including the Statement on Corporate
Governance” of the combined management report,
• the managing directors‘ confirmation relating to the consolidated financial statements and to the
combined management report pursuant to Section 297 (2) Sentence 4 and Section 315 (1)
Sentence 5 German Commercial Code (HGB), respectively, as included in the notes to the
consolidated financial statements,
• the combined non-financial report which will be published after the issuance of this auditor´s
report and
• the remaining parts of the Annual Report which will be published after the issuance of this
auditor´s report, with the exception of the audited consolidated financial statements and
combined management report and our auditor’s report.
Our audit opinions on the consolidated financial statements and on the combined management report
do not cover the other information, and consequently we do not express an audit opinion or any
other form of assurance conclusion thereon.
In connection with our audit, our responsibility is to read the other information and, in so doing, to
consider whether the other information
• is materially inconsistent with the consolidated financial statements, with the combined
management report or our knowledge obtained in the audit, or
• otherwise appears to be materially misstated.

Responsibilities of the Managing Directors and the Administrative Board for the
Consolidated Financial Statements and the Combined Management Report
The managing directors are responsible for the preparation of the consolidated financial statements
that comply, in all material respects, with IFRSs as adopted by the EU and the additional
requirements of German commercial law pursuant to Section 315e (1) German Commercial Code
(HGB) and that the consolidated financial statements, in compliance with these requirements, give
a true and fair view of the assets, liabilities, financial position, and financial performance of the
Group. In addition, the managing directors are responsible for such internal control as they have
determined necessary to enable the preparation of consolidated financial statements that are free
from material misstatement, whether due to fraud or error.
In preparing the consolidated financial statements, the managing directors are responsible for
assessing the Group’s ability to continue as a going concern. They also have the responsibility for
disclosing, as applicable, matters related to going concern. In addition, they are responsible for
financial reporting based on the going concern basis of accounting unless there is an intention to
liquidate the Group or to cease operations, or there is no realistic alternative but to do so.
Furthermore, the managing directors are responsible for the preparation of the combined
management report that, as a whole, provides an appropriate view of the Group’s position and is, in
all material respects, consistent with the consolidated financial statements, complies with German
legal requirements, and appropriately presents the opportunities and risks of future development. In
addition, the managing directors are responsible for such arrangements and measures (systems) as
they have considered necessary to enable the preparation of a combined management report that is
in accordance with the applicable German legal requirements, and to be able to provide sufficient
appropriate evidence for the assertions in the combined management report.
The Administrative Board is responsible for overseeing the Group’s financial reporting process for the
preparation of the consolidated financial statements and of the combined management report.
Auditor’s Responsibilities for the Audit of the Consolidated Financial Statements and of the
Combined Management Report
Our objectives are to obtain reasonable assurance about whether the consolidated financial
statements as a whole are free from material misstatement, whether due to fraud or error, and
whether the combined management report as a whole provides an appropriate view of the Group’s
position and, in all material respects, is consistent with the consolidated financial statements and the
knowledge obtained in the audit, complies with the German legal requirements and appropriately
presents the opportunities and risks of future development, as well as to issue an auditor’s report
that includes our audit opinions on the consolidated financial statements and on the combined
management report.
Reasonable assurance is a high level of assurance, but is not a guarantee that an audit conducted in
accordance with Section 317 German Commercial Code (HGB) and the EU Audit Regulation and in
compliance with German Generally Accepted Standards for Financial Statement Audits promulgated
by the Institut der Wirtschaftsprüfer (IDW) will always detect a material misstatement.
Misstatements can arise from fraud or error and are considered material if, individually or in the
aggregate, they could reasonably be expected to influence the economic decisions of users taken on
the basis of these consolidated financial statements and this combined management report.
We exercise professional judgment and maintain professional skepticism throughout the audit. We
also:
• Identify and assess the risks of material misstatement of the consolidated financial statements
and of the combined management report, whether due to fraud or error, design and perform audit
procedures responsive to those risks, and obtain audit evidence that is sufficient and appropriate
to provide a basis for our audit opinions. The risk of not detecting a material misstatement
resulting from fraud is higher than for one resulting from error, as fraud may involve collusion,
forgery, intentional omissions, misrepresentations, or the override of internal control.
• Obtain an understanding of internal control relevant to the audit of the consolidated financial
statements and of arrangements and measures relevant to the audit of the combined
management report in order to design audit procedures that are appropriate in the circumstances,
but not for the purpose of expressing an audit opinion on the effectiveness of these systems.
• Evaluate the appropriateness of accounting policies used by the managing directors and the
reasonableness of estimates made by the managing directors and related disclosures.
• Conclude on the appropriateness of the managing directors’ use of the going concern basis of
accounting and, based on the audit evidence obtained, whether a material uncertainty exists
related to events or conditions that may cast significant doubt on the Group’s ability to continue
as a going concern. If we conclude that a material uncertainty exists, we are required to draw
attention in the auditor’s report to the related disclosures in the consolidated financial statements
and in the combined management report or, if such disclosures are inadequate, to modify our
respective audit opinions. Our conclusions are based on the audit evidence obtained up to the
date of our auditor’s report. However, future events or conditions may cause the Group to cease
to be able to continue as a going concern.

• Evaluate the overall presentation, structure and content of the consolidated financial statements,
including the disclosures, and whether the consolidated financial statements present the
underlying transactions and events in a manner that the consolidated financial statements give a
true and fair view of the assets, liabilities, financial position and financial performance of the
Group in compliance with IFRSs as adopted by the EU and with the additional requirements of
German commercial law pursuant to Section 315e (1) German Commercial Code HGB).
• Obtain sufficient appropriate audit evidence regarding the financial information of the entities or
business activities within the Group to express audit opinions on the consolidated financial
statements and on the combined management report. We are responsible for the direction,
supervision and performance of the group audit. We remain solely responsible for our audit
opinions.
• Evaluate the consistency of the combined management report with the consolidated financial
statements, its conformity with German law, and the view of the Group’s position it provides.
• Perform audit procedures on the prospective information presented by the executive directors in
the combined management report. On the basis of sufficient appropriate audit evidence we
evaluate, in particular, the significant assumptions used by the executive directors as a basis for
the prospective information, and evaluate the proper derivation of the prospective information
from these assumptions. We do not express a separate audit opinion on the prospective
information and on the assumptions used as a basis. There is a substantial unavoidable risk that
future events will differ materially from the prospective information.
We communicate with those charged with governance regarding, among other matters, the planned
scope and timing of the audit and significant audit findings, including any significant deficiencies in
internal control that we identify during our audit.
We also provide those charged with governance with a statement that we have complied with the
relevant independence requirements, and communicate with them all relationships and other matters
that may reasonably be thought to bear on our independence, and where applicable, the related
safeguards.
From the matters communicated with those charged with governance, we determine those matters
that were of most significance in the audit of the consolidated financial statements of the current
period and are therefore the key audit matters. We describe these matters in our auditor’s report
unless law or regulation precludes public disclosure about the matter.

OTHER LEGAL AND REGULATORY REQUIREMENTS
Further information pursuant to Article 10 of the EU Audit Regulation
We were elected as group auditor by the annual general meeting on 12 April 2017. We were engaged
by the administrative board on 20 October 2017. We have been the group auditor of PUMA SE,
Herzogenaurach, without interruption since the financial year 2012.
We declare that the audit opinions expressed in this auditor’s report are consistent with the additional
report to the audit committee pursuant to Article 11 of the EU Audit Regulation (long form audit
report).
GERMAN PUBLIC AUDITOR RESPONSIBLE FOR THE ENGAGEMENT
The German Public Auditor responsible for the engagement is Stefan Otto.
Munich, 9 February 2018
Deloitte GmbH
Wirtschaftsprüfungsgesellschaft
Stadter Otto
Wirtschaftsprüfer Wirtschaftsprüfer
[German Public Auditor] [German Public Auditor]

1
Report by the Administrative Board
Dear Shareholders,
In financial year 2017, the Administrative Board has exercised all its duties under the
law, statutes and company rules. It has managed the Company, determined the basic
business strategies and monitored their implementation by the Managing Directors.
In this regard, the Administrative Board has in its four regular meetings discussed and
resolved on the Company’s business policies, all relevant aspects of corporate
development and corporation planning, the Company’s economic situation, including its
net assets, financial position and results of operations, and all key decisions for the
Group. All members participated in drawing up the resolutions. The Managing Directors
have informed the Administrative Board regularly, comprehensively, and in a timely
manner in written and verbal form about the implementation of all decisions and about
all major business transactions. Furthermore, an extraordinary and a constitutive
meeting of the Administrative Board took place.
The Administrative Board discussed in detail all of the Company’s key business
transactions, based on the reports by the Managing Directors and the committees, and
presented its own ideas. The Managing Directors has provided the Administrative Board
with information on any deviations from business performance based on the
specifications that have been given to the Managing Directors by the Administrative
Board. The Administrative Board verified all of these explanations using the supporting
documents submitted. The Administrative Board was involved in all key decisions at an
early stage. In addition, the Chairman of the Administrative Board and other members
of the Administrative Board maintained, and continue to maintain, regular verbal or
written contact with the Managing Directors and keep themselves informed of all major
developments. Overall, these discussions did not give rise to any doubts that the
Managing Directors were managing the Group in anything other than a lawful and
proper manner.

2
Main advisory focus
In the financial year 2017, the focus was primarily on the following topics: Audit and
approval of the 2016 financial statements, dividend policy, setting the agenda for the
Annual General Meeting of April 12, 2017, ongoing business development, the Group’s
financial position, business planning for 2018 and medium-term planning, including
investments, compliance and internal control system as well as material litigation in the
Group. In addition, the Administrative Board has dealt intensively with the corporate
governance, especially with the definition of a competence profile for the Administrative
Board. The agenda also included setting new targets for the proportion of women on the
Administrative Board, at the level of the Managing Directors and at the two
management levels below the Managing Directors.
To address these topics, the Administrative Board reviewed the Company’s financial
reports and records.
Conflicts of interest
The members of the Administrative Board are required to disclose any conflicts of
interest immediately. In the past year, no such disclosures were made.
Committees
In its constitutive meeting on April 12, 2017 the Administrative Board established four
committees to perform its duties. The Board receives regular reports on their work. The
members of the committees are listed in the Notes to the Consolidated Financial
Statements of the Annual Report.
Personnel Committee
The Personnel Committee is responsible for entering into and making changes to
Managing Directors’ employment contracts and for establishing policies for Human
Resources and personnel development. It met once in 2017. Discussions focused on
recommendations for setting bonus payments for the Managing Directors. The
Administrative Board was given a respective recommendation for a resolution.

3
Audit Committee
The Audit Committee held four regular meetings in financial year 2017. In particular,
the Audit Committee is responsible for accounting issues and monitoring the accounting
process, the effectiveness of the internal control system, risk management and the risk
management system, internal audits, compliance and the statutory audit of the financial
statements, with particular regard to the required independence of the statutory
auditors, issuing the audit mandate to the statutory auditors, defining the audit areas of
focus, any additional services to be performed by the auditors and the fee agreement.
Sustainability Committee
The Committee is responsible for promoting corporate sustainability and an awareness
of the need to act fairly, honestly, positively and creatively in every decision made and
every action taken. One meeting was held in 2017. Main focus of the discussions was
the progress achieved on the ten sustainability targets to be achieved by PUMA by
2020. The committee looke din detail at individual projects for example in the area of
social commitment (sach as “Right to Play”), the financial support for manufacturers on
reaching specific energy targets, or the elimination of certain pollutants in the
production chain. In addition, the results of the symposium “Talks at Banz”, which took
place in Hong Kong for the first time after thirteen years thus enabling direct
coordination with the manufacturers on the realization of the sustainability goals, were
presented to the committee.
Nominating Committee
The Nominating Committee proposes suitable shareholder candidates to the
Administrative Board for its voting recommendations to the Annual General Meeting. It
held one meeting in the last financial year. The Nominating Committee recommended
to the Administrative Board that the Administrative Board proposes the election of Mr.
Jean-François Palus (Group Managing Director and member of the Administrative Board
of Kering S.A., Paris/France), Mr. Jean-Marc Duplaix (Chief Financial Officer (CFO) of
Kering S.A., Paris/France), Mr. Thore Ohlsson (President of Elimexo AB,
Falsterbo/Sweden) and Ms. Béatrice Lazat (Human Resources Director, Kering S.A.,
Paris/ France) at the Annual General Meeting on April 12, 2017.

4
Corporate Governance As in previous years, the Administrative Board addressed current developments in the
German Corporate Governance Code (GCGC) in the financial year 2017. It defined a
competence profile for the Administrative Board. The GCGC contains essential statutory
regulations and recommendations for the management and supervision of listed
companies and standards for responsible corporate governance. The corporate
governance standards have long been a part of the corporate routine. None of this is
changed in the single-tier corporate governance system now in place at PUMA.
Pursuant to Paragraph 3.10 of the GCGC, the Administrative Board reports on corporate
governance in the Corporate Governance Report. With very few exceptions, the
Company satisfies the requirements of the GCGC and explains these system-related
exceptions, as well as deviations from the GCGC resulting from PUMA’s single-tier
system, in the Statement of Compliance. The Statement of Compliance of November 9,
2017 is available to our shareholders at any time on the Company’s website under
http://about.puma.com/en/investor-relations/corporate-governance/declaration-of-
compliance/.
Annual financial statements adopted
The annual financial statements for PUMA SE prepared by the Managing Directors in
accordance with German Commercial Code (Handelsgesetzbuch/HGB), the consolidated
financial statements and the combined management report for PUMA SE and the PUMA
Group, each for the financial year 2017, prepared in accordance with Section 315a HGB
on the basis of the International Financial Reporting Standards (IFRS) have been
audited by the statutory auditors, Deloitte GmbH Wirtschaftsprüfungsgesellschaft,
Munich, who were appointed at the Annual General Meeting on April 12, 2017 and
commissioned by the Administrative Board to audit the annual financial statements and
the consolidated financial statements and have been given an unqualified auditor’s
opinion.
In their report, the statutory auditors conclude that PUMA’s institutionalized risk
management system, in accordance with Section 91(2) of the German Stock

5
Corporation Act (Aktiengesetz/AktG), is capable of detecting at an early stage and
countering any developments that might jeopardize the continuity of the Company as a
going concern. The Administrative Board has been updated by the Managing Directors
regularly on all relevant risks in this regard, in particular their assessments of market
and procurement risks, financial risks (including currency risks) and organizational risks.
The accounting records, the audit reports from the statutory auditors and the Managing
Directors’ recommendation on the appropriation of net profit were made available to all
members of the Administrative Board in a timely manner. At the meeting of the Audit
Committee on February 9, 2018 and at the subsequent Administrative Board meeting
held on the same day, the statutory auditors reported on the key results of their audit
and discussed them in detail with the Managing Directors and the members of the
Administrative Board. No discrepancies were detected.
The Administrative Board reviewed in detail the annual financial statements, the
combined management report for PUMA SE and the PUMA Group, the Managing
Directors’ recommendation on the appropriation of net profit and the consolidated
financial statements and raised no objections. In accordance with the recommendation
of the Audit Committee, the Administrative Board agreed with the results of the audit of
both statements and approved the annual financial statements of PUMA SE and the
consolidated financial statements for the 2017 financial year. The 2017 annual financial
statements have thus been adopted.
The Administrative Board and the Managing Directors resolved to propose to the Annual
General Meeting a distribution of a dividend of € 12.50 per dividend entitled share for
the financial year 2017. In this context, the liquidity situation of the Company, the
financing and the effects on the capital market were discussed. A total amount of
around € 187 million will be paid out in dividends from PUMA SE’s net income. The
remaining net income of around € 81 million will be carried forward.

6
Finally, in its meeting on February 9, 2018, the Administrative Board examined in detail
the combined non-financial report in accordance with §§ 315c in conjunction with §§
289c to 289e of the German Commercial Code (HGB) and raised no objections.
Report on relationships with affiliated companies
Since April 10, 2007, PUMA SE has been a dependent company of Sapardis SE, a wholly
owned subsidiary of Kering S.A, which in turn is a subsidiary of Artémis S.A. (due to the
voting right majority), pursuant to Section 17 of the German Stock Corporation Act
(AktG). The report by the Managing Directors on relations with affiliated companies
(Dependent Company Report) specified in Section 312 AktG has been made available to
the Administrative Board. The report has been reviewed by the statutory auditors, who
issued the following auditor’s opinion:
"We have duly examined and assessed the report and hereby certify that:
1. the information contained in the report is correct,
2. the payments made by the corporation in the legal transactions listed in the
report were not unduly high and
3. regarding the other measures listed in the report, there are no circumstances
indicating a materially different assessment from that of the Managing
Directors."
After a thorough review, the Administrative Board agreed with the Dependent Company
Report prepared by the Managing Directors and approved the auditors’ findings. No
objections were raised.
Personnel changes in the Administrative Board
There were the following changes in personnel on the part of the shareholder
representatives in the financial year 2017: Mr. Guy Buzzard, representative of the
employees on the Administrative Board, passed away on March 12, 2017. Moreover, the
Annual General Meeting on April 12, 2017 elected an Administrative Board consisting of
six members. The members are Mr. Jean-François Palus (Group Managing Director and
member of the Administrative Board of Kering S.A., Paris/France), Mr. Jean-Marc

7
Duplaix (Chief Financial Officer (CFO) of Kering S.A., Paris/France), Mr. Thore Ohlsson
(President of Elimexo AB, Falsterbo/Sweden) and Ms. Béatrice Lazat (Human Resources
Director, Kering S.A., Paris, France) as shareholder representative and Mr. Martin
Koeppel and Mr. Gernot Heinzel as employees’ representatives. Each of their term of
office end with the close of the Annual General Meeting that adopts the resolutions
approving the actions of the Board for the financial year 2021.
Thanks
We would like to express our gratitude and recognition to the Managing Directors, the
management teams at the Group companies, the Works Council and all our employees
for their hard work and their outstanding cooperation.
Herzogenaurach, February 12, 2018
On behalf of the Administrative Board
Jean-François Palus
Chairman

Report on Gender Equality and Equal Pay
Pursuant to the provisions of the Entgelttransparenzgesetz (EntgTranspG - Pay Transparency Act), a
separate remuneration report must be drawn up as of calendar year 2018. This report, to be created
for the first time, includes a 12-monthly reporting period and refers to 2016.
Respect, tolerance and equality are an obligation for PUMA. Since 2005, we have followed the PUMA
Code of Conduct and the Diversity Charter since 2010. The Charter was introduced in order to ensure
a fair working environment at PUMA in which all employees have the same opportunities, regardless of
nationality, origin, religion, ideology, age, gender, or sexual orientation.
The ratio of female to male employees (gender ratio) in the PUMA Group is approximately 47:53 female
to male and has remained stable in recent years. In 2016, the proportion of women at all management
levels worldwide was 38%. Although this number has increased in comparison to the previous year, we
are striving to continue to increase the proportion of women in management positions, in particular in
upper management positions, across the globe. To achieve this, at Group level we have committed to
a female ratio of 20% or 30% for both management levels under management. These targets were
slightly exceeded by the end of June 2017. PUMA would like to support the development of women in
management positions on a continuous basis. For this reason, we offer special training courses and
access to interesting networks. Contact and communication with experienced female management
should encourage female employees and motivate them to take on management positions within PUMA
Group.
In 2016, PUMA was granted the “Career and family audit certificate” after successfully passing the
audits. It also emphasizes that we already offer a large number of measures for mothers and fathers to
be able to arrange their professional and private lives even more simply. Due to more flexible working
hours and mobile work, employees can work flexibly in terms of location and, after consultation with
superiors, can also work from home. Furthermore, we offer kindergarten and crèche facilities, a parent-
child office, and an external service provider to support childcare and care for relatives in addition to a
children’s vacation program for employees’ children.
As a further measure to support male and female equality, both as part of our training for management
on the subject of personnel selection and in the training of labor law for management, the General
Equality Act (Allgemeine Gleichbehandlungsgesetzt - AGG) and any possible violations is discussed.
Furthermore, we are in constant dialog with PUMA SE employee representatives on this subject.

PUMA SE is bound by a collective agreement. Classification into individual collective agreement groups
takes place on a gender-neutral basis founded on the collective wage agreement. In 2017, discussions
were held with the works council in order to ensure that no pay discrimination takes place due to gender.
The total number of PUMA SE employees in 2016 amounted to 1,063 employees (509 women and 554
men), 920 of which were full-time employees (381 women and 539 men), and 143 part-time employees
(128 women ad 15 men).