combined digital photogrammetry and time-of-flight laser scanning for monitoring cliff evolution
TRANSCRIPT

COMBINED DIGITAL PHOTOGRAMMETRY ANDTIME-OF-FLIGHT LASER SCANNING FOR MONITORING
CLIFF EVOLUTION
Michael Lim ([email protected])
David N. Petley ([email protected])
Nicholas J. Rosser ([email protected])
Robert J. Allison ([email protected])
Antony J. Long ([email protected])
University of Durham
David Pybus ([email protected])
Cleveland Potash Ltd, Saltburn-by-the-Sea, UK
(Based on a paper presented at the one-day symposium of the Remote Sensing and PhotogrammetrySociety, entitled Photogrammetry and Remote Sensing for Challenging Environments, at the British
Antarctic Survey, Cambridge on 28th April 2004)
Abstract
Although cliffs form approximately 75% of the world’s coastline, the under-standing of the processes through which they evolve remains limited because of a lackof quantitative data on the morphological changes they undergo. In this paper thecombination of terrestrial time-of-flight laser scanning with high-resolution digitalphotogrammetry is examined to generate high-quality data-sets pertaining to thegeomorphic processes governing cliff development. The study was undertaken on asection of hard rock cliffs in North Yorkshire, UK, which has been monitored over a12-month period. High-density, laser-scanned point clouds have been used toproduce an accurate representation of these complex surfaces, free from the opticalvariations that degrade photographic data. These data-sets have been combined withhigh-resolution photographic monitoring, resampled with the fixed accuracies of theterrestrial laser survey, to generate a new approach to recording the volumetricchanges in complex coastal cliffs. This has led to significant improvements in theunderstanding of the activity patterns of coastal cliffs.
Keywords: coastal retreat, digital photogrammetry, high-resolution monitoring, laserscanning, rock cliffs
Introduction
Rock cliffs form some of the most impressive and widespread coastal landforms,accounting for approximately 75% of the total length of coastlines worldwide (Bird, 2000).
The Photogrammetric Record 20(110): 109–129 (June 2005)
� 2005 The Remote Sensing and Photogrammetry Society and Blackwell Publishing Ltd.
Blackwell Publishing Ltd. 9600 Garsington Road, Oxford OX4 2DQ, UK and 350 Main Street Malden, MA 02148, USA.

Although cliffs form a critical interface between the terrestrial and marine environments, theunderstanding of the processes through which they evolve is limited. Cliff retreat is asignificant threat to coastal communities around the world (Jones and Lee, 1994; Lee, 2001),especially in the context of increasing coastal populations (Haslett, 2000) and potentiallyaccelerated process rates resulting from climate change (Houghton et al., 2001). It is estimatedfor example that annual UK government spending on coastal and flood defences is set to reach£564 million in 2005 (DEFRA, 2001). Failure to understand the processes through which rockcliffs evolve means that many coastal protection schemes are poorly designed or inappropriate(Hall et al., 2002).
Coastal cliffs are complex landforms, comprising a steep, eroding rock slope that respondsto a wide range of environmental variables. The strength of a cliff is derived from theproperties of the materials from which it is formed. In most cases, these materials are brokeninto unevenly sized segments by planes of weakness such as joints, faults or bedding surfaces.Retreat of the cliff occurs through incremental erosion and/or through detachment of parts ofthe cliff through falling, sliding or toppling (Hantz et al., 2003). The mechanisms are driven byenvironmental factors such as weathering rates, groundwater levels, wave impact and humanactivity, all of which vary over time and through space (Robinson, 1974). In most cases it is theinteraction between these processes and the resisting properties of the cliff itself that determinethe rate of retreat.
Accurate descriptions of morphometric changes occurring over a range of spatial andtemporal scales are required to enable an understanding of landform evolution. One establishedtechnique for collecting this data is through the use of photogrammetry, but this approach ishindered by the nature of the coastal environment. Near-vertical, unstable slopes are difficultenvironments for the manual collection of ground control points across image overlaps, andlight contrasts, shadowing and perspective variations limit the success of automatedstereomatching processes. However, the development of sophisticated, versatile terrestriallaser scanners offers a new method of field survey in geomorphology (Nagihara et al., 2004).Laser scanning systems collect elevation information directly, removing many of theuncertainties associated with data processing and digital elevation model (DEM) generation.Emitting radiation at wavelengths beyond those of visible light, laser scanners are essentiallyunaffected by changes in the ambient conditions during data collection. However, laserscanning techniques alone do not currently provide adequate qualitative information on theenvironmental conditions at the site, such as the cliff lithology. To circumvent these problems,in this paper the integration of terrestrial time-of-flight laser scanning with high-resolutiondigital photogrammetry is examined to generate accurate information on the geomorphicprocesses governing cliff development. The aim is to promote a new approach to cliffmonitoring, supplementing the data from aerial techniques with a better understanding of theprocesses in operation over the cliff face itself. The combination of photographic imagesresampled within the fixed accuracies of laser scanning has provided a promising source ofqualitative and quantitative information.
Monitoring Cliff Change
Conventional techniques for quantifying cliff change include erosion pins located withinthe rock mass base (Lee et al., 1976) and aerial surveys (Hua and Fairbairn, 2000). Erosionpins have proven useful in quantifying small-scale changes caused by weathering effects, butremain limited spatially and temporally by the position and life of the nail networks. Aerialsurveys, sometimes supplemented by the analysis of historic map data, by definition recordcliff top and toe recession which is ultimately only the result of a more complex process of cliff
Lim et al. Combined digital photogrammetry and time-of-flight laser scanning
110 � 2005 The Remote Sensing and Photogrammetry Society and Blackwell Publishing Ltd.

surface erosion, but the errors involved can be considerable (Moore, 2000). Someimprovement can be achieved with the use of a good quality ground control system, althoughthe location of recognisable markers visible from an aerial perspective is often problematic,particularly in coastal locations. In the case of historic maps, problems occur because of errorsassociated with shrinkage and stretching of the physical document over time, in addition togeneral issues of accuracy and precision associated with map production (Snyder, 1987). Thecumulative errors within the source documents and images are often several orders ofmagnitude larger than the rate of retreat being measured. As a result, measurements typicallylack comparability both between separate surveys and within each mapping project (Crowellet al., 1991). In the case of aerial surveys, two key disadvantages are clear. First, the high costsassociated with data capture limit the frequency at which change can be monitored; evenannual data on cliff top and toe positions are rare. Second, vertical aerial photography is poorlysuited to the measurement of processes associated with near-vertical surfaces. Nonetheless,aerial surveys have remained the principal method of recording shoreline change (Boggettet al., 2000).
An alternative approach to the measurement of cliff retreat rates is through the directmeasurement of processes operating on the cliff face itself. Manual measurements are oftenimpractical due to the difficult terrain and the danger posed by rockfalls and tides. Thus,remotely sensed rapid data acquisition techniques have much to offer studies of cliff slopeprocesses and evolution (Wickens and Barton, 1971; Chandler and Moore, 1989), but untilnow have been insufficiently developed to allow the required level of precision to be achieved.
Terrestrial Digital Photogrammetry
The availability of increasingly sophisticated, cost-effective and automated digital systemshas facilitated the use of photogrammetric techniques in a wide range of geomorphic studies(Baltsavias et al., 2001). The ability to monitor the temporal evolution of three-dimensionalforms at high resolutions has led to successful applications that have improved theunderstanding of a variety of fluvial (Latulippe et al., 2001; Brasington et al., 2003) andterrestrial environments (Genovois et al., 2001). A detailed account of the effective use ofestablished digital techniques for geomorphological investigations is provided by Chandler(1999). Digital photogrammetry has been shown to outperform analytical approaches for therecording of topographic features, both in terms of data collection times and overall accuracy(Bailey et al., 2003). However, this technology can also widen the gap between the operatorand an appropriate level of understanding of the system outputs (Krupnik, 2003). Whilst it isessential that the uncertainties associated with the process of deriving the data must beunderstood, it is clear that the relative ease of DEM generation has led to an emphasis in manyprojects on data analysis without adequate consideration of data quality (Huang, 2000). Indeed,the techniques that are used to assess the quality of DEMs are often inadequate to assess theirreported accuracies.
The accuracy of photogrammetric grid DEMs can be characterised by the root meansquare error (rmse) of every interpolated point in the model. In practice such a completeevaluation of the surface is impractical. The function is therefore commonly performed oncheck point data, thereby providing a quantitative estimate of bilinear interpolations usinglocalised errors associated with data independent from the DEM construction process. Severalquestions have been raised as to the validity of deriving a finite set of rmse values for an entiremodel. The variable accuracy and location of check points are key determinants in theimpression of the DEM performance gained from rmse observations (Gooch and Chandler,2001). The distribution and quantity of residuals from discarded ground control points (GCPs)
The Photogrammetric Record
� 2005 The Remote Sensing and Photogrammetry Society and Blackwell Publishing Ltd. 111

have been used to identify error trends across blocks, demonstrating statistically significanterrors which are not conveyed in rmse calculations (Brasington et al., 2003). Significantvariability has also been noted within other error statistics such as mean error and standarddeviation error for the same set of processes (Lane et al., 2000). Statistical improvements inprocessing evaluations therefore do not necessarily equate to more accurately representedDEMs (Butler et al., 1998).
Many soft copy digital photogrammetric suites produce spatial classifications of thematching performance associated with each DEM extracted. Interpolation of elevations mayresult if the parameters defining the matching algorithms are not met. The threshold forinterpolation may prove a critical factor in the ultimate performance of the model (Lane et al.,2003). Higher correlation minima equate to greater confidence in the matching success of themodel, but are also likely to generate increased interpolation as fewer points meet the acceptancecriteria (Bailey et al., 2003). The limitations of software-supported DEM assessments have ledto the development of new, independent methods for checking data fidelity. DEM quality isheavily reliant on the adequacy of the algorithms used to reconstruct the terrain. The increasingrange of choices and varied combinations of factors that influence DEM production raisequestions over the most appropriate strategies for obtaining required accuracies. An idealised setof search parameters would generate an accurate DEM in which only successfully correlatedpoints were used. In reality DEMs may often include unsuccessfully correlated areas andconsequently distort or even reject some correctly matched points. Gooch and Chandler (2001)developed a strategy-based error detection scheme in order to analyse the spatial distribution ofsuspect correlations within a DEM. The technique involves subtracting two identical DEMs,varying only in the parameter settings used, to generate a difference DEM. The greatest changeon the difference DEM will be principally determined by the heightened response of erroneousor ‘‘failed’’ areas which are commonly mismatched under different parameters. This failurewarning model has proved to be a robust answer to the identification of poor performance withinDEMs from a range of image scales.
In the case of dynamic natural features such as cliff faces, problems with generatingsurface models may occur because image quality is influenced by a variety of factors. Huang(2000) demonstrated that the changes in surface roughness across small sections of cliff facecan cause differing levels of information loss in photogrammetrically derived DEMs. In orderto accurately identify and quantify the errors within a photogrammetric model, a morerepresentative surface of comparable resolution is required (Chandler et al., 2003).
Terrestrial Laser Scanning
The development of laser scanning technologies offers a new method of remote sensingfor geomorphological applications. A wide variety of scanning systems are available, whichfall within two broad concepts of data collection: triangulation and time-of-flight. Triangulatinglaser scanners emit a concentrated beam of light across a surface which is captured by a fixeddigital sensor, enabling precise triangulations to be made of recorded surfaces. Triangulatingsystems are limited in terms of geomorphological applications by the size and weight of thedevices, their fragility, the excessive data-sets generated and most significantly their scanningrange; typically less than 10 m. Assuming the speed of an emitted laser pulse to be constant,time-of-flight technology uses the delay in return signal to calculate the distance to the target.The laser emitter is manipulated using motorised mirrors, enabling it to scan back and forthover surfaces to form a detailed impression of elevation. The time-of-flight approach allows forthe increments between passes and within pulse emissions to determine the concentration ofdata collected. Designed to record surfaces under a wide range of conditions (Nagihara et al.,
Lim et al. Combined digital photogrammetry and time-of-flight laser scanning
112 � 2005 The Remote Sensing and Photogrammetry Society and Blackwell Publishing Ltd.
2004), time-of-flight devices are generally well suited to data collection in the naturalenvironment.
Terrestrial laser scanners involve certain limitations which must be considered (Kerstenet al., 2004). The absence of a calibrated target introduces numerous variables into the distancereading obtained. The characteristics of the reflecting surface, its roughness, wetness, distancefrom the scanner, material components and its incident angle all influence the strength of thereturn signal (Lichti and Harvey, 2002). Although beyond those of visible light, the bandwidthsused (750 to 1500 nm) function on the periphery of atmospheric wavelengths, allowing certainportions of the radiation to be absorbed into the atmosphere. This causes wet surfaces to have alower reflectance, degrading the signal strength of the reflected beam. The registration of thereturning laser pulse assumes the strongest part of the returning beam originates from the centreof the footprint on the target. This concentric weighting is distorted when the span of thefootprint overlaps areas of contrasting reflectance. When analysing the elevation data, the lackof RGB data also limits the qualitative assessment of data recorded, restricting interpretation ofdifference models. Despite these issues, the point cloud data produced over the rangesassociated with typical monitoring of cliff faces are capable of producing accuracies within±0Æ06 m. It is noted however that when recording complex features, point accuracies do notnecessarily equate to comparable surface accuracies. Meshed (triangulated) point clouds aredegraded by occlusions which cause holes in the data surface and errors associated with theprecise location and orientation of the scanning system. It is clear therefore that the techniquesfor terrestrial laser scanning can benefit substantially from the application of rigorousapproaches to data collection developed for example in photogrammetry.
Study Area
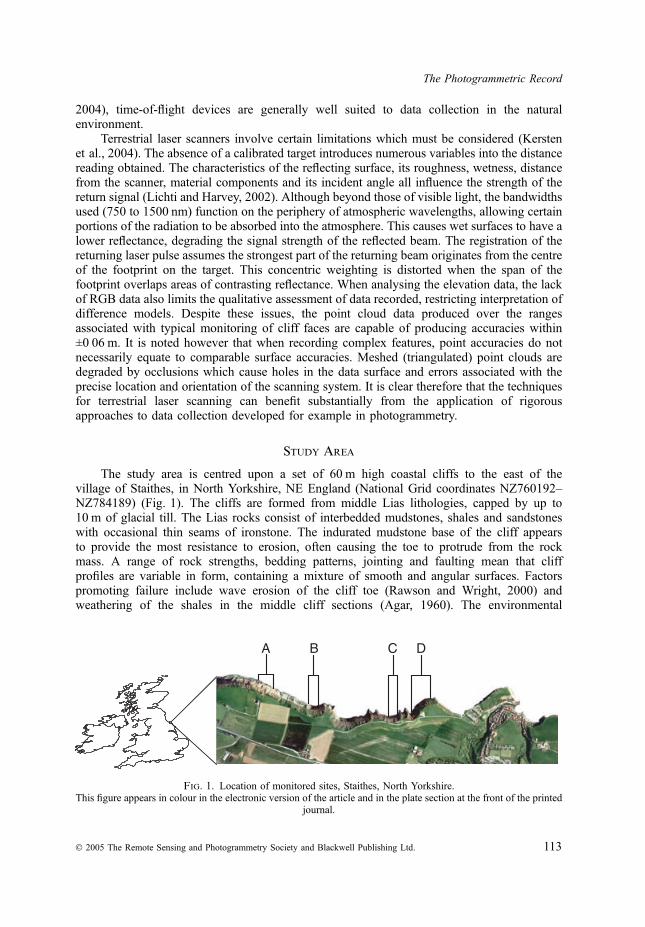
The study area is centred upon a set of 60 m high coastal cliffs to the east of thevillage of Staithes, in North Yorkshire, NE England (National Grid coordinates NZ760192–NZ784189) (Fig. 1). The cliffs are formed from middle Lias lithologies, capped by up to10 m of glacial till. The Lias rocks consist of interbedded mudstones, shales and sandstoneswith occasional thin seams of ironstone. The indurated mudstone base of the cliff appearsto provide the most resistance to erosion, often causing the toe to protrude from the rockmass. A range of rock strengths, bedding patterns, jointing and faulting mean that cliffprofiles are variable in form, containing a mixture of smooth and angular surfaces. Factorspromoting failure include wave erosion of the cliff toe (Rawson and Wright, 2000) andweathering of the shales in the middle cliff sections (Agar, 1960). The environmental
BA DC
Fig. 1. Location of monitored sites, Staithes, North Yorkshire.This figure appears in colour in the electronic version of the article and in the plate section at the front of the printed
journal.
The Photogrammetric Record
� 2005 The Remote Sensing and Photogrammetry Society and Blackwell Publishing Ltd. 113

processes that drive these two mechanisms lead to small-scale failures across the exposedface. Interestingly, although often considered insignificant in determining the overall cliffform, the cumulative effects of multiple small failures on steep rock cliffs remainunquantified (Lee et al., 2002).
Previously estimated rates of recession for this stretch of cliffs are 0Æ05 m per year at thetoe and 0Æ02 m per year at the top, based on differences between Ordnance Survey maps dated1892 and 1960 (Agar, 1960). The figures seem to suggest that the overall cliff morphology ischanging through time, tending towards a steepening cliff profile. There appears to be littlegeomorphological evidence to support this, suggesting that there are substantial errors in retreatdata. Despite its simplistic approach to cliff change, the retreat rates indicate sensitivity to thevariety of geological settings along the coastline (Table I). In addition, these data suggest thatthere is also a morphological control on coastal retreat (Table II), with erosion in baysoutstripping headland retreat. This would act to accentuate the large-scale coastal morphologyover time. It is clear that there is considerable complexity of processes governing the recessionof the cliffs at Staithes, raising further questions over the adequacy of aerial monitoringtechniques for such an application. Therefore, despite extensive and detailed studies on thecliffs of North Yorkshire, the specific mechanisms by which these coastal forms evolve remainpoorly understood.
Data Collection
Sites were surveyed at monthly intervals using a fully calibrated, tripod-mounted, KodakDCS Pro 14n fitted with an F mount Nikon Nikkor 28 mm 2Æ8d lens. The calibration procedure
Table I. Measured rates of cliff recession in North Yorkshire summarised by lithology (Agar, 1960).
Location Shoreline erosion rates (m per annum) Deltaic series Glacial drift
Lower Lias Middle Lias Upper Lias
Huntcliff Station 0Æ04Staithes, Cowbar Nab 0Æ05Staithes, Penny Nab 0Æ1Port Mulgrave, south pier 0Æ1Runswick Great Ship Rock 0Æ1Upgang, nr. Whitby 0Æ26Whitby West Cliff 0Æ03Whitby East Cliff 0Æ09Whitby East Cliff 0Æ19Saltwick Nab 0Æ04Near Black Nab 0Æ11Robin Hood’s Bay 0Æ07Robin Hood’s Bay 0Æ31Robin Hood’s Bay 0Æ16Low Peak 0Æ05AVERAGE 0Æ08 0Æ075 0Æ105 0Æ03 0Æ285
Table II. Measured rates of cliff recession in North Yorkshire summarised by morphology (Agar, 1960).
Morphological unit Cliff top erosion (m per annum) Cliff toe erosion (m per annum)
Headlands only 0Æ01 0Æ04Bays only 0Æ04 0Æ07Whole coast 0Æ02 0Æ05
Lim et al. Combined digital photogrammetry and time-of-flight laser scanning
114 � 2005 The Remote Sensing and Photogrammetry Society and Blackwell Publishing Ltd.

involved the collection of two sets of images of a testfield containing 111 targets fromconvergent stations. The image sets were converged at a range of angles from 0� to 60�,ensuring that a minimum of 66% of the control targets were covered by each image. Thecamera was rolled through 90� clockwise and anticlockwise and focused at infinity throughout.The targets were surveyed to millimetre accuracy in three dimensions and used to analyse theinterior orientation parameters of focal length, principal point offset, radial lens distortion (k1,k2, k3) and tangential distortion. The calibrated camera was locked at infinity and usedexclusively for monitoring purposes to maintain the geometric stability of the set-up. Studswere installed into the shore platform in order to allow the repeated capture of images from thesame location. The minimum required resolution was set to ±0Æ02 m and used as the maindeterminant in positioning the base stations. This pixel spacing produces a DEM of 0Æ1 mresolution in ERDAS OrthoBASE, given the 5 · 5 pixel search area required for eachelevation. Given the 28 mm focal length of the lens and the 4536 · 3024 size of the imagingarray, the maximum required distance between the cliff face and the camera is about 70 m. Thenumber of images captured at each site ranged from three (Site B) to six (Site D). The distancewas reduced when the cliff height permitted. Base to height ratios of 0Æ6 or lower were usedwherever possible. A pilot study indicated that a large overlap was necessary to reduceocclusion and maximise image correlation.
A Leica TPS1200 reflectorless total station was used to collect the precise coordinates ofdistinguishable natural features on the cliff, forming the basis of a control point network. Therestriction of control points to areas of difference such as recognisable joints or the corners ofoverhangs may reduce the overall accuracy of the photogrammetric models (Fox and Gooch,2001). Optimisation of ground control quality therefore required cliff features to be carefullyselected, where a precise point target could be identified and considered generallyrepresentative of the wider rock face in that area. A test study was conducted in order toassess the accuracy of the ground control under conditions experienced at the coast. A grid of25 control points was identified across Site A, the highest cliff section in the study area, andresurveyed 10 times. The grid consisted of five rows of five points dissecting the cliff facehorizontally at approximately 10 m height intervals forming five vertical columns. The totalstation was removed and reset in between each of the 10 collections of the grid, establishing ameasure of the repeatability and accuracy of the points. The standard deviation ofmeasurements across the network showed error ranges consistently within 0Æ03 m (Table III).No significant relationships were identified with radial distance from the survey station, nor byGCP row either with increasing height up the cliff or GCP position across the cliff face. Thereflectorless total station therefore provides highly accurate ground control relative to boththe precision of the laser scan survey and the magnitude of changes under examination on thecliff face. The terrestrially oriented control point coordinates were processed through
Table III. Accuracy of control points obtained with the reflectorless total station,expressed as the average standard deviation in x, y and z axes for each point
aggregated across the survey network.
GCP row Standard deviation (m) AverageGCP column
1 2 3 4 5
5 0Æ025 0Æ025 0Æ021 0Æ022 0Æ021 0Æ0234 0Æ023 0Æ021 0Æ019 0Æ023 0Æ021 0Æ0213 0Æ022 0Æ020 0Æ022 0Æ022 0Æ025 0Æ0222 0Æ021 0Æ022 0Æ021 0Æ022 0Æ022 0Æ0221 0Æ022 0Æ021 0Æ023 0Æ022 0Æ024 0Æ022
The Photogrammetric Record
� 2005 The Remote Sensing and Photogrammetry Society and Blackwell Publishing Ltd. 115

a transformation matrix to obtain Z as the photo direction. The block was then translated tocreate a zero base level behind the cliff face. The conversion is necessary because of the natureof the algorithms used for DEM extraction in most soft copy photogrammetric suites, whichhave been developed for aerial applications.
A LaserAce 600 terrestrial laser scanner from Measurement Devices Ltd, Aberdeen,Scotland, was used to record the detailed surface of the cliff sections at a rate of 250 points persecond. The resolution of each point is the size of the width of the laser lens, 0Æ046 m, plus the0Æ003 m m)1 divergence of the beam. Prior to collection the LaserAce was calibrated to a rangeprecision of 0Æ025 m at 200 m and the horizontal and vertical angles checked to within 0Æ01�.The scanner was positioned over the most central of the capture stations, levelled and orientedtowards a triangulation point previously located with a differential Leica GPS1200. Theazimuth orientation of the scanner was set to collect data in the same coordinate system as thephotogrammetry. A required resolution of 0Æ05 m was specified to generate comparable spatialdata coverage to the photogrammetric output. The LaserAce 600 instrument is designed to bewater and dust resistant to IP66 specifications, making it a robust answer to the challenges ofmonitoring in coastal environments.
Image Processing
The raw image data was processed in OrthoBASE Professional. The most importantaspect of the digital rectification process involves automatic aerial triangulation of the imageblock. The procedure links images through the exterior orientation and control pointparameters determined at the point of capture. A similarity transformation is then applied tothis information, connecting each image to all those around it. Once the images have beengeometrically related, feature extraction and image matching are undertaken in order to collectaround 500 distinct tie points within overlapping areas. OrthoBASE uses feature-basedmatching with additional area correlation and geometrical and topological constraints in orderto define point collection (Wang et al., 2002). A hierarchical system of searching is employedand least squares matching performed on the last iteration in order to calculate errors (Chandleret al., 2003). Tie point numbers, concentrations and matching strength can be user-defined tosuit the specific characteristics of the overlapped area (ERDAS, 2001). Increased numbers oftie points are thought to be important in ensuring block stability (Wang, 1996). When less than300 tie points were automatically detected during processing, the default correlation of 0Æ8 waslowered to 0Æ7, reducing the inclusion thresholds for accepted ties. Reducing the correlationbelow this to the minimum of 0Æ6 produced relatively small increases in the number ofdetections and higher tendencies for gross errors. The collection performed significantly betteron the red and blue portions of the images, which were more closely linked with changes incontrast. Bundle adjustment procedures were conducted and gross error detection applied toidentify correlations with an increased likelihood of error. Rmse was also available as a methodof assessing the overall triangulation performances. The triangulated blocks were edited to apredefined degree of accuracy, typically with ground control residuals restricted to within0Æ1 m, before being accepted. Once confirmed, the co-registration of images defines therelationship between the internal geometry, external positions and orientations of the sensor atthe point of capture (Schenk, 1997). The block adjustment converts image tie point coordinatesinto ground coordinates.
Scanned point clouds were oriented through the same transformation matrix used for theGCPs in order to enable comparability between models. The Archaeoptics Demon softwarepackage was used to converge each scan to the next in the monthly monitoring sequence toremove any errors associated with the external orientation of the scanner at the time of capture.
Lim et al. Combined digital photogrammetry and time-of-flight laser scanning
116 � 2005 The Remote Sensing and Photogrammetry Society and Blackwell Publishing Ltd.

The convergence operation processes the point clouds in two stages to find a least squares bestfit between the three-dimensional coordinate sets. Firstly every point in the first scan issearched for the point of closest Euclidean distance within the second scan. The best fitbetween the paired data-sets is then calculated using a three-dimensional transformationalgorithm to determine the vector translation and quaternion required for an optimaltransformation (Horn, 1987). The rms deviation between the two scans is then computed and ifit is greater than the desired deviation, the algorithm reiterates. The weighting in Horn’s (1987)solution also limits the contribution of poor quality points, containing weaker matches thansurrounding pairs, to the overall transformation. By specifying each mesh as non-deformable,the sequential epochs are drawn together based on the reduction of the distance separating themajority of points, ignoring the localised areas of genuine change. By monitoring a section ofcliff face of sufficient size to avoid the influences of actual change to the cliff face, the errorsassociated with the positional accuracy of the scanner can be significantly reduced.
In order to generate ortho-images, ASCII data files containing the X, Y and Z coordinatesof every point in the raster were interpolated into a surface DEM using the ERDAS 3Dsurfacing tool. Cell resolution was set to 0Æ05 m and a non-linear rubber-sheeting interpolationwas used to better reflect the actual contours of the cliff faces. The high-resolution DEM wasused to minimise the amount of information lost between the reconstructed surface, of finiteinterval, and the ground surface (Huang, 2000). The output .tiff file was then imported intoOrthoBASE in order to correct for the distortions within the imagery caused by variations interrain elevation. Orthorectification is the process of correcting raw images to form aplanimetrically true representation of the surface. Accurately orthorectified images have aconsistent photo scale, allowing real-world measurements to be taken of the subject matter(Schenk, 1997). The images were resampled with output cell sizes of 3 · 3 pixels andmosaicked to adjoining orthophotos.
In addition to producing orthophotos integrated with laser-scanned DEMs, photogram-metrically derived DEMs were generated to compare the efficacy of the two techniques in cliffface monitoring. ERDAS OrthoBASE has a number of default terrain settings which can beapplied to differing topographic situations within the same block (Table IV). The presets wereused to assess the effects on DEM production of the parameters of search area, correlation size,coefficient limit, topographic relief type and land cover object type. High levels of imagetexture over cliff surfaces and the availability of adequate control allowed more stringentacceptance levels to be applied (Zhang and Miller, 1997). The search area was lowered to theminimum allowable 5 · 5 pixels after the suggestion that template size should be minimisedover complex topography, despite the propensity for increased interpolation (Lane et al.,
Table IV. Terrain parameter settings used for OrthoBASE (ERDAS, 2001).
Parameterstrategy
Searchsize
Correlationsize
Coefficientlimit
Topographictype
Objecttype
DTMfiltering
X Y X Y
Custom 5 5 3 3 0Æ8 Rolling hills Low urban LowDefault 21 3 3 3 0Æ8 Rolling hills Open area LowHigh mountains 27 3 3 3 0Æ8 Mountainous Open area ModerateMiddle mountains 21 3 3 3 0Æ8 Mountainous Open area ModerateRolling hills 15 3 3 3 0Æ8 Rolling hills Open area ModerateFlat areas 7 3 3 3 0Æ8 Flat Open area HighHigh urban 19 3 3 3 0Æ8 Rolling hills High urban LowLow urban 11 3 3 3 0Æ8 Rolling hills Low urban ModerateForest 17 3 3 3 0Æ8 Mountainous Low urban High
The Photogrammetric Record
� 2005 The Remote Sensing and Photogrammetry Society and Blackwell Publishing Ltd. 117

2000). In order to directly compare the performance of the photogrammetric process, nomanual editing was performed on the DEMs. The derived elevations from both the laserscanning and the photogrammetry were finally resampled to the same spatial extent andresolution (0Æ05 m).
Results
The use of laser-scanned elevations removed many of the uncertainties of photogram-metric DEM generation, producing consistent and repeatable models. Employing the samecoordinate systems for both approaches meant the common control points could be matchedbetween data-sets, enabling the combination of the relative advantages from both techniques.The laser point clouds were collected in a variety of conditions and over a range of rock surfacetypes, but all scans were statistically related to within 0Æ04 m convergence of the previoussurvey. The result was a detailed three-dimensional impression of the cliff face in which thephysical characteristics can be clearly identified and quantified (Fig. 2). The ortho-image ofSite C demonstrates the ability to accurately locate and monitor the cliff top and toe positionswithin the scans (subsections A and B). Important information was also generated on theprocesses, such as seepage from the till above (subsection C) and on the mechanisms of failure,seen in the fresh rock face exposed following a recent fall (subsection D). By resampling therectified imagery with the laser-scanned point clouds, substantially larger portions of cliff facecan be accurately monitored without multiplying errors of contrast, shadowing, perspective andgeometry. The cliff section at Site D for example comprises a mosaic of six images and coversover 100 m of coastline (Fig. 3). The laser-scanned data performed well over gently curvedtopography such as the points of headlands or backwalls of embayments. The differencing ofsuccessive models reliably identified the loss of rock blocks as small as 0Æ1 m throughout themonitored period, verified with the use of the ortho-imagery and stereo viewing of triangulatedblocks.
The photogrammetrically produced DEMs were consistently sensitive to change, preciselyidentifying topographic variations across the cliff face. The accuracy of the photogrammetricmodels however varied considerably, depending on the specifics of the triangulation used.Comparisons between the photogrammetrically derived DEMs and the laser-scanned surfaceshighlight the advantages of the integrated approach used. A model of the difference betweenthe two techniques is illustrated for Site A (Fig. 4). The differences between the modelsincrease with height and surface complexity, which in this instance is reflected in the increasein topographic roughness from left to right. The differences are particularly noticeable in thesharp protrusion in subsection ‘‘a’’, in which weak control and radial distortion reducematching performance. Profiles taken through both the laser and photogrammetric DEMsurfaces demonstrate a broad agreement in the overall cliff geometry, with the photogrammetrymarginally more sensitive to the small-scale undulations across the face. The most noticeabledifference is the increasing disparities in depth above 10 m from the cliff toe. Editing theground control within the blocks to refine the triangulations consistently required the removalof points towards the upper sections of the cliff face. Attempts to maintain the full constraintsof the points in the extremities of the overlap led to poor DEM performance despite theconsistent accuracies of the control points with cliff height (Table III). Removing the uppercontrol allowed high-quality triangulations to be achieved but raised questions over theaccuracies of the DEMs they would generate. This suggests the photogrammetric performancewas limited not by the accuracies of the control, but by the reliance on natural features whichbecome increasingly harder to match towards the extremes of the images. The inability of thestereo configuration of the photography to gather sufficient image content for the bundle
Lim et al. Combined digital photogrammetry and time-of-flight laser scanning
118 � 2005 The Remote Sensing and Photogrammetry Society and Blackwell Publishing Ltd.

adjustment highlights a major limitation of the photogrammetric application to monitoringhigh-sided cliff faces. Software-based quality assessments identified suspicious pixel matchesas geometric irregularities but failed to detect any systematic errors in the triangulation. Thedirect effect of perspective errors on elevation has limited the use of photogrammetry in thestudy of rock slopes, which commonly recede from the base. Interestingly the subtle changes inthe cliff face are still detected in the upper portion of the photogrammetric DEMs. The
A
B
D
C
C
DB
A
Metres0 10 20 30 40 50 60
Fig. 2. An ortho-image of Site C, resampled on a laser-scanned DEM.This figure appears in colour in the electronic version of the article and in the plate section at the front of the printed
journal.
The Photogrammetric Record
� 2005 The Remote Sensing and Photogrammetry Society and Blackwell Publishing Ltd. 119
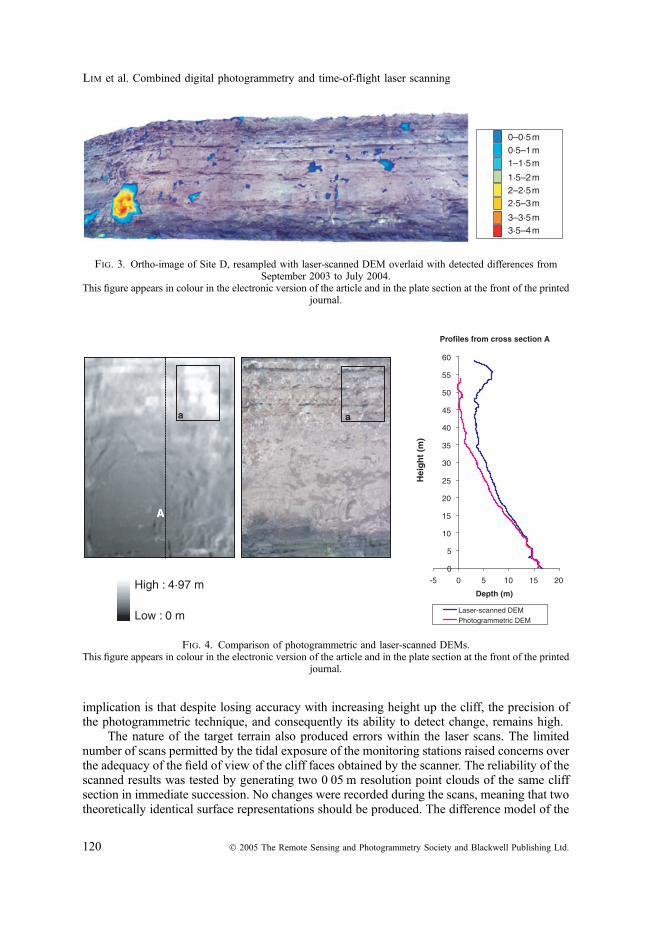
implication is that despite losing accuracy with increasing height up the cliff, the precision ofthe photogrammetric technique, and consequently its ability to detect change, remains high.
The nature of the target terrain also produced errors within the laser scans. The limitednumber of scans permitted by the tidal exposure of the monitoring stations raised concerns overthe adequacy of the field of view of the cliff faces obtained by the scanner. The reliability of thescanned results was tested by generating two 0Æ05 m resolution point clouds of the same cliffsection in immediate succession. No changes were recorded during the scans, meaning that twotheoretically identical surface representations should be produced. The difference model of the
0–0·5 m 0·5–1 m 1–1·5 m
1·5–2 m 2–2·5 m 2·5–3 m
3–3·5 m 3·5–4 m
Fig. 3. Ortho-image of Site D, resampled with laser-scanned DEM overlaid with detected differences fromSeptember 2003 to July 2004.
This figure appears in colour in the electronic version of the article and in the plate section at the front of the printedjournal.
a a
AA
Profiles from cross section A
0
5
10
15
20
25
30
35
40
45
50
55
60
-5 0 5 10 15 20
Depth (m)
Hei
gh
t (m
)
Laser-scanned DEMPhotogrammetric DEM
High : 4·97 m
Low : 0 m
Fig. 4. Comparison of photogrammetric and laser-scanned DEMs.This figure appears in colour in the electronic version of the article and in the plate section at the front of the printed
journal.
Lim et al. Combined digital photogrammetry and time-of-flight laser scanning
120 � 2005 The Remote Sensing and Photogrammetry Society and Blackwell Publishing Ltd.

scans revealed small errors between the meshed surfaces, which typically appear as triangularirregularities caused by subtle differences in mesh generation (Fig. 5). There are however moresubstantial geometric differences, highlighted in the subsection, that result from occlusion.Such line-of-sight errors are concentrated towards the edges of scans and on protruding ledges.Although the errors caused are comparatively small, within 0Æ03 m, the benefit of validatinggenuine change with the use of ortho-images is again realised. In this way sites can becharacterised and problem areas such as ledges and overhangs identified for targeted checkingof difference models.
In terms of monitoring the present rate of cliff retreat, the integration of the twoapproaches has enabled changes to be accurately detected and assessed well beyond theacceptable error margins for a purely photogrammetric approach. Ortho-images and differencemodels were generated for the total change monitored across two sites over a 9-month period(Fig. 6(a) and (b)). The resolution of the data revealed that despite being located adjacent to
0 10 20 30 40 50 60 70 80 90
a
a
0·027 m
0·000 m
MetresDifference
Fig. 5. Occlusion error in laser-scanned DEMs.This figure appears in colour in the electronic version of the article and in the plate section at the front of the printed
journal.
The Photogrammetric Record
� 2005 The Remote Sensing and Photogrammetry Society and Blackwell Publishing Ltd. 121

one another (Fig. 1), the mechanisms determining change were markedly different. Site Ashows a relatively even spatial distribution of change throughout the rock face, with smallconcentrations within certain lithological bands in the mudstone toe and the weaker shales inthe middle portion of the cliff. Site B reveals significantly more concentrated areas ofdifference with the majority of change occurring within arched failures propagating up fromthe cliff toe. A second band of change is detected at the junction between the harder sandstonestrata and the weaker shales below. Incremental weathering of the shales reduces support forthe sandstone ledge resulting in the occasional loss of large angular rocks.
The changes detected across the two sites can be represented graphically, calculating thearea affected by the detachment of material as a percentage of the total two-dimensional area ofthe monitored cliff sections (Fig. 7). This was done to enable comparisons of the rate of changebetween the two, despite the greater area monitored at Site A. The recorded changes displayconsiderably different temporal variations throughout the time series which spans from autumnthrough to the following spring. Site A lost low percentages of material at relatively consistentrates in terms of surface area affected from month to month. There appears to be a weakseasonality to the volume losses with the autumn and late spring months found to be morestable than those of winter. Site B shows a reversal of this temporal pattern, with changes notsynchronised with the seasonally expected variance. The spatial concentration of change at thecliff toe indicates that the cliff may be responding to localised controls such as wave impact.The influence that the different failure mechanisms exerted on the overall development of the
(a)
(b)
Fig. 6. Ortho-image and superimposed difference model (September 2003 to May 2004): (a) Site A; (b) Site B.This figure appears in colour in the electronic version of the article and in the plate section at the front of the printed
journal.
Lim et al. Combined digital photogrammetry and time-of-flight laser scanning
122 � 2005 The Remote Sensing and Photogrammetry Society and Blackwell Publishing Ltd.
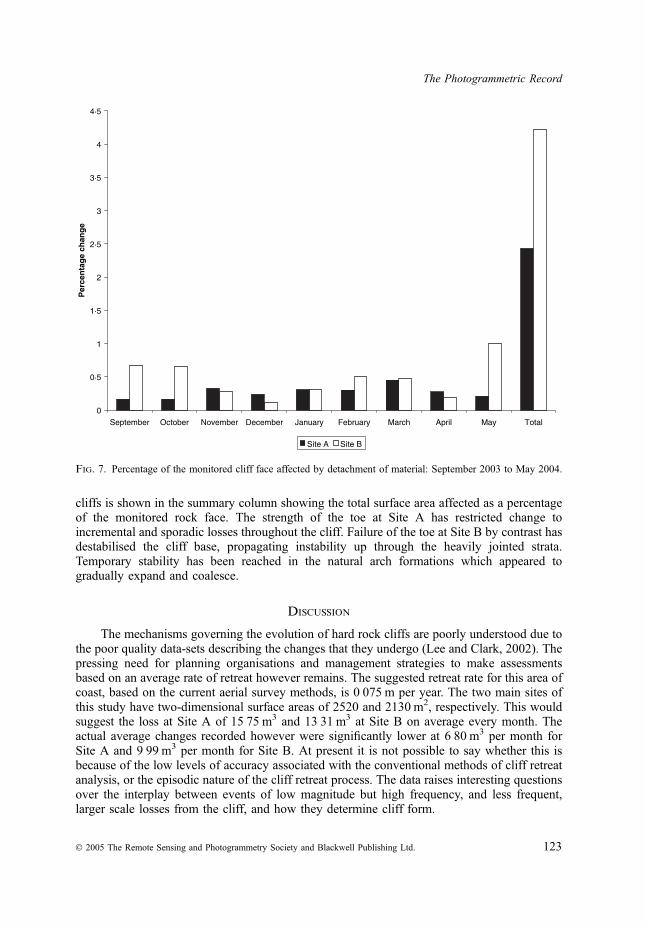
cliffs is shown in the summary column showing the total surface area affected as a percentageof the monitored rock face. The strength of the toe at Site A has restricted change toincremental and sporadic losses throughout the cliff. Failure of the toe at Site B by contrast hasdestabilised the cliff base, propagating instability up through the heavily jointed strata.Temporary stability has been reached in the natural arch formations which appeared togradually expand and coalesce.
Discussion
The mechanisms governing the evolution of hard rock cliffs are poorly understood due tothe poor quality data-sets describing the changes that they undergo (Lee and Clark, 2002). Thepressing need for planning organisations and management strategies to make assessmentsbased on an average rate of retreat however remains. The suggested retreat rate for this area ofcoast, based on the current aerial survey methods, is 0Æ075 m per year. The two main sites ofthis study have two-dimensional surface areas of 2520 and 2130 m2, respectively. This wouldsuggest the loss at Site A of 15Æ75 m3 and 13Æ31 m3 at Site B on average every month. Theactual average changes recorded however were significantly lower at 6Æ80 m3 per month forSite A and 9Æ99 m3 per month for Site B. At present it is not possible to say whether this isbecause of the low levels of accuracy associated with the conventional methods of cliff retreatanalysis, or the episodic nature of the cliff retreat process. The data raises interesting questionsover the interplay between events of low magnitude but high frequency, and less frequent,larger scale losses from the cliff, and how they determine cliff form.
0
0·5
1
1·5
2
2·5
3
3·5
4
4·5
September October November December January February March April May Total
Per
cen
tag
e ch
ang
e
Site A Site B
Fig. 7. Percentage of the monitored cliff face affected by detachment of material: September 2003 to May 2004.
The Photogrammetric Record
� 2005 The Remote Sensing and Photogrammetry Society and Blackwell Publishing Ltd. 123

The disparities between the general level for change set by aerial approaches and thereality of a more stable rock face are demonstrated in Fig. 8. The over-estimation demonstratedby the comparison with actually monitored rates highlights the limitations of averaging two-dimensional records of retreat for extensive sections of coastline. Even across the two sitesillustrated, just 350 m apart, clear differences have been detected in the pattern and nature offailure events. These differences demonstrate that cliff retreat is a spatially and temporallyspecific process. The generation of high-resolution data-sets offers significant potential tosubdivide existing classifications of cliffs and rock slopes in general to account for the localmechanisms of failure.
The integration of high-resolution photographic monitoring resampled with the fixedaccuracies of terrestrial laser surveys enables rock faces to be reliably monitored andqualitatively assessed in a variety of conditions (Fig. 9). Successful integration requires thecareful consideration of the format, orientation and resolution of the outputs from bothtechniques. Recent technological developments are generating greater opportunities for the useof combinations of techniques in order to overcome the challenges of monitoringgeomorphological change. The Leica High-Definition Survey series and Riegl LMS rangeof time-of-flight laser scanners, for example, have the capability to capture colourised pointclouds. Although such instruments are currently beyond the financial constraints of manyprojects, particularly small-scale repeated monitoring surveys, in the foreseeable future thedevelopment of complete integrated capture systems will hold enormous potential forgeomorphological applications.
In this study it has been possible to consider in detail the spatial pattern of change in threedimensions and to assess differences throughout the cliff face in addition to the landward retreatrates at the cliff top. The ability to view volumetric change across rock faces has enabled theinvestigation of the factors that determine the contemporary evolution of the coastline at Staithes.
September October November December January February March April May
Site A Current estimation of monthly volume loss
0
2
4
6
8
10
12
14
16
18
Vo
lum
e lo
ss (
m³)
Fig. 8. Volumetric losses predicted for Site A by aerial survey models and the actual volumetric loss monitoredwith the high-resolution approach.
Lim et al. Combined digital photogrammetry and time-of-flight laser scanning
124 � 2005 The Remote Sensing and Photogrammetry Society and Blackwell Publishing Ltd.
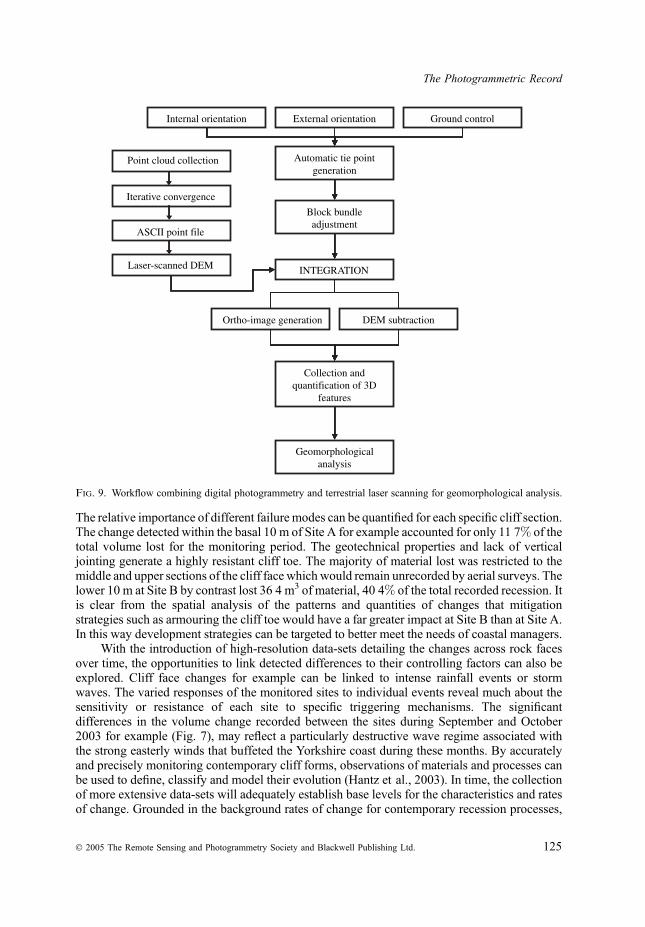
The relative importance of different failure modes can be quantified for each specific cliff section.The change detected within the basal 10 m of Site A for example accounted for only 11Æ7% of thetotal volume lost for the monitoring period. The geotechnical properties and lack of verticaljointing generate a highly resistant cliff toe. The majority of material lost was restricted to themiddle and upper sections of the cliff face which would remain unrecorded by aerial surveys. Thelower 10 m at Site B by contrast lost 36Æ4 m3 of material, 40Æ4% of the total recorded recession. Itis clear from the spatial analysis of the patterns and quantities of changes that mitigationstrategies such as armouring the cliff toe would have a far greater impact at Site B than at Site A.In this way development strategies can be targeted to better meet the needs of coastal managers.
With the introduction of high-resolution data-sets detailing the changes across rock facesover time, the opportunities to link detected differences to their controlling factors can also beexplored. Cliff face changes for example can be linked to intense rainfall events or stormwaves. The varied responses of the monitored sites to individual events reveal much about thesensitivity or resistance of each site to specific triggering mechanisms. The significantdifferences in the volume change recorded between the sites during September and October2003 for example (Fig. 7), may reflect a particularly destructive wave regime associated withthe strong easterly winds that buffeted the Yorkshire coast during these months. By accuratelyand precisely monitoring contemporary cliff forms, observations of materials and processes canbe used to define, classify and model their evolution (Hantz et al., 2003). In time, the collectionof more extensive data-sets will adequately establish base levels for the characteristics and ratesof change. Grounded in the background rates of change for contemporary recession processes,
Internal orientation External orientation Ground control
Automatic tie point generation
Ortho-image generation
Block bundle adjustment
DEM subtraction
Collection and quantification of 3D
features
Geomorphologicalanalysis
INTEGRATION
Point cloud collection
Iterative convergence
ASCII point file
Laser-scanned DEM
Fig. 9. Workflow combining digital photogrammetry and terrestrial laser scanning for geomorphological analysis.
The Photogrammetric Record
� 2005 The Remote Sensing and Photogrammetry Society and Blackwell Publishing Ltd. 125

predictions of cliff responses to future impacts such as sea-level rise or coastal defences couldbe made. It is therefore important that the potential of new techniques such as those examinedhere are adequately explored with respect to improving the understanding of complexlandforms such as hard rock cliffs. Ultimately, advances in understanding will only be achievedby increasing the number of accurately constrained monitoring data-sets of high spatial andtemporal resolution and then using them to establish new deterministic and probabilisticmodels of cliff evolution.
Conclusions
This study has used rectified images resampled with consistent, accurate laser-scanneddata to monitor the monthly changes occurring over sections of the hard rock cliffs at Staithes,North Yorkshire. Photogrammetric techniques proved sensitive to changes in cliff facetopography despite the challenges posed by scale and nature of the environment. This suggeststhat significant potential exists for the application of digital photogrammetry to less extremecliff heights. The combination of the precise and qualitative information generated by digitalphotogrammetry and the extensive coverage and consistently high accuracies of time-of-flightlaser scanning provides an answer to the challenges of recording change from large-scalelandforms in dynamic coastal environments.
The changes detected here reveal the inadequacies of widely used aerial surveyapproaches in quantifying retreat in near-vertical coastal cliffs. The apparent stability of hardrock cliffs masks significant variability both between and within monitored sections,confirming the importance of a site-specific approach to forming an understanding of cliffchange. Distinct mechanisms of failure have been identified and related to the volumes ofmaterial lost to determine their relative contribution to cliff form. The data holds importantimplications for the formulation of adequate coastal development strategies, which should seekto combine the high-resolution terrestrial techniques presented here with established aerial andobliquely captured information. The solution to the challenges of recording, quantifying andexplaining cliff change therefore lies in the continued development, integration and qualityassessment of available techniques.
Acknowledgements
The authors would like to thank and acknowledge Cleveland Potash Limited for fundingthis project. A further note of thanks goes to Alistair Carty, Alexander Koh and the referees fortheir insightful comments and suggestions.
references
Agar, R., 1960. Post-glacial erosion of the North Yorkshire coast from the Tees estuary to Ravenscar. Proceedingsof the Yorkshire Geological Society, 32: 409–428.
Bailey, B., Collier, P., Farres, P., Inkpen, R. and Pearson, A., 2003. Comparative assessment of analyticaland digital photogrammetric methods in the construction of DEMs of geomorphological forms. Earth SurfaceProcesses and Landforms, 28(3): 307–320.
Baltsavias, E. P., Favey, E., Bauder, A., Bosch, H. and Pateraki, M., 2001. Digital surface modelling byairborne laser scanning and digital photogrammetry for glacier monitoring. Photogrammetric Record, 17(98):243–273.
Bird, E. C. F., 2000. Coastal Geomorphology: An Introduction. John Wiley, Chichester. 322 pages.Boggett, A. D., Mapplebeck, N. J. and Cullen, R. J., 2000. South Shore Cliffs, Whitehaven—geomorpho-
logical survey and emergency cliff stabilization works. Quarterly Journal of Engineering Geology andHydrogeology, 33(3): 213–226.
Lim et al. Combined digital photogrammetry and time-of-flight laser scanning
126 � 2005 The Remote Sensing and Photogrammetry Society and Blackwell Publishing Ltd.

Brasington, J., Langham, J. and Rumsby, B., 2003. Methodological sensitivity of morphometric estimates ofcoarse fluvial sediment transport. Geomorphology, 53(3/4): 299–316.
Butler, J. B., Lane, S. N. and Chandler, J. H., 1998. Assessment of DEM quality for characterizing surfaceroughness using close range digital photogrammetry. Photogrammetric Record, 16(92): 271–291.
Chandler, J. H., 1999. Effective application of automated digital photogrammetry for geomorphological research.Earth Surface Processes and Landforms, 24(1): 51–63.
Chandler, J. H., Buffin-Belanger, T., Rice, S., Reid, I. and Graham, D. J., 2003. The accuracy of a riverbed moulding/casting system and the effectiveness of a low-cost digital camera for recording river bed fabric.Photogrammetric Record, 18(103): 209–223.
Chandler, J. H. and Moore, R., 1989. Analytical photogrammetry: a method for monitoring slope instability.Quarterly Journal of Engineering Geology, 22(2): 97–110.
Crowell, M., Leatherman, S. P. and Buckley, M. K., 1991. Historical shoreline change: error analysis andmapping accuracy. Journal of Coastal Research, 7(3): 839–852.
DEFRA (Department for Environment, Food and Rural Affairs), 2001. National Appraisal of Assets at Risk fromFlooding and Coastal Erosion, including the potential impact of climate change. Final report, July 2001.Flood Management Division, London. 64 pages.
ERDAS, 2001. Imagine OrthoBASE User’s Guide. ERDAS Inc. 524 pages.Fox, A. J. and Gooch, M. J., 2001. Automatic DEM generation for Antarctic terrain. Photogrammetric Record,
17(98): 275–290.Genovois, R., Galgaro, A. and Tecca, P. R., 2001. Image analysis for debris flow properties estimation.
Physics and Chemistry of the Earth Part C, 26(9): 623–631.Gooch, M. J. and Chandler, J. H., 2001. Failure prediction in automatically generated digital elevation models.
Computers and Geosciences, 27(8): 913–920.Hall, J. W., Meadowcroft, I. C., Lee, E. M. and Gelder, P. H. A. J. M. van, 2002. Stochastic simulation of
episodic soft coastal cliff recession. Coastal Engineering, 46(3): 159–174.Hantz, D., Vengeon, J. M. and Dussauge-Peisser, C., 2003. An historical, geomechanical and probabilistic
approach to rock-fall hazard assessment. Natural Hazards and Earth System Sciences, 3(6): 693–701.Haslett, S. K., 2000. Coastal Systems. Routledge, London. 218 pages.Horn, B. K. P., 1987. Closed-form solution of absolute orientation using unit quaternions. Journal of the Optical
Society of America A, Optics and Image Science, 4(4): 629–642.Houghton, J. T., Ding, Y., Griggs, D. J., Noguer, M., Linden, P. J. van der and Xiaosu, D. (Eds.), 2001.
Climate Change: The Scientific Basis: Contribution of Working Group 1 to the Third Assessment Report of theInternational Panel on Climate Change. Cambridge University Press, Cambridge. 881 pages.
Hua, T. C. and Fairbairn, D., 2000. Change detection in aerial imagery assisted by GIS for topographic datasetrevision. The Malaysian Surveyor, 35(2): 14–26.
Huang, Y. D., 2000. Evaluation of information loss in digital elevation models with digital photogrammetricsystems. Photogrammetric Record, 16(95): 781–791.
Jones, D. K. C. and Lee, E. M., 1994. Landsliding in Great Britain. HMSO, London. 361 pages.Kersten, T., Sternberg, H., Mechelke, K. and Acevedo Pardo, C., 2004. Terrestrial laser scanning system
Mensi GS100/GS200—accuracy tests, experiences and projects at the Hamburg University of AppliedSciences. International Archives of the Photogrammetry, Remote Sensing and Spatial Information Sciences,34(5W16). 8 pages on CD-ROM.
Krupnik, A., 2003. Accuracy prediction for ortho-image generation. Photogrammetric Record, 18(101): 41–58.Lane, S. N., James, T. D. and Crowell, M. D., 2000. Application of digital photogrammetry to complex
topography for geomorphological research. Photogrammetric Record, 16(95): 793–821.Lane, S. N., James, T. D., Pritchard, H. and Saunders, M., 2003. Photogrammetric and laser altimetric
reconstruction of water levels for extreme flood event analysis. Photogrammetric Record, 18(104): 293–307.
Latulippe, C., Lapointe, M. F. and Talbot, T., 2001. Visual characterization technique for gravel–cobble riverbed surface sediments; validation and environmental applications Contribution to the programme of CIRSA(Centre Interuniversitaire de Recherche sur le Saumon Atlantique). Earth Surface Processes and Landforms,26(3): 307–318.
Lee, E. M., 2001. Living with natural hazards: the costs and management framework. Chapter 9 in Geo-morphological Processes and Landscape Change: Britain in the Last 1000 Years (Eds. D. L. Higgett andE. M. Lee). Blackwell, Oxford. 297 pages: 237–268.
Lee, E. M., Meadowcroft, I. C., Hall, J. W. and Walkden, M., 2002. Coastal landslide activity: aprobabilistic simulation model. Bulletin of Engineering Geology and the Environment, 61(4): 347–355.
Lee, L., Pinckney, C. and Bemis, C., 1976. Sea cliff base erosion. Proceedings of the ASCE National WaterResources and Ocean Engineering, San Diego, California, 1976. 1–14.
The Photogrammetric Record
� 2005 The Remote Sensing and Photogrammetry Society and Blackwell Publishing Ltd. 127

Lee, M. and Clark, A., 2002. Investigation and Management of Soft Rock Cliffs. Thomas Telford Publishing,London. 382 pages.
Lichti, D. D. andHarvey, B. R., 2002. The effects of reflecting surface material properties on time-of-flight laserscanner measurements. Symposium on Geospatial Theory, Processing and Applications, Ottawa. 9 pages (onCD-ROM).
Moore, L. J., 2000. Shoreline mapping techniques. Journal of Coastal Research, 16(1): 111–124.Nagihara, S., Mulligan, K. R. and Xiong, W., 2004. Use of a three-dimensional laser scanner to digitally
capture the topography of sand dunes in high spatial resolution. Earth Surface Processes and Landforms,29(3): 391–398.
Rawson, P. F. and Wright, J. K., 2000. The Yorkshire Coast. The Geologists’ Association Guide No. 34. Thirdedition. Geologists’ Association, London. 117 pages.
Robinson, L. A., 1974. Towards a process response model of cliff retreat—the case of North East Yorkshire. Ph.D.Thesis, University of Leeds. 535 pages.
Schenk, T., 1997. Towards automatic aerial triangulation. ISPRS Journal of Photogrammetry and Remote Sensing,52(3): 110–121.
Snyder, J. P., 1987. Map projections—a working manual. US Geological Survey Professional Paper 1395,Washington, DC. 383 pages.
Wang, Y., 1996. Structural matching and its applications for photogrammetric automation. International Archivesof Photogrammetry and Remote Sensing, 31(B3): 918–923.
Wang, Y., Yang, X., Stojic, M. and Skelton, B., 2002. A new digital photogrammetric system for GISprofessionals. International Archives of the Photogrammetry, Remote Sensing and Spatial InformationSciences, 34(2): 517–523.
Wickens, E. H. and Barton, N. R., 1971. The application of photogrammetry to the stability of excavated rockslopes. Photogrammetric Record, 7(37): 46–54.
Zhang, B. and Miller, S., 1997. Adaptive automatic terrain extraction. Integrating photogrammetric techniqueswith scene analysis and machine vision III. SPIE 3072: 27–36.
Resume
Bien que les falaises forment environ 75% du littoral mondial, notrecomprehension des processus qui marquent leur evolution reste limitee par suitedu manque de donnees quantitatives sur les modifications morphologiques qu’ellessubissent. On etudie dans cet article une combinaison de leves comprenant unbalayage terrestre au laser (base sur les temps de propagation) et une saisie parphotogrammetrie numerique a haute resolution permettant de generer des jeux dedonnees de grande qualite se rapportant aux processus geographiques qui regissentle developpement des falaises. On a mene cette etude sur une partie des falaises deroche dure du Yorkshire du Nord (Royaume Uni) en s’assurant d’un suivi sur uneperiode de 12 mois. A partir des nuages de points, a haute densite, issus du balayagelaser, on a realise une representation precise de ces surfaces complexes, exempte desvariations optiques qui perturbent les donnees photographiques. En combinant lesuivi photographique a haute resolution avec le releve terrestre au laser qui enassoyait le re-echantillonnage precis, on a obtenu une nouvelle facon de traiter lesenregistrements des changements volumetriques des falaises littorales complexes.Cela a amene a des ameliorations significatives dans notre comprehension desschemas de la dynamique des falaises littorales.
Zusammenfassung
Obwohl ungefahr 75% der Kustenlinien in der Welt durch Klippen geformt sind,ist unser Verstandnis ihres Entwicklungsprozesses begrenzt, da quantitative Daten zuden ablaufenden morphologischen Veranderungen fehlen. In diesem Beitrag wird dieKombination von terrestrischem Laserscanning mit hochauflosender Digitaler
Lim et al. Combined digital photogrammetry and time-of-flight laser scanning
128 � 2005 The Remote Sensing and Photogrammetry Society and Blackwell Publishing Ltd.

Photogrammetrie beschrieben, um qualitativ hochwertige Datensatze zu dengeomorphologischen Prozessen zu erfassen, die die Entwicklung der Kustenklippenbestimmen. Ein Abschnitt der Steilkuste in North Yorkshire in UK wurde uber einenZeitraum von 12 Monaten intensiv uberwacht. Die Geometrie der komplexenOberflachen wird dabei durch dichte Punktwolken aus dem terrestrischen Laser-scanning reprasentiert. Hochauflosende photographische Aufnahmen werden auf dieGeometrie der Laserdaten umgebildet und mit diesen kombiniert. Mit diesemkombinierten Datenmodell lassen sich volumetrische Anderungen von komplexenKustenklippen aufnehmen und analysieren. Dies trug wesentlich dazu bei, diekomplexen geomorphologischen Bewegungsmuster von Kustenklippen besser zuverstehen.
Resumen
Aunque los acantilados estan presentes en el 75% de las costas continentales delmundo, nuestro conocimiento de los procesos evolutivos continua siendo limitado porla falta de datos cuantitativos sobre los cambios morfologicos que sufren. En esteartıculo examinamos la combinacion del escaneado laser terrestre y la fotogrametrıadigital de alta resolucion para obtener datos de alta calidad sobre los procesosgeomorfologicos implicados en el desarrollo de los acantilados. El estudio se hallevado a cabo en una seccion de acantilados de roca dura en North Yorkshire, ReinoUnido, que ha sido monitorizado durante 12 meses. Las nubes de puntos de altadensidad obtenidas por escaneado laser han sido utilizadas para obtener unarepresentacion exacta de esas complejas estructuras libre de las variaciones opticasque degradan las fotografıas. Esta informacion se combino con una secuenciafotografica de alta resolucion, remuestreada con los datos exactos del levantamientolaser terrestre, lo que constituye una nueva forma de registrar los cambiosvolumetricos en acantilados costeros complejos. Ello ha permitido mejorarsignificativamente nuestro conocimiento de los patrones de actividad de los mismos.
The Photogrammetric Record
� 2005 The Remote Sensing and Photogrammetry Society and Blackwell Publishing Ltd. 129