colour
DESCRIPTION
dyes and colourTRANSCRIPT

COLOUR SCIENCE

Colour It is something which makes the object for
- Better appealing- More attractive - Give pleasure to observation
Color is an illusionColour as visual sensation arising from the stimulation of retina of the eye
It is a perceptual response to light that enters the eye either directly from self-luminous light sources or, indirectly, from light reflected by illuminated objects.
In chemist - It may be a chemical compound (dyes or pigment)

In physicist- It is a scattering or absorbtion of light or reflectance
spectra of the object.In physiologist - It is a measurable electrical activity of the nervesIn psychologistIt is a complex process in brain of interpreting the
nerve signalIn artist - Create the sensation in the mind of the observerColorimetry:
The art to predict an illusion from a physical measurement

CIE definition 845-02-18: (perceived) color
• Attribute of a visual perception consisting of any combination of chromatic and achromatic content.
This attribute can be described – By chromatic color names such as yellow, orange,
brown, red, pink, green, blue, purple, etc., or
– By achromatic color names such as white, gray, black, etc., and
– Qualified by bright, dim, light, dark etc.,or
– By combinations of such names
Colour stimulus
The light reaching the eye is called the colour stimulus

Color term categoriesSubjective color term:
A word used to describe a color attribute perceived by a human.
Example: the colorfulness of a flower
Objective color term:
A word used to describe a physical quantity related to color that can be measured.
Example: the energy radiated by a source
Subjective color terms Hue, value and chroma

Hue:• The attribute of a color perception denoted by
blue, green, yellow, red, purple, and so on• Denoted the name of the colour
Unique hue: A hue that cannot be further described by use of
the hue names other than its own. There are four unique hues, each of which shows no perceptual similarity to any of the others:
• Red, Green, Yellow, and blue

Brightness
• The attribute of a visual sensation according to which a given visual stimulus appears to be more or less intense, or according to which the visual stimulus appears to emit more or less light

Lightness:• The attribute of a visual sensation according to which
the area in which the visual stimulus is presented appears to emit more or less light in proportion to that emitted by a similarly illuminated area perceived as a “white” stimulus
• Brightness is absolute, lightness is relative to an area perceived as white
Chromaticness or Colorfulness:• The attribute of a visual sensation according to which an
area appears to exhibit more or less of its hue.

Chroma:– It nothing but depth of colour
– Purity of color
– Intensity of color
• The attribute of a visual sensation which permits a judgment to be made of the degree to which a chromatic stimulus differs from an achromatic stimulus of the same brightness

Three fundamental components of measuring color:
• Light sources
• Samples illuminated by them (Object)
• Observers

The nature of colourSource of light• Light is a form of energy. It propogates in the form
of electromagnetic wave.• Wave length is important characteristics of
electromagnetic wave.• It varies from fraction of nano meter to kilometer• characteristics of electromagnetic wave change with
wave length.• Gamma rays, X-rays, UV rays, Visible rays, infrared
rays microwaves and radio waves are all part of the spectrum of electromagnetic radiation.

• But the human visual system is only capable of sensing a very narrow band of wavelengths in the approximate range 360 –780 nm (a nanometer is 10-9 metres).
• The light from any source can be usefully described in terms of the relative power emitted at each wavelength in the visible spectrum.
• A source of light is characterized by the relative power distribution at different wavelengths.
• Light source – candle light, sunlight and incandescent lamp.


Line spectrumThe energy radiated by mercury arc lamb is concentrated in a narrow band of wave length
The perceptual description of colour depends on 1. Spectral power distribution of source2. Energy reflected by the object at different wavelengths3. Spectral sensitivity of the eye.
The colour rendition The object which may be bright orange under tungsten lamp may become dirty brown in mercury lamp. This property of light source to influence the colour of the object is called as colour rendition
The physical basis of colourElectromagnetic radiation is characterized by its wavelength (or frequency) and its intensity. When the wavelength is within the visible spectrum (the range of wavelengths humans can perceive, approximately from 390 nm to 700 nm), it is known as "visible light".
Object The illuminating radiations are modified by the object by physical processes such as transmission, reflection, absorption and scatteringWhen emerging light is in the same directions as incident light, it is said to be transmission.

• A transparent gelatine paper transits and absorbs light
• Paper appears blue or red means its absorbs all spectral components of radiations expect blue or red
• The absorption of light by transparent objects governed by Lambert – beer’s law.
• Lambert law states that equal amount of absorption occurs when light passes through equal thickness of material.
• Beers law states that equal amount of absorption occurs when light passes through equal amount of material ( concentration)

Diffuse reflection or transmissions • The light may be scattered. In scattering process light
travels in many directions other than incident direction.
• When sufficient scattering occurs, it is said to be Diffuse reflection or transmissions.
• The amount of light scattered depends on relative refractive index and particle size– Particle size is small – Less scatter
– Particle size is high – More scatter.
The appearance of the object is characterized by its spectral reflectance curve.

Color of objects
• The color of an object depends on both the physics of the object in its environment and the characteristics of the perceiving eye and brain.
• Physically, objects can be said to have the color of the light leaving their surfaces, which normally depends on the spectrum of the incident illumination and the reflectance properties of the surface, as well as potentially on the angles of illumination and viewing.

Some objects not only reflect light, but also transmit light or emit light themselves, which also contribute to the color.
A viewer's perception of the object's color depends not only on the spectrum of the light leaving its surface, but also on a host of contextual cues.
so that color differences between objects can be discerned mostly independent of the lighting spectrum, viewing angle, etc.
This effect is known as color constancy.

Some generalizations of the physics can be drawn
• Light arriving at an opaque surface is either – Reflected "specularly" (that is, in the manner of a mirror),
– Scattered (that is, reflected with diffuse scattering), or
– Absorbed or
– some combination of these.
• Opaque objects that do not reflect specularly have their color determined by which wavelengths of light they scatter strongly (with the light that is not scattered being absorbed).
• If objects scatter all wavelengths with roughly equal strength, they appear white. If they absorb all wavelengths, they appear black.

• Opaque objects that specularly reflect light of different wavelengths with different efficiencies look like mirrors tinted with colors determined by those differences.
• An object that reflects some fraction of impinging light and absorbs the rest may look black but also be faintly reflective; examples are black objects coated with layers of enamel or lacquer.
• Objects that transmit light are either translucent (scattering the transmitted light) or transparent (not scattering the transmitted light).
• If they also absorb (or reflect) light of various wavelengths differentially, they appear tinted with a color determined by the nature of that absorption (or that reflectance).

Objects may emit light that they generate from having excited electrons, rather than merely reflecting or transmitting light.
The electrons may be excited due to elevated temperature (incandescence), as a result of chemical reactions (chemoluminescence), after absorbing light of other frequencies ("fluorescence" or "phosphorescence") or from electrical contacts as in light emitting diodes, or other light sources.

Observer • The common detector of light and colour is eye, nerve
system and brain
• The light that is reflected by objects or emitted by light sources enters the eye, where it may be absorbed by visual pigments in the photoreceptors, or cones, contained within the retina.
• The eye focuses the image of the object on retina.
• The photosensitive detectors on retina are called as rod and cone from their shape.
• The rod only detect the light - no ability to specify the colour
• The colour is detected by cone.

Cone :Three type of cone receptors in retina1. Blue sensitive cones2. Green sensitive cones3. Red sensitive cones
The ultimate sensation of colour depends on degree of stimulation of these three colour receptors.
- All three equally stimulated – gives the sensation of grey to white depending on degree of stimulation
- if blue and red receptors are simultaneously excited, the sensation of purple is created.
- if green and red receptors are stimulated at the same time, the sensation of yellow is created


Human Vision and Color Perception
The steps in this sensory process are
1. The stimulation of light receptors in the eyes,
2. Conversion of the light stimuli or images into signals
3. Transmission of electrical signals containing the vision information from each eye to the brain through the optic nerves.
4. This information is processed in several stages, ultimately reaching the visual cortices of the cerebrum.

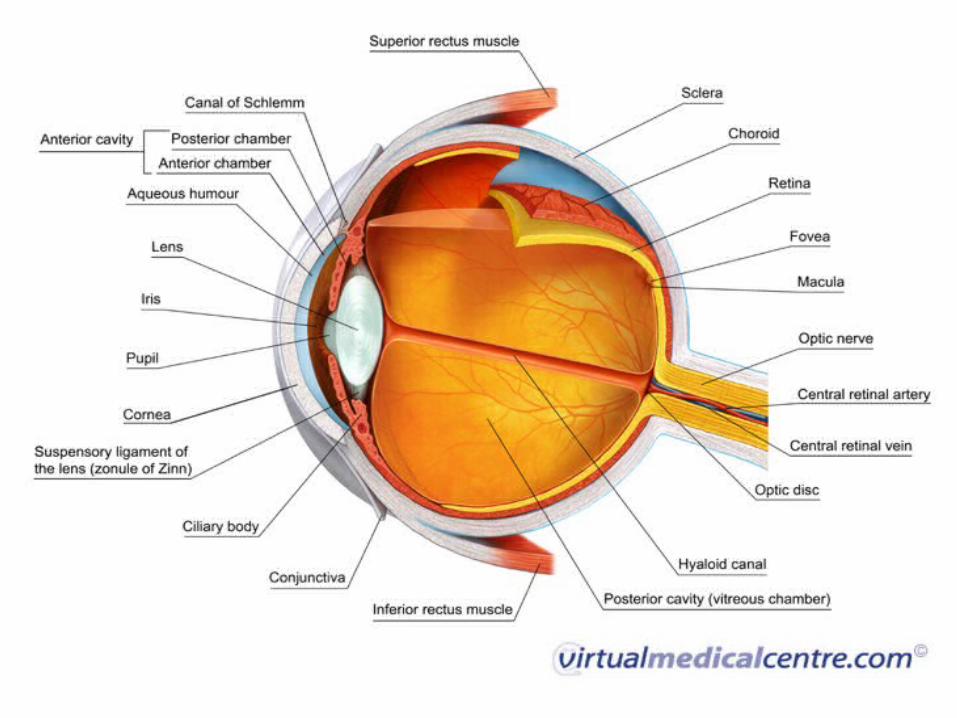

The human eye is equipped with a variety of optical components including
1. The Cornea,
2. Iris,
3. Pupil,
4. Aqueous and Vitreous Humors,
5. A Variable-focus Lens, and
6. The Retina.

• Together, these elements work to form images of the
objects that fall into the field of view for each eye.
• When an object is observed, it is first focused through
the convex cornea and lens elements, forming an
inverted image on the surface of the retina.
• A multi-layered membrane that contains millions of
light-sensitive cells.

In order to reach the retina, light rays focused by the cornea
must successively traverse the aqueous humor (in the anterior
chamber), the crystalline lens, the gelatinous vitreous body, and
the vascular and neuronal layers of the retina before they reach
the photosensitive outer segments of the cone and rod cells.
These photosensory cells detect the image and translate it into a
series of electrical signals for transmission to the brain.


Despite some misconceptions due to the wide spectrum of
terminology employed for describing eye anatomy, it is the
cornea, not the lens, which is responsible for the major part of the
total refractive power of the eye.
The Cornea also protects the eye by providing a physical barrier
that shields the inside of the eye from microorganisms, dust,
fibers, chemical, and other harmful materials.
Although much thinner in width than the crystalline lens, the
cornea provides about 65 percent of the eye's refractive power.

As the window that controls the entry of light into the eye, the cornea (Figure ) is essential to good vision and also acts as an ultraviolet light filter.

The cornea removes some of the most damaging ultraviolet
wavelengths present in sunlight, thereby further protecting the
highly susceptible retina and crystalline lens from damage.
If the cornea is curved too much, as in the case of
nearsightedness, distant objects will appear as blurry images,
because of imperfect light refraction to the retina.
In a condition known as astigmatism, imperfections or
irregularities in the cornea result in unequal refraction, which
creates distortion of images projected onto the retina.

The outer epithelial layer of the cornea is packed with
thousands of small nerve endings, making the cornea
extremely sensitive to pain when rubbed or scratched.
The partial or complete loss of transparency by the crystalline
lens, or its capsule, results in a common condition known as
cataracts. Cataracts are the leading cause of blindness
worldwide

Clear vision is prevented by a reduction in the amount of light that reaches the retina and by clouding of the image as though the individual were observing the environment through a fog or haze.

The function of the retina is similar to the combination of a digital
image sensor (such as a charge-coupled device (CCD)) with an
analog-to-digital converter, as featured in modern digital camera
systems.
The image-capturing receptors of the eyes, known as rods and
cones, are connected with the fibers of the optic nerve bundle
through a series of specialized cells that coordinate the
transmission of signals to the brain.

The amount of light allowed to enter each eye is controlled by
the iris, a circular diaphragm that opens wide at low light levels
and closes to protect the pupil (the aperture) and retina at very
high levels of illumination.
In the brain, the neural fibers of the optic nerves from each eye
cross at the optic chiasma where visual information from both
retinas traveling in parallel pathways is correlated, somewhat
like the function of a time base correction generator in a digital
video tape recorder.

From there, the visual information travels through the optic
tract to the knee-shaped lateral geniculate nuclei in the
thalamus, where the signals are distributed via the optic
radiations to the two visual cortices located on the lower rear
section of each half of the cerebrum.
The central fovea is located in an area near the center of the
retina, and positioned directly along the optical axis of each
eye. Known also as the "yellow spot", the fovea is small (less
than 1 square millimeter), but very specialized.
.

These areas contain exclusively high-density, tightly packed cone cells (greater than 200,000 cones per square millimeter in adult humans; see Figure).


This is offset by the fact that humans constantly scan objects in
the field of view, resulting in a perceived image that is
uniformly sharp.
In fact, when the image is prevented from moving relative to the
retina (via an optical fixation device), the eye no longer senses
an image after a few seconds.
The central fovea is the area of sharpest vision, and produces the
maximum resolution of space, contrast, and color.

Each eye is populated with approximately seven million cone
cells, which are very thin (3 micrometers in diameter) and
elongated.
The density of cone cells decreases outside of the fovea as the
ratio of rod cells to cone cells gradually increases
At the periphery of the retina, the total number of both types of
light receptors decreases substantially, causing a dramatic loss
of visual sensitivity at the retinal borders.

The arrangement of sensory receptors in the outer segments of the retina
partially determine the limit of resolution in different regions of the eye.
In order to resolve an image, a row of less-stimulated photoreceptors
must be interposed between two rows of photoreceptors that are highly
stimulated.
With a center-to-center spacing ranging between 1.5 and 2 micrometers
for the cones in the central fovea, optical stimuli having a separation of
approximately 3 to 4 micrometers should produce a resolvable set of
intensities on the retina.

The radius of the first minimum for a diffraction pattern formed
on the retina is about 4.6 micrometers with 550-nanometer light
and a pupil diameter of 2 millimeters.
Thus, the arrangement of sensory elements in the retina will
determine the limiting resolution of the eye.
Another factor, termed visual acuity (the ability of the eye to
detect small objects and resolve their separation), is generally
highest in the central fovea, which spans a visual field of about
1.4 degrees.

The spatial arrangement of rod and cone cells and their
connection to neurons within the retina is presented in Figure.

Rod cells, containing only the photopigment rhodopsin, have a
peak sensitivity to blue-green light (wavelength of about 500
nanometers)
They are the most common visual receptor cells, with each eye
containing about 125-130 million rod cells.
The light sensitivity of rod cells is about 1,000 times that of
cone cells.
The images generated by rod stimulation alone are relatively un
sharp and confined to shades of gray, similar to those found in a
black and white soft-focus photographic image.

• Rod vision is commonly referred to as scotopic or twilight
vision because in low light conditions, shapes and the relative
brightness of objects can be distinguished, but not their colors.
• This mechanism of dark adaptation enables the detection of
potential prey and predators via shape and motion in a wide
spectrum of vertebrates.
• In broad daylight, humans can visualize objects in the glaring
light from the sun, while at night large objects can be detected
by starlight when the moon is dark.

At threshold sensitivity, the human eye can detect the presence of about 100-150 photons of blue-green light (500 nanometers) entering the pupil.
For the upper seven decades of brightness, photopic vision predominates.
it is the retinal cones that are primarily responsible for photoreception.
In contrast, the lower four decades of brightness, termed scotopic vision, are controlled by the rod cells.

Adaptation of the eye enables vision to function under such
extremes of brightness.
Several mechanisms are responsible for the ability of the eye to
adapt to a high range of brightness levels.
Adaptation can occur in seconds (by initial pupillary reaction) or
may take several minutes (for dark adaptation), depending upon
the level of brightness change.
Full cone sensitivity is reached in about 5 minutes, whereas it
requires about 30 minutes to adapt from moderate photopic
sensitivity to the full scoptic sensitivity produced by the rod cells.

When fully light-adapted, the human eye features a wavelength
response from around 400 to 700 nanometers, with a peak
sensitivity at 555 nanometers (in the green region of the visible
light spectrum).
The dark-adapted eye responds to a lower range of wavelengths
between 380 and 650 nanometers, with the peak occurring at
507 nanometers.
For both photopic and scoptic vision, these wavelengths are not
absolute, but vary with the intensity of light.

The transmission of light through the eye becomes progressively
lower at shorter wavelengths.
In the blue-green region (500 nanometers), only about 50
percent of light entering the eye reaches the image point on the
retina.
At 400 nanometers, this value is reduced to a scant 10 percent,
even in a young eye.
Light scattering and absorption by elements in the crystalline
lens contributes to a further loss of sensitivity in the far blue.

Cones consist of three cell types, each "tuned" to a distinct
wavelength response maximum centered at either 430, 535, or
590 nanometers.
The basis for the individual maxima is the utilization of three
different photopigments, each with a characteristic visible light
absorption spectrum.
The photopigments alter their conformation when a photon is
detected, enabling them to react with transducin to initiate a
cascade of visual events.

Transducin is a protein that resides in the retina and is able
to effectively convert light energy into an electrical signal.
The population of cone cells is much smaller than rod cells,
with each eye containing between 5 and 7 million of these color
receptors.
True color vision is induced by the stimulation of cone cells.
The relative intensity and wavelength distribution of light
impacting on each of the three cone receptor types determines
the color that is imaged (as a mosaic), in a manner comparable
to an additive RGB video monitor or CCD color camera.

As mentioned above, pure cone vision is referred to as photopic
vision and is dominant at normal light levels, both indoors and
out. Most mammals are dichromats, usually able to only
distinguish between bluish and greenish color components.
In contrast, some primates (most notably humans) exhibit
trichromatic color vision, with significant response to red,
green and blue light stimuli.

Figure are the absorption spectra of the four human visual pigments, which display maxima in the expected red, green, and blue regions of the visible light spectrum.
When all three types of cone cell are stimulated equally, the light is perceived as being achromatic or white.

For example, noon sunlight appears as white light to humans,
because it contains approximately equal amounts of red, green, and
blue light.
An excellent demonstration of the color spectrum from sunlight is
the interception of the light by a glass prism, which refracts (or
bends) different wavelengths to varying degrees, spreading out the
light into its component colors.
Human color perception is dependent upon the interaction of
all receptor cells with light, and this combination results in
nearly trichromic stimulation.

There are shifts in color sensitivity with variations in light
levels, so that blue colors look relatively brighter in dim light
and red colors look brighter in bright light.
This effect can be observed by pointing a flashlight onto a
color print, which will result in the reds suddenly appearing
much brighter and more saturated
When only one or two types of cone cells are stimulated, the
range of perceived colors is limited.
For example, if a narrow band of green light (540 to 550 nanometers) is used to stimulate all of the cone cells, only the ones containing green photoreceptors will respond to produce a sensation of seeing the color green.

Although the human visual system features three types of cones
cells with their respective color pigments plus light-receptive rod
cells for scotopic vision, it is the human brain that compensates
for variations of light wavelengths and light sources in its
perception of color.
Metamers are pairs of different light spectra perceived as the
same color by the human brain.

Intermediary neurons that ferry visual information between the retina and the brain are not simply connected one-to-one with the sensory cells.
Each cone and rod cell in the fovea sends signals to at least three bipolar cells, whereas in the more peripheral regions of the retina, signals from large numbers of rod cells converge to a single ganglion cell.
The sensory, bipolar cells, and ganglion cells of the retina are also interconnected to other neurons, providing a complex network of inhibitory and excitatory pathways.

As a result, the signals from the 5 to 7 million cones and 125 million rods in the human retina are processed and transported to the visual cortex by only about 1 million myelinated optical nerve fibers.
The eye muscles are stimulated and controlled by ganglion cells in the lateral geniculate body, which acts as a feedback control between the retina and the visual cortex.

• At some point in ganglion layer the electrical signal is converted into nerve impulse which is transmitted to brain through the fibres of optic nerve.
• This generation of electrical signal and nerve impulse is a physiological process.
• The electrical impulses set up in rods and cones are programmed are sorted out somewhere on the way to brain.
• The exact mechanism of coding is not known, but some form of message is conveyed to brain by optic nerve.
• The messages from rods convey about light or on light (i.e. shape, movement of object etc.) while the messages from cones tell about the colour of the object under observation.

The messages are decoded and -coupled with the memories
stored in brain and the final consciousness of colour and vision
is experienced.
This process of interpretation of signal and retrieving
information from the nerve impulse in brain is a psychological
process.
Thus process of colour and vision initiated by physical stimulus
progress through physiological process and finally ends with
psychological process.,

Colour mixing law
• The series experiments to produce gamut of colours by
adding colured lights were carried out in good old days
by Newton
• But the fundamental difference in mixing light and
pigments / dyes was first recognized by Helmholtz (1852).
• The former is now known as additive colour mixing and
the later as subtractive colour mixing .

Industrial applications, like textile, paint, paper and
plastic the desired colours are produced by mixing
two or more colorants.
Therefore it is of significant importance to know the
resultant colour obtained by mixing various
colorants in different proportions.
The laws governing the colour of a mixture of
colorants are known as colour mixing laws

Mixing lights
To people accustomed to mixing dyes or pigments, the colours produced by mixing lights may sometimes be surprising.
For example,
• a blue light mixed with a yellow light might well give white,
• While red and green lights could be mixed to give a yellow.
• (Yellow and blue dyes would be expected to give green, while red and
green dyes would probably give a dirty brown colour.)
• Quite obviously, mixing dyes and pigments is fundamentally but
different from mixing colored lights.
• Since the CIE system is based on mixtures of lights, these must be
considered further.


Additive colour mixing
Additive color is color created by mixing a number of different light colors, with Red, green, and blue being the primary colors normally used in additive color system.
• Additive colour mixing occurs when two or more lights are added by focusing them on a white screen
• The primary colours selected are independent in the sense that mixture of two will not produce third primary colour. In case of the primaries selected for additive mixing we have

Additive Colors Combined
in Equal Parts
• Blue + Green = Cyan
• Red + Blue = Magenta
Green + Red = Yellow
• Red + Green + Blue =
White
Additive Colors Combined in Unequal Parts
• 1 Green + 2 Red = Orange
• 1 Red + 2 Green = Lime
• 1 Green + 1 Blue + 4 Red
= Brown


• Another simple method of demonstrating additive colour mixing is the Maxwell disc.
• This is a disc made of sectors of various colours,
• which is spun at increasing speed.
• Above a certain speed we see
– the colours blending together
– in an additive manner.
• The colours produced can be varied by
– altering the relative areas
– of the differently coloured sectors
Examples additive colour
Computer monitors and televisions are the most common examples of additive color.


Subtractive Colour Mixing
Subtractive mixing is much more common but usually involves
more complex processes.
The subtractive primary colors are cyan, magenta and yellow
(CMY). These are the three colors used in printer ink cartridges.
Photographs, magazines and other objects of nature
such as an apple; create color by subtracting or
absorbing certain wavelengths of color while
reflecting other wavelengths back to the viewer.
This phenomenon is called subtractive color.

• When the source of color is pigment or dye, the result of combining colors is different from when the source of color is light.
• Subtractive color mixing occurs when light is reflected off a surface or is filtered through a translucent object.
• For example, a red pigment or filter only appears red because it absorbs (subtracts) all of the light that is not red and only reflects or allows the red light.
• A green pigment only reflects green light and a green filter only passes green light.

The removal of part of incident energy can occur by the process
of absorption and scattering.
In absorption process, the light energy is converted into heat
and/or absorbed by the atoms of the material.
Types of subtractive mixing
When the subtraction is made by absorption only. It is said to
be simple subtractive mixing.
when the light is removed by scattering and absorption, it is
said to be complex subtractive mixing.

Subtractive ColorsCyan, Magenta and Yellow
Absorbs Creates • Blue + Green Red Cyan
• Red + Blue Green Magenta
• Green + Red Blue Yellow


A red apple is a good example of subtractive color; the apple really has no color;
it has no light energy of its own, it merely reflects the wavelengths of white light that cause us to see red and absorbs most of the other wavelengths which evokes the sensation of red.
The viewer (or detector) can be the human eye, film in a camera or a light-sensing instrument.

• The subtractive color system involves colorants and reflected light.
• Subtractive color starts with an object (often a substrate such as paper or canvas) that reflects light and uses colorants (such as pigments or dyes) to subtract portions of the white light illuminating an object to produce other colors.
• If an object reflects all the white light back to the viewer, it appears white.
• If an object absorbs (subtracts) all the light illuminating it, no light is reflected back to the viewer and it appears black.

• It is the subtractive process that allows everyday objects around us to show color.
• Color paintings, color photography and all color printing processes use the subtractive process to reproduce color.
• In these cases, the reflective substrate is canvas (paintings) or paper (photographs, prints), which is usually white.

• Printing presses use color inks that act as filters and
subtract portions of the white light striking the image
on paper to produce other colors.
• Printing inks are transparent, which allows light to pass
through to and reflect off of the paper base.
• It is the paper that reflects any unabsorbed light back to
the viewer.
• The offset printing process uses cyan, magenta and
yellow (CMY) process color inks and a fourth ink, black.

• The black printing ink is designated K to avoid confusion with B
for blue.
• Overprinting one transparent printing ink with another produces
the subtractive secondary colors, red, green, blue.
• The illustrations below show process inks printed on white paper.
Each process printing ink (cyan, magenta, yellow) absorbs or
subtracts certain portions of white light and reflects other portions
back to the viewer.
• Process printing inks are transparent. It is the paper that reflects
unabsorbed light back to the viewer.


COLOUR ORDER SYSTEMS

The methods deviced to quantitatively describe the colour are
called as colour order systems
•A system for categorizing colors
•An arrangement of color perceptions, color stimuli or material
color samples according to certain rules
•A subset of the world of color according to three attributes that
constitute the coordinates of the color system
•A rational plan for ordering and specifying all object colors by
a set of material standards

We classify the colour order systems in two groups as follows:
1. Colour order systems which are based on collection of samples.
Munsell system, Ostwald system. OSA-UCS system
and ISCC-NBS system and may other come under this class.
Each this system is represented by its colour atlas.
The atlas contains various colour chips, which are
arranged in definite configuration and are identified by
definite name or numbers .

2. Colour order systems which describe the colour by
mathematical numbers.
The descriptions of colour in these system are based on
the measurement of spectral reflectance of the sample.
Hunter L.a.b, CIE system and others obtained by its
transformation come under this class
These colour order systems are used in instrumental
colour measurements.

Description of Colour
The desert island experiment described by Judd provides a very
good illustration about the arrangement of colours in colour space.
The experiment is based on natural and logical approach of a
person to the gamut of colours available to him.
what will be the activity of a person sitting alone in a desert island
and surrounded by large number of pebbles having a wide variety
of colours.

Suppose a person with normal colour vision and no
experience of dealing with colours is idling away their
time on a desert island, surrounded by a large number of
pebbles of similar texture but having a wide variety of
colours.
Suppose they wanted to organise these pebbles in some
orderly way, according to their colour.
How can we describe colour in terms of what they might
do?

• One possible way would be for out experimenter to think about
colour in terms of the common names red, blue, green etc and
separate those out without hue – that is those that are white, grey
or black.
• Thus they separate the chromatic pebbles from the achromatic
ones.
• The observer may find that the achromatic pebbles could arranged
in a logical order in a series going from white to light grey to dark
grey to black.
• This arrangement in terms of lightness, provides a place for every
achromatic pebble. (value, whiteness or blackness)


• The chromatic pebbles differ from one another in several ways not just by differences in lightness.
• Our experimenter could separate them by hue, into different piles they call red, yellow, green, and blue.
• Each pile may be subdivided as finely as they want, for example, yellow-green, green and blue-green piles.
• Each group of pebbles of a given hue could be separated by lightness just as the achromatic pebbles were.
• The red pebbles could be separated into a series staring with the lightest pinks and becoming gradually darker, ending with the dark cherry reds.
• Each red pebble would be equivalent in lightness to one of the grey pebbles in the achromatic series.

• But the pebbles also differ in another way other than lightness and hue.
• For example, a brick red could be compared to a tomato-red colour.
• They are the same hue (neither is yellower or bluer red than the other).
• They also have the same lightness. (being equivalent in lightness to the same medium-grey stone taken from the achromatic pebbles)
• This third kind of difference relates to how much the stones differ from grey – in crude terms how much colour they contain.
• The stones with a single hue and a single lightness that vary in their hue are said to have varying chroma.

Definitions
• Hue: Attribute of visual perception according to which an area appears to be similar to one of the colours, red, yellow, green and blue, or to a combination of adjacent pairs of these colours considered in a closed ring (CIE 17.4).
• Lightness: Attribute by which a perceived colour is judged to be equivalent to one of a series of greys ranging from black to white (ASTM E 284).
• Chroma: Attribute of colour used to indicate the degree of departure of the colour from a grey of the same lightness (ASTM E 284).

Textile dyers use the terms “brighter”, “duller”,
“weaker” and “stronger” to represent specific changes
in lightness and chroma.
Changes in dye concentration relate to stronger or
weaker colours, and one may need to change the
choice of dyestuff to increase a colour’s “brightness”.

Colour Notation Systems
• Collections of samples are often used to provide examples of colour products. (e.g. Patches of paint, swatches of cloth, pads of papers, printings of inks, etc.)
–Munsell (1905)
– Pantone
– Natural Colour System (NCS)
– OSA Uniform Color Scales System
– The Colorcurve system
• These systems provide a set of symbols that denote a colour precisely.

Natural Colour System (NCS)• Colours are ordered by reference to the four primary
hues of red, green, yellow and blue.
• Colours are further modified by adding in proportions of black (swarthy) and white.

The NCS system is based on single hue triangles with white, black and a pure colour at the corners.

• The surface colour colour could be described With six
elementary attributes whiteness, blackness, redness,
greenness, yellowness and blueness
• The NCS colour atlas is published (2nd Edition 1996)
as a Swedish National Standard, and has achieved
World-wide status as a colour reference standard. The
colour spacing is based on 60,000 visual observations,
giving uniform colour scales.

MUNSELL COLOR SYSTEM.
• Munsell color system is a color space that specifies colors based
on three color dimensions: hue, value (lightness), and chroma
(color purity).
• Several earlier color order systems had placed colors into a
three-dimensional color solid of one form or another
• Munsell was the first to separate hue, value, and chroma into
perceptually uniform and independent dimensions, and was the
first to systematically illustrate the colors in three-dimensional
space.

• In 1905 Albert Munsell invented a complete colour description system.
• This system consists of:-
– A set of master physical samples whose colours are the basic reference colours. These are carefully spaced out as to cover colour space evenly and as completely as possible.
– A colour notation by which each colour can be described and located.
– Commercially available colour atlases, which contain carefully made copies of the original master reference colours.

• The system consists of three independent dimensions
which can be represented cylindrically in three
dimensions as an irregular color solid:
• Hue, measured by degrees around horizontal circles;
• Chroma, measured radially outward from the neutral
(gray) vertical axis; and
• Value, measured vertically from 0 (black) to 10
(white).

• Hue – The quality of colour. Described using terms
such as Blue, Yellow, Green and Red etc.
• Value (Lightness) – The quality described by the terms
light\dark etc., relating any colour to a grey of the
same lightness.
• Chroma – The quality that describes how the colour
differs from a grey of the same lightness.


ColourThere are five colours:
• Red, Yellow, Green, Purple and Blue.
We may thus identify two elementary achromatic colours
• white and black
• Colours are equally spaced around the circle
• and arranged clockwise in the order given when viewed


• 10 principal hues and 10 steps of value. The 10 hues
are arranged in a circle – Red (R), yellow-red (YR),
yellow (Y), green-yellow (GY), green (G), blue-green
(BG), blue (B), purple-blue (PB), purple (P), red-
purple (RP). Each principal hue is divided into 10 sub
hues.

• Value varies between black(0) and white(10). Achromatic
colours are notated with the prefix “N”.
• The centre of hue circle is a gray pole, varying in value This
lightness dimension is called as Munsell value.
• Value or lightness is defined by reference to an equal visual
step grey scale where black=0 and white=10.
• Chroma is on a variable length scale of equal perceptual steps
ranging from zero to 20.

The colour increase in saturation as the radius of hue
Circle increases. so that the most saturated colours
occur at the periphery. This saturation scale is called as
Munsell Chroma.
Munsell chroma has its value zero for neutral and
increases in a step of 2. It increases up to 14 for non-
fluorescent red and yellow paints
As an illustration 2.5 R-5/6 represents 2.5 red hue
corresponding to value 5 and chroma 6


Differences between the NCS and Munsell Systems
• The NCS differs from the Munsell system in two
important respects:-
– Colours are defined by reference to measured
numeric colour specifications, not master samples.
–Many more colours (16,000) are defined than can
be put in a typical colour atlas.

Ostwald System
• The first system based on modern understanding of spectrophotometric properties of dyes and pigments was proposed by Ostwald (Ostwald, 1931, 1969, Jacobson 1948).
• The colours in Ostwald system are produced by mixing the colours of high chroma with black and white colorants.
• The colour atlas based on Ostwald system is not much used in practice.
• Colour Harmony Manual produced by Container Corporation of America is based on the Ostwald system (Granville and' Jacobson 1944).
• The colour chips in the atlas are prepared on transparent cellulose acetate base.

The OSA-UCS System
• The task of developing the colour catalogue exhibiting
uniform visual spacing was undertaken by Optic al Society of
America.
• With an intensive effort for-30 years, a Uniform Colour Scale
Committee prepared 558 colour chips spaced according to
redness-greenness, yellowness-blueness and lightness
(Nickerson 1978, 1981).
• The system provides the chips illustrating high chroma colours.

CIE SYSTEM
• The perception of colour includes source, object and observer.
• In 1931 CIE (Commission International del'Eclairage international commission of illumination) introduced a system to quantify the colours in terms of mathematical numbers
• The system is of great use in instrumental colour

CIE standard illuminants
• The source of light works as a physical stimulus in perception of colour.
• Each source of light is characterized by the light energy that it emits at different wavelength
• These sources may be sun light. tungston lamp or fluorescent lamp.
• In physics important group of sources are called as blackbodies.
• These sources are not black in colour, but the energy radiated by them at different wavelengths
• The temperature of blackbody is called as its colour temperature
• The temperature of the source is referred as colour temperature

• This colour temperature is not equal to their actual temperature.
but their spectral power distribution is equivalent to that of a
black body at the correlated colour temperature.
• Thus the spectral power distribution of a 100 watt tungston lamp
closely approximates to the energy radiated by a black body at
temperature 2854K.
• Similarly the day light spectral power distribution is equivalent to
energy radiated by blackbody at 6500 K.
• Following this criteria CIE defined the standard sources based on
their colour temperatures

CIE recommended three standard illuminants for colour calculation.
Those sources are called as CIE standard illuminants A, B and C
• CIE illuminant A has colour temperature of 2854 K. Its spectral power = 100 watt tungston lamp
• CIE illuminant B has colour temperature of 4800 K. Its spectral power = noon light
• CIE illuminant C has colour temperature of 6500 K. Its spectral power = avg. day light
• CIE defined above illuminants with their spectral power distribution in visible wavelength range from 380 nm to780 nm
• 1965 CIE defined the day light illuminant D65 with colour temperature of 6500 K.

THE CIE STDANDARD OBSERVERThe task of defining a standard observer which may represent a normal colour vision of average human population was difficult.
A visual colorimeter similar to the arrangement was used to obtain the results of matching spectrum matching the spectrum colours used three primaries (red at 700 nm, green at 546 nm and blue at 436 nm).
The spectrum colours of different wavelengths can be matched by adding different proportions of primaries r, g and b.
The observer views the test colour ill half of the field of views and in other half the mixture of r. g, b.
All test colours cannot be matched with combination of three primaries.

The resultant tristimulus values when determined for all spectrum colours, will at least contain few negative values.
• CIE selected one set of primaries and define standard observer data x, y, z.
• The y curve is eye response curve.
• The new set of data X, y, z are known as 2° 1931 standard observer figure The CIE 1932 2° observer data were prepared using fovea region of the human eye.
• In practice in visual assessment of colour, one uses larger areas of retina surface.
• The Structure of fovea and surrounding region of the retina is different.
•

Therefore CIE in 1964 defined another observer using 10 ° field view. the supplementary standard observer x10, y10, z10
Characteristics of Object
• In CIE system, object is characterized by its reflectance at different wavelengths in visible spectral region, with respect to perfect diffuse.
• The perfect diffuse 100 percent light energy incident on it with equal amount of energy reflect in all possible directions.

CIE TRISTIMULUS VALUES
• CIE proposed a method to reduce these sets of numbers in three
numbers called as CIE TRISTIMULUS VALUES X,Y,Z.
• These values are determined by Multiplying the relative power
P of CIE illuminant, the reflectance factor R and each of colour
matching functions x, y, z for wavelengths in visible spectral
range and addicting them to give three numbers.•

• Thus if Rλ is expressed as a percentage, Y runs from zero (for a sample which reflects no light) to 100 (for a sample which diffusely reflects all the light incident on it) and is independent of any units used. The ranges for X and Z depend on the illuminant.

Colour measurement
• Colour measurements are essentially measurements of visible light shining through an object or visible light reflected from an object.
Types of colour measurement
Colour measurement divides into two areas,
1. Reflectance and
2. Transmittance
Each of these can be further divided into
a) Diffuse and
b) Regular

Regular
• It means the light travels through undeviated or is reflected off the sample in a mirror-like way without change of frequency.
Diffuse
• It means that the light is scattered as it is reflected by, or transmitted through, a sample, again without change of frequency of the light.
The total reflectance or transmittance
It is the sum of the regular and diffuse parts.

Reflectance and transmittance
They are defined in terms of the ratio of the incident light to the reflected or transmitted light
Regular reflectance
• Regular reflectance is the regularly reflected or specular component of the illumination,
• i.e. light that is reflected in a mirror-like way off a surface at the same angle and in the same plane as the illumination beam.
• It is not usual when making colour measurements to measure this component separately, as it has the same spectral profile as the illumination.
• Regular reflectance is usually only measured on its own when the sample has a very high regular reflectance, such as a mirror.

Diffuse reflectance
• Diffuse reflectance is probably the measurement that most people
think of when referring to colour measurement.
• This is measurement of light scattered from a surface and is most
commonly measured using an instrument incorporating an
integrating sphere.
• The simplest measurement geometry is illumination at the sample
normal or near normal and detection over the whole hemisphere,
but excluding the regular or specular component.
• For reflectance measurements, the trade-off is between light level
and the ratio of the sphere surface area to total port area.

Regular transmittance• Regular transmittance is light that is undeviated as it passes
through a sample.
• The sample may attenuate (absorb) the light but the direction is not changed.
• This is the normal type of light transmission such as looking through a clear pane of glass.
Diffuse transmission
• Light that does not pass through a sample in a regular way is diffuse transmission,
i.e. the light direction has been changed. An example of this is the
• covers to lamps that spread the illumination over a larger area than would be possible without them.

Radiance factor and transmission factor
• Radiance factor and transmission factor are the fundamentals of
the reflectance and transmittance measurement geometries.
• It means illumination of a sample in a specific direction, over a
specific angular range, with detection at another specified
direction and angular range.
• The most common colour measurement geometry of this type is
illumination at the normal (0°) to a sample with detection at 45°
to the sample normal (or vice versa).

Geometries of measurement
• There are endless ways of arranging the optical system to make colour measurements.
• The colour of a sample varies, depending on the way it is measured.
• A sample may reflect differently depending on the Illumination Angle, Whether The Sample Is Translucent, The State Of Polarization Of The Illumination, The Detection Angular Range, The Way The Detector Measures The Reflected
Light, Etc.

• The CIE1 recommends the use of three reflectance measurement geometries:
specular included,specular excluded and 0°/45° and their reciprocal geometries.
• Use of these geometries is not mandatory but it makes sharing and comparing measurements with others a possibility.

SAMPLE-INDUCED EFFECTS
These effects included
• Translucency – sideways spreading of light;
• Fluorescence – emission of light at a different wavelength from the incident
light;
• Metallics – metal flakes within a surface coating that have mirror like
properties, but are orientated parallel to the sample surface;
• Interferometric effects – the colour is different depending on the
illumination and viewing conditions.
• All of these are difficult to measure in a conventional manner with an
integrating sphere or by using a single angle geometry.

Colour measuring instrumentation
• Precision is a measure of how well as instrument repeats a measurement.
• Accuracy is a measure of how well the instrument will make measurements compared to particular standard reference materials
Single-scale instruments
• These are instruments that are primarily for measuring a specific colour measurement scale, in order to ascertain where the sample lies on the scale.
• These types of instruments are used in medicine, chemistry, manufacturing control, food processing, etc

Visual instruments• Visual instruments are usually of a comparative nature.
They allow a sample to be viewed under the same conditions as a reference artifact and the user determines if they are a match.
• The most common of these would be a simple light box, which usually has neutral grey walls, and a choice of light sources designed to simulate recommended sources
• The reference and the test samples can be viewed side by side. This is how the textile industry used to do much of its colour matching

Hand-held/portable instruments
• Hand-held instruments come in a variety of types, from small
spectrophotometers to much simpler colourimeters.
• Generally, these are small instruments, measuring a small area.
• They have the advantage that they can be taken to the object to be
measured instead of bringing the sample to the instrument.
• This means that finished products such as cars, vehicle interiors,
large objects and interior decoration can be measured in situ
without the need to remove samples for testing

Multiangle instruments
• Multiangle instruments have a lot of the features of other instrumentation, but offer several fixed angle geometries, rather than just 0°/45° or a sphere based geometry.
• They are an attempt to measure appearance or special effect samples.
• By looking at their properties at several angles, the user can
• pick out the best angles for meaningful results on the sample types being investigated.

Benchtop instruments• Most of the colour measuring instrument manufacturers sell
more instruments of this type than any other.
• For reflectance measurements, these instruments generally incorporate diode array detectors in their optical systems.
• The light source is generally a xenon flash tube. Because of these features, measurements can be made very rapidly
• Bench-top instruments are mainly set up to perform comparisons of one sample against a reference, for example, in a dye house for matching a production sample to the required reference colour.
• The software allows for easy comparison of samples and references. Tolerances on the closeness of colour match can be set to the user’s requirements.

• For reflectance instruments the data resolution may vary from 5 nm at the top end through 10 nm to 20 nm.
• The spectral range available is also variable. All spectral instruments will include the range 400 nm to 700 nm, but the better instruments will offer wavelengths outside this range, down to 360 nm and up to 780 nm.
• For transmittance instruments measurements in the range 200 nm to 800 nm plus will generally be available with at least 1 nm resolution.
• Spectral range and resolution are important for the type of samples to be measured.
• Those with sharp or rapidly changing features will require more point measurements to avoid features being smoothed out or missed..
• Bench-top reflectance instruments are usually supplied with a white reference standard.
• The instrument should also come with a good black reference that approximates to zero – a black trap for integrating sphere geometries and a black glass for 0°/45° geometry.
• Typical manufacturers are Datacolor, GretagMacbeth, X-Rite, Tintometer and Analytik