colorado springs fire department standards of cover 2012.pdf · colorado springs fire department...
TRANSCRIPT

Colorado Springs Fire Department
Standards of Cover
2012
Colorado Springs Fire Department – Standards of Cover 2012 Page i
INTRODUCTION
The following report serves as the Colorado Springs Fire Department (CSFD) Standards of Cover
document. The Commission on Fire Accreditation International (CFAI) defines the process,
known as “deployment analysis,” as written procedure which determines the distribution and
concentration of fixed and mobile resources of an organization. The purpose for completing
such a document is to assist the agency in ensuring a safe and effective response force for fire
suppression, emergency medical services, and specialty response situations. This document
conforms to the 5th edition of the CFAI Standards of Cover guidelines.
Creating a Standards of Cover requires that a number of areas be researched, studied, and
evaluated. The following report will begin with an overview of both the community and the
Department. Following this overview, the agency will discuss areas such as risk assessment,
critical task analysis, agency service level objectives, and distribution and concentration
measures. The agency will provide documentation of reliability studies and historical
performance through charts and graphs. The report will conclude with policy
recommendations.
Colorado Springs Fire Department – Standards of Cover 2012 Page ii
Table of Contents INTRODUCTION .............................................................................................................................................. i
EXECUTIVE SUMMARY .................................................................................................................................. 1
Section 1 - Description of Community Served .............................................................................................. 2
Legal Basis for Existence ........................................................................................................................... 2
Department History and Major Milestones .............................................................................................. 2
Funding Sources and Restrictions ............................................................................................................. 5
Topography ............................................................................................................................................... 6
Climate ...................................................................................................................................................... 6
Population ................................................................................................................................................. 8
Development Within the Service Area ..................................................................................................... 9
Layout of the Service Area ...................................................................................................................... 10
Section 2 - Review of the Services Provided ............................................................................................... 11
Fire Suppression ...................................................................................................................................... 11
Emergency Medical Services (EMS) ........................................................................................................ 11
Hazardous Materials Response ............................................................................................................... 12
Wildland Fire Suppression ...................................................................................................................... 13
Technical Rescue Services ....................................................................................................................... 13
Assets, Physical Resources and Staffing .................................................................................................. 14
Partnering Agencies ................................................................................................................................ 18
Community Baselines .............................................................................................................................. 19
First Unit Arrival on Any Type of Call .................................................................................................. 19
First EMS Unit Arrival (BLS and/or ALS) on EMS and Rescue Calls ..................................................... 19
First Structure Fire Unit Arrival on Fire Calls ....................................................................................... 20
First Ladder/Rescue Unit Arrival on Rescue and Fire Calls ................................................................. 20
First Chief Officer Arrival on Rescue, Hazmat and Fire Calls ............................................................... 20
Initial Attack Force (2 in/2 out) on Fire Calls....................................................................................... 21
Effective Response Force (ERF) on All Types of Calls .......................................................................... 21
Section 3 - Review of Community Expectations and Performance Goals................................................... 22
Section 4 - Overview of the Community Risk Assessment.......................................................................... 23
Geospatial Characteristics....................................................................................................................... 25
Political Boundaries............................................................................................................................. 25
Colorado Springs Fire Department – Standards of Cover 2012 Page iii
Growth Boundaries ............................................................................................................................. 25
Construction Limitations ..................................................................................................................... 26
Infrastructure Limitations ................................................................................................................... 26
Topography ............................................................................................................................................. 26
Response Barriers ............................................................................................................................... 26
Elevation Changes ............................................................................................................................... 26
Transportation Network ......................................................................................................................... 27
Roads ................................................................................................................................................... 27
Rail Lines ............................................................................................................................................. 27
Airports ............................................................................................................................................... 27
Waterways .......................................................................................................................................... 27
Climatic Impact ....................................................................................................................................... 28
Disaster Exposure.................................................................................................................................... 28
Physical Assets Protected ....................................................................................................................... 29
Development and Population Growth .................................................................................................... 30
Service Demand ...................................................................................................................................... 33
Incidents by PEZ .................................................................................................................................. 35
Annual Incidents by Still District ......................................................................................................... 35
Incidents by Still District Trend ........................................................................................................... 36
Fire, Medical, and HazMat Incidents by Time of Day ......................................................................... 36
Emergency Incidents by Day of the Week .......................................................................................... 37
Percent of Fires by Hour ..................................................................................................................... 37
Risk Classifications .................................................................................................................................. 38
Fire Risk Evaluation ................................................................................................................................. 39
Critical Task Analysis ............................................................................................................................... 40
Section 5 – Historical Perspective and System Performance ..................................................................... 45
Distribution ............................................................................................................................................. 45
Station District Physical Characteristics .............................................................................................. 46
System-wide performance .................................................................................................................. 47
First-Due Unit Response ..................................................................................................................... 48
Concentration ......................................................................................................................................... 49
Percentage of calls by station ............................................................................................................. 49
Colorado Springs Fire Department – Standards of Cover 2012 Page iv
Percentage of calls by PEZ................................................................................................................... 50
Call density by Fire Demand Zone (FDZ) ............................................................................................. 51
Reliability ................................................................................................................................................. 52
First-Due Analysis ................................................................................................................................ 52
Section 6 - Performance Objectives and Performance Measures .............................................................. 53
Benchmark Performance ........................................................................................................................ 53
Baseline Performance ............................................................................................................................. 54
Structure Fires ..................................................................................................................................... 54
Emergency Medical Services (EMS) .................................................................................................... 56
Wildland Fires ..................................................................................................................................... 57
Hazmat ................................................................................................................................................ 58
Technical Rescue ................................................................................................................................. 59
Section 7 - Compliance Methodology ......................................................................................................... 60
Compliance Model .................................................................................................................................. 60
Section 8 - Overall Evaluation and Recommendations ............................................................................... 62
Evaluation ............................................................................................................................................... 62
Recommendations .................................................................................................................................. 63

Colorado Springs Fire Department – Standards of Cover 2012 Page 1
EXECUTIVE SUMMARY
The purpose of the Standards of Cover (SOC) is to define and measure the appropriate level of
service based on a comprehenive study of the Department’s historical performance,
deployment strategies and community risk factors in order to determine the capability of its
response system. This process uses a systems approach to evaluate data in the records
management system and set standards based on that data. The Department will then be able
to match community needs (risks and expectations) with appropriate levels of service to
operate in a safe, efficient and effective manner.
This document describes our service area, the risks that must be protected and reduced within
the community, our capabilities, and our performance objectives and measures. This
information will allow the Department to identify risks in the community, analyze and establish
levels of response service to respond to those risks, and evaluate the Department’s
performance. Benchmark response times have been established that the Department strives
to meet. These response time goals will contribute to our commitment to continually improve
how we deliver our services.
First-due response companies are expected to arrive on the scene of any emergency within
eight minutes 90% of the time. Effective firefighting force is expected to arrive within 12
minutes 90% of the time. The efficient geographic dispersion and placement of resources near
service delivery points will lead to maximum effectiveness when responding to the greatest
number and types of risk.
In conclusion, this Standards of Cover is a dynamic document that reflects the changing needs
of the Colorado Springs Fire Department and serves as a mechanism for constantly seeking
opportunities for improvement. It is a key element in our plan to reduce risk to our residents
and visitors. We are committed to providing the most effective services in a fiscally responsible
manner and to continually evaluate our performance in the constant pursuit of improvement.
Colorado Springs Fire Department – Standards of Cover 2012 Page 2
Section 1 - Description of Community Served
Legal Basis for Existence
The City of Colorado Springs was chartered on May 11, 1909, pursuant to the home rule
provisions of Article XX of the Colorado State Constitution. Chapter 8, Article 2 of the Charter
of the City of Colorado Springs established the Colorado Springs Fire Department (CSFD),
granting the authority to protect the city against fire. Specific services stated in the code are
fire suppression, fire investigations, hazardous materials response, fire prevention, fire code
enforcement, public education, and medical control at the scene of an accident or emergency.
The CSFD has grown to provide other services, including emergency medical services, technical
rescue, and wildland fire suppression.
Department History and Major Milestones
The City of Colorado Springs marked its beginning on July 31, 1871, when the first stake was
driven at what is now the southeast corner of Cascade and Pikes Peak Avenues. Fire prevention
and protection activities began not long after, first with a volunteer department and later a
paid department.
Bucket brigades were the first methods of firefighting. There were very few natural water
sources in the town, therefore, most water was supplied by wells. The El Paso Canal was
completed in early 1872, which took its water from Fountain Creek and provided another
source of water. It is believed that pressure was put on the city government to furnish fire
protection very early on.
On October 10, 1872, Ordinance Number 4 was enacted that provided for the election of a fire
warden. The fire warden was charged with making inspections to reduce fire hazards, and
leveling fines against those with unsafe chimneys or other conditions conducive to fire. Those
who dumped live ashes in the street, or who burned combustibles on a windy day could be
punished with a fine of $5.00.
Colorado Springs Fire Department – Standards of Cover 2012 Page 3
Several local fires motivated interested citizens to meet on December 27, 1872, where they
promptly organized with over thirty active members. They named themselves Colorado Springs
Hook and Ladder Company No. 1. Since this name implied they had a ladder truck (which they
did not), on February 4, 1873, they changed the name to The Colorado Springs Fire Company.
On May 7, 1873, they took delivery of a Babcock No. 1, which can be described as a fire
extinguisher on wheels.
A second fire company, The Hook and Ladder Company, was formed on January 29, 1875. The
hook and ladder truck arrived on May 11, 1875. It was a hand-drawn, four-wheeled wagon
carrying about half a dozen ladders. There was some initial animosity between these two fire
companies, but they quickly became friendly and began to work together.
Ground was broken on October 12, 1878, for the city's first pipe line. Water would be carried
from a reservoir on the mesa northwest of town to a system of water mains in town. This
system included 20 fire hydrants. A purchase was made of 1,000 feet of cable cotton hose and
two hose carts. On December 4, 1878, organization was completed of the Matt France Hose
Company No. 1. Matt France was a prominent citizen who had been mayor and a county
commissioner. Five days later, the W.S. Jackson Hose Company No. 2 was organized.
The first fire chief was appointed in February, 1879. Benjamin F. Crowell was a prominent
citizen who had served as a county treasurer, county commissioner, and later was one of the
incorporators of the streetcar line on Tejon Street. Over the next fifteen years, many other
volunteer companies were formed to provide fire protection in other areas of town.
It wasn't until January, 1894, that the city council voted to organize a paid fire department and
disband the volunteers. The new fire chief, J.G. Johnson from Minneapolis, was paid $100 a
month, and the men each received $70 a month. The new department was housed in the
remodeled lower level of city hall. The horse stalls were at the back, and the former city council

Colorado Springs Fire Department – Standards of Cover 2012 Page 4
chambers became the sleeping quarters. The Colorado Springs Fire Department went into
service on February 12, 1894.
The first motorized apparatus was put into service in October, 1910. It was a Gramm chassis
with a four-cylinder, forty horsepower engine, with a top speed of thirty miles per hour. It cost
$2,476.50. A test run took it two and a half minutes to reach Glockner Sanitarium (now
Penrose Hospital) from Station 2, where the horse-drawn wagon had taken twenty-five
minutes. More motorized apparatus soon followed and the use of horses was slowly
eliminated.
Intensive training for the firefighters began in 1931. Prior to that time, the fire department had
been expected to respond to an alarm, pour on plenty of water, make sure the fire was out,
then return to quarters to await the next alarm. Now, emphasis was put on salvage work to
help reduce loss. In July of the same year, ten firefighters were given training by the U.S.
Bureau of Mines in the use of self-contained oxygen breathing apparatus. In March of 1932,
the use of civil service examinations was used to fill officer positions on the department.
A progressive step occurred in the early 1960's, when Chief Gus Cummings established
company inspections. This included schools, hospitals, nursing homes, high rise building,
hotels, and other high-risk buildings. The purpose was for the crews to familiarize themselves
with the structures, as well as to draw a plan of each building, showing exits, stairways,
sprinklers, utility shutoffs and special hazards.
Another step made by Chief Cummings was construction of a new training facility. Up to that
point, training had been done on a dilapidated tower behind Fire Station #1. The new tower
would be a five story masonry tower, in which controlled fires could be started. Another
feature was a water pit from which pumpers could be tested at draft.
Paramedic service began on December 31, 1979, when two Type III Triple K ambulances were
put into service at Fire Stations #3 and #7. Fourteen men took the 1,000 hour paramedic

Colorado Springs Fire Department – Standards of Cover 2012 Page 5
course at St. Anthony's in Denver. A federal grant of $250,000 funded the training,
communication systems, and equipment.
Response to hazardous materials incidents began in April, 1981. State Senate Bill #55
mandated that local authority was responsible for control and containment of hazardous
material, and the city council assigned this responsibility to the Colorado Springs Fire
Department. Engine #6 was assigned these duties. By August, 1983, thirty men had received
training in hazardous materials response.
A computerized fire inspection program began July 20, 1981. Commercial buildings were
ranked as to how often they should be inspected, and then entered into the program. Another
phase involved dividing the city into 1,000 zones, called Fire Demand Zones, or FDZs, which are
still used today.
The Colorado Springs Fire Department has continued to grow in size and has progressed in
many different disciplines of rescue. There are currently twenty fire stations, with two more
planned in the growing north and northeast portions of the city. The department provides the
citizens of Colorado Springs a wide variety of services besides fire suppression to ensure their
safety.
Funding Sources and Restrictions
Funding for the Colorado Springs Fire Department is provided primarily through city general
fund allocations, which accounts for 75% of the total CSFD budget. The primary source of
revenue for the general fund is sales and use tax. Another 20% of the CSFD budget comes from
the public safety sales tax, which is a revenue source exclusively for the fire and police
departments. Both of these funding sources are reliant on the economy as sales tax revenues
fluctuate based on consumer spending. The CSFD also receives a small amount of funding in
the form of federal grants primarily in the area of emergency management and fuels mitigation,
and hazmat.

Colorado Springs Fire Department – Standards of Cover 2012 Page 6
Under a 1992 amendment to the Colorado Constitution, revenue is restricted for all levels of
government. Local governments cannot spend revenues collected under existing tax rates
without voter approval if revenues grow faster than the rate of inflation and population
growth. During an economic recession when tax revenues decline, spending growth can be
interrupted resulting in budget and service cuts.
Topography
The City of Colorado Springs is located in south-central Colorado between the foothills of the
Rocky Mountains and the eastern plains of Colorado. The city is 194.68 square miles, which
makes it Colorado’s largest city in area. The elevation is 6,035 feet, although some areas of the
city are significantly higher. Portions of the western half of the city exist in a wildland interface
area of steep slopes adjacent to the Pike National Forest. Large portions of the eastern half of
the city consist of flat grasslands. The north side of the city is bordered by the Palmer Divide, a
ridge that runs perpendicular to the mountains. Colorado Springs sits in several different
ecological zones and has a wide variety of vegetation, including grasses, scrub oak, and a
multitude of coniferous and deciduous trees.
The two largest waterways in Colorado Springs are Fountain Creek and Monument Creek.
Monument Creek flows south and enters the city near the Air Force Academy. Fountain Creek
flows east and enters the city just east of Manitou Springs. Monument Creek empties into
Fountain Creek near the intersection of I-25 and Highway 24 just west of downtown. Once
Monument Creek reaches this confluence the combined creek becomes Fountain Creek. It then
flows south to Pueblo. There are other smaller drainages within the city.
Climate
The City of Colorado Springs is in a semi-arid climate. There are an average of 127 sunny days
per year (not including partly sunny or partly cloudy days). Average annual precipitation is 16.2
inches, with the highest precipitation in August. Average snowfall is approximately 42.7 inches
per year, which primarily falls between October and April.

Colorado Springs Fire Department – Standards of Cover 2012 Page 7
The warmest month is July, with an average high temperature of 84 degrees, and an average of
eight days above 90 degrees. In 2012, however, there were a total of 18 days in July with
temperatures of 90 degrees and higher. The coldest month is January, with an average high
temperature of 28 degrees and an average low temperature of 16 degrees. Temperatures can
fluctuate drastically in Colorado Springs, sometimes as much as 50 degrees in one day.
Although the city has a relatively mild climate, there are periods of extreme cold or heat that
are far outside the average.
Common natural weather events in Colorado Springs include winter storms, thunderstorms,
lightning, hail, windstorms, and flash flooding. Tornadoes are less likely, but are capable of
happening on a weak magnitude.
Typical aspects of winter storms in the city include snow, ice, and extreme cold. They are
frequently accompanied by strong winds, creating blizzard conditions, severe drifting, and
dangerous wind chill temperatures. The severity of these storms varies depending on the
location within the city, with higher elevations to the north and west typically receiving more
snow, and stronger winds on the north and east sides of the city. It is common for the roads to
ice over quickly, causing extremely hazardous driving conditions.
Thunderstorms occur frequently during the monsoon season of mid-July through August.
These storms produce a large amount of rain in a short period of time, and are often
accompanied by lightning, high winds and hail. Heavy rain typically leads to flash flooding of
the multiple waterways in the city. Ground lightning strikes are very common during these
storms.
Spring in Colorado Springs is hail season, which typically occurs from April through June. The
city is particularly vulnerable because it sits against the front range of the Rocky Mountains
where hail-producing storms are more likely to develop. There have been occurrences where
major roadways have been covered with several inches of hail. This is also the time of year

Colorado Springs Fire Department – Standards of Cover 2012 Page 8
when tornadoes occur. Although they more commonly form on the plains east of the city,
tornadoes have occurred within the city limits. More common during this season are
microbursts, which are strong sudden windstorms not as powerful as tornadoes, but capable of
causing significant damage. These typically cause downed power lines and structural damage
to buildings, and can cause serious danger for airport traffic.
Population
The City of Colorado Springs is the second largest municipality in the state. According to the
2010 United States Census, Colorado Springs has a population of 416,427 with a distribution of
51% female and 49% male residents. The following is a breakdown by race:
White 78.8%
African American 6.3%
Hispanic/Latino 16.1%
Asian 3.0%
American Indian/Alaskan Native 1.0%
Persons reporting two or more races 5.1%
The service area is largely developed, with an average population density of 2,140.6 persons
per square mile. The CFAI Standards of Cover, 5th Ed., designates metropolitan areas as those
with populations of over 200,000 in total and/or population density over 3,000 people per
square mile. Colorado Springs, with over 400,000 in population, qualifies as a metropolitan
area, but its population density lies within the CFAI definition of urban areas.
The southeast area of the City has several areas that are home to socially and economically
disadvantaged residents that place a higher demand on emergency services. Also in this area is
the City’s highest concentration of apartment complexes, leading to higher population
densities. More citizens per square mile increase the demand for service in this part of the City.
In response to the increase of incidents in this area, the CSFD relocated Fire Station 8 in
January, 2008, to approximately .39 miles east of its previous location and also created a new
medical squad, Squad 108 (referenced in Department data as P081), to better serve the
residents in the area.
Colorado Springs Fire Department – Standards of Cover 2012 Page 9
Development Within the Service Area
Several observations can be made regarding development categories and age in various
sections of the City. The downtown area consists mainly of masonry constructed business and
governmental office buildings. In most downtown areas the daytime population exceeds the
nighttime population. While this generally holds true, there are several very popular nightclubs
in the downtown area that concentrate high populations in a relatively small area. Age of the
downtown structures varies from older, historic buildings to new construction and modern
renovations.
The areas surrounding the downtown contain mostly older wood-frame residences, which
include a sizable number of balloon-type construction. The western areas of the City have a
large number of smaller and older structures of various construction types. Industrial areas are
few in Colorado Springs and they vary from small companies to a large tool manufacturer.
These areas are located throughout the city.
Retail business complexes can be found in all areas of the City. Newer residential areas,
including many light-weight constructed homes, are mostly concentrated in the northeastern
areas of the City. These new residential developments are served by strip mall complexes built
of the same light-weight construction material. Hotels in Colorado Springs are located
throughout the community with some concentration near the airport on the City’s southeast
side, and near the sports arena on the southwest side of the City. However, a large hotel
resides in the downtown area and several more can be found on the north end of town. The
City is also home to several parks, golf courses, open space areas, and a network of recreational
pathways that are dispersed throughout the community.

Colorado Springs Fire Department – Standards of Cover 2012 Page 10
Layout of the Service Area
The City is bisected by Interstate 25 that runs north and south along the front range of the
Rocky Mountains. U.S. Highway 24 is a smaller thoroughfare that runs through the City east to
west. There are several railways that pass through the City, and which presently do not include
any passenger train traffic. The rail lines also parallel Interstate 25, traveling north and south.
The City has few standing bodies of water, lakes and ponds that, according to the 2010 Census,
account for nearly half a square mile of area. Fountain Creek also parallels Interstate 25
through the City, and while it and other waterways are usually very quiet, they can become
torrents during thunderstorms that frequent the City on summer afternoons.
The City is home to the Colorado Springs Municipal Airport, which is situated on its
southeastern border. The airport primarily serves passenger traffic, with some cargo flights.
Most significant about the airport is that it shares runways and taxiways with Peterson Air
Force Base. The Peterson Air Force Base Fire Department is responsible for aircraft fires and
other emergencies on the airport property, while the CSFD responds to medical incidents in and
around the terminal areas. On any large scale incidents, the two departments work together in
a unified command structure.
There is an extensive wildland urban interface in the City that encompasses 28,800 acres and
36,485 homes. This area includes the western foothills from the northern edge of the city limits
to the southern edge, as well as several large parks in the central part of the City.

Colorado Springs Fire Department – Standards of Cover 2012 Page 11
Section 2 - Review of the Services Provided
The Colorado Springs Fire Department is a full service, all risk department capable of
responding to any type of fire, EMS, rescue, hazardous materials, or wildland fire call. The
department maintains a modern fleet of well-equipped apparatus distributed throughout the
service area and staffed with highly trained employees.
Fire Suppression
The Colorado Springs Fire Department (CSFD) responded to 2,892 fire incidents (including false
alarms) in 2011, which is approximately 5.9% of all calls. The Department operates out of 20
fire stations with equipment consisting of 20 engines, six trucks, and one heavy rescue vehicle.
Engines carry 500 gallons of water, 1,500 feet of supply hose, 700 feet of attack hose in varying
diameters, and a pump capable of delivering 1,500 gallons per minute. Trucks are equipped
with hydraulic elevating ladders, as well as hydraulic, pneumatic and electric heavy rescue
tools. The heavy rescue vehicle, besides its rescue tools, is equipped with a full complement of
ground ladders.
The typical first alarm configuration consists of two engines, one truck, and one battalion chief.
All engines, trucks and the heavy rescue vehicle are staffed with four firefighters. All CSFD
firefighters are certified to the Firefighter II level, at a minimum.
Emergency Medical Services (EMS)
The CSFD assumes medical control at the scene of all emergency medical calls in its jurisdiction.
The CSFD responded to 34,995 medical calls in 2011, or approximately 66% of all calls. All
firefighters maintain a minimum certification of Emergency Medical Technician-Basic (EMT-B)
and are capable of providing basic level medical care including cardiopulmonary resuscitation
(CPR), automatic external defibrillation (AED), and first aid for injuries.

Colorado Springs Fire Department – Standards of Cover 2012 Page 12
The Department is approved to have 83 promoted Firefighter Paramedics, who are certified to
Emergency Medical Technician-Paramedic (EMT-P) and are able to provide more highly
advanced care including heart monitoring, intravenous drug therapies, and some surgical
interventions for critical victims of trauma or medical emergencies. This allows the CSFD to
respond with advanced life support (ALS) capability on all 20 engines and two medical squads.
The total number of ALS certified personnel is currently 129, which also allows the Department
to often respond ALS on truck companies and speciality vehicles.
The Department has a Tactical Emergency Medical Services (TEMS) team that is located at
Station 2. Team members have received training from both the Colorado Springs Police
Department’s Tactical Enforcement Unit and the El Paso County Sheriff’s SWAT team. These
firefighters respond to tactical situations requiring medical assistance.
Hazardous Materials Response
The Hazardous Materials Response Team (HMRT) works in a cooperative effort with city,
county, state, and federal governments on environmental regulations and code compliance
issues as well as response to and mitigation of hazardous materials spills/releases. The CSFD is
the Designated Emergency Response Agency (DERA) for incidents occurring within the city
limits. The CSFD has mutual aid response agreements with all surrounding fire departments
and military installations.
The HMRT responds to spills/releases of all types of hazardous materials including radioactive
shipments, such as transuranic waste traveling along the I-25 corridor, as part of the Waste
Isolation Pilot Plant (WIPP) program. The HMRT takes an active role in the annual Hazardous
Waste Collection Days, held biannually to provide an opportunity for individuals and businesses
to dispose of waste chemicals, insecticides, paint, tires, oil, and batteries.
All CSFD firefighters are certified to the Hazardous Materials Response Operations level. The
members of the HMRT are trained to the Technician level and respond out of three different
Colorado Springs Fire Department – Standards of Cover 2012 Page 13
fire stations. The hazmat vehicle, the reserve hazmat vehicle, and the decontamination unit are
cross-staffed by HMRT personnel. Hazmat 14 and the decontamination unit are regional assets
for the Department of Homeland Security South Central Region of Colorado.
Wildland Fire Suppression
Wildland fire suppression is one of the Department’s highest priorities. All 20 Type I engines
are equipped with wildland hose, nozzles, and clamps, as well as wildland helmets and fire
shelters. Six fire stations, all located in the wildland urban interface area, are assigned to the
Wildfire Suppression Program. In addition to the Type I engine, two of these stations are
equipped with Type 3 wildland engines, which are outfitted exclusively with equipment and
tools specific to wildland firefighting. Additionally, 14 of the 20 fire stations have brush trucks
(Type 6 engines), which are deployed with the engines on all calls during periods of high fire
danger. All firefighters are trained in operational level wildfire skills and the members of the
Wildfire Suppression Program maintain certification via the National Wildfire Coordinating
Group (NWCG). Members of the program are frequently deployed to wildfires around the
country because of their high level of expertise.
Technical Rescue Services
The Heavy Rescue Program is housed at Station 17 and provides the majority of technical
rescue services. The heavy rescue vehicle is staffed full time and deployed with four
firefighters. Members of this program are trained to the Technician level in many disciplines of
rescue, including swift water, dive, ice, trench, confined space, extrication, high angle, and
structural collapse. The heavy rescue vehicle is equipped with specialized equipment for all of
these disciplines, along with a supplemental trailer pulled by a utility truck.
The High Angle Program is housed at Stations 5 and 13, which are in close proximity to areas
where such rescues frequently occur. Members of this program are trained to Technician level
in high angle rescue and are highly familiarized with the local recreational climbing areas.

Colorado Springs Fire Department – Standards of Cover 2012 Page 14
Station 13 also has four off-road motorcycles used to rapidly respond into areas where heavy
fire apparatus cannot, and Station 5 has two motorcycles.
Assets, Physical Resources and Staffing
The Department has a minimum daily staffing of 115. The “Berkeley Schedule” is the current
platoon schedule used by the Department, which consists of three shifts (A, B and C) each
working a nine-day work cycle.
All engines, trucks, hazmat and the heavy rescue vehicle maintain a minimum of four
personnel. Units occasionally respond with three personnel due to training, officer meetings,
or when a paramedic has ridden in with a patient. All medical squads are staffed with one
paramedic and one firefighter. The Department maintains assets and physical resources as
listed in Figure 1. Station locations and their first due response areas are shown in Figure 2.
Truck districts are shown in Figure 3. It should be noted that although there are six aerial
trucks, the heavy rescue apparatus is also deployed with ladder capabilities and is, therefore,
considered a truck district.
Apparatus Quantity # of Personnel
Engines 20 80
Trucks 6 24
Heavy Rescue 1 4
Medical Squads 2 4
District Chiefs 3 3
TOTAL 115
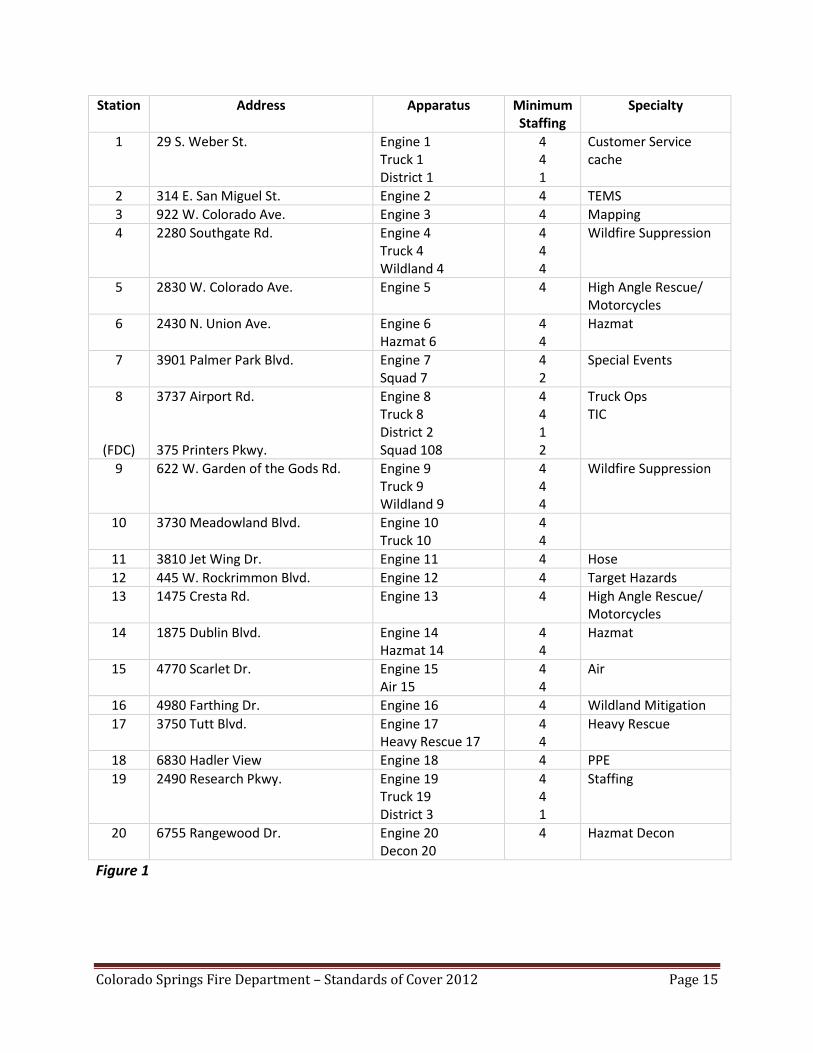
Colorado Springs Fire Department – Standards of Cover 2012 Page 15
Station Address Apparatus Minimum Staffing
Specialty
1 29 S. Weber St. Engine 1 Truck 1 District 1
4 4 1
Customer Service cache
2 314 E. San Miguel St. Engine 2 4 TEMS
3 922 W. Colorado Ave. Engine 3 4 Mapping
4 2280 Southgate Rd. Engine 4 Truck 4 Wildland 4
4 4 4
Wildfire Suppression
5 2830 W. Colorado Ave. Engine 5 4 High Angle Rescue/ Motorcycles
6 2430 N. Union Ave. Engine 6 Hazmat 6
4 4
Hazmat
7 3901 Palmer Park Blvd. Engine 7 Squad 7
4 2
Special Events
8
(FDC)
3737 Airport Rd. 375 Printers Pkwy.
Engine 8 Truck 8 District 2 Squad 108
4 4 1 2
Truck Ops TIC
9 622 W. Garden of the Gods Rd. Engine 9 Truck 9 Wildland 9
4 4 4
Wildfire Suppression
10 3730 Meadowland Blvd. Engine 10 Truck 10
4 4
11 3810 Jet Wing Dr. Engine 11 4 Hose
12 445 W. Rockrimmon Blvd. Engine 12 4 Target Hazards
13 1475 Cresta Rd. Engine 13 4 High Angle Rescue/ Motorcycles
14 1875 Dublin Blvd. Engine 14 Hazmat 14
4 4
Hazmat
15 4770 Scarlet Dr. Engine 15 Air 15
4 4
Air
16 4980 Farthing Dr. Engine 16 4 Wildland Mitigation
17 3750 Tutt Blvd. Engine 17 Heavy Rescue 17
4 4
Heavy Rescue
18 6830 Hadler View Engine 18 4 PPE
19 2490 Research Pkwy. Engine 19 Truck 19 District 3
4 4 1
Staffing
20 6755 Rangewood Dr. Engine 20 Decon 20
4
Hazmat Decon
Figure 1

Colorado Springs Fire Department – Standards of Cover 2012 Page 16
Figure 2

Colorado Springs Fire Department – Standards of Cover 2012 Page 17
Figure 3

Colorado Springs Fire Department – Standards of Cover 2012 Page 18
Partnering Agencies
The CSFD has agreements in place with emergency response agencies throughout El Paso
County and beyond. These agreements are in the form of Memorandums of Understanding
(MOU) and Intergovernmental Agreements (IGA) and provide for mutual aid coverage between
jurisdictions. While each agreement is an individual contract between the Colorado Springs Fire
Department and the other agency named on the agreement, they have the common purpose of
supporting public safety within each agency’s jurisdiction.
Agency Agreement Type Big Sandy FPD/Simla FD IGA
Black Forest FPD IGA
Broadmoor Fire Rescue IGA
Calhan FPD IGA
Cascade FPD IGA
Cheyenne Mountain Air Force Station FD (DOD) IGA
Cimarron Hills FPD IGA
City of Fountain FD IGA
City of Manitou Springs FD IGA
Colorado Metropolitan District IGA
Colorado State Forest Service MOU
Donald Wescott FPD IGA
El Paso County Health Department MOU
El Paso County Search and Rescue MOU
El Paso County Sheriff Hazmat Team IGA
Falcon FPD MOU
Fort Carson FD (DOD) MOU
Green Mountain Falls/Chipita Park FD IGA
Manitou Springs Fire Department IGA
Peterson Air Force Base FD (DOD) IGA
Pikes Peak Regional Communications Network IGA
Schriever Air Force Base FD (DOD) IGA
Security FD IGA
Southwest Hwy 115 FD IGA
United States Air Force Academy FD (DOD) IGA
Woodmen Valley FPD IGA

Colorado Springs Fire Department – Standards of Cover 2012 Page 19
Community Baselines
To determine the level of compliance with existing standards, a review of historical data has
been completed and community baselines established. This has provided response times that
will assist the Department in reviewing performance. The data in the following tables cover the
period 1/1/04 through 11/23/11; thus the data shown for 2011 covers roughly 10 ¾ months
rather than a full year.1
First Unit Arrival on Any Type of Call
Total Response Time Coverage (%)
Year 0-4 min 0-5 min 0-6 min 0-7 min 0-8 min 0-9 min 0-10 min
2004 21.8 44.7 65.4 80.1 88.8 93.6 96.2
2005 22.5 46.0 67.7 82.2 90.0 94.4 96.6
2006 22.7 46.9 68.1 82.1 89.9 94.1 96.3
2007 22.5 46.2 67.9 82.0 90.0 94.5 96.8
2008 21.6 45.8 68.0 82.5 90.6 94.8 97.1
2009 20.2 43.4 65.9 81.2 89.9 94.6 97.0
2010 19.7 42.7 65.3 80.9 89.5 94.4 96.8
2011 19.0 41.4 64.5 80.4 89.5 94.4 97.0
First EMS Unit Arrival (BLS and/or ALS) on EMS and Rescue Calls
Total Response Time Coverage (%)
Year 0-4 min 0-5 min 0-6 min 0-7 min 0-8 min 0-9 min 0-10 min
2004 22.6 46.2 67.0 81.3 89.7 94.3 96.7
2005 23.7 47.6 69.4 83.4 90.9 95.1 97.0
2006 24.2 48.8 70.0 83.5 91.0 94.8 96.8
2007 23.8 48.0 69.6 83.2 90.9 95.1 97.2
2008 22.7 47.9 69.9 83.8 91.5 95.2 97.5
2009 21.2 44.7 67.2 82.1 90.5 94.9 97.2
2010 20.8 44.1 66.7 82.1 90.3 94.8 97.1
2011 20.2 43.3 66.4 81.8 90.5 95.1 97.4
1 The Principal Analyst who provided statistical analysis for this report retired in late 2011.

Colorado Springs Fire Department – Standards of Cover 2012 Page 20
First Structure Fire Unit Arrival on Fire Calls
Total Response Time Coverage (%)
Year 0-4 min 0-5 min 0-6 min 0-7 min 0-8 min 0-9 min 0-10 min
2004 17.3 38.0 59.4 75.2 84.7 90.6 93.5
2005 13.6 34.2 59.0 75.1 84.3 89.2 92.1
2006 13.8 33.2 55.8 74.0 83.9 89.1 92.0
2007 15.6 38.6 61.8 77.7 87.7 93.1 94.9
2008 14.1 35.0 57.9 76.0 86.4 91.8 94.9
2009 11.1 30.7 55.4 73.0 84.3 91.1 94.0
2010 12.0 30.2 52.4 73.0 83.8 90.5 93.3
2011 10.0 27.2 53.8 71.5 83.5 89.8 93.8
First Ladder/Rescue Unit Arrival on Rescue and Fire Calls
Total Response Time Coverage (%)
Year 0-8 min 0-9 min 0-10 min 0-11 min 0-12 min 0-13 min 0-14 min
2004 58.9 66.7 75.6 81.5 86.3 88.1 90.0
2005 54.9 65.1 73.2 78.5 82.7 87.0 88.4
2006 55.6 63.4 73.3 79.2 83.2 85.1 86.6
2007 60.7 70.1 78.2 83.8 88.3 89.9 91.6
2008 51.2 62.3 70.6 78.9 81.7 83.7 86.9
2009 55.3 68.0 77.7 82.7 88.0 90.0 91.3
2010 63.2 73.4 82.9 88.0 89.5 91.9 93.1
2011 59.9 71.6 78.9 84.6 87.6 88.3 89.6
First Chief Officer Arrival on Rescue, Hazmat and Fire Calls
Total Response Time Coverage (%)
Year 0-8 min 0-9 min 0-10 min 0-11 min 0-12 min 0-13 min 0-14 min
2004 30.0 35.8 42.6 46.3 50.0 55.8 60.5
2005 20.8 28.3 35.8 43.8 51.3 56.7 62.9
2006 26.2 33.5 39.5 45.1 52.8 58.4 63.9
2007 24.9 34.9 41.0 45.9 52.0 58.1 62.0
2008 24.1 33.0 38.8 45.1 52.7 56.7 62.9
2009 25.2 32.7 38.8 49.5 54.2 60.7 66.4
2010 24.1 34.0 41.1 49.8 56.5 60.5 66.0
2011 27.4 32.7 41.9 47.2 55.2 59.3 65.7
Colorado Springs Fire Department – Standards of Cover 2012 Page 21
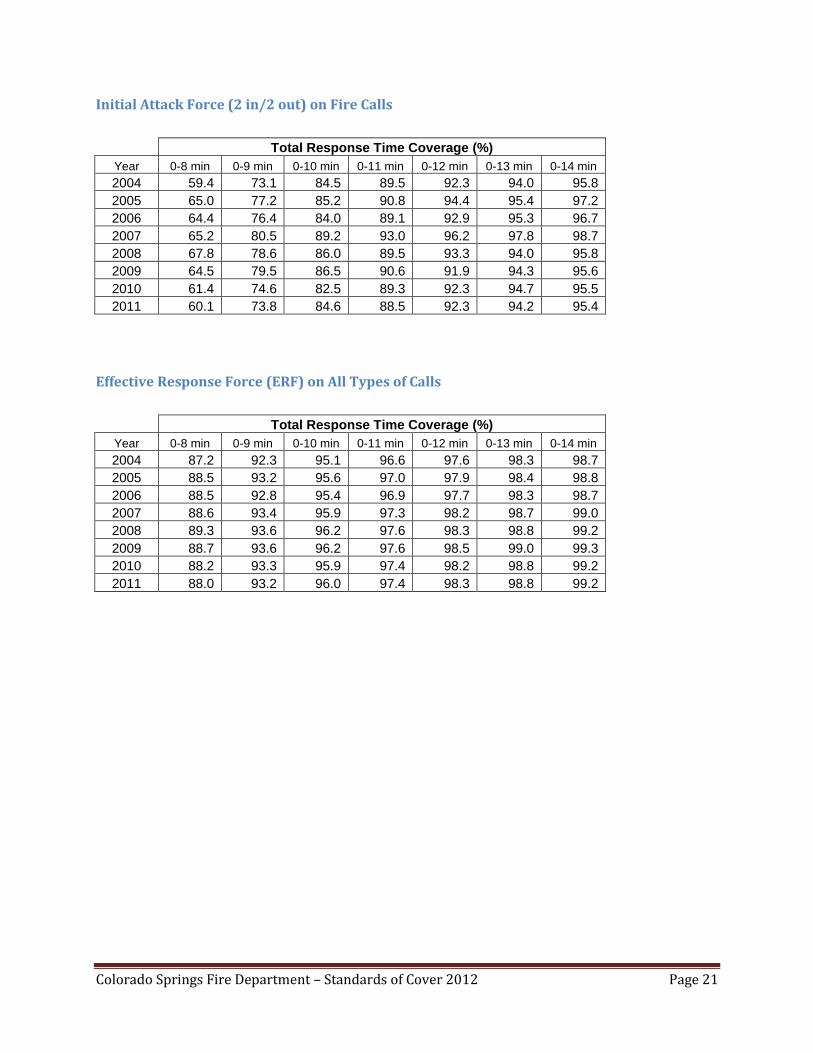
Initial Attack Force (2 in/2 out) on Fire Calls
Total Response Time Coverage (%)
Year 0-8 min 0-9 min 0-10 min 0-11 min 0-12 min 0-13 min 0-14 min
2004 59.4 73.1 84.5 89.5 92.3 94.0 95.8
2005 65.0 77.2 85.2 90.8 94.4 95.4 97.2
2006 64.4 76.4 84.0 89.1 92.9 95.3 96.7
2007 65.2 80.5 89.2 93.0 96.2 97.8 98.7
2008 67.8 78.6 86.0 89.5 93.3 94.0 95.8
2009 64.5 79.5 86.5 90.6 91.9 94.3 95.6
2010 61.4 74.6 82.5 89.3 92.3 94.7 95.5
2011 60.1 73.8 84.6 88.5 92.3 94.2 95.4
Effective Response Force (ERF) on All Types of Calls
Total Response Time Coverage (%)
Year 0-8 min 0-9 min 0-10 min 0-11 min 0-12 min 0-13 min 0-14 min
2004 87.2 92.3 95.1 96.6 97.6 98.3 98.7
2005 88.5 93.2 95.6 97.0 97.9 98.4 98.8
2006 88.5 92.8 95.4 96.9 97.7 98.3 98.7
2007 88.6 93.4 95.9 97.3 98.2 98.7 99.0
2008 89.3 93.6 96.2 97.6 98.3 98.8 99.2
2009 88.7 93.6 96.2 97.6 98.5 99.0 99.3
2010 88.2 93.3 95.9 97.4 98.2 98.8 99.2
2011 88.0 93.2 96.0 97.4 98.3 98.8 99.2
Colorado Springs Fire Department – Standards of Cover 2012 Page 22
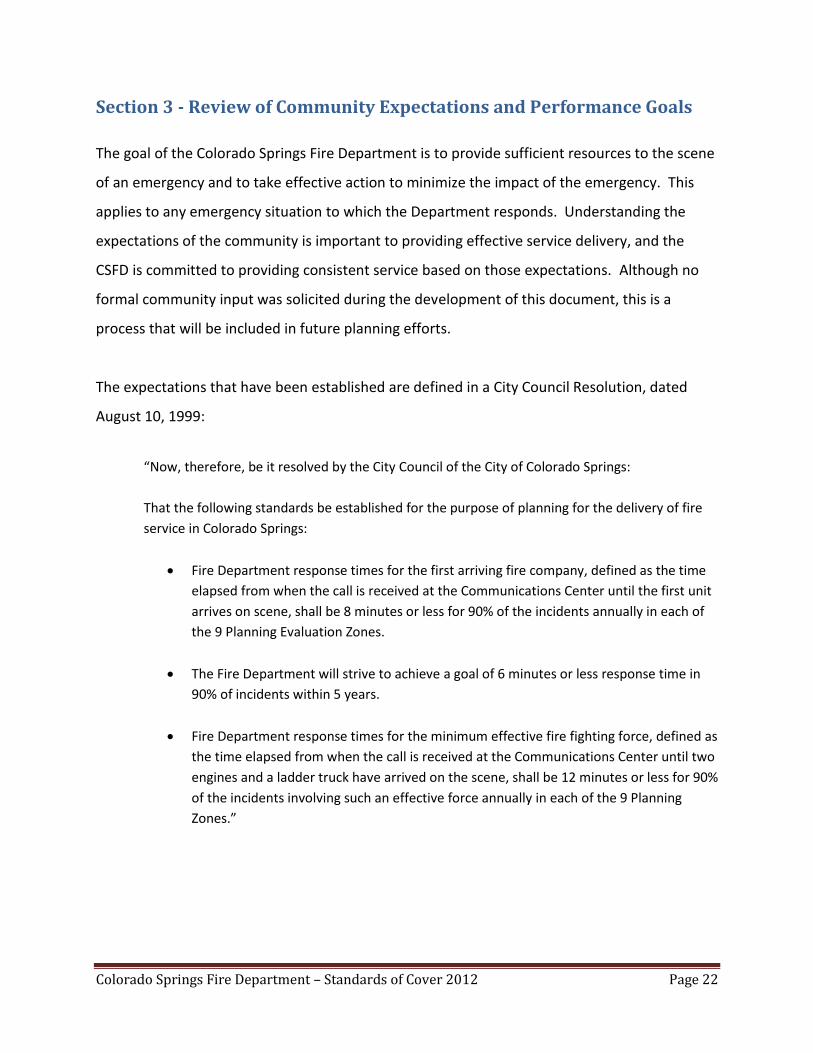
Section 3 - Review of Community Expectations and Performance Goals
The goal of the Colorado Springs Fire Department is to provide sufficient resources to the scene
of an emergency and to take effective action to minimize the impact of the emergency. This
applies to any emergency situation to which the Department responds. Understanding the
expectations of the community is important to providing effective service delivery, and the
CSFD is committed to providing consistent service based on those expectations. Although no
formal community input was solicited during the development of this document, this is a
process that will be included in future planning efforts.
The expectations that have been established are defined in a City Council Resolution, dated
August 10, 1999:
“Now, therefore, be it resolved by the City Council of the City of Colorado Springs:
That the following standards be established for the purpose of planning for the delivery of fire
service in Colorado Springs:
Fire Department response times for the first arriving fire company, defined as the time
elapsed from when the call is received at the Communications Center until the first unit
arrives on scene, shall be 8 minutes or less for 90% of the incidents annually in each of
the 9 Planning Evaluation Zones.
The Fire Department will strive to achieve a goal of 6 minutes or less response time in
90% of incidents within 5 years.
Fire Department response times for the minimum effective fire fighting force, defined as
the time elapsed from when the call is received at the Communications Center until two
engines and a ladder truck have arrived on the scene, shall be 12 minutes or less for 90%
of the incidents involving such an effective force annually in each of the 9 Planning
Zones.”

Colorado Springs Fire Department – Standards of Cover 2012 Page 23
Section 4 - Overview of the Community Risk Assessment
The Colorado Springs Fire Department, along with the Colorado Springs Office of Emergency
Management, practices an all hazards approach to emergency management and planning. Risk
is defined locally as the likelihood of emergency incident occurrence, the potential for life or
property loss, local impact, and monetary replacement cost. Additional factors considered
when assessing are occupancy type and construction type. Risk is then identified by using
historical data, hazard classification, and a district analysis of occupancies performed by station
captains. Fire protection system data also plays a role in risk assessment with engineered fire
prevention reducing the risk in new and renovated structures. These factors combine to allow
the CSFD to identify and prepare for incidents that have a potential to occur within its
jurisdiction, with an emphasis placed upon the likelihood of occurrence.
The response area of the Colorado Springs Fire Department is broken down into geographic
zones through three different methods:
1. Nine Planning Evaluation Zones (PEZ) for overall macro-level planning and analysis
purposes. (Figure 4)
2. 20 fire station still districts for station-specific analysis purposes. (Figure 2)
3. 2,172 Fire Demand Zones (FDZ) for micro-level planning and analysis purposes.

Colorado Springs Fire Department – Standards of Cover 2012 Page 24
Figure 4
Colorado Springs Fire Department – Standards of Cover 2012 Page 25
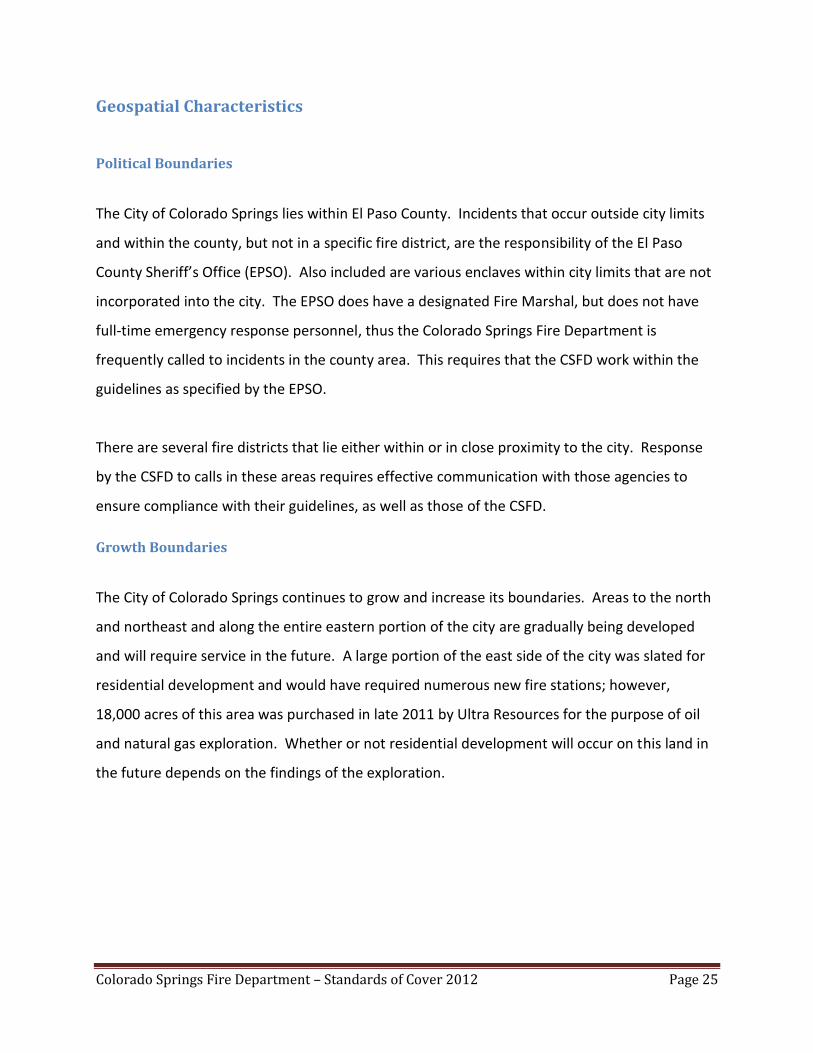
Geospatial Characteristics
Political Boundaries
The City of Colorado Springs lies within El Paso County. Incidents that occur outside city limits
and within the county, but not in a specific fire district, are the responsibility of the El Paso
County Sheriff’s Office (EPSO). Also included are various enclaves within city limits that are not
incorporated into the city. The EPSO does have a designated Fire Marshal, but does not have
full-time emergency response personnel, thus the Colorado Springs Fire Department is
frequently called to incidents in the county area. This requires that the CSFD work within the
guidelines as specified by the EPSO.
There are several fire districts that lie either within or in close proximity to the city. Response
by the CSFD to calls in these areas requires effective communication with those agencies to
ensure compliance with their guidelines, as well as those of the CSFD.
Growth Boundaries
The City of Colorado Springs continues to grow and increase its boundaries. Areas to the north
and northeast and along the entire eastern portion of the city are gradually being developed
and will require service in the future. A large portion of the east side of the city was slated for
residential development and would have required numerous new fire stations; however,
18,000 acres of this area was purchased in late 2011 by Ultra Resources for the purpose of oil
and natural gas exploration. Whether or not residential development will occur on this land in
the future depends on the findings of the exploration.
Colorado Springs Fire Department – Standards of Cover 2012 Page 26
Construction Limitations
Construction in the city is robust and includes a wide variety of residential and commercial
structures. Limitations on the size, height and complexity of new development is restricted by
current zoning, building and fire codes.
Infrastructure Limitations
The city’s lack of funding has resulted in a critical shortfall in necessary maintenance and
repairs. This was highlighted in June, 2012, when a massive thunderstorm hit the city and
caused several major intersections to be flooded because the drainage system could not handle
the heavy flow of rain. This resulted in numerous rescues by the Colorado Springs Fire
Department, as well as days of clean up afterward.
Topography
Response Barriers
There are two specific locations within the Department’s response area that are not easily
accessed. One is the Colorado Centre Metropolitan District, a residential area that is outside
the city limits to the southeast, but to which CSFD responds through an intergovernmental
agreement. The nearest CSFD fire station is seven miles away and travel time is approximately
12 minutes. The second location is Cedar Heights, an affluent gated residential area in the
foothills on the west side of the city. Access is restricted to a single point of entry
approximately three miles from the nearest fire station.
Elevation Changes
The Cedar Heights neighborhood is on a hillside with national forest on the north and west
sides and the Garden of the Gods park on the east side. Elevation changes go from 6,400 feet
at the entrance gate up to 7,600 feet at the top of the neighborhood. The road has a number
of switchback turns that require slower driving speeds.
Colorado Springs Fire Department – Standards of Cover 2012 Page 27
Station 16 is located in the southwest foothills of the city and is situated at approximately 6,400
feet. The response area ranges from an elevation of 6,000 feet up to 7,000 feet.
Transportation Network
Roads
There are 7,431 lane miles of paved roadways maintained by the City of Colorado Springs.
Several hundred intersections exceed 15,000 vehicles on a daily basis, with the major
intersections handling between 30,000 and 50,000 vehicles per day. Examples are North
Academy Boulevard at Briargate Boulevard, Garden of the Gods Road at Interstate 25, and
Powers Boulevard at Airport Road. Interstate 25 and U.S. Highway 24 are major thoroughfares
for both residents and non-residents with each handling over 100,000 vehicles per day.
Rail Lines
The main rail lines through Colorado Springs are parallel to Interstate 25 and travel north and
south, with one major spur to the Drake Power Plant. Rail line traffic does not include any
passenger trains.
Airports
The Colorado Springs Airport is situated on the city’s southeast side. It hosts five major
commercial airlines and sees more than 2 million passengers annually. Runways and taxiways
are shared with the adjacent Peterson Air Force Base.
Waterways
The two main waterways in Colorado Springs are Fountain Creek and Monument Creek, as well
as numerous other streams in the city that may pose a risk. The city has a long documented
history of flooding events dating as far back as 1864.

Colorado Springs Fire Department – Standards of Cover 2012 Page 28
Climatic Impact
The climate of Colorado Springs is relatively mild and dry, but many of the common weather
events can be extreme. Summers are marked by frequent afternoon thunderstorms that often
include heavy rain, lightning, hail and high winds. Calls for emergency response during these
events include fires caused by lightning strikes, and swift-water rescues.
Recent drought conditions and extreme high summer temperatures have become an issue, as
witnessed by the recent Waldo Canyon Fire in the summer of 2012. A combination of very low
humidity, record high temperatures and high winds caused a relatively small wildland fire to
quickly ignite the dried out terrain into a massive wall of flames that spread into the city,
causing two deaths, destroying 346 homes, and damaging another 45 homes.
Winter storms do not occur often but are typically severe when they do happen. Snow, ice,
extreme cold and high winds create blizzard conditions, severe drifting and dangerously low
wind chill temperatures. During these storms it is common for roads to ice over quickly,
causing extremely hazardous driving conditions. This not only results in a high number of traffic
accidents, but also slows down response by emergency vehicles. Such weather conditions may
cause localized power and phone outages, closures of streets, highways, public transportation,
schools, businesses, and non-essential government operations. People may be stranded in
vehicles or other locations not suited to sheltering operations or isolated from essential
services. The extreme temperatures increase the likelihood of frozen pipes and the subsequent
thawing may produce broken pipes and flooding causing an increase in alarms for the
Department.
Disaster Exposure
The potential risks from natural and weather-related disasters have been summarized in the
City of Colorado Springs Pre-Disaster Mitigation Plan. The highest perceived threats are from
wildland fires, blizzards and floods, and the lowest are from earthquakes and landslides.

Colorado Springs Fire Department – Standards of Cover 2012 Page 29
Physical Assets Protected
There are many physical assets that are critical to the functionality of the City of Colorado
Springs. This includes government buildings, fire and police facilities, hospitals, schools,
bridges, power plants, and water and wastewater treatment plants. There are also numerous
facilities where there are large populations of people, such as retail centers, sports, recreation
and entertainment facilities, places of worship, medical buildings, universities/colleges and high
density housing. Additionally, there are 72 structures listed in national and state historic
registries and many cultural resources within the city. A comprehensive description is included
in Section 4.15 of the City of Colorado Springs Pre-Disaster Mitigation Plan Update 2010.

Colorado Springs Fire Department – Standards of Cover 2012 Page 30
Development and Population Growth
According to the 2010 U.S. Census, the total population of Colorado Springs is 416,247. This
qualifies it as a metropolitan area, per CFAI standards; however, the average population density
is 2,140.6 per square mile, which falls under the definition of an urban area. The areas that
have a density of more than 3,000 people per square mile fall geographically in the center of
the city.
The Colorado Springs Fire Department in 2012 had 1.09 personnel per 1,000 residents. Over
the past five years, the estimated annual increase in population is 1.6%, and fire service
incidents have increased at an average annual rate of 3.3%. On a population-adjusted basis,
requests for fire services continue rising. The rate of fire service incidents per 1,000 residents
was 118.3 in 2010. For 2011, the rate of incidents per 1,000 residents was 124.1. (Figure 5)
Figure 5
0
20
40
60
80
100
120
140
2002 2003 2004 2005 2006 2007 2008 2009 2010 2011
Incidents per 1,000 Population - 2011
Total
Medical
Other
Fires

Colorado Springs Fire Department – Standards of Cover 2012 Page 31
Figure 6

Colorado Springs Fire Department – Standards of Cover 2012 Page 32
Approximately 10% of the population is over the age of 65 years old and 7% is under the age of
5 years old, placing a total of 17% of the population in the age groups at highest risk for
residential fire fatalities. 2
It is well-documented that low-income households have a higher risk of residential structure
fires.3 The poverty rate in Colorado is $23,050 for a family of four, and $11,170 for individuals.
In Colorado Springs, approximately 21% of the population earns less than $25,000.
2 NFPA Demographic and Other Characteristics Related to Fire Deaths or Injuries, March 2010.
3 USFA Socioeconomic Factors and the Incidence of Fire, June 1997
7% 7%
7%
7%
7% 15% 14%
15%
6%
5% 10%
Population By Age - 2010
Under 5
5-9
10-14
15-19
20-24
25-34
35-44
6% 5%
10%
11%
15% 20%
13%
13%
4% 4%
Population By Income - 2010
under $10,000
$10,000-$14,999
$15,000-$24,999
$25,000-$34,999
$35,000-$49,999
$50,000-$74,999
$75,000-$99,999
Colorado Springs Fire Department – Standards of Cover 2012 Page 33
Service Demand
The Colorado Springs Fire Department analyzes its workload in many different ways and a wide
variety of data is published in its annual statistical abstract document. The total number of
incidents the CSFD responded to in 2011 was 53,138, representing a 7.8% rise over the prior
year. The largest percentage increase was service calls, which increased by 27% in 2011. Good
intent calls also increased significantly with a 14.3% rise over 2010.
Fire incidents in 2011 declined slightly from 2010. However, 2011 fire incidents exceeded the
average rate for the past 5 years. Medical incidents increased by 3.8% in 2011. Some of this
can be attributed to the rise in population. The estimated rise in population was 1.5%, which is
significantly smaller than the rate of increase in medical incidents.
Emergency Incident Trend by Situation Found Incident Category 2002 2003 2004 2005 2006 2007 2008 2009 2010 2011
Fires 1,127 959 731 779 849 726 786 729 844 802
Medical 30,731 29,976 29,830 31,414 30,825 28,867 28,039 33,323 33,708 34,995
Hazardous Materials* 629 522 364 299 281 314 256 250 248 269
False Alarms 2,470 2,293 2,032 1,932 2,062 2,222 1,962 2,166 2,047 2,090
Service Calls 5,015 4,531 5,762 5,836 5,910 5,927 5,758 6,405 6,094 7,739
Good Intent 2,548 2,285 3,955 4,406 4,657 6,608 8,667 6,617 5,914 6,757
All Others* 829 685 630 503 520 439 392 393 422 486
Total 43,349 41,251 43,304 45,169 45,104 45,103 45,859 49,883 49,277 53,138
Fires 1.5%
Medical 65.9%
Hazardous Materials*
0.5%
False Alarms 3.9%
Service Calls 14.6%
Good Intent 12.7%
All Others* 0.9%
Incidents by Major Category - 2011
Fires
Medical
HazardousMaterials*
False Alarms
Service Calls
Good Intent
All Others*

Colorado Springs Fire Department – Standards of Cover 2012 Page 34

Colorado Springs Fire Department – Standards of Cover 2012 Page 35
Incidents by PEZ
PEZ 2006 2007 2008 2009 2010 2011 5-Yr CAGR
(%)
1 6,374 6,125 6,013 6,740 6,801 7,346 2.9
2 3,860 3,943 4,006 4,607 4,610 4,969 5.2
3 2,647 2,773 2,771 2,865 2,808 3,195 3.8
4 5,793 5,767 5,703 5,977 5,933 6,205 1.4
5 9,248 9,298 9,647 10,318 10,117 10,914 3.4
6 4,994 5,221 5,303 5,972 6,132 6,489 5.4
7 6,847 6,630 6,791 7,279 6,908 7,412 1.6
8 3,437 3,397 3,497 3,780 3,665 4,156 3.9
9 1,806 1,821 1,985 2,191 2,150 2,332 5.2
N/A 98 128 143 154 153 120 4.1
Total 45,104 45,103 45,859 49,883 49,277 53,138 3.3
Annual Incidents by Still District
0
1,000
2,000
3,000
4,000
5,000
6,000
ST
01
ST
02
ST
03
ST
04
ST
05
ST
06
ST
07
ST
08
ST
09
ST
10
ST
11
ST
12
ST
13
ST
14
ST
15
ST
16
ST
17
ST
18
ST
19
ST
20
P0
81
Unspecifie
d
Incidents by Still District
Colorado Springs Fire Department – Standards of Cover 2012 Page 36
Incidents by Still District Trend
2006 2007 2008 2009 2010 2011
Annual
Change
(%)
5 Year
CAGR (%)
ST01 4,693 4,344 3,479 3,957 3,732 4,304 15.33 -1.72
ST02 2,053 2,034 1,943 2,126 2,137 2,196 2.76 1.36
ST03 1,531 1,606 1,557 2,035 2,129 2,064 -3.05 6.16
ST04 3,365 3,614 3,761 4,089 4,102 4,527 10.36 6.11
ST05 2,011 2,085 2,102 2,316 2,399 2,570 7.13 5.03
ST06 2,454 2,533 2,327 2,386 2,319 2,416 4.18 -0.31
ST07 4,167 4,111 4,034 4,245 4,186 4,442 6.12 1.29
ST08 5,965 5,832 4,351 4,851 4,670 5,042 7.97 -3.31
ST09 2,174 2,088 2,260 2,314 2,251 2,656 17.99 4.09
ST10 2,630 2,590 2,727 3,041 3,070 3,351 9.15 4.96
ST11 2,868 2,896 2,747 3,088 3,152 3,356 6.47 3.19
ST12 936 992 985 997 966 1,156 19.67 4.31
ST13 1,523 1,518 1,576 1,608 1,671 1,723 3.11 2.50
ST14 1,187 1,238 1,246 1,366 1,202 1,287 7.07 1.63
ST15 908 814 810 796 799 851 6.51 -1.29
ST16 389 399 386 507 488 578 18.44 8.24
ST17 2,263 2,281 2,436 2,708 2,609 2,900 11.15 5.09
ST18 600 594 594 660 605 588 -2.81 -0.40
ST19 1,867 1,863 1,967 2,053 2,049 2,147 4.78 2.83
ST20 1,377 1,336 1,374 1,531 1,308 1,548 18.35 2.37
P081 N/A 224 3,123 3,163 3,387 3,374 -0.38 N/A
Unspecified 143 111 74 46 46 62 N/A N/A
Other 0 0 0 0 0 0 N/A N/A
Total 45,104 45,103 45,859 49,883 49,277 53,138 7.84 3.33
Fire, Medical, and HazMat Incidents by Time of Day
0
1
2
3
4
5
6
7
8
9
0 1 2 3 4 5 6 7 8 9 10 11 12 13 14 15 16 17 18 19 20 21 22 23
Perc
en
t o
f In
cid
en
ts
Hour
Fire, Medical, HazMat Incidents by Time of Day 5-Year Average
Fires
Medical
Colorado Springs Fire Department – Standards of Cover 2012 Page 37
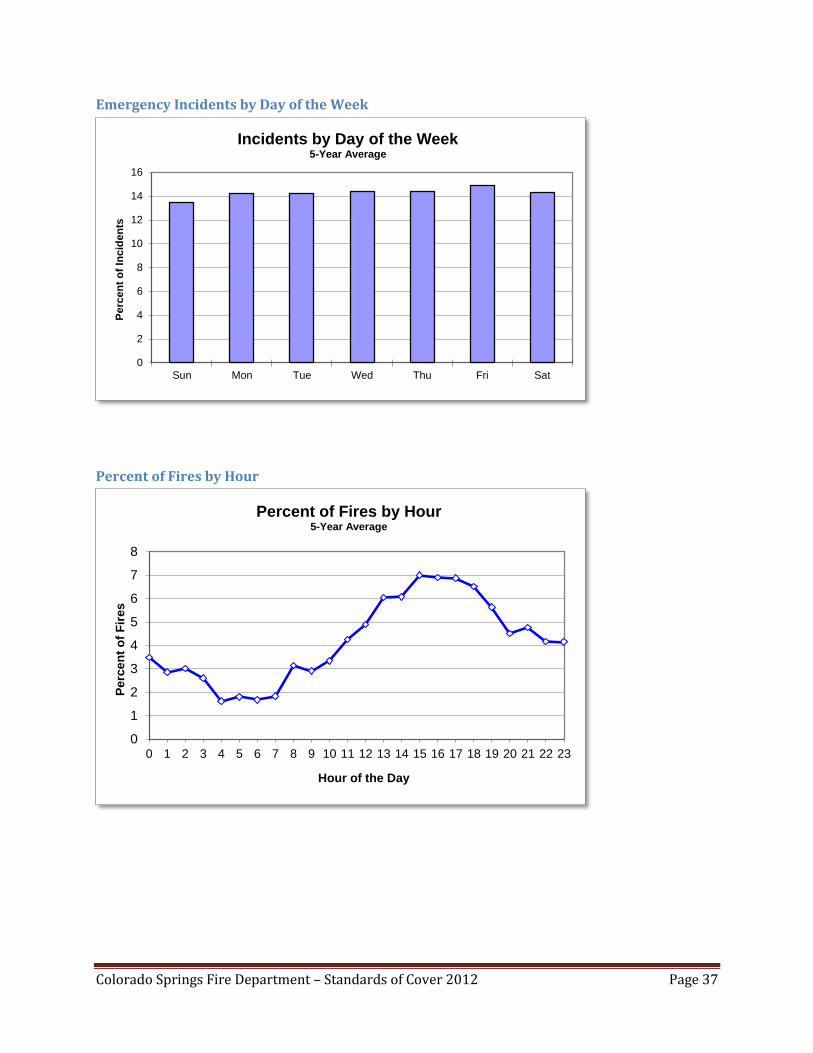
Emergency Incidents by Day of the Week
Percent of Fires by Hour
0
2
4
6
8
10
12
14
16
Sun Mon Tue Wed Thu Fri Sat
Perc
en
t o
f In
cid
en
ts
Incidents by Day of the Week 5-Year Average
0
1
2
3
4
5
6
7
8
0 1 2 3 4 5 6 7 8 9 10 11 12 13 14 15 16 17 18 19 20 21 22 23
Pe
rce
nt
of
Fir
es
Hour of the Day
Percent of Fires by Hour 5-Year Average

Colorado Springs Fire Department – Standards of Cover 2012 Page 38
Risk Classifications
The CSFD currently defines different hazard classifications for structure fire response. Fire
incidents are categorized into the following hazard classifications: Typical, Life/Conflagration,
Industrial, Hazardous Materials (Hazmat), and High Rise. These hazard classifications are
assigned based on the construction of the structure and the occupancy type.
Typical Hazards include occupancies with low population and relatively low monetary value.
Occupancies in the Typical Hazard classifications include, but are not limited to, single family
dwellings, multiple residence properties with six or fewer units, modern public schools,
restaurants, and strip malls.
Life/Conflagration Hazards include any occupancy which has the potential to exceed control of
an initial two engine and one truck structure fire response. These occupancies have a high
population of residents, visitors, or employees, or are structures that are configured in such a
way that rapid fire spread to exposed property can be anticipated. Examples of this hazard
classification include, but are not limited to, multiple residence properties with seven or greater
units, low-rise hospitals, shopping malls, auditoriums, low-rise retirement centers, and lumber
yards.
Occupancies in the industrial hazard classification include occupancies which manufacture
products, store large quantities of compressed or liquid fuel, and/or generate energy. These
occupancies include, but are not limited to, electronics manufacturing, power plants, tool
manufacturing, liquid fuel storage areas, and liquefied petroleum gas distribution locations.
Hazmat classified occupancies include occupancies which, under fire conditions, may result in
the release of hazardous materials. Occupancies in the hazmat hazard classification include,
but are not limited to, service stations, chemical storage facilities, and metal plating operations.
Colorado Springs Fire Department – Standards of Cover 2012 Page 39
High Rise classified occupancies include occupancies which are seventy-five feet or taller, or are
four or more stories in height. Occupancies in the high-rise hazard classification include, but
are not limited to, high-rise hospitals, nursing homes or retirement centers, large hotels,
aprtments, condominiums, and office buildings.
All of these definitions have been codified in policy 100.19 Occupancy Hazard Classification in
the Department’s Tactical Operations Manual. The response model for each hazard type is
listed in policy 300.01 Structure Fire Response in the Department’s Tactical Operations Manual.
Fire Risk Evaluation
A representative structure was identified in each PEZ and evaluated for fire flow and resources
required. These structures were chosen not because they are typical of each PEZ, but because
they represent the “worst-case” scenario. This could be because of their size, contents, or
potential for loss of life. Fire flow requirements and fire hydrant distribution for any new
structures are established using the 2009 International Fire Code (IFC). The appropriate
responding resources are then identified and stated in the run cards. The City of Colorado
Springs has an excellent water supply and the need for additional water is minimal. Actual fire
flow reports for these representative structures are retained in the Division of the Fire Marshal.
PEZ Building Address Size Construction
Type Fire Flow
Hydrants #
Engines
1 Memorial Hospital Womens/Children Wing
1400 E. Boulder St. 293,844 I-FR (I-A) 5750 6 4
2 Rudy’s Texas BBQ 315 S. 31st
St. 7,294 V-B 1500 1 1
3 Hewlett Packard Data Center
311 Rockrimmon Blvd.
251,206 II-B 4000 4 3
4 Sportsmans Warehouse 555 Chelton Rd. 61,305 III-B 2750 3 2
5 Value Place Hotel 555 Airport Creek Pt.
42,984 V-A 2750 3 2
6 Broadmoor Event Center 1 Lake Ave. 461,951 I-FR 6000 6 4
7 Progressive Data Center 650 Sybilla Ln. 118,681 II-1 HR 5000 5 4
8 Lowe’s 701 N. Academy Blvd.
150,184 II-B 4000 4 3
9 Ace Hardware Distribution Center
5520 Astrozon Blvd. 725,000 II-N 4000 4 3

Colorado Springs Fire Department – Standards of Cover 2012 Page 40
Critical Task Analysis
Success at the scene of any emergency is measured by what occurs after the fire department
arrives. The success of a fire attack in a single-family residence is dependent upon deliberate,
coordinated and well-planned placement of resources. A successful outcome includes: the fire
does not extend, there are no civilian injuries, there are no firefighter injuries, smoke, heat and
water damage are kept to a minimum, the cause is determined and the scene is deemed to be
safe/stable prior to the fire department leaving.
Life safety is the top priority during initial fire emergency operations, in which first arriving units
must structure initial operations for search and rescue. The Department’s goal is to prevent fire
from reaching the flashover stage by extinguishing or controlling the fire before that stage.
After life safety has been considered, the remaining priorities in order of importance include
exposure protection, control and containment, ventilation, control, extinguishment, salvage
(property conservation), overhaul, and investigation.

Colorado Springs Fire Department – Standards of Cover 2012 Page 41
Company Basic/Minimum Tasks Minimum # of
Personnel Required
Single Family Residential Structure Fire – Non-Target Hazard
1st Engine Establish command, size up 1
Pump operator 1
Attack hoseline 2
2nd Engine Back-up hoseline 2
Interim Rapid Intervention Crew (IRIC) 2
Truck Forcible entry, ventilation 2
Primary search 2
District Chief Receive command, incident safety officer 1
TOTAL 13
Structure Fire – Life/Conflagration Target Hazard
1st Engine Establish command, size up 1
Pump operator 1
Attack hoseline 2
2nd Engine Secondary hoseline 2
Interim Rapid Intervention Crew (IRIC) 2
3rd Engine Support first two engines 4
1st Truck Forcible entry, ventilation 2
Life rescue 2
2nd Truck Forcible entry, ventilation 2
Life rescue 2
District Chief Assume command 1
TOTAL 21
Structure Fire – Industrial Target Hazard
1st Engine Establish command, size up 1
Fire Attack Group 1; recon, hoseline, standpipe
operations
3
2nd Engine Fire panel 1
Water supply FDC 1
Fire Attack Group 1; recon, hoseline, standpipe
operations
2
3rd Engine Fire Attack Group 2; recon, hoseline, standpipe
operations
3
Fire Attack Group 2 Supervisor 1
1st Truck Fire Attack Group 1; recon, search & rescue 2
Fire Attack Group 1; forcible entry & ventilation 2
2nd Truck Fire Attack Group 2; recon, search & rescue 2
Fire Attack Group 2; forcible entry & ventilation 2
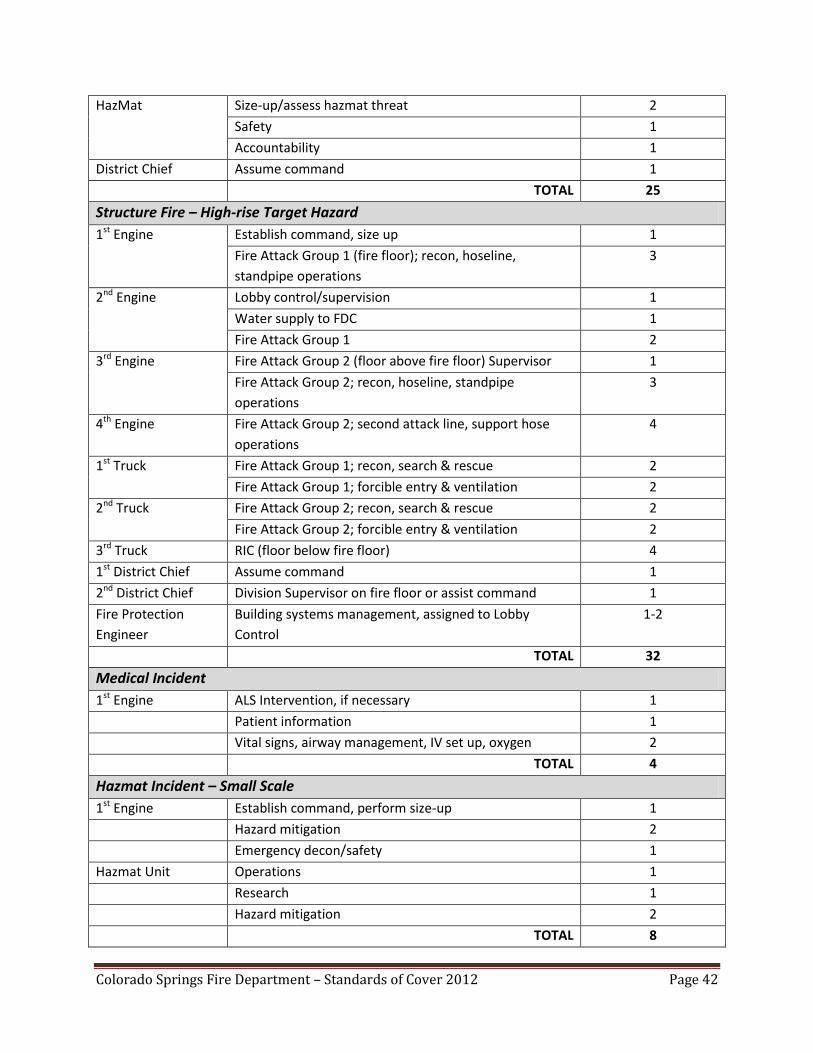
Colorado Springs Fire Department – Standards of Cover 2012 Page 42
HazMat Size-up/assess hazmat threat 2
Safety 1
Accountability 1
District Chief Assume command 1
TOTAL 25
Structure Fire – High-rise Target Hazard
1st Engine Establish command, size up 1
Fire Attack Group 1 (fire floor); recon, hoseline,
standpipe operations
3
2nd Engine Lobby control/supervision 1
Water supply to FDC 1
Fire Attack Group 1 2
3rd Engine Fire Attack Group 2 (floor above fire floor) Supervisor 1
Fire Attack Group 2; recon, hoseline, standpipe
operations
3
4th Engine Fire Attack Group 2; second attack line, support hose
operations
4
1st Truck Fire Attack Group 1; recon, search & rescue 2
Fire Attack Group 1; forcible entry & ventilation 2
2nd Truck Fire Attack Group 2; recon, search & rescue 2
Fire Attack Group 2; forcible entry & ventilation 2
3rd Truck RIC (floor below fire floor) 4
1st District Chief Assume command 1
2nd District Chief Division Supervisor on fire floor or assist command 1
Fire Protection
Engineer
Building systems management, assigned to Lobby
Control
1-2
TOTAL 32
Medical Incident
1st Engine ALS Intervention, if necessary 1
Patient information 1
Vital signs, airway management, IV set up, oxygen 2
TOTAL 4
Hazmat Incident – Small Scale
1st Engine Establish command, perform size-up 1
Hazard mitigation 2
Emergency decon/safety 1
Hazmat Unit Operations 1
Research 1
Hazard mitigation 2
TOTAL 8

Colorado Springs Fire Department – Standards of Cover 2012 Page 43
Hazmat Incident – Large Scale
1st Engine Establish command, perform size-up 1
Hazard mitigation/rescue 2
Emergency decon/safety 1
2nd Engine Interim Rapid Intervention Crew (IRIC) team 4
Hazmat Unit Operations 1
Entry team – hazard mitigation 2
Research 1
Decon Unit Technical decon 3
Medical monitoring 1
Hazmat Engine 6 Rapid Intervention Crew (RIC) team 2
Safety officer 1
Accountability 1
Squad 108 Rehab 2
District Chief Assume command 1
TOTAL 23
Wildland Fire Incident – LOW fire danger, Urban Level 3
1st Engine Size up, identify anchor point, safety zone, escape route 1
Pump operator 1
Attack hoseline or hand tools 2
TOTAL 4
Wildland Fire Incident – EXTREME fire danger, Wildland Urban Interface Level 1
1st Engine
1st Brush Truck
Establish command, size up; identify anchor point, LCES 1
Pump operator, establish water supply 1
Attack hot flank 2
2nd Engine
2nd Brush Truck
Pump operator, establish water supply 1
Attack cold flank, identify LCES 3
3rd Engine
3rd Brush Truck
Identify structure protection or fire attack, identify LCES 4
4th Engine
4th Brush Truck
Assist with structure protection or fire attack, identify
LCES
4
1st Wildland Engine Division Supervisor or Task Force Leader 1
Assist with fire attack or structure protection, identify
LCES
3
2nd Wildland Engine Division Supervisor or Task Force Leader 1
Assist with fire attack or structure protection, identify
LCES
3
1st District Chief Assume command 1
2nd District Chief Division Supervisor 1
TOTAL 26
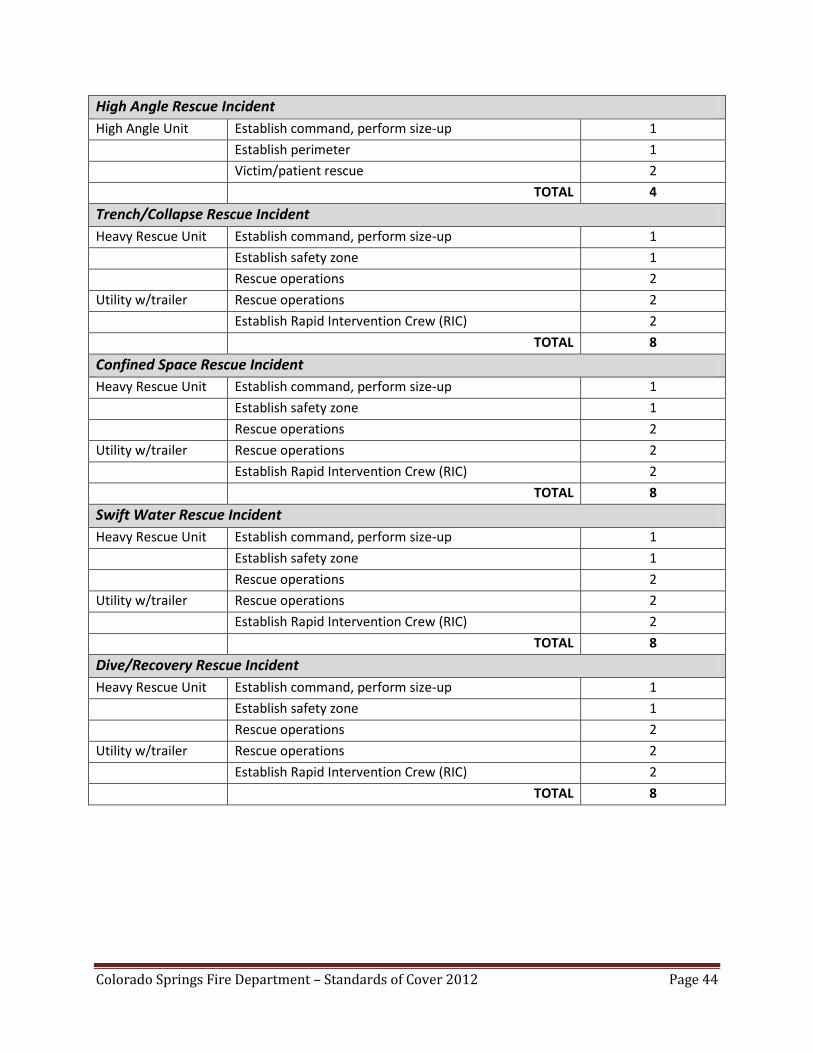
Colorado Springs Fire Department – Standards of Cover 2012 Page 44
High Angle Rescue Incident
High Angle Unit Establish command, perform size-up 1
Establish perimeter 1
Victim/patient rescue 2
TOTAL 4
Trench/Collapse Rescue Incident
Heavy Rescue Unit Establish command, perform size-up 1
Establish safety zone 1
Rescue operations 2
Utility w/trailer Rescue operations 2
Establish Rapid Intervention Crew (RIC) 2
TOTAL 8
Confined Space Rescue Incident
Heavy Rescue Unit Establish command, perform size-up 1
Establish safety zone 1
Rescue operations 2
Utility w/trailer Rescue operations 2
Establish Rapid Intervention Crew (RIC) 2
TOTAL 8
Swift Water Rescue Incident
Heavy Rescue Unit Establish command, perform size-up 1
Establish safety zone 1
Rescue operations 2
Utility w/trailer Rescue operations 2
Establish Rapid Intervention Crew (RIC) 2
TOTAL 8
Dive/Recovery Rescue Incident
Heavy Rescue Unit Establish command, perform size-up 1
Establish safety zone 1
Rescue operations 2
Utility w/trailer Rescue operations 2
Establish Rapid Intervention Crew (RIC) 2
TOTAL 8
Colorado Springs Fire Department – Standards of Cover 2012 Page 45
Section 5 – Historical Perspective and System Performance
The Colorado Springs Fire Department (CSFD) has maintained historical emergency response
performance statistics since 1993. A wide range of metrics are published in an annual abstract
document and includes call types, turnout, travel and response times, incidents by month, day,
and time of day, cardiac arrests and fire service costs. The measurement of system
performance includes such factors as distribution of resources, concentration of resources and
the reliability of resources.
Distribution
The CSFD strives for an equitable level of service to everyone in the community, regardless of
the emergency. This is accomplished by distributing its resources proportionately to the
population and by historical trends in calls for service. This results in providing the same service
to every area of the city. There are specialized resources that are not practical to have in every
fire station, and these are placed according to historical and/or potential needs. One example
is the Department’s wildland resources, which are placed in stations in the wildland urban
interface (WUI), where they are more likely to be needed.
The Department staffs 20 fire stations with 115 personnel on duty each day. Staffing is spread
amongst 20 engine companies, six truck companies, two medical squads, one heavy rescue
vehicle, and three battalion chiefs.
The newest station, Fire Station 21, is currently under construction in the northeast portion of
the city. Fire Station 22, in the north end of the city, is anticipated to also begin construction in
2012. These two stations will provide service delivery to areas that have historically lower
response times due to the distance from their first due stations.

Colorado Springs Fire Department – Standards of Cover 2012 Page 46
Station District Physical Characteristics
The physical characteristics of each first due response area widely varies. The smallest district,
Station 3, is 2.66 square miles and is mostly residential with the smallest population. The
largest district, Station 17, is 46.97 square miles. This district is heavily populated with a
mixture of both residential and commercial occupancies, while also having a large area of open
space that is characteristic of the east side of the city.
Population (2010) Square miles Road miles
Station 1 10270 4.18 73.60
Station 2 16647 4.59 74.37
Station 3 6553 2.66 42.4
Station 4 23304 7.28 101.75
Station 5 15092 11.45 103.42
Station 6 19946 5.92 98.55
Station 7 28854 9.14 124.71
Station 8 39241 7.39 114.35
Station 9 15149 8.70 81.10
Station 10 28907 6.80 93.82
Station 11 31095 23.26 130.47
Station 12 10862 6.21 59.35
Station 13 12466 9.07 89.90
Station 14 14454 4.81 71.32
Station 15 24421 12.30 118.89
Station 16 6982 6.35 46.81
Station 17 69087 46.97 287.06
Station 18 14643 6.38 68.23
Station 19 25911 16.08 136.57
Station 20 26524 5.48 97.80

Colorado Springs Fire Department – Standards of Cover 2012 Page 47
System-wide performance
The CSFD performance objective for first unit turnout time is 90 seconds. According to the
table below using 2011 data, this objective was met 80% of the time. The performance
objective for first unit arrival on scene is eight minutes for 90% of all calls. According to the
table, this objective was met.
PERFORMANCE INDICATORS 90% 80% 70% 60% 50%
Call processing 01:33 01:12 01:00 00:52 00:45
First unit turnout 01:39 01:27 01:19 01:12 01:05
First unit travel 06:30 05:17 04:33 04:01 03:34
First engine dispatch to on-scene 07:41 06:27 05:43 05:09 04:29
Second engine dispatch to on-scene 11:23 09:15 07:57 07:18 06:29
Third engine dispatch to on-scene 20:47 14:30 11:35 09:37 07:54
First truck dispatch to on-scene 08:45 07:17 06:24 05:39 04:49
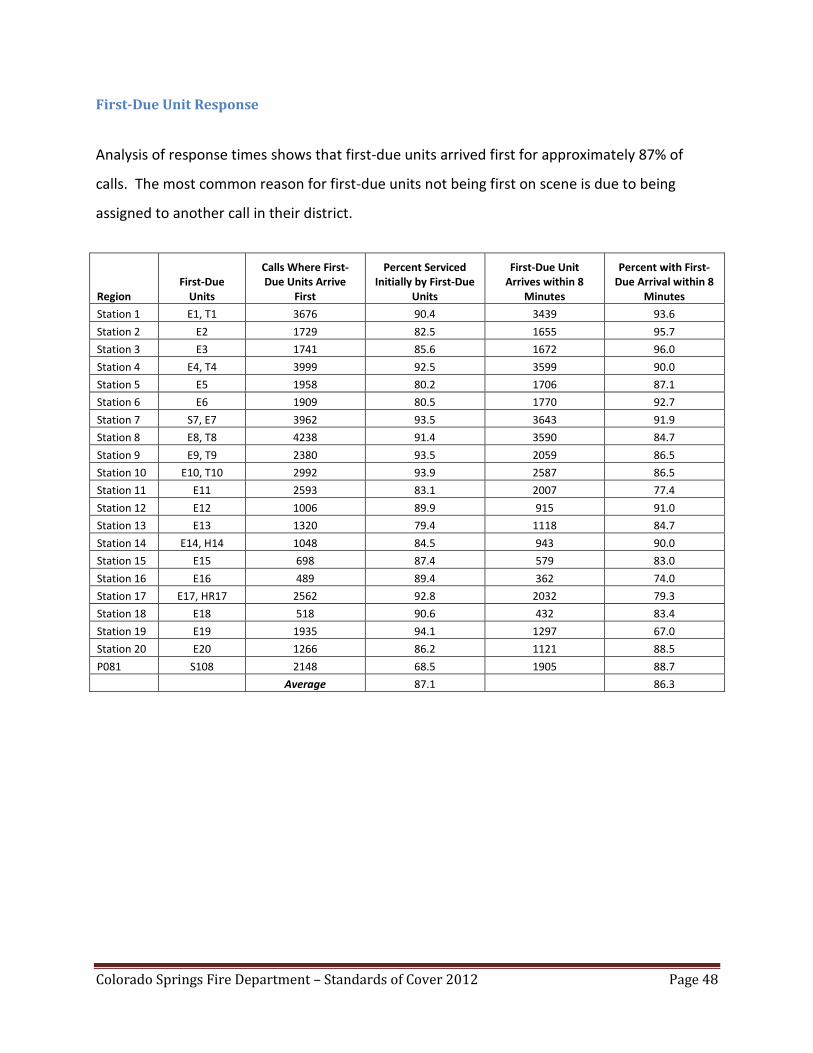
Colorado Springs Fire Department – Standards of Cover 2012 Page 48
First-Due Unit Response
Analysis of response times shows that first-due units arrived first for approximately 87% of
calls. The most common reason for first-due units not being first on scene is due to being
assigned to another call in their district.
Region First-Due
Units
Calls Where First-Due Units Arrive
First
Percent Serviced Initially by First-Due
Units
First-Due Unit Arrives within 8
Minutes
Percent with First-Due Arrival within 8
Minutes
Station 1 E1, T1 3676 90.4 3439 93.6
Station 2 E2 1729 82.5 1655 95.7
Station 3 E3 1741 85.6 1672 96.0
Station 4 E4, T4 3999 92.5 3599 90.0
Station 5 E5 1958 80.2 1706 87.1
Station 6 E6 1909 80.5 1770 92.7
Station 7 S7, E7 3962 93.5 3643 91.9
Station 8 E8, T8 4238 91.4 3590 84.7
Station 9 E9, T9 2380 93.5 2059 86.5
Station 10 E10, T10 2992 93.9 2587 86.5
Station 11 E11 2593 83.1 2007 77.4
Station 12 E12 1006 89.9 915 91.0
Station 13 E13 1320 79.4 1118 84.7
Station 14 E14, H14 1048 84.5 943 90.0
Station 15 E15 698 87.4 579 83.0
Station 16 E16 489 89.4 362 74.0
Station 17 E17, HR17 2562 92.8 2032 79.3
Station 18 E18 518 90.6 432 83.4
Station 19 E19 1935 94.1 1297 67.0
Station 20 E20 1266 86.2 1121 88.5
P081 S108 2148 68.5 1905 88.7
Average 87.1
86.3

Colorado Springs Fire Department – Standards of Cover 2012 Page 49
Concentration
Concentration is having enough of the right equipment and staffing arriving in a timeframe to
stop the progress of the emergency. The placement of fire stations is based on covering every
area of the city in a consistent manner. While stations are located rather uniformly across the
geographic area, several have a higher call load than others. By reviewing the percentage of
total calls handled by each station and planning evaluation zone in the tables below, the areas
of increased risk can be more readily identified.
Percentage of calls by station
# of calls 2011 % of total calls
Station 1 4304 8.1%
Station 2 2196 4.1%
Station 3 2064 3.9%
Station 4 4527 8.5%
Station 5 2570 4.8%
Station 6 2416 4.5%
Station 7 4442 8.4%
Station 8 5042 9.5%
Station 9 2656 5.0%
Station 10 3351 6.3%
Station 11 3356 6.3%
Station 12 1156 2.2%
Station 13 1723 3.2%
Station 14 1287 2.4%
Station 15 851 1.6%
Station 16 578 1.1%
Station 17 2900 5.5%
Station 18 588 1.1%
Station 19 2147 4.0%
Station 20 1548 2.9%
P081 (Squad 108) 3374 6.3%
Unspecified 62 0.1%
TOTAL 53138 100%

Colorado Springs Fire Department – Standards of Cover 2012 Page 50
Percentage of calls by PEZ
# of calls 2011 % of total calls
PEZ 1 7346 13.8%
PEZ 2 4969 9.4%
PEZ 3 3195 6.0%
PEZ 4 6205 11.7%
PEZ 5 10914 20.5%
PEZ 6 6489 12.2%
PEZ 7 7412 13.9%
PEZ 8 4156 7.8%
PEZ 9 2332 4.4%
N/A 120 0.2%
TOTAL 53138 100%
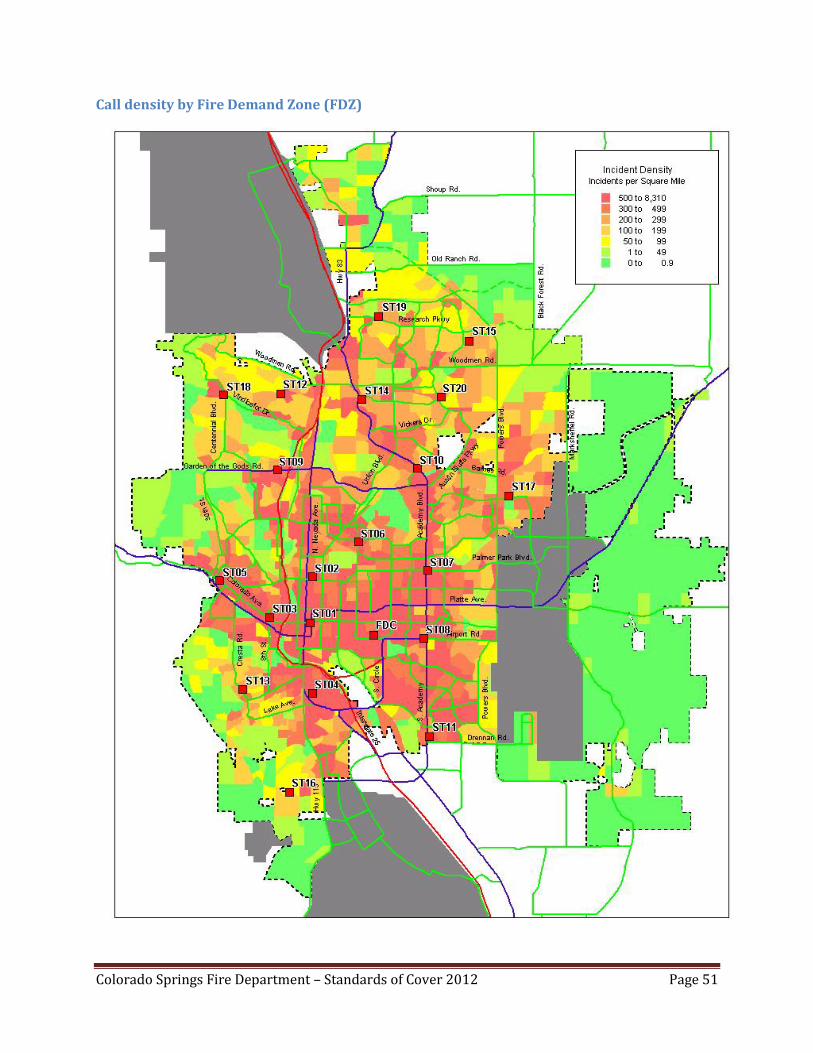
Colorado Springs Fire Department – Standards of Cover 2012 Page 51
Call density by Fire Demand Zone (FDZ)

Colorado Springs Fire Department – Standards of Cover 2012 Page 52
Reliability
Reliability is the availability and capability of resources to respond to emergency incidents. A
reliability study analyzes the the Department’s ability to meet performance expectations even if
resources are committed on an existing call, as well as how often a resource did not handle a
call in its first due area.
First-Due Analysis
The following table contains the proportion of calls for service by first-due area serviced by
units assigned to the associated fire station (posting location) and the proportion serviced by
units from other fire stations. The table also provides the proportion of incidents in each of
these categories with initial response times within 8 minutes, i.e. the proportion meeting the
Department’s first company response objective.
From First-due Station From Other Station Total
First-due Incidents Covers 8
Coverage (%) Incidents Covers 8
Coverage (%) Incidents Covers 8
Coverage (%)
P081 1063 1000 94.1 629 542 86.2 1692 1542 91.1
ST01 2185 2114 96.8 193 174 90.2 2378 2288 96.2
ST02 1437 1406 97.8 252 224 88.9 1689 1630 96.5
ST03 1105 1081 97.8 188 168 89.4 1293 1249 96.6
ST04 2809 2671 95.1 186 115 61.8 2995 2786 93.0
ST05 1422 1294 91.0 282 200 70.9 1704 1494 87.7
ST06 1275 1222 95.8 302 259 85.8 1577 1481 93.9
ST07 2585 2473 95.7 158 110 69.6 2743 2583 94.2
ST08 2503 2270 90.7 234 180 76.9 2737 2450 89.5
ST09 1790 1630 91.1 86 62 72.1 1876 1692 90.2
ST10 2021 1878 92.9 140 100 71.4 2161 1978 91.5
ST11 1465 1220 83.3 304 173 56.9 1769 1393 78.7
ST12 793 738 93.1 68 42 61.8 861 780 90.6
ST13 1024 914 89.3 190 129 67.9 1214 1043 85.9
ST14 770 726 94.3 148 104 70.3 918 830 90.4
ST15 533 459 86.1 63 44 69.8 596 503 84.4
ST16 316 251 79.4 41 21 51.2 357 272 76.2
ST17 2047 1732 84.6 145 81 55.9 2192 1813 82.7
ST18 301 253 84.1 34 22 64.7 335 275 82.1
ST19 1451 1070 73.7 76 44 57.9 1527 1114 73.0
ST20 985 892 90.6 139 109 78.4 1124 1001 89.1
Citywide 29880 27294 91.3 3858 2903 75.2 33738 30197 89.5
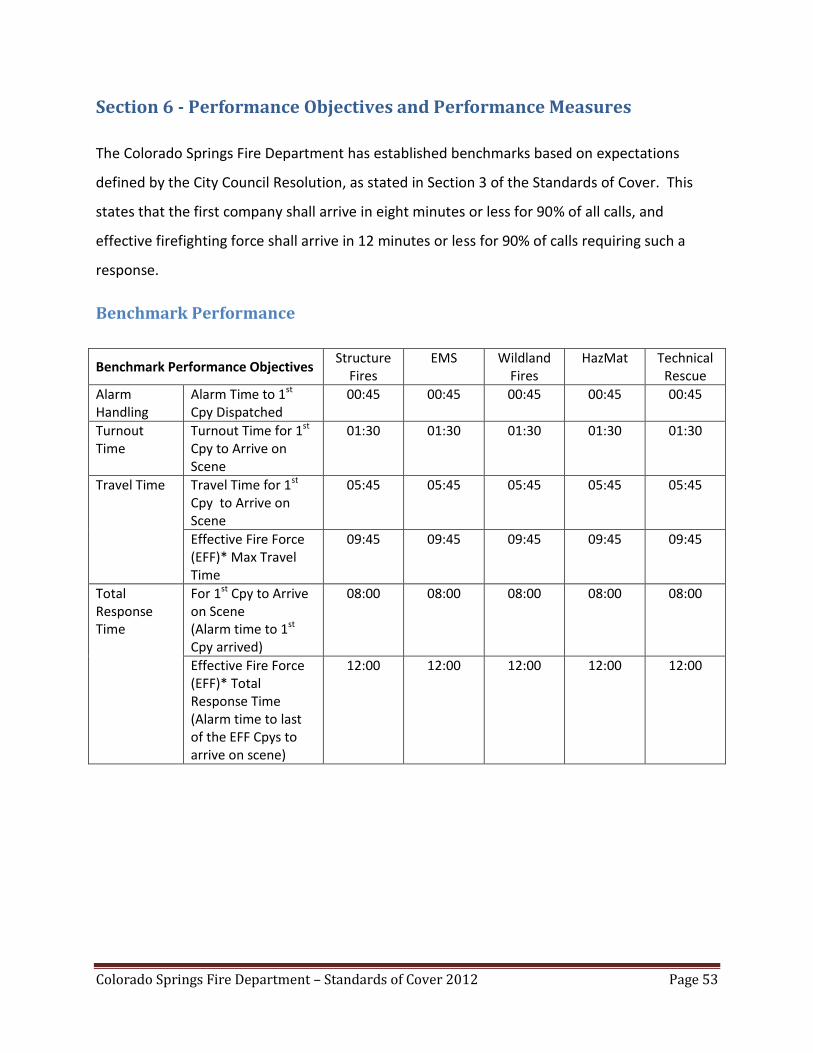
Colorado Springs Fire Department – Standards of Cover 2012 Page 53
Section 6 - Performance Objectives and Performance Measures
The Colorado Springs Fire Department has established benchmarks based on expectations
defined by the City Council Resolution, as stated in Section 3 of the Standards of Cover. This
states that the first company shall arrive in eight minutes or less for 90% of all calls, and
effective firefighting force shall arrive in 12 minutes or less for 90% of calls requiring such a
response.
Benchmark Performance
Benchmark Performance Objectives Structure
Fires EMS Wildland
Fires HazMat Technical
Rescue
Alarm Handling
Alarm Time to 1st Cpy Dispatched
00:45 00:45 00:45 00:45 00:45
Turnout Time
Turnout Time for 1st Cpy to Arrive on Scene
01:30 01:30 01:30 01:30 01:30
Travel Time Travel Time for 1st Cpy to Arrive on Scene
05:45 05:45 05:45 05:45 05:45
Effective Fire Force (EFF)* Max Travel Time
09:45 09:45 09:45 09:45 09:45
Total Response Time
For 1st Cpy to Arrive on Scene (Alarm time to 1st Cpy arrived)
08:00 08:00 08:00 08:00 08:00
Effective Fire Force (EFF)* Total Response Time (Alarm time to last of the EFF Cpys to arrive on scene)
12:00 12:00 12:00 12:00 12:00
Colorado Springs Fire Department – Standards of Cover 2012 Page 54
Baseline Performance
Structure Fires
The Department’s baseline statements reflect actual performance from 2009 through 2011.
The Department does not rely on the use of automatic aid or mutual aid from neighboring fire
districts to provide its effective response force complement of personnel. Actual baseline
service level performance is as follows:
For 90 percent of all structure fires, the total response time for the arrival of the first-
due unit, staffed with a minimum of 4 firefighters, is 08:04. The first-due unit shall be
staffed with a minimum of 4 firefighters and shall be capable of establishing command,
sizing up the incident, utilizing safe operational procedures outlined in the SOPs,
developing an initial incident action plan, extending appropriate hose line, and
beginning initial fire attack or rescue. These operations are done in accordance with
Department standard operating procedures while providing for the safety of the general
public and responders.
For 90 percent of all structure fires, the total response time for the arrival of the
effective fire force (EFF), staffed with 13 firefighters is 13:12. The EFF is capable of
establishing command, providing an uninterrupted water supply, advancing an attack
line and a backup line for fire control, two in-two out, completing forcible entry,
searching and rescuing at-risk victims, ventilating the structure, controlling utilities,
performing salvage and overhaul, and placing elevated streams into service from aerial
ladders. These operations are done in accordance with departmental standard
operating procedures while providing for the safety of the general public and
responders.

Colorado Springs Fire Department – Standards of Cover 2012 Page 55
Structure Fires – 90th Percentile Times
2009 – 2011 (mins:secs)
2011 (mins: secs)
2010 (mins: secs)
2009 (mins: secs)
Alarm Handling Alarm Time to 1st Cpy Dispatched
1:42 1:45 1:41 1:41
Turnout Time Turnout Time for 1st Cpy to Arrive on Scene
1:46 1:49 1:48 1:39
Travel Time Travel Time for 1st Cpy to Arrive on Scene
5:21 5:10 5:22 5:27
Effective Fire Force (EFF)* Max Travel Time
10:06 10:14 9:59 9:42
Total Response Time
For 1st Cpy to Arrive on Scene (Alarm time to 1st Cpy arrived)
8:04 7:59 8:04 8:06
Effective Fire Force (EFF)* Total Response Time (Alarm time to last of the EFF Cpys to arrive on scene)
13:12 13:32 13:11 12:48
*Effective Fire Force (EFF): A minimum of 2 engines and 1 truck company must arrive on scene. EFF calculations are based on the first 2 engines and truck companies to arrive on scene.
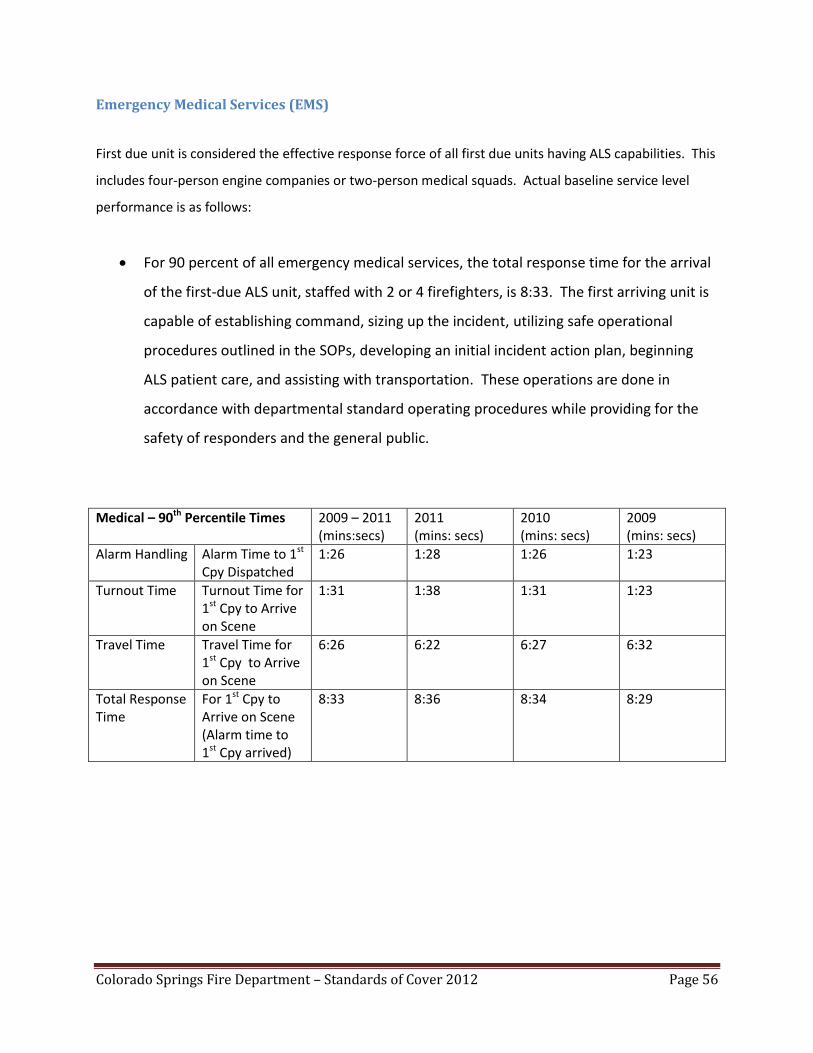
Colorado Springs Fire Department – Standards of Cover 2012 Page 56
Emergency Medical Services (EMS)
First due unit is considered the effective response force of all first due units having ALS capabilities. This
includes four-person engine companies or two-person medical squads. Actual baseline service level
performance is as follows:
For 90 percent of all emergency medical services, the total response time for the arrival
of the first-due ALS unit, staffed with 2 or 4 firefighters, is 8:33. The first arriving unit is
capable of establishing command, sizing up the incident, utilizing safe operational
procedures outlined in the SOPs, developing an initial incident action plan, beginning
ALS patient care, and assisting with transportation. These operations are done in
accordance with departmental standard operating procedures while providing for the
safety of responders and the general public.
Medical – 90th Percentile Times 2009 – 2011 (mins:secs)
2011 (mins: secs)
2010 (mins: secs)
2009 (mins: secs)
Alarm Handling Alarm Time to 1st Cpy Dispatched
1:26 1:28 1:26 1:23
Turnout Time Turnout Time for 1st Cpy to Arrive on Scene
1:31 1:38 1:31 1:23
Travel Time Travel Time for 1st Cpy to Arrive on Scene
6:26 6:22 6:27 6:32
Total Response Time
For 1st Cpy to Arrive on Scene (Alarm time to 1st Cpy arrived)
8:33 8:36 8:34 8:29
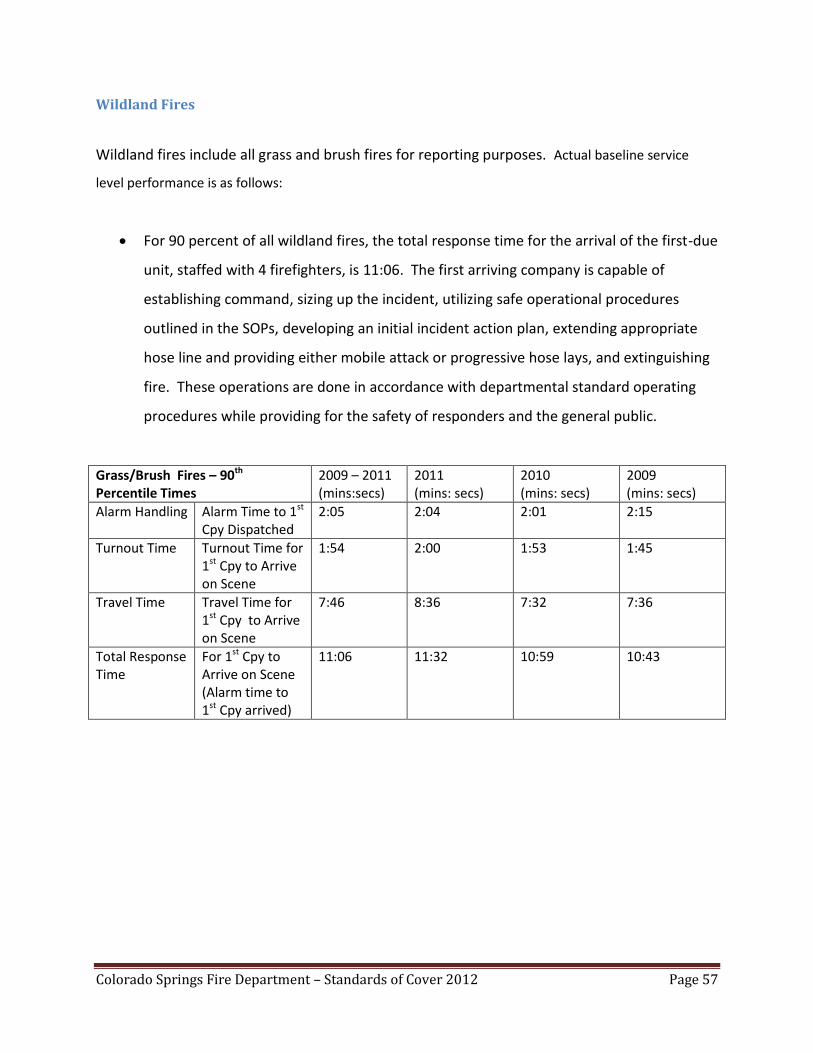
Colorado Springs Fire Department – Standards of Cover 2012 Page 57
Wildland Fires
Wildland fires include all grass and brush fires for reporting purposes. Actual baseline service
level performance is as follows:
For 90 percent of all wildland fires, the total response time for the arrival of the first-due
unit, staffed with 4 firefighters, is 11:06. The first arriving company is capable of
establishing command, sizing up the incident, utilizing safe operational procedures
outlined in the SOPs, developing an initial incident action plan, extending appropriate
hose line and providing either mobile attack or progressive hose lays, and extinguishing
fire. These operations are done in accordance with departmental standard operating
procedures while providing for the safety of responders and the general public.
Grass/Brush Fires – 90th Percentile Times
2009 – 2011 (mins:secs)
2011 (mins: secs)
2010 (mins: secs)
2009 (mins: secs)
Alarm Handling Alarm Time to 1st Cpy Dispatched
2:05 2:04 2:01 2:15
Turnout Time Turnout Time for 1st Cpy to Arrive on Scene
1:54 2:00 1:53 1:45
Travel Time Travel Time for 1st Cpy to Arrive on Scene
7:46 8:36 7:32 7:36
Total Response Time
For 1st Cpy to Arrive on Scene (Alarm time to 1st Cpy arrived)
11:06 11:32 10:59 10:43

Colorado Springs Fire Department – Standards of Cover 2012 Page 58
Hazmat
The Hazardous Materials Response Team (HMRT) cross-staffs an engine and the hazmat vehicle.
Actual baseline service level performance is as follows:
For 90 percent of all hazardous materials, the total response time for the arrival of the first-
due unit, staffed with 4 firefighters, is 10:47. The first arriving unit is capable of establishing
command, sizing up the incident, utilizing safe operational procedures outlined in the SOPs,
developing an initial incident action plan, calling for resources as needed, isolating site, and
denying entry. These operations are done in accordance with departmental standard
operating procedures while providing for the safety of responders and the general public.
Hazmat – 90th Percentile Times 2009 – 2011 (mins:secs)
2011 (mins: secs)
2010 (mins: secs)
2009 (mins: secs)
Alarm Handling Alarm Time to 1st Cpy Dispatched
2:14 2:14 2:13 2:15
Turnout Time Turnout Time for 1st Cpy to Arrive on Scene
1:40 1:50 1:38 1:24
Travel Time Travel Time for 1st Cpy to Arrive on Scene
7:42 8:24 7:27 7:37
Total Response Time
For 1st Cpy to Arrive on Scene (Alarm time to 1st Cpy arrived)
10:47 11:47 10:41 10:21

Colorado Springs Fire Department – Standards of Cover 2012 Page 59
Technical Rescue
All companies are capable of some form of technical rescue; however, only one specialized unit
(Heavy Rescue) is highly trained and capable of all rescues. Baseline performance numbers
include rescues performed by all companies. Actual baseline service level performance is as
follows:
For 90 percent of all technical rescues, the total response time for the arrival of the first-
due unit, staffed with 4 firefighters, is 10:48. The first-due unit is capable of establishing
command, sizing up to determine if a technical rescue response is required, requesting
additional resources, and providing basic life support to any victim without endangering
response personnel. These operations are done in accordance with departmental
standard operating procedures while providing for the safety of responders and the
general public.
Rescues (excludes traffic accidents) – 90th Percentile Times
2009 – 2011 (mins:secs)
2011 (mins: secs)
2010 (mins: secs)
2009 (mins: secs)
Alarm Handling Alarm Time to 1st Cpy Dispatched
2:08 2:21 1:58 2:09
Turnout Time Turnout Time for 1st Cpy to Arrive on Scene
1:28 1:38 1:28 1:16
Travel Time Travel Time for 1st Cpy to Arrive on Scene
8:28 8:43 8:25 8:05
Total Response Time
For 1st Cpy to Arrive on Scene (Alarm time to 1st Cpy arrived)
10:48 12:11 10:49 10:25

Colorado Springs Fire Department – Standards of Cover 2012 Page 60
Section 7 - Compliance Methodology
Compliance methodology requires that performance objectives and measures are evaluated and efforts
are made to reach or maintain the established levels. Maintenance of efforts refers to the resources
and energy put forth to ensure any benefits derived from the Standards of Cover (SOC) process are
maintained. To ensure the Department is meeting current service level objectives, continuous
monitoring of service level baselines must be conducted on a regular basis.
Compliance Model
Compliance is best achieved through a systematic approach. The Department has identified the
following seven-step compliance model:
Step 1 - Update Data
The SOC will be updated with the previous year’s data.
Step 2 - Review Performance Measures
A review of the performance measures will be conducted. Review and validate:
Risk Assessment
Standard of Cover
Services level objectives
Performance objectives and measures
Step 3 - Evaluate Performance
Performance measures are applied to actual service provided:
Activity and performance by unit
Activity and performance by shift
Activity and performance by planning zone
Overall performance by population category (urban/suburban/rural)
Overall performance by incident category
Overall performance by special team
Colorado Springs Fire Department – Standards of Cover 2012 Page 61
Step 4 - Develop Compliance Strategies
Determine issues and opportunities:
Determine what needs to be done to address any gaps
Determine if resources can be/should be reallocated
Seek alternative methods to provide service at desired level
Develop budget estimates as necessary
Step 5 - Communicate Expectations to Organization
Communicate expectations:
Explain method of measuring compliance to personnel who are expected to perform the
services
Provide feedback mechanisms
Train personnel:
Provide appropriate levels of training/direction for all affected personnel
Modify (remediate) response processes, application systems, and technical
infrastructure as necessary to comply
Step 6 - Revalidate Compliance
Review of performance with senior staff and chief officers to ensure revalidation of SOC.
Determine whether independent validation and verification techniques will be used to
measure the performance.
Solicit external assistance as necessary.
Step 7 - Make Adjustments/Repeat Process
Review changes to ensure that service levels have been maintained or improved.
Develop and implement a review program to ensure ongoing compliance:
o Annual review and evaluation
o Five year update of standards to ensure Department is prepared for reaccreditation

Colorado Springs Fire Department – Standards of Cover 2012 Page 62
Section 8 - Overall Evaluation and Recommendations
Evaluation
The Colorado Springs Fire Department (CSFD) is an organization of committed personnel
working with modern and well maintained apparatus and equipment. In addition to structure
fire protection, it offers advanced life support, hazardous materials response, specialized
technical rescue, and wildfire suppression. It has a dedicated support services staff and an
overall positive public image.
The City of Colorado Springs is spread out over a large area that continues to experience growth
in both population and new construction. This stretches the existing resources in an effort to
provide quality services to a continuously growing community. The addition of two new fire
stations in the north and northeast portions of the city will help improve response times to
those areas.
Overall response times have slowly eroded over the past five years as the demand for services
has increased while daily staffing has decreased. The Department will not be able to increase
its workforce or daily staffing due to the city’s current financial position and services will
continue to be provided at the same level unless other funding sources become available.
The Department does not conform to response times defined in NFPA 1710, and does not
expect to with current resources. The existing 8- and 12-minute response time standards, as
defined by City Council resolution, serve as the benchmark.

Colorado Springs Fire Department – Standards of Cover 2012 Page 63
Recommendations
The Department recognizes that opportunities for improvement do exist. The following
recommendations are meant to be improvements to the process of developing the standards of
cover, not necessarily to Department operations. It is expected that improvements to this
process will result in improvements to the overall delivery of services.
1. Develop service level objectives for all major services provided. The Department
currently uses one benchmark which applies to all emergencies. Variations in the types
of emergencies and the corresponding response should translate into different service
level objectives. Benchmarks and baselines should be developed for emergency medical
services, wildland fires, hazmat, and technical rescue. This will help these programs
better define their services and analyze the efficacy of service delivery.
2. Conduct a thorough and organized risk assessment. The Department’s current process
for defining and evaluating risk is average and it is not an organized effort. Target
hazards are identified by stations captains in a subjective and inconsistent manner and
the results are entered into a spreadsheet. The Division of the Fire Marshal (DFM)
identifies additional risks through the plan review and inspection process. The efforts of
both are not combined or compared. The overall process should be more centralized to
create a consistent and objective product, and the process needs to include all aspects
of identifying and evaluating risk.
3. Review and validate critical tasks. Critical tasking is not currently specifically stated in
Department policy; however, the CSFD Tactical Operations Manual (Tac Ops) does
define the roles of firefighters on scene for all emergencies to which the Department
responds. Critical tasks were identified for this current standards of cover document
based on these definitions. Effective critical tasking will demonstrate the reliability of
system performance. The Department needs to validate critical tasking to ensure they
are providing the most effective service delivery.

Colorado Springs Fire Department – Standards of Cover 2012 Page 64
4. Develop and implement a formal annual appraisal process for all programs. The
current method by which the Department evaluates programs is inconsistent. A wide
variety of factors are used to evalute the effectiveness of programs. A formal process
needs to be developed and implemented that will provide a uniform outcome for
planning purposes.
5. Use a consistent method for analyzing data. The Department has three different ways
to evaluate data by geographic areas: planning evaluation zones (PEZ), fire demand
zones (FDZ), and fire station still districts. The annual statistical abstract provides many
different data sets; however, they are not all provided by the same planning area. Some
are given by PEZ, and some are given by fire station still district. Data is not provided, at
least in the statistical abstract, by FDZ. One type of planning area should be identified
and data reported consistently through that method or, if two are deemed necessary,
the same data should be reported through both methods.
6. Conduct a community input process. Soliciting feedback from the community is vital to
understanding the expectations of what services we provide and how we provide them.
A survey of city-wide services was last done in 2007, in which the CSFD received a high
rating in overall performance; however, that was the only question applicable to the
Department. Citizens need to be queried about specific services and expectations and
the results need to be used for planning purposes.
7. Integrate the accreditation process into the standards of cover and strategic planning.
The accreditation process of system-wide self assessment goes hand in hand with the
development of both the standards of cover and the strategic plan. The accreditation
process provides a framework for completing these important documents and each
process should run concurrently, or at a minimum be coordinated, to determine the
most effective method of planning and service delivery.