colorado republican voter opinion survey summary...
TRANSCRIPT

February 14th, 2019 MEMORANDUM TO: INTERESTED PARTIES FR: DAVID FLAHERTY, RYAN WINGER, COURTNEY SIEVERS RE: COLORADO REPUBLICAN VOTER OPINION SURVEY SUMMARY This is a summary of a telephone survey of 622 Republican primary and general election voters in Colorado. The interviews were conducted January 30th and 31st, and February 4th, 2019. The overall results have a margin of error of +/- 3.93% at the 95 percent confidence interval. The survey data were slightly weighted to reflect the voter demographics of Republican voter registration demographics in Colorado. Survey Overview The purpose of this survey was to measure and understand the opinions of Colorado Republican voters who vote in Republican primaries and those who do not. After Republican candidates suffered devastating losses in the 2018 election, we fielded this survey to learn how Republican voters want to move forward. Key Findings:
Ø Currently, a near majority of Republican voters are focused on solving one problem:
immigration. That is the top issue among 48% of Republican primary voters and 40% of non-primary voters. No other issue comes close to registering as such a high priority in this survey. It is quite clear that the government shutdown was a major influence on Republican opinions.
Ø President Trump’s job approval and image rating could not be any stronger among
Colorado Republicans, with 90% approving of the job he is doing and 72% strongly approving. He is giving Republican voters what they want, and they love him for it.
Ø Republicans strongly approve of the job Donald Trump is doing for a number of reasons. First, they believe he is keeping his campaign promises of fighting illegal immigration, improving the economy, creating jobs and not acting like a typical politician. Many respondents express a loyalty toward him because they believe he sincerely cares about all Americans, rich or poor, white or minority, and that he is fighting for them personally.

Colorado Republican Voter Opinion Survey Summary Field Dates: 1/30/19 – 2/4/19, 622n, MoE +/- 3.93%, 50% landline/50% cell phone
Magellan Strategies | 1685 Boxelder St. Suite 300 | Louisville, CO 80027
www.MagellanStrategies.com | (303) 861-8585
2
Ø Eighty-seven percent of respondents think President Trump’s economic program and policies are making the economy better. 88% support building a wall along the border of Mexico and 81% supported his decision to shut down the government in order to get funding for the wall.
Ø Any thought of a primary challenge to Donald Trump at this time would be futile. Among all respondents, 78% want Donald Trump to be the Republican Presidential nominee in 2020 and only 17% prefer “someone else”.
Ø The overwhelming belief regarding why Republican candidates lost in 2018 was because of a migration of liberal and Democratic voters from other states to Colorado.
Ø There are many different opinions regarding what Republicans should do to be more successful in the 2020 election cycle. Many respondents believe the right approach is to educate voters about the economic accomplishments of the Trump administration and stand with the President.
Ø Republican voters overwhelmingly prefer uncompromising, conservative candidates (61%) to moderate candidates who are more willing to work with Democrats to get things done (33%).
Ø Sixty-two percent of Republican voters oppose state funded, full-day kindergarten regardless of the cost, while 34% support it.
Ø Sixty percent of Republicans support the proposed “Red Flag” gun control legislation and 33% oppose it.
Immigration is the Overwhelming Issue or Problem Republicans Want Addressed Prior to being read a list of issues to choose from, respondents were asked which important issue or problem in their community should elected officials be addressing the most. Among both Republican primary and general election voters, the issue of immigration dominated as the top issue that needed to be addressed in their community. Other issues that were mentioned often were the cost of healthcare, homelessness, and marijuana. Some respondents did mention transportation, taxes, jobs and the economy. When read a list of issues, 44% of respondents thought enforcing our immigration laws is the top issue that Governor Polis and the state legislature should be addressing the most. In fact, the issue of immigration dominates as a top priority among every single voter subgroup in the survey. Intensity for this issue is strongest among self-identified Trump Republicans with 63% saying it is their top priority. Immigration is less of a priority among wealthier voters with incomes of $125K or more at 26% but is still the top priority.

Colorado Republican Voter Opinion Survey Summary Field Dates: 1/30/19 – 2/4/19, 622n, MoE +/- 3.93%, 50% landline/50% cell phone
Magellan Strategies | 1685 Boxelder St. Suite 300 | Louisville, CO 80027
www.MagellanStrategies.com | (303) 861-8585
3
“And from the following list of issues, which do you think is the top priority that Governor Polis and the state legislature should be addressing the most?” * Response
All Men Wom Prim Gen
Trad Rep
Trmp Rep
Oth Rep
Sub urbs
Smal Twn.
City
Rur ual
Immigrtn. 44% 48% 41% 48% 40% 42% 63% 30% 39% 50% 48% 44% Gov. Spnd. 11% 13% 10% 10% 12% 12% 9% 13% 13% 11% 9% 11% Transport. 10% 13% 8% 11% 10% 10% 8% 13% 13% 5% 10% 13% Job/Econ. 9% 8% 9% 9% 8% 9% 5% 13% 11% 8% 4% 8% Education 8% 6% 10% 6% 11% 6% 4% 14% 7% 10% 9% 8% Housing 6% 3% 10% 6% 7% 9% 5% 6% 6% 7% 8% 6% Marijuana 6% 4% 8% 8% 4% 8% 4% 3% 6% 6% 5% 5% Healthcare 4% 4% 4% 1% 7% 4% 2% 6% 4% 3% 4% 4% Unsure/Ref. 2% 1% 0% 1% 1% 0% 0% 2% 1% 0% 3% 1%
Voter subgroup margins of error +/-: men 5.5%, women 5.61%, 2018 primary voter 5.6%, non-primary voter 5.6%, traditional Republican 6.5%, Trump Republican 7.3%, Other Republican 7.4%, suburban voter 6.3%, small town voter 7.9%, city voter 9.3%, rural voter 9.4%.
Open-Ended Responses to Top Issue or Problem in Their Community We encourage readers of this document to download the full responses to this question from our website from the blog post for this survey release at http://magellanstrategies.com/blog/. “Being as descriptive as possible, please tell me what you think the most important issue or problem is in your community that our elected officials should be addressing the most.” “The illegal immigrants and homelessness.” – Male, 35-44, suburbs, CD1 “An increase of crime, lack of support for the police, and not enough police. On top of increase in marijuana use and individuals driving under the influence of it.” – Female, 35-44, city area, CD1 “Illegal immigration, sex education, messing with the Constitution.” – Male, 55-64, suburbs, CD1 “I would have to say immigration for one thing. We have to get this thing right because this is ridiculous. Some of the stuff happening with abortion is ridiculous. I do not believe in abortion and some of the stuff I am seeing on TV is absolutely disgusting.” – Female, 65+, suburbs, CD1 “Illegal immigrants falling through the cracks and not being educated properly in the public-school system.” – Female, 35-44, city area, CD2 “Building a wall on the southern border to keep illegal aliens out of my town.” – Male, 65+, small town, CD2

Colorado Republican Voter Opinion Survey Summary Field Dates: 1/30/19 – 2/4/19, 622n, MoE +/- 3.93%, 50% landline/50% cell phone
Magellan Strategies | 1685 Boxelder St. Suite 300 | Louisville, CO 80027
www.MagellanStrategies.com | (303) 861-8585
4
“They’re not working. They’re sitting on their butts doing nothing but arguing. They whole Congress, every official, it’s disgusting. I’m sick of it. Every last one of them needs to be voted out.” – Female, 55-64, rural area, CD2 “Recreational marijuana, and the crap that is developing with crime and everything that goes with it. It’s creating a lot of issues.” – Male, 65+, rural area, CD3 “Drug abuse. Illegal aliens. Worthless politicians.” Male, 55-64, small town, CD3 “I would probably say eliminating drugs in Colorado. They have been legalizing marijuana. They need to get rid of it. The schools have been allowing same sex education to be a part of it, so they need to eliminate it. Legislation is coming through and allowing these things.” – Male, 45-54, small town, CD4 “I think the most important thing is that they realize that there are laws that are national laws, and as Coloradans, we should obey them. This sanctuary city stuff is absolutely ridiculous, and it breaks the law. So, I don’t know where they get off with thinking that they can get away with that. That’s my opinion, and the opinion of a lot of other people. We are Americans and let’s act like it.” – Female, 65+, suburbs, CD4 “Marijuana, crime, not enough policemen to control or help everybody in a timely manner.” – Female, 45-54, city area, CD5 “That would probably be the safety of our neighborhood and roads.” – Male, 35-44, suburbs, CD5 “Nothing in particular here in Colorado Springs. I am just disgusted by Washington DC and their inability to give us protection from the immigrants who are coming up from the south in droves. There are two caravans on their way.” – Female, 65+, city area, CD5 “I would say crime. There are a lot of small break-ins. It is dangerous to walk at night. I am afraid to go outside after dark.” Male, 65+, city, CD5 “There aren’t any low-cost rental properties and there aren’t enough jobs.” – Male, 65+, suburbs, CD5 “It is the whole thing with the teachers. The teachers are not making enough.” – Female, 35-44, suburbs, CD6 “Traffic and increased population, also affordable housing.” – Male, 65+, city area, CD6 “Building the wall so the immigrant problem can be taken care of.” – Female, 65+, suburbs, CD6

Colorado Republican Voter Opinion Survey Summary Field Dates: 1/30/19 – 2/4/19, 622n, MoE +/- 3.93%, 50% landline/50% cell phone
Magellan Strategies | 1685 Boxelder St. Suite 300 | Louisville, CO 80027
www.MagellanStrategies.com | (303) 861-8585
5
“There’s two. Number one, immigration and number two is mental health throughout the United States.” – Female, 45-54, city area, CD6 “Size of government and encroachment on personal liberties.” – Male, 35-44, suburbs, CD7 “Get Pelosi and her darn cronies out of the House. They don’t belong in politics, they don’t work for the people, they work strictly for themselves. They are crooks, crooks, crooks.” – Female, 65+, suburbs, CD7 “We need to be able to help our President, everything that he’s doing. Everyone seems to be going against him. So, I think we should all make compromises to help our President.” – Male, 45-54, suburbs, CD7 “Building the wall, border security. We’re not going to have free healthcare, sorry. Everybody has to pay, somebody pays.” – Female, 65+, suburbs, CD7 Donald Trump Job Approval is Through the Roof Donald Trump’s job approval could not be any stronger among Colorado Republicans, with 90% approving of the job he is doing and 72% strongly approving. There is no sign of weakness for the President in these numbers, despite being unable to obtain funding for a border wall after shutting down the government in January. The bottom line is that Donald Trump can do no wrong in the eyes of Republicans. It is very likely that Republicans will approve of the job he is doing regardless of any setbacks or obstacles that may arise in implementing his policies now and through 2020. “Do you approve or disapprove of the job Donald Trump is doing as President?” * Response
All Men Wom Prim Gen
Trad Rep
Trmp Rep
Oth Rep
Sub urbs
Smal Twn.
City
Rur ual
Tot. Appr. 90% 91% 89% 93% 86% 92% 100% 78% 88% 90% 93% 93% Tot. Disapr. 9% 9% 10% 6% 12% 8% 0% 21% 11% 9% 6% 6% Unsure/Ref. 1% 0% 1% 1% 2% 0% 0% 1% 1% 1% 1% 1% Str. Apprv. 72% 72% 72% 79% 65% 69% 95% 51% 66% 72% 75% 81% SMWT Ap. 18% 19% 17% 14% 21% 23% 5% 27% 22% 18% 18% 12% Str. Disapr. 6% 6% 6% 5% 8% 7% 0% 13% 9% 6% 3% 4% SMWT Dis. 3% 3% 4% 1% 4% 1% 0% 8% 2% 3% 3% 2%
Voter subgroup margins of error +/-: men 5.5%, women 5.61%, 2018 primary voter 5.6%, non-primary voter 5.6%, traditional Republican 6.5%, Trump Republican 7.3%, Other Republican 7.4%, suburban voter 6.3%, small town voter 7.9%, city voter 9.3%, rural voter 9.4%.

Colorado Republican Voter Opinion Survey Summary Field Dates: 1/30/19 – 2/4/19, 622n, MoE +/- 3.93%, 50% landline/50% cell phone
Magellan Strategies | 1685 Boxelder St. Suite 300 | Louisville, CO 80027
www.MagellanStrategies.com | (303) 861-8585
6
Why Republicans Approve of the Job Donald Trump is Doing Republican voters overwhelmingly approve of the job he is doing mostly because they believe he is keeping his campaign promises on the issues of illegal immigration, fighting for jobs, and improving the economy. They think and feel that he is delivering what he promised, or at the very least fighting hard to accomplish what he promised. There is also a sense that he is bringing a sense of pride back to America that they believe has been lacking in the country. We encourage readers of this document to download the full responses to this question from our website from the blog post for this survey release at http://magellanstrategies.com/blog/. “In your own words, being as descriptive as possible, please tell me what you approve of the job Donald Trump is doing.” “I approve of Donald Trump because has kept his word on everything he has said he would do for our country.” Female, 45-54, city area, CD1 “President Trump is doing an incredible job for this country, unlike the last President who ruined everything for the last 8 years. President Trump is making America great again, he is increasing jobs for everyone, he is helping everyone out. He is making people want to be Americans again.” – Female, 55-64, city area, CD1 “He is trying to get rid of the entrenched bureaucrats and get out of our lives. And let the American people run their own lives and live free.” – Female, 55-64, small town, CD2 “He is governing with conservative principles. He is trying to reach out to both sides of the aisle. Trying to uphold the Constitution of the U.S. as it is written. Not succumbing to the mob rule, populist mentality.” – Male, 45-54, small town, CD2 “He is doing everything he promised he would. He is standing up for me, my neighbors, and all the people in Colorado. He is a great president. He’s not very articulate sometimes, be he is a great President.” - Female, 55-64, suburbs, CD2 “He is trying to get things that are important done and stuff that will help the United States in general, not just the rich or the poor. I feel like he is trying to get things done to help people and get the poor and the middle class to where they have a change in America.” – Female, 35-44, small town, CD3 “For one thing, I think he is trying to clean up Washington and its broken-down politics. I don’t think the media in anyway is giving him any kind of an opportunity or chance. And the Democrats are so pissed off that they lost the election (2016) that they’re doing everything within their power to destroy him or knock him down.” – Male, 65+, rural area, CD3

Colorado Republican Voter Opinion Survey Summary Field Dates: 1/30/19 – 2/4/19, 622n, MoE +/- 3.93%, 50% landline/50% cell phone
Magellan Strategies | 1685 Boxelder St. Suite 300 | Louisville, CO 80027
www.MagellanStrategies.com | (303) 861-8585
7
“He is for America. He is against the immigration of the illegal coming in. They need to go away, we are suffering day by day.” – Female, 65+, rural area, CD4 “He has helped the economy. He has helped the black and Hispanic minorities with getting jobs. He has certainly helped everybody as far as I can see.” – Male, 65+, suburbs, CD4 “President Trump is not a politician. He doesn’t always say the right things and I actually find that refreshing because I don’t like someone that always has the right answer, because that means he is telling people what they want to hear. He doesn’t do a great job communicating sometimes, but he is actually doing what he said he was going to do and what people want him to do.” – Female, 45-54, suburbs, CD5 “Stock market is at an all-time high. Unemployment number is at an all-time low. China isn’t stealing all our money and employment and jobs with all their ridiculous tariffs. He stopped the $250 billion Iranian deal which was killing our country. He is trying to get a wall to control illegal immigration. Shutting down the swamp!” – Male, 45-54, suburbs, CD5 “Donald Trump has lowered our taxes and we feel it for those of us who are on low incomes. Donald Trump has brought jobs back to this country and people are working again when hundreds and thousands were not working. Donald Trump has increased our military and protected us. Donald Trump wants good schools and he wants good healthcare. He’s not responsible for what Congress does and Donald Trump really cares about the American people, not like the others in Congress and not like what we have in Colorado now.” – Female, 65+, suburbs, CD6 “I strongly approve of Donald Trump because I think he has America’s best interests at hand. I think that he is being beaten by the Democrats because of the things they approved of before, [but not now], because Trump is now in support. I think Democrats and liberals have destroyed the honor and respect of the presidency.” – Female, 65+, city area, CD7 Opinions of President’s Economic Policies, the Wall, & Shutting Down the Government Among Colorado Republicans, Donald Trump’s policies are incredibly popular and could not have more overwhelming support. Eighty-seven percent believe his economic program and policies are making the economy better. “Do you think President Trump’s economic program and policies are making the economy better, making it worse or not having a real effect?” * Response
All Men Wom Prim Gen
Trad Rep
Trmp Rep
Oth Rep
Sub urbs
Smal Twn.
City
Rur ual
Better 87% 89% 85% 92% 83% 88% 98% 75% 87% 89% 86% 87% Worse 6% 6% 5% 5% 6% 6% 0% 11% 8% 4% 4% 4% No Effect 5% 4% 6% 2% 8% 4% 1% 9% 3% 5% 6% 5% Unsure 2% 1% 4% 1% 4% 2% 1% 5% 2% 2% 4% 4%

Colorado Republican Voter Opinion Survey Summary Field Dates: 1/30/19 – 2/4/19, 622n, MoE +/- 3.93%, 50% landline/50% cell phone
Magellan Strategies | 1685 Boxelder St. Suite 300 | Louisville, CO 80027
www.MagellanStrategies.com | (303) 861-8585
8
Voter subgroup margins of error +/-: men 5.5%, women 5.61%, 2018 primary voter 5.6%, non-primary voter 5.6%, traditional Republican 6.5%, Trump Republican 7.3%, Other Republican 7.4%, suburban voter 6.3%, small town voter 7.9%, city voter 9.3%, rural voter 9.4%.
Eighty-eight percent support building a wall along the border of Mexico, and 81% supported his decision to shut down the federal government in order to get funding for the wall. Without question he is giving his base in Colorado exactly what they want, and they love him for it. “Do you support or oppose building a wall along the U.S. Border of Mexico?” * Response
All Men Wom Prim Gen
Trad Rep
Trmp Rep
Oth Rep
Sub urbs
Smal Twn.
City
Rur ual
Tot. Supp. 88% 88% 87% 93% 83% 91% 99% 72% 85% 90% 89% 90% Tot. Opp. 11% 12% 9% 7% 14% 8% 1% 25% 13% 9% 10% 7% Unsure 1% 0% 4% 0% 3% 1% 0% 3% 2% 1% 1% 3%
Voter subgroup margins of error +/-: men 5.5%, women 5.61%, 2018 primary voter 5.6%, non-primary voter 5.6%, traditional Republican 6.5%, Trump Republican 7.3%, Other Republican 7.4%, suburban voter 6.3%, small town voter 7.9%, city voter 9.3%, rural voter 9.4%.
“Did you support or oppose President Trump’s decision to shut down the federal government in order to get funding from Congress to build the wall?” * Response
All Men Wom Prim Gen
Trad Rep
Trmp Rep
Oth Rep
Sub urbs
Smal Twn.
City
Rur ual
Tot. Supp. 81% 82% 79% 89% 74% 83% 96% 61% 81% 78% 82% 83% Tot. Opp. 17% 16% 18% 10% 23% 14% 3% 36% 18% 18% 15% 13% No Opin. 2% 2% 3% 1% 3% 3% 1% 3% 1% 4% 3% 4%
Voter subgroup margins of error +/-: men 5.5%, women 5.61%, 2018 primary voter 5.6%, non-primary voter 5.6%, traditional Republican 6.5%, Trump Republican 7.3%, Other Republican 7.4%, suburban voter 6.3%, small town voter 7.9%, city voter 9.3%, rural voter 9.4%.
Less Than 20% Support for a 2020 Republican Primary Challenger to Donald Trump One question that has been on the minds of political observers looking toward the 2020 election is the possibility of a primary challenge to Donald Trump. This survey finds only 17% of respondents prefer “someone else” as the Republican Presidential nominee. Taking into account the overwhelming support for Donald Trump and his policies found in this survey, this measurement is not surprising. Could Colorado Republican opinion change regarding this question in light of the pending Robert Mueller investigation? Or perhaps investigations from House Democrats back in Washington? We believe that is very unlikely considering the intensity in support for the president that is clearly demonstrated in this survey.

Colorado Republican Voter Opinion Survey Summary Field Dates: 1/30/19 – 2/4/19, 622n, MoE +/- 3.93%, 50% landline/50% cell phone
Magellan Strategies | 1685 Boxelder St. Suite 300 | Louisville, CO 80027
www.MagellanStrategies.com | (303) 861-8585
9
“Thinking ahead to the 2020 Presidential primaries next year. Do you want Donald Trump to be the Republican nominee for President or would you prefer someone else to be the Republican nominee?” * Response
All Men Wom Prim Gen
Trad Rep
Trmp Rep
Oth Rep
Sub urbs
Smal Twn.
City
Rur ual
Trump 78% 80% 75% 82% 74% 79% 98% 55% 75% 83% 78% 76% Smone. Else 17% 17% 17% 12% 21% 16% 0% 37% 19% 16% 15% 12% Undecided 5% 3% 8% 6% 5% 5% 2% 8% 6% 1% 7% 12%
Voter subgroup margins of error +/-: men 5.5%, women 5.61%, 2018 primary voter 5.6%, non-primary voter 5.6%, traditional Republican 6.5%, Trump Republican 7.3%, Other Republican 7.4%, suburban voter 6.3%, small town voter 7.9%, city voter 9.3%, rural voter 9.4%.
Opinions of What Happened to Republican Candidates in 2018 Respondents were asked to provide their opinion of why Republican candidates did so poorly in the 2018 election. The most common theme was that liberal, Democratic-leaning voters have been moving to Colorado, therefore they chose Democratic candidates. Other comments talked about voters being attracted to a message of more services or “free things” from the government. Some voters believe the losses were due to negative media coverage of Donald Trump and Republicans in general. We encourage readers of this document to download the full responses to this question from our website from the blog post for this survey release at http://magellanstrategies.com/blog/. “As you may know, Republicans suffered historical losses in the 2018 general election here in Colorado. In your own words, being as descriptive as possible, please tell me why you think that happened.” “It was because of the influx of out of state people moving to Colorado, and that the government is taking a more active role or bigger role in terms regulation of everyday lives.” – Male, 18-34, city area, CD1 “I think due to the growth in Denver a large part of the people that have moved here have come from a very liberal state and have brought their politics with them.” – Female, 35-44, city area, CD1 “Even though I am a Republican, Polis was a much better candidate than the Republican candidate. Colorado is going purple, and purple is where I like to see it.” – Male, 65+, small town, CD2 “I guess it was probably because more people in California are moving here and we are sort of a blue state and combined with Trump not being completely strong in his campaign. I think he lost momentum in the last 2 years on the specific issue of immigration.” -Male, 18-34, suburbs, CD2

Colorado Republican Voter Opinion Survey Summary Field Dates: 1/30/19 – 2/4/19, 622n, MoE +/- 3.93%, 50% landline/50% cell phone
Magellan Strategies | 1685 Boxelder St. Suite 300 | Louisville, CO 80027
www.MagellanStrategies.com | (303) 861-8585
10
“There are too many Californians and New Yorkers here.” – Male, 65+, rural area, CD2 “I think it happened because there was a uniformed electorate in this state. I believe that the press in this state did not cover issues that they should have. All they did was hammer on Donald Trump and tried to associate every Republican with Donald Trump. There were some really qualified Republicans that got voted out by unqualified Democrats simply because there was an R in front of their name and not a D.” – Female, 55-64, suburbs, CD2 “Too many liberals and too many people wanting a free handout instead of working for a living. Too many people wanting big government.” – Female, 55-64, rural area, CD3 “The Republicans allowed themselves to be moderate and compromising. They should be firm to being conservative in their political beliefs. The Democrats outspent in their campaigns last year. For example, the governor was being deceptive with his identity during the campaign that the media hid his identity of being gay.” – Male, 45-54, small town, CD4 “Too much influx from California and other liberal states, and a very poor job by Republicans.” – Male, 65+, rural area, CD4 “Negative advertising by the Democrats that made the Republicans look bad. Republicans did not seem to have enough responses to all the negative [ads] they received. The self-funded campaign funds by Jared Polis also made it difficult for a Republican to compete.” – Male, 55-64, suburbs, CD5 “Because too many people are allowed to vote that are not US citizens. Non-citizens should not be determining what is happening in our country. I know this because I worked in 2016 as a registrar for voting people. The criteria to register is against America. We need stronger voter laws and stronger Republicans that are going to stand up for what is right.” – Female, 65+, city, CD5 “I think part of it was linked to President Trump and people, like myself had higher expectations of what he would do. A lot of us were disappointed, and that probably carried over and hurt the Republicans being elected and keeping their jobs.” – Female, 65+, suburbs, CD5 “One of the main reasons is because so many Californians have moved to Colorado and taken over. I also believe that the polls have been tampered with, we have too many illegals voting that should not be allowed to vote. The Democrats have stuffed the ballot boxes, I don’t trust any of them.” – Female, 65+, suburbs, CD6 “I think there’s been a lot of lies spread about Republicans and about Trump and I think Colorado is very liberal. I think that people don’t listen, they just believe what they want to believe. They don’t check out the facts. There are so many people against President Trump because he is a businessman, and not a politician.” – Female, 65+, city area, CD7

Colorado Republican Voter Opinion Survey Summary Field Dates: 1/30/19 – 2/4/19, 622n, MoE +/- 3.93%, 50% landline/50% cell phone
Magellan Strategies | 1685 Boxelder St. Suite 300 | Louisville, CO 80027
www.MagellanStrategies.com | (303) 861-8585
11
Opinions of What Republican Candidates Should Do in 2020 to Win The survey asked respondents what they thought Republican candidates in Colorado should do to be more successful in the 2020 election cycle. There is a wide array of comments. We encourage readers of this document to download the full responses to this question from our website from the blog post for this survey release at http://magellanstrategies.com/blog/. “As you may know, Republicans suffered historical losses in the 2018 general election here in Colorado. In your own words, being as descriptive as possible, please tell me why you think that happened.” “I do think we should compromise. We should debate more. We should allow the public to see those debates. Like Common Sense, Thomas Paine, they were good and well written to educate the people. It wasn’t about winning or losing it was about resolution. The debate has to hit on the topics and not attack the people. You have to be clear and precise in telling our people here in Colorado what the issues are, what the motives are, why we should do it, and we should deliberate and be balanced and fair with each other.” – Female, 45-54, city, CD1 “Republican candidates need to make sure we get more registered Republicans and they need to speak to the needs of the people and address the needs of the common folk as they are campaigning. They need to drop the far-right buzzwords because people don’ t listen to that. It’s going to be an uphill battle.” – Female, 55-64, suburbs, CD1 “We need to get our message out and get real news, not fake news, real news out to voters of Colorado. We need to get more boots on the ground, more knocking on doors, more phone calls. We need to show what the Democrats have done in over reaching and expanding out the government. We need to bring back our core conservative values that Colorado has always had. Get the word out, start earlier, and be extremely aggressive.” – Male, 18-34, suburbs, CD1 “I think they should talk about all the accomplishments that Donald Trump has done for our nation. He is awesome. They need to stand [with] him for what he has done for the people of the United States.” – Female, 55-64, suburbs, CD2 “Republicans should appeal to the rural residents and not just the people in Denver and the Springs. They should also stick to their base and not worry about getting the Latino vote, because they don’t vote anyway. We need to secure gun rights or the state is going to turn to complete sh*t.” – Male, 18-34, suburban area, CD3 “I think changes to our campaign finance regulations so that Republican donors can match Democratic money would help. I think that Republicans need to do a better job that socialism will never work, because you eventually run out of other people’s money.” – Female, 45-54, rural area, CD4

Colorado Republican Voter Opinion Survey Summary Field Dates: 1/30/19 – 2/4/19, 622n, MoE +/- 3.93%, 50% landline/50% cell phone
Magellan Strategies | 1685 Boxelder St. Suite 300 | Louisville, CO 80027
www.MagellanStrategies.com | (303) 861-8585
12
“They need to show that their fiscal policies will benefit the poor and not just the wealthy.” – Male, 35-44, suburbs, CD5 “Republicans need to stand together, they need to have a strong positive message about economic issues, about improving our communities, roads, schools and they need to be able to offer solutions to control spending.” – Male, 55-64, suburbs, CD5 “Be more solicitous of the young people and minorities. Young people seem to pull toward the more left wing, Democrat ways. I think they need to go after that vote.” – Female, 55-64, small town, CD6 “Stand with our president, support the programs he is supporting. Because that is what the grassroots people in this state want, even though that is not what you are going to hear on the news.” – Female, 65+, suburbs, CD6 “Maybe keep the Californians out of Colorado, keep their ways to themselves, because that’s all they wanted is damn liberal ideas that are so far left we’ve jumped off a cliff. Let’s come back to the middle and stand for something.” – Female, 65+, suburbs, CD7 Republicans Prefer Uncompromising Conservative Candidates to Moderate Ones Among all respondents, 61% prefer an uncompromising conservative candidate that will rarely reach across the aisle to work with Democrats to get things done. This viewpoint is the majority, or significant majority of opinion among every voter subgroup with the exception of self-identified “other” Republicans. Only 33% of all respondents preferred a candidate who is more moderate in their political views and is willing to compromise and work across the aisle with Democrats to get things done. Among more moderate, self-identified “other” candidates, 52% prefer a more moderate candidate who is willing to compromise and work with Democrats to get things done. “Thinking now about the kind of Republican candidates that you prefer to support. Do you prefer Republican candidates who are strong fiscal and social conservatives that rarely compromise their values to work with Democrats across the aisle to get things done or do you prefer Republican candidates who are more moderate in their political views and are willing to compromise and work with Democrats across the aisle to get things done?” * Response
All Men Wom Prim Gen
Trad Rep
Trmp Rep
Oth Rep
Sub urbs
Smal Twn.
City
Rur ual
Conserv. 61% 64% 59% 70% 53% 63% 79% 41% 60% 68% 54% 61% Moderate 33% 32% 34% 26% 39% 31% 19% 52% 34% 27% 36% 35% Unsure 6% 4% 7% 4% 8% 5% 3% 7% 6% 5% 10% 4%
Voter subgroup margins of error +/-: men 5.5%, women 5.61%, 2018 primary voter 5.6%, non-primary voter 5.6%, traditional Republican 6.5%, Trump Republican 7.3%, Other Republican 7.4%, suburban voter 6.3%, small town voter 7.9%, city voter 9.3%, rural voter 9.4%.

Colorado Republican Voter Opinion Survey Summary Field Dates: 1/30/19 – 2/4/19, 622n, MoE +/- 3.93%, 50% landline/50% cell phone
Magellan Strategies | 1685 Boxelder St. Suite 300 | Louisville, CO 80027
www.MagellanStrategies.com | (303) 861-8585
13
Opinion of Two Colorado Issues Moving Through the State Legislature The survey included a question regarding full day kindergarten, an issue that was central to Governor Polis’s campaign and a question regarding gun control, the proposed the “Red Flag” law. Among all respondents, only 34% support state funded, full day kindergarten without regard to cost. The percentage of support and opposition for this policy were very consistent across all age groups with the exception of respondents aged 35 to 44. Among those voters, support and opposition were evenly split, with 47% supporting the policy and 47% opposing it. “Do you support or oppose state funded, full day kindergarten, regardless of the cost?” * Response
All Men Wom Prim Gen
Trad Rep
Trmp Rep
Oth Rep
Sub urbs
Smal Twn.
City
Rur ual
Tot. Supp. 34% 29% 39% 24% 43% 38% 24% 39% 32% 39% 34% 31% Tot. Opp. 62% 68% 56% 74% 51% 59% 72% 54% 64% 57% 64% 63% Unsure 4% 3% 5% 2% 6% 3% 4% 7% 4% 4% 2% 6%
Voter subgroup margins of error +/-: men 5.5%, women 5.61%, 2018 primary voter 5.6%, non-primary voter 5.6%, traditional Republican 6.5%, Trump Republican 7.3%, Other Republican 7.4%, suburban voter 6.3%, small town voter 7.9%, city voter 9.3%, rural voter 9.4%.
Support for Red Flag Gun Control Legislation Remains Strong Since the proposed “Red Flag” gun legislation was introduced last year, we have polled Colorado voters on this issue three separate times. In all three surveys we have found support for this legislation among Republicans. The findings in this survey are consistent with the results of those other surveys, which is strong support for the general concept of the “Red Flag” legislation. “During the state legislative session last year, a bill was introduced called the “Red Flag” law. The Red Flag law allows a judge to take guns temporarily from someone who is determined to be a significant risk to themselves or others, based on evidence presented to the judge. Knowing this information, do you support or oppose the Red Flag law?” * Response
All Men Wom Prim Gen
Trad Rep
Trmp Rep
Oth Rep
Sub urbs
Smal Twn.
City
Rur ual
Tot. Supp. 60% 57% 64% 54% 66% 63% 58% 61% 63% 60% 64% 52% Tot. Opp. 33% 39% 27% 40% 27% 31% 36% 35% 30% 37% 28% 41% Unsure 7% 4% 9% 6% 7% 6% 6% 4% 7% 3% 8% 7%
Voter subgroup margins of error +/-: men 5.5%, women 5.61%, 2018 primary voter 5.6%, non-primary voter 5.6%, traditional Republican 6.5%, Trump Republican 7.3%, Other Republican 7.4%, suburban voter 6.3%, small town voter 7.9%, city voter 9.3%, rural voter 9.4%.
Thoughts on Responses to the Type of Republican Question In an attempt to segment our Republican sample, respondents were asked what kind of Republican they considered themselves to be. They were then given the option of being a “traditional” Republican, a Trump Republican or “some other” type of Republican. The table shows the responses by voter subgroup. When cross-referencing responses to

Colorado Republican Voter Opinion Survey Summary Field Dates: 1/30/19 – 2/4/19, 622n, MoE +/- 3.93%, 50% landline/50% cell phone
Magellan Strategies | 1685 Boxelder St. Suite 300 | Louisville, CO 80027
www.MagellanStrategies.com | (303) 861-8585
14
particular questions and our fiscal and social issue demographic question, it is apparent that more moderate Republicans are within the “some other” Republican group. “Among the different groups of voters within the Republican Party, which of the following best describes the kind of Republican do you consider yourself to be? A “traditional” Republican, a Trump Republican, or some other type of Republican?” * Response
All Men Wom Prim Gen
18- 44
45- 64
65+
Sub urbs
Smal Twn.
City
Rur ual
Tradition 37% 37% 37% 38% 36% 32% 38% 42% 34% 35% 47% 36% Trump 29% 30% 28% 36% 23% 21% 30% 37% 27% 34% 28% 28% Other 28% 28% 28% 22% 34% 41% 28% 15% 32% 25% 25% 28% No Opin. 6% 5% 7% 4% 7% 6% 4% 6% 7% 6% 0% 8%
Voter subgroup margins of error +/-: men 5.5%, women 5.61%, 2018 primary voter 5.6%, non-primary voter 5.6%, 18-44 6.9%, 45-54 6.2%, 65+ 7.5%, suburban voter 6.3%, small town voter 7.9%, city voter 9.3%, rural voter 9.4%.
Comments on Survey Sample The survey sample was randomly drawn from a January 2019 Colorado voter file. For this survey we wanted to be sure primary and non-primary Republican voters were equally represented. To achieve this sample “balance” we used two sets of telephone sample. One set of phone sample only included voters that had a history of consistently voting in primary elections. The other set of phone sample was among voters that had no history of voting in a Republican primary. Survey Commissioned By This survey was paid for by Magellan Strategies. We are not working for or with any Republican or conservative groups, organizations or individuals. For any questions regarding the survey findings or methodology please contact David Flaherty at 303-861-8585 or email at [email protected]. About Magellan Strategies Magellan Strategies is a national full-service voter opinion polling and survey research firm. We have provided polling services to ballot issue campaigns, candidates, government relation firms, trade associations, and local governments since 2006. We also offer voter data mining, voter data analysis and campaign consulting services. To learn more about our company please visit http://www.MagellanStrategies.com or call 303-861-8585. Survey Toplines, Crosstabs, Verbatim Responses and Presentation Following are the survey toplines and crosstabs. The survey verbatim responses and presentation can be downloaded in the blog post of this release at http://www.MagellanStrategies.com.

Magellan Strategies Colorado Republican Voter Survey Topline Results Magellan Strategies are pleased to present the topline results of a telephone survey of 622n registered Republican voters in the state of Colorado. The interviews were conducted from January 30th to 31st and February 4th, 2019. This survey has a margin of error of +/- 3.93% at the 95 percent confidence interval. The survey results were slightly weighted to reflect to demographics of registered Republicans in Colorado. T1. Are you registered to vote in Colorado as a Republican, a Democrat or an unaffiliated voter? Republican ........................................................... 100%
T2. Being as specific as possible, please tell me what you think the most important issue or problem is in your community that our elected officials should be addressing the most. *Verbatim responses attached in separate document.
T3. And among the following list of issues, which do you think is the top priority that Governor Polis and the state legislature should be addressing the most? Enforcing immigration laws .................................... 44% Keeping the lid on government spending ................ 11% Investing in roads and transportation ...................... 10% Creating jobs and growing the economy ................... 9% Improving Public Education ...................................... 8% Affordable housing ................................................... 6% Addressing problems with legalizing marijuana ........ 6% Reducing the cost of healthcare ................................ 4% Unsure or Refused .................................................... 2%

Magellan ID#: COREP-013019 Colorado Republican Survey Topline Results Field Dates: 1/30/19 - 1/31/19 and 2/4/19, MoE +/- 3.93%, 622n, CONFIDENTIAL
Magellan Strategies | 1685 Boxelder St. Suite 300 | Louisville, CO 80027
www.MagellanStrategies.com | (303) 861-8585
2
T4. Do you have a favorable or unfavorable opinion of Donald Trump? Total Favorable....................................................... 88% Total Unfavorable................................................... 11% Very Favorable ....................................................... 68% Somewhat Favorable .............................................. 20% Very Unfavorable ..................................................... 7% Somewhat Unfavorable ............................................ 4% Heard of, No Opinion .............................................. 1% Never Heard Of........................................................ 0% Refused .................................................................... 0%
T5. Do you approve or disapprove of the job Donald Trump is doing as President? Total Approve ........................................................ 90% Total Disapprove ...................................................... 9% Strongly Approve .................................................... 72% Somewhat Approve ................................................ 18% Strongly Disapprove ................................................. 6% Somewhat Disapprove .............................................. 3% Unsure or Refused .................................................... 1%
T6. In your own words, being as descriptive as possible, please tell me why you APPROVE/DISAPPROVE of the job Donald Trump is doing. *Verbatim responses attached in separate document.
T7. As you may know, Republicans suffered historical losses in the 2018 general election here in Colorado. In your own words, being as descriptive as possible, please tell me why you think that happened. *Verbatim responses attached in separate document.
T8. In your own words, being as descriptive as possible, please tell me what you think Republican candidates in Colorado should do to be more successful in the 2020 election cycle? *Verbatim responses attached in separate document.

Magellan ID#: COREP-013019 Colorado Republican Survey Topline Results Field Dates: 1/30/19 - 1/31/19 and 2/4/19, MoE +/- 3.93%, 622n, CONFIDENTIAL
Magellan Strategies | 1685 Boxelder St. Suite 300 | Louisville, CO 80027
www.MagellanStrategies.com | (303) 861-8585
3
T9. Thinking now about the kind of Republican candidates that you prefer to support… Do you prefer Republican candidates who are strong fiscal and social conservatives that rarely compromise their values to work with Democrats across the aisle to get things done... OR… Do you prefer Republican candidates who are more moderate in their political views, and are willing to compromise and work with Democrats across the aisle to get things done? Conservative Candidates ........................................ 61% Moderate Candidates .............................................. 33% Unsure or Refused .................................................... 6%
T10. Do you think President Trump’s economic program and policies are making the economy better, making it worse or not having a real effect? Making Economy Better .......................................... 87% Making Economy Worse ........................................... 6% No Real Effect .......................................................... 5% Unsure or Refused .................................................... 2%
T11. Do you support or oppose building a wall along the US border of Mexico? Total Support .......................................................... 88% Total Oppose ......................................................... 11% Strongly Support ..................................................... 80% Somewhat Support ................................................... 8% Strongly Oppose ....................................................... 8% Somewhat Oppose ................................................... 3% Unsure or Refused .................................................... 1%

Magellan ID#: COREP-013019 Colorado Republican Survey Topline Results Field Dates: 1/30/19 - 1/31/19 and 2/4/19, MoE +/- 3.93%, 622n, CONFIDENTIAL
Magellan Strategies | 1685 Boxelder St. Suite 300 | Louisville, CO 80027
www.MagellanStrategies.com | (303) 861-8585
4
T12. Did you support or oppose President Trump’s decision to shut down the federal government in order to get funding from Congress to build the wall? Total Support .......................................................... 81% Total Oppose ......................................................... 17% Strongly Support ..................................................... 63% Somewhat Support ................................................. 18% Strongly Oppose ..................................................... 11% Somewhat Oppose ................................................... 6% Unsure or Refused .................................................... 2%
T13. Thinking ahead to the 2020 Presidential primaries next year. Do you want Donald Trump to be the Republican nominee for President or would prefer someone else to be the Republican nominee? Donald Trump ........................................................ 78% Someone Else ......................................................... 17% Unsure or Undecided ............................................... 5% Refused .................................................................... 0%
T14. Do you support or oppose state funded, full day kindergarten, regardless of the cost to Colorado taxpayers? Total Support .......................................................... 34% Total Oppose ......................................................... 62% Strongly Support ..................................................... 15% Somewhat Support ................................................. 19% Strongly Oppose ..................................................... 50% Somewhat Oppose ................................................. 12% Unsure or Refused .................................................... 4%

Magellan ID#: COREP-013019 Colorado Republican Survey Topline Results Field Dates: 1/30/19 - 1/31/19 and 2/4/19, MoE +/- 3.93%, 622n, CONFIDENTIAL
Magellan Strategies | 1685 Boxelder St. Suite 300 | Louisville, CO 80027
www.MagellanStrategies.com | (303) 861-8585
5
T15. During the state legislative session last year, a bill was introduced called the “Red Flag” law. The Red Flag law allows a judge to take guns temporarily from someone who is determined to be a significant risk to themselves or others, based on evidence presented to the judge. Knowing this information, do you support or oppose the Red Flag law? Total Support .......................................................... 60% Total Oppose ......................................................... 33% Strongly Support ..................................................... 29% Somewhat Support ................................................. 31% Strongly Oppose ..................................................... 22% Somewhat Oppose ................................................. 11% Unsure or Refused .................................................... 7%
T16. Among the different groups of voters within the Republican Party, which of the following best describes the kind of Republican you consider yourself to be? Please wait to hear all options… “Traditional” Republican ........................................ 37% Trump Republican .................................................. 29% Other Type of Republican ...................................... 28% Unsure or No Opinion ............................................. 6%
T17. Do you consider yourself to be very conservative, somewhat conservative, moderate or liberal when it comes to fiscal issues like taxes and government spending? Very Conservative .................................................. 58% Somewhat Conservative ......................................... 30% Moderate ................................................................ 10% Liberal ...................................................................... 1% Unsure or Refused .................................................... 1%
T18. Do you consider yourself to be very conservative, somewhat conservative, moderate or liberal when it comes to social issues like abortion or same-sex marriage? Very Conservative .................................................. 55% Somewhat Conservative ......................................... 22% Moderate ................................................................ 16% Liberal ...................................................................... 6% Unsure or Refused .................................................... 1%

Magellan ID#: COREP-013019 Colorado Republican Survey Topline Results Field Dates: 1/30/19 - 1/31/19 and 2/4/19, MoE +/- 3.93%, 622n, CONFIDENTIAL
Magellan Strategies | 1685 Boxelder St. Suite 300 | Louisville, CO 80027
www.MagellanStrategies.com | (303) 861-8585
6
And now I have a few questions for statistical purposes only. T19. How would you describe the area where you currently live? Would you say you live in… Suburban Area........................................................ 39% Small Town ............................................................ 25% Big City .................................................................. 18% Rural Area .............................................................. 17% Unsure or Refused .................................................... 1%
T20. What was the total amount of income in your household last year before taxes? Was the amount… Less than $50,000 .................................................. 23% $51,000 to $75,000................................................ 20% $76,000 to $125,000.............................................. 26% More than $126,000............................................... 18% Refused .................................................................. 13%
T21. Are you male or female? Male ....................................................................... 51% Female ................................................................... 49%
T22. Which of the following age groups applies to you? 18-34 ..................................................................... 19% 35-44 ..................................................................... 13% 45-54 ..................................................................... 18% 55-64 ..................................................................... 22% 65+ ........................................................................ 28%
Survey Methodology This survey was conducted using an automated telephone touchtone technology platform and by live dialing both landline and cell phone sample. The sample used for this survey was randomly drawn from a state of Colorado voter file. The survey response data was weighted based upon Republican voter registration demographics. The interviews were conducted on January 30th – 31st and February 4th, 2019. Three attempts were made to interview each household in the sample. This survey has a margin of error of +/- 3.93% at the 95 percent confidence interval.

Colorado Republican Survey, Jan. 30th - 31st and Feb. 4th, 2019, 622n, 3.93% MoE, Weighted Results, Magellan Strategies, 1685 Boxelder St. Suite 300, Louisville, CO 80027, 303-861-8585 Table 1-1 T1. Are you registered to vote in Colorado as a Republican, a Democrat, or an unaffiliated voter? GENDER AGE COMBINED AGE TYPE OF REP INCOME PRIMARY V
GENERAL --------------------- -------------------------------------------------------- -------------------------------- -------------------------------- -------------------------------------------- ---------------------
TOTAL ---------
MEN
---------
WOM
---------
18-34
----------
35-44
---------
45-54
---------
55-64
---------
65 PLUS
---------
18-44
----------
45-64
---------
65+
---------
TRAD REP
---------
TRMP REP
---------
OTH REP
---------
LESS 50K
----------
51K 75K
---------
76K 125K
---------
MORE 126K
---------
PRIM
---------
GEN
----------
TOTAL
622 100.0
317 100.0
305 100.0
118 100.0
81 100.0
112 100.0
137 100.0
171 100.0
199 100.0
249 100.0
171 100.0
230 100.0
180 100.0
176 100.0
141 100.0
125 100.0
162 100.0
111 100.0
300 100.0
322 100.0
REPUBLICAN
622 100.0
317 100.0
305 100.0
118 100.0
81 100.0
112 100.0
137 100.0
171 100.0
199 100.0
249 100.0
171 100.0
230 100.0
180 100.0
176 100.0
141 100.0
125 100.0
162 100.0
111 100.0
300 100.0
322 100.0

Colorado Republican Survey, Jan. 30th - 31st and Feb. 4th, 2019, 622n, 3.93% MoE, Weighted Results, Magellan Strategies, 1685 Boxelder St. Suite 300, Louisville, CO 80027, 303-861-8585 Table 1-2 T1. Are you registered to vote in Colorado as a Republican, a Democrat, or an unaffiliated voter? AREA YOU LIVE IN FISCAL IDEOLOGY SOCIAL IDEOLOGY TRUMP IMAGE -------------------------------------------------------------------------------------------- -------------------------------------------- -------------------------------------------- ---------------------------------------------
TOTAL ---------
BIG CITY
---------
CITY MEN
---------
CITY WOM
----------
SUB AREA
---------
SUBS MEN
---------
SUBS WOM
---------
SMAL TOWN
---------
RURL AREA
----------
VERY CON
---------
SOME CON
---------
MOD
---------
LIB
---------
VERY CON
---------
SOME CON
----------
MOD
---------
LIB
---------
TOT FAV
---------
VERY FAV
---------
TOT UNFV
----------
VERY UNFV
---------
TOTAL
622 100.0
110 100.0
49 100.0
61 100.0
241 100.0
128 100.0
113 100.0
153 100.0
108 100.0
364 100.0
184 100.0
61 100.0
4 100.0
344 100.0
138 100.0
96 100.0
38 100.0
546 100.0
425 100.0
66 100.0
42 100.0
REPUBLICAN
622 100.0
110 100.0
49 100.0
61 100.0
241 100.0
128 100.0
113 100.0
153 100.0
108 100.0
364 100.0
184 100.0
61 100.0
4 100.0
344 100.0
138 100.0
96 100.0
38 100.0
546 100.0
425 100.0
66 100.0
42 100.0

Colorado Republican Survey, Jan. 30th - 31st and Feb. 4th, 2019, 622n, 3.93% MoE, Weighted Results, Magellan Strategies, 1685 Boxelder St. Suite 300, Louisville, CO 80027, 303-861-8585 Table 1-3 T1. Are you registered to vote in Colorado as a Republican, a Democrat, or an unaffiliated voter? TRUMP APPROVAL CANDIDATE
PREFERENCE ECONOMY BUILD WALL SHUT DOWN FOR WALL 2020
PRIMARY --------------------------------------------- -------------------- --------------------------------- -------------------------------------------- -------------------------------------------- ---------------------
TOTAL ---------
TOT APRV
---------
STRG APRV
---------
TOT DIS
----------
STRG DIS
---------
CON CAND
---------
MOD CAND
---------
BET TER
---------
WOR SE
----------
NO EFCT
---------
TOT SUPP
---------
STRG SUPP
---------
TOT OPP
---------
STRG OPP
---------
TOT SUPP
----------
STRG SUPP
---------
TOT OPP
---------
STRG OPP
---------
TRU MP
---------
SOME ELSE
----------
TOTAL
622 100.0
558 100.0
446 100.0
59 100.0
40 100.0
381 100.0
204 100.0
542 100.0
36 100.0
30 100.0
545 100.0
495 100.0
65 100.0
49 100.0
502 100.0
394 100.0
104 100.0
69 100.0
483 100.0
105 100.0
REPUBLICAN
622 100.0
558 100.0
446 100.0
59 100.0
40 100.0
381 100.0
204 100.0
542 100.0
36 100.0
30 100.0
545 100.0
495 100.0
65 100.0
49 100.0
502 100.0
394 100.0
104 100.0
69 100.0
483 100.0
105 100.0

Colorado Republican Survey, Jan. 30th - 31st and Feb. 4th, 2019, 622n, 3.93% MoE, Weighted Results, Magellan Strategies, 1685 Boxelder St. Suite 300, Louisville, CO 80027, 303-861-8585 Table 1-4 T1. Are you registered to vote in Colorado as a Republican, a Democrat, or an unaffiliated voter? FULL DAY KINDER RED FLAG REGION BY CD --------------------------------------------- -------------------------------------------- -------------------------------------------------------------------------------
TOTAL ---------
TOT SUPP
---------
STRG SUPP
---------
TOT OPP
----------
STRG OPP
---------
TOT SUPP
---------
STRG SUPP
---------
TOT OPP
---------
STRG OPP
----------
CD1
---------
CD2
---------
CD3
---------
CD4
---------
CD5
---------
CD6
----------
CD7
---------
TOTAL
622 100.0
210 100.0
92 100.0
384 100.0
313 100.0
374 100.0
181 100.0
207 100.0
134 100.0
50 100.0
87 100.0
93 100.0
124 100.0
112 100.0
87 100.0
68 100.0
REPUBLICAN
622 100.0
210 100.0
92 100.0
384 100.0
313 100.0
374 100.0
181 100.0
207 100.0
134 100.0
50 100.0
87 100.0
93 100.0
124 100.0
112 100.0
87 100.0
68 100.0

Colorado Republican Survey, Jan. 30th - 31st and Feb. 4th, 2019, 622n, 3.93% MoE, Weighted Results, Magellan Strategies, 1685 Boxelder St. Suite 300, Louisville, CO 80027, 303-861-8585 Table 2-1 T3. And among the following list of issues, which do you think is the top priority that Governor Polis and the state legislature should be addressing the most? GENDER AGE COMBINED AGE TYPE OF REP INCOME PRIMARY V
GENERAL --------------------- -------------------------------------------------------- -------------------------------- -------------------------------- -------------------------------------------- ---------------------
TOTAL ---------
MEN
---------
WOM
---------
18-34
----------
35-44
---------
45-54
---------
55-64
---------
65 PLUS
---------
18-44
----------
45-64
---------
65+
---------
TRAD REP
---------
TRMP REP
---------
OTH REP
---------
LESS 50K
----------
51K 75K
---------
76K 125K
---------
MORE 126K
---------
PRIM
---------
GEN
----------
TOTAL
622 100.0
317 100.0
305 100.0
118 100.0
81 100.0
112 100.0
137 100.0
171 100.0
199 100.0
249 100.0
171 100.0
230 100.0
180 100.0
176 100.0
141 100.0
125 100.0
162 100.0
111 100.0
300 100.0
322 100.0
ENFORCING IMMIGRATION LAWS
275 44.2
151 47.7
124 40.5
50 42.3
20 25.1
52 46.4
66 48.3
85 49.7
70 35.3
118 47.4
85 49.7
97 42.0
114 63.0
52 29.7
70 49.4
61 48.7
75 46.3
29 25.7
145 48.4
130 40.2
KEEPING LID ON GOVERNMENT SPENDING
70 11.3
40 12.6
30 9.9
15 12.9
12 15.3
10 9.0
10 7.6
22 12.8
28 13.9
20 8.2
22 12.8
27 11.5
17 9.2
22 12.7
14 9.9
10 7.9
25 15.2
15 13.6
31 10.3
39 12.1
INVESTING ROADS TRANSPORTATION
64 10.3
40 12.6
24 7.9
12 10.1
6 8.0
12 10.6
21 15.1
13 7.7
18 9.2
32 13.0
13 7.7
23 10.0
14 7.9
22 12.8
10 7.2
11 8.5
13 8.0
19 17.0
33 11.0
31 9.6
CREATING JOBS GROWING ECONOMY
53 8.5
26 8.1
27 9.0
11 9.1
11 13.8
14 12.2
9 6.8
8 4.8
22 11.0
23 9.2
8 4.8
20 8.5
9 4.8
22 12.6
9 6.5
7 5.8
15 9.1
18 16.0
27 9.2
26 8.0
IMPROVING PUBLIC EDUCATION
52 8.3
20 6.4
32 10.4
11 9.5
14 16.7
8 7.1
7 5.4
12 6.9
25 12.4
15 6.2
12 6.9
14 6.0
8 4.2
25 14.4
11 8.1
3 2.6
14 8.5
16 14.4
17 5.7
35 10.8
AFFORDABLE HOUSING
40 6.4
10 3.3
30 9.7
12 10.4
5 5.9
3 2.4
9 6.9
11 6.2
17 8.6
12 4.9
11 6.2
20 8.5
8 4.6
10 5.5
15 10.6
17 13.6
4 2.6
1 1.0
17 5.7
23 7.1
ADDRESSING PROBLEMS LEGALIZING MARIJUANA
35 5.7
12 3.8
23 7.6
3 2.8
9 10.6
5 4.1
7 5.4
11 6.6
12 5.9
12 4.8
11 6.6
19 8.1
8 4.3
5 2.9
7 4.7
5 4.3
9 5.8
10 9.3
22 7.5
13 3.9
REDUCING COST OF HEALTHCARE
25 4.0
13 4.1
12 3.9
4 3.0
2 2.6
7 6.3
5 3.8
5 3.2
6 2.8
12 4.9
5 3.2
10 4.2
3 1.6
12 6.9
4 2.5
9 7.3
7 4.1
3 3.0
3 1.0
22 6.7
UNSURE REFUSED
8 1.3
5 1.5
3 1.1
2 1.9
2 2.0
1 0.7
4 2.1
2 0.8
3 1.3
4 2.1
3 1.1
1 0.3
4 2.5
1 1.0
2 1.4
1 0.4
3 1.1
5 1.6

Colorado Republican Survey, Jan. 30th - 31st and Feb. 4th, 2019, 622n, 3.93% MoE, Weighted Results, Magellan Strategies, 1685 Boxelder St. Suite 300, Louisville, CO 80027, 303-861-8585 Table 2-2 T3. And among the following list of issues, which do you think is the top priority that Governor Polis and the state legislature should be addressing the most? AREA YOU LIVE IN FISCAL IDEOLOGY SOCIAL IDEOLOGY TRUMP IMAGE -------------------------------------------------------------------------------------------- -------------------------------------------- -------------------------------------------- ---------------------------------------------
TOTAL ---------
BIG CITY
---------
CITY MEN
---------
CITY WOM
----------
SUB AREA
---------
SUBS MEN
---------
SUBS WOM
---------
SMAL TOWN
---------
RURL AREA
----------
VERY CON
---------
SOME CON
---------
MOD
---------
LIB
---------
VERY CON
---------
SOME CON
----------
MOD
---------
LIB
---------
TOT FAV
---------
VERY FAV
---------
TOT UNFV
----------
VERY UNFV
---------
TOTAL
622 100.0
110 100.0
49 100.0
61 100.0
241 100.0
128 100.0
113 100.0
153 100.0
108 100.0
364 100.0
184 100.0
61 100.0
4 100.0
344 100.0
138 100.0
96 100.0
38 100.0
546 100.0
425 100.0
66 100.0
42 100.0
ENFORCING IMMIGRATION LAWS
275 44.2
52 47.6
25 50.6
27 45.2
93 38.5
54 42.1
39 34.5
77 50.1
48 44.2
178 48.8
70 37.8
22 36.6
1 14.9
171 49.9
61 44.1
28 29.5
12 30.3
270 49.5
239 56.4
2 2.6
1 1.5
KEEPING LID ON GOVERNMENT SPENDING
70 11.3
10 9.1
7 13.6
3 5.5
31 12.8
16 12.5
15 13.1
17 11.0
12 10.8
52 14.4
12 6.3
4 7.1
1 13.7
39 11.4
19 13.4
11 11.1
2 4.5
61 11.2
38 9.0
8 11.6
2 3.9
INVESTING ROADS TRANSPORTATION
64 10.3
11 10.1
4 9.2
7 10.8
31 13.0
20 16.0
11 9.6
7 4.6
14 12.8
31 8.4
29 15.9
4 6.9
31 8.9
19 13.6
10 10.9
2 4.5
54 9.9
39 9.2
8 11.6
6 13.3
CREATING JOBS GROWING ECONOMY
53 8.5
5 4.2
1 3.0
3 5.1
27 11.3
15 11.8
12 10.7
12 7.8
9 8.0
31 8.4
20 10.7
3 4.6
22 6.5
12 8.6
13 13.4
6 16.0
45 8.3
29 6.9
6 9.6
4 8.6
IMPROVING PUBLIC EDUCATION
52 8.3
10 9.4
5 9.5
6 9.3
17 7.0
7 5.5
10 8.7
15 9.8
9 8.0
21 5.9
17 9.4
12 20.6
1 14.2
19 5.5
8 6.1
15 16.1
9 24.2
34 6.1
20 4.7
18 27.7
10 25.2
AFFORDABLE HOUSING
40 6.4
9 8.1
1 1.8
8 13.2
13 5.6
5 3.9
8 7.5
10 6.5
7 6.1
17 4.7
15 8.3
5 7.9
1 29.2
24 7.0
7 5.2
7 7.8
1 3.1
31 5.7
21 5.0
9 12.9
7 16.1
ADDRESSING PROBLEMS LEGALIZING MARIJUANA
35 5.7
6 5.4
2 4.5
4 6.2
14 6.0
4 3.0
11 9.4
9 5.8
6 5.4
22 6.0
8 4.5
4 7.4
26 7.7
4 3.1
4 4.1
31 5.7
25 5.8
3 5.0
2 6.0
REDUCING COST OF HEALTHCARE
25 4.0
4 4.0
3 6.7
1 1.9
10 4.3
4 2.9
7 6.0
5 3.2
4 4.1
9 2.3
11 6.2
5 7.9
9 2.6
5 3.4
5 5.6
5 13.5
15 2.8
8 1.9
9 13.0
7 16.0
UNSURE REFUSED
8 1.3
2 2.1
1 1.2
2 2.8
4 1.5
3 2.3
1 0.6
2 1.2
1 0.5
4 1.1
1 0.8
1 1.1
1 27.9
2 0.6
3 2.4
1 1.5
2 4.0
4 0.8
4 1.0
4 5.9
4 9.5

Colorado Republican Survey, Jan. 30th - 31st and Feb. 4th, 2019, 622n, 3.93% MoE, Weighted Results, Magellan Strategies, 1685 Boxelder St. Suite 300, Louisville, CO 80027, 303-861-8585 Table 2-3 T3. And among the following list of issues, which do you think is the top priority that Governor Polis and the state legislature should be addressing the most? TRUMP APPROVAL CANDIDATE
PREFERENCE ECONOMY BUILD WALL SHUT DOWN FOR WALL 2020
PRIMARY --------------------------------------------- -------------------- --------------------------------- -------------------------------------------- -------------------------------------------- ---------------------
TOTAL ---------
TOT APRV
---------
STRG APRV
---------
TOT DIS
----------
STRG DIS
---------
CON CAND
---------
MOD CAND
---------
BET TER
---------
WOR SE
----------
NO EFCT
---------
TOT SUPP
---------
STRG SUPP
---------
TOT OPP
---------
STRG OPP
---------
TOT SUPP
----------
STRG SUPP
---------
TOT OPP
---------
STRG OPP
---------
TRU MP
---------
SOME ELSE
----------
TOTAL
622 100.0
558 100.0
446 100.0
59 100.0
40 100.0
381 100.0
204 100.0
542 100.0
36 100.0
30 100.0
545 100.0
495 100.0
65 100.0
49 100.0
502 100.0
394 100.0
104 100.0
69 100.0
483 100.0
105 100.0
ENFORCING IMMIGRATION LAWS
275 44.2
271 48.5
248 55.7
4 7.0
1 1.5
208 54.6
56 27.3
269 49.6
3 9.3
3 9.6
273 50.1
265 53.5
1 0.9
1 1.3
257 51.2
220 55.9
11 10.7
6 9.2
264 54.6
6 5.4
KEEPING LID ON GOVERNMENT SPENDING
70 11.3
65 11.7
39 8.7
5 7.8
3 6.8
44 11.5
20 9.8
60 11.1
3 9.2
3 10.2
61 11.2
51 10.4
8 12.5
4 8.0
56 11.1
39 9.8
11 10.6
7 9.9
50 10.4
16 15.4
INVESTING ROADS TRANSPORTATION
64 10.3
55 9.9
38 8.5
6 10.7
6 15.8
33 8.6
29 14.3
56 10.3
6 15.8
1 2.4
56 10.2
49 9.8
8 11.6
7 13.8
47 9.4
36 9.2
15 14.1
11 16.1
44 9.1
14 13.8
CREATING JOBS GROWING ECONOMY
53 8.5
47 8.4
31 7.0
6 10.9
4 9.0
30 7.9
18 8.9
45 8.2
1 1.8
6 19.5
41 7.5
35 7.0
8 12.1
2 3.8
42 8.3
32 8.2
10 9.9
7 9.6
34 7.1
12 11.4
IMPROVING PUBLIC EDUCATION
52 8.3
38 6.8
27 6.0
14 24.1
9 22.1
18 4.6
32 15.8
36 6.7
10 26.9
4 13.7
33 6.0
24 4.8
17 26.1
15 31.2
33 6.6
22 5.6
18 17.7
12 17.9
26 5.3
21 19.9
AFFORDABLE HOUSING
40 6.4
31 5.5
22 5.0
7 11.8
6 14.7
18 4.7
20 9.7
29 5.4
4 11.7
4 12.0
32 5.8
27 5.6
6 9.3
5 9.7
24 4.8
16 4.1
15 14.1
7 10.0
24 4.9
13 12.3
ADDRESSING PROBLEMS LEGALIZING MARIJUANA
35 5.7
32 5.7
29 6.5
3 5.9
2 4.1
22 5.8
9 4.5
30 5.5
1 4.0
2 6.2
31 5.7
29 5.9
4 6.5
3 7.1
29 5.8
20 5.1
5 4.8
3 5.0
28 5.9
4 4.1
REDUCING COST OF HEALTHCARE
25 4.0
16 2.9
8 1.9
9 15.0
6 16.0
5 1.2
18 9.0
13 2.5
5 13.0
6 21.0
14 2.7
10 2.1
10 14.9
9 18.9
10 2.1
6 1.5
14 13.9
11 16.6
8 1.7
15 14.0
UNSURE REFUSED
8 1.3
4 0.7
4 0.8
4 6.7
4 9.9
4 1.1
1 0.6
4 0.7
3 8.4
2 5.3
4 0.8
4 0.9
4 6.0
3 6.2
4 0.7
2 0.6
5 4.4
4 5.7
4 0.9
4 3.8

Colorado Republican Survey, Jan. 30th - 31st and Feb. 4th, 2019, 622n, 3.93% MoE, Weighted Results, Magellan Strategies, 1685 Boxelder St. Suite 300, Louisville, CO 80027, 303-861-8585 Table 2-4 T3. And among the following list of issues, which do you think is the top priority that Governor Polis and the state legislature should be addressing the most? FULL DAY KINDER RED FLAG REGION BY CD --------------------------------------------- -------------------------------------------- -------------------------------------------------------------------------------
TOTAL ---------
TOT SUPP
---------
STRG SUPP
---------
TOT OPP
----------
STRG OPP
---------
TOT SUPP
---------
STRG SUPP
---------
TOT OPP
---------
STRG OPP
----------
CD1
---------
CD2
---------
CD3
---------
CD4
---------
CD5
---------
CD6
----------
CD7
---------
TOTAL
622 100.0
210 100.0
92 100.0
384 100.0
313 100.0
374 100.0
181 100.0
207 100.0
134 100.0
50 100.0
87 100.0
93 100.0
124 100.0
112 100.0
87 100.0
68 100.0
ENFORCING IMMIGRATION LAWS
275 44.2
72 34.1
28 30.5
190 49.6
165 52.8
159 42.5
69 38.4
99 47.9
70 52.0
18 36.0
38 43.8
36 39.1
64 51.4
46 41.5
36 41.5
36 52.5
KEEPING LID ON GOVERNMENT SPENDING
70 11.3
15 6.9
5 4.9
53 13.9
42 13.4
33 8.9
9 5.0
33 16.0
25 18.6
6 11.1
7 8.2
12 13.2
9 7.3
14 12.1
14 16.0
8 12.3
INVESTING ROADS TRANSPORTATION
64 10.3
18 8.5
8 8.1
44 11.4
35 11.3
36 9.6
18 9.8
24 11.4
10 7.8
7 14.0
7 7.9
2 2.5
20 16.0
17 14.9
7 7.6
5 6.8
CREATING JOBS GROWING ECONOMY
53 8.5
21 9.9
11 12.4
29 7.6
21 6.7
32 8.5
15 8.5
18 8.9
12 9.2
7 13.9
4 4.0
14 15.0
9 7.3
5 4.2
11 12.7
4 5.5
IMPROVING PUBLIC EDUCATION
52 8.3
32 15.1
18 19.5
20 5.1
13 4.1
40 10.7
24 13.3
8 3.9
4 3.2
4 8.3
12 13.3
11 12.3
7 5.3
12 11.1
3 3.3
3 4.2
AFFORDABLE HOUSING
40 6.4
22 10.7
12 12.7
16 4.1
11 3.6
27 7.3
14 7.8
9 4.5
6 4.1
1 2.9
9 10.4
5 5.1
5 4.3
8 7.6
5 6.0
6 8.2
ADDRESSING PROBLEMS LEGALIZING MARIJUANA
35 5.7
15 7.0
5 5.1
18 4.7
17 5.4
21 5.7
12 6.6
11 5.2
4 2.8
4 7.9
6 7.2
6 6.2
7 5.4
6 5.4
5 5.6
2 2.4
REDUCING COST OF HEALTHCARE
25 4.0
13 6.0
5 5.8
10 2.7
6 2.1
21 5.5
15 8.3
2 1.1
2 1.2
2 4.5
5 5.3
5 5.4
1 0.8
3 2.6
6 7.3
3 4.0
UNSURE REFUSED
8 1.3
4 1.9
1 0.9
4 1.0
2 0.7
5 1.3
4 2.3
2 1.1
1 1.0
1 1.3
1 1.3
3 2.2
1 0.7
3 4.2

Colorado Republican Survey, Jan. 30th - 31st and Feb. 4th, 2019, 622n, 3.93% MoE, Weighted Results, Magellan Strategies, 1685 Boxelder St. Suite 300, Louisville, CO 80027, 303-861-8585 Table 3-1 T4. Do you have a favorable or unfavorable opinion of Donald Trump? GENDER AGE COMBINED AGE TYPE OF REP INCOME PRIMARY V
GENERAL --------------------- -------------------------------------------------------- -------------------------------- -------------------------------- -------------------------------------------- ---------------------
TOTAL ---------
MEN
---------
WOM
---------
18-34
----------
35-44
---------
45-54
---------
55-64
---------
65 PLUS
---------
18-44
----------
45-64
---------
65+
---------
TRAD REP
---------
TRMP REP
---------
OTH REP
---------
LESS 50K
----------
51K 75K
---------
76K 125K
---------
MORE 126K
---------
PRIM
---------
GEN
----------
TOTAL
622 100.0
317 100.0
305 100.0
118 100.0
81 100.0
112 100.0
137 100.0
171 100.0
199 100.0
249 100.0
171 100.0
230 100.0
180 100.0
176 100.0
141 100.0
125 100.0
162 100.0
111 100.0
300 100.0
322 100.0
TOTAL FAVORABLE
546 87.7
278 87.5
268 87.9
97 81.8
67 83.1
100 89.0
127 92.8
152 88.8
164 82.3
227 91.1
152 88.8
207 89.8
177 98.2
130 74.0
123 87.0
103 82.3
149 91.6
97 87.5
272 90.7
274 85.0
TOTAL UNFAVORABLE
66 10.7
33 10.5
33 10.8
17 14.2
14 16.9
10 8.7
8 6.1
18 10.4
30 15.3
18 7.3
18 10.4
22 9.5
1 0.4
42 24.0
15 10.7
19 15.4
11 6.5
14 12.5
26 8.7
40 12.5
VERY FAVORABLE
425 68.3
212 66.7
213 69.9
65 55.0
47 57.8
81 72.5
100 72.8
131 76.4
112 56.1
181 72.7
131 76.4
155 67.5
172 95.3
71 40.5
103 72.7
83 66.6
112 69.2
66 59.7
226 75.3
199 61.8
SOMEWHAT FAVORABLE
121 19.4
66 20.8
55 18.0
32 26.8
20 25.3
18 16.5
27 20.1
21 12.4
52 26.2
46 18.5
21 12.4
51 22.4
5 2.9
59 33.4
20 14.3
20 15.7
36 22.4
31 27.8
46 15.4
75 23.2
VERY UNFAVORABLE
42 6.7
22 7.0
19 6.3
4 3.2
11 14.1
6 5.6
5 3.9
15 8.7
15 7.6
12 4.6
15 8.7
16 6.8
25 14.4
8 6.0
10 8.0
8 5.1
10 8.8
15 5.1
26 8.2
SOMEWHAT UNFAVORABLE
25 4.0
11 3.5
14 4.5
13 11.1
2 2.8
4 3.2
3 2.2
3 1.7
15 7.7
7 2.6
3 1.7
6 2.8
1 0.4
17 9.6
7 4.8
9 7.4
2 1.4
4 3.8
11 3.7
14 4.3
HEARD OF, NO OPINION
4 0.7
2 0.7
2 0.7
3 2.6
1 0.7
1 0.4
3 1.5
1 0.3
1 0.4
4 2.1
2 1.6
1 1.2
1 0.3
4 1.1
NEVER HEARD OF
2 0.3
1 0.2
1 0.3
1 0.8
1 0.4
1 0.4
1 0.4
1 0.3
1 0.5
1 0.7
1 0.4
1 0.3
1 0.2
REFUSED
4 0.6
3 1.0
1 0.3
2 1.4
1 0.7
1 1.1
2 0.8
2 0.9
1 0.3
1 0.8
1 1.2
2 1.5
4 1.2

Colorado Republican Survey, Jan. 30th - 31st and Feb. 4th, 2019, 622n, 3.93% MoE, Weighted Results, Magellan Strategies, 1685 Boxelder St. Suite 300, Louisville, CO 80027, 303-861-8585 Table 3-2 T4. Do you have a favorable or unfavorable opinion of Donald Trump? AREA YOU LIVE IN FISCAL IDEOLOGY SOCIAL IDEOLOGY TRUMP IMAGE -------------------------------------------------------------------------------------------- -------------------------------------------- -------------------------------------------- ---------------------------------------------
TOTAL ---------
BIG CITY
---------
CITY MEN
---------
CITY WOM
----------
SUB AREA
---------
SUBS MEN
---------
SUBS WOM
---------
SMAL TOWN
---------
RURL AREA
----------
VERY CON
---------
SOME CON
---------
MOD
---------
LIB
---------
VERY CON
---------
SOME CON
----------
MOD
---------
LIB
---------
TOT FAV
---------
VERY FAV
---------
TOT UNFV
----------
VERY UNFV
---------
TOTAL
622 100.0
110 100.0
49 100.0
61 100.0
241 100.0
128 100.0
113 100.0
153 100.0
108 100.0
364 100.0
184 100.0
61 100.0
4 100.0
344 100.0
138 100.0
96 100.0
38 100.0
546 100.0
425 100.0
66 100.0
42 100.0
TOTAL FAVORABLE
546 87.7
99 90.5
44 90.8
55 90.2
207 86.1
111 86.7
96 85.4
132 86.3
101 93.4
338 92.6
159 86.5
42 69.0
1 27.4
319 92.7
123 89.6
76 79.1
24 61.7
546 100.0
425 100.0
TOTAL UNFAVORABLE
66 10.7
8 7.4
5 9.2
4 5.9
30 12.6
15 11.5
16 13.8
17 11.2
7 6.0
22 6.1
21 11.6
17 28.4
3 72.6
20 5.9
14 10.4
18 19.2
11 29.0
66 100.0
42 100.0
VERY FAVORABLE
425 68.3
78 71.4
35 70.9
44 71.7
151 62.9
80 62.2
72 63.7
111 72.9
78 72.3
279 76.4
109 59.3
30 49.6
1 27.4
269 78.2
90 65.6
47 48.6
15 38.5
425 77.8
425 100.0
SOMEWHAT FAVORABLE
121 19.4
21 19.1
10 19.9
11 18.5
56 23.2
31 24.5
25 21.7
20 13.4
23 21.1
59 16.2
50 27.1
12 19.4
50 14.5
33 24.0
29 30.6
9 23.2
121 22.2
VERY UNFAVORABLE
42 6.7
4 3.6
2 4.6
2 2.8
21 8.5
12 9.6
8 7.3
9 6.1
5 4.7
13 3.6
12 6.7
11 18.7
3 72.6
11 3.2
9 6.2
10 10.6
11 29.0
42 62.6
42 100.0
SOMEWHAT UNFAVORABLE
25 4.0
4 3.8
2 4.6
2 3.1
10 4.0
2 1.9
7 6.5
8 5.1
1 1.3
9 2.4
9 4.9
6 9.7
9 2.7
6 4.2
8 8.6
25 37.4
HEARD OF, NO OPINION
4 0.7
2 1.4
2 2.6
2 0.9
2 1.8
1 0.6
3 1.6
2 2.6
2 1.6
3 7.5
NEVER HEARD OF
2 0.3
1 0.4
1 0.8
1 0.5
1 0.3
1 0.4
1 0.3
1 1.8
REFUSED
4 0.6
1 0.7
1 1.3
3 2.1
4 1.1
4 1.1

Colorado Republican Survey, Jan. 30th - 31st and Feb. 4th, 2019, 622n, 3.93% MoE, Weighted Results, Magellan Strategies, 1685 Boxelder St. Suite 300, Louisville, CO 80027, 303-861-8585 Table 3-3 T4. Do you have a favorable or unfavorable opinion of Donald Trump? TRUMP APPROVAL CANDIDATE
PREFERENCE ECONOMY BUILD WALL SHUT DOWN FOR WALL 2020
PRIMARY --------------------------------------------- -------------------- --------------------------------- -------------------------------------------- -------------------------------------------- ---------------------
TOTAL ---------
TOT APRV
---------
STRG APRV
---------
TOT DIS
----------
STRG DIS
---------
CON CAND
---------
MOD CAND
---------
BET TER
---------
WOR SE
----------
NO EFCT
---------
TOT SUPP
---------
STRG SUPP
---------
TOT OPP
---------
STRG OPP
---------
TOT SUPP
----------
STRG SUPP
---------
TOT OPP
---------
STRG OPP
---------
TRU MP
---------
SOME ELSE
----------
TOTAL
622 100.0
558 100.0
446 100.0
59 100.0
40 100.0
381 100.0
204 100.0
542 100.0
36 100.0
30 100.0
545 100.0
495 100.0
65 100.0
49 100.0
502 100.0
394 100.0
104 100.0
69 100.0
483 100.0
105 100.0
TOTAL FAVORABLE
546 87.7
540 96.8
441 98.9
3 6.0
2 4.3
363 95.4
152 74.7
517 95.5
5 13.1
14 47.6
524 96.2
482 97.4
14 22.2
7 13.5
487 97.0
386 98.0
44 42.0
17 24.2
474 98.2
41 39.6
TOTAL UNFAVORABLE
66 10.7
13 2.3
2 0.4
53 90.0
37 94.0
13 3.3
46 22.8
18 3.3
30 84.6
14 48.0
14 2.7
7 1.3
47 72.2
39 80.5
9 1.7
3 0.8
57 54.4
49 71.3
3 0.6
61 58.2
VERY FAVORABLE
425 68.3
420 75.3
397 89.2
2 4.1
2 4.3
306 80.4
94 45.9
413 76.3
1 2.0
7 22.1
418 76.8
408 82.5
4 5.4
4 7.2
401 79.8
343 87.1
14 13.0
5 7.2
405 83.9
9 8.3
SOMEWHAT FAVORABLE
121 19.4
120 21.5
44 9.8
1 1.9
57 15.1
59 28.8
104 19.2
4 11.1
8 25.6
106 19.4
74 14.9
11 16.8
3 6.3
86 17.2
43 10.8
30 29.1
12 17.0
69 14.3
33 31.3
VERY UNFAVORABLE
42 6.7
1 0.1
40 68.4
35 87.4
7 1.8
31 15.0
3 0.5
26 74.0
11 35.2
6 1.0
2 0.3
35 53.4
31 63.1
1 0.2
1 0.2
40 38.3
40 57.8
41 38.9
SOMEWHAT UNFAVORABLE
25 4.0
12 2.2
2 0.4
13 21.7
3 6.6
6 1.5
16 7.8
15 2.8
4 10.6
4 12.8
9 1.6
5 1.0
12 18.8
8 17.4
8 1.6
2 0.6
17 16.1
9 13.5
3 0.6
20 19.3
HEARD OF, NO OPINION
4 0.7
2 0.4
4 2.2
1 0.3
1 2.3
1 2.1
1 0.3
1 0.3
3 4.6
2 4.5
1 0.3
3 2.9
2 3.5
2 2.2
NEVER HEARD OF
2 0.3
1 0.2
1 0.2
1 1.2
1 1.7
1 0.2
1 0.3
1 0.2
1 2.3
1 0.2
1 0.2
1 1.1
1 1.4
1 0.2
1 0.2
1 0.7
1 1.0
2 0.3
REFUSED
4 0.6
2 0.4
2 0.5
2 2.8
4 1.0
4 0.7
4 0.7
4 0.8
4 0.8
4 1.0
4 0.8

Colorado Republican Survey, Jan. 30th - 31st and Feb. 4th, 2019, 622n, 3.93% MoE, Weighted Results, Magellan Strategies, 1685 Boxelder St. Suite 300, Louisville, CO 80027, 303-861-8585 Table 3-4 T4. Do you have a favorable or unfavorable opinion of Donald Trump? FULL DAY KINDER RED FLAG REGION BY CD --------------------------------------------- -------------------------------------------- -------------------------------------------------------------------------------
TOTAL ---------
TOT SUPP
---------
STRG SUPP
---------
TOT OPP
----------
STRG OPP
---------
TOT SUPP
---------
STRG SUPP
---------
TOT OPP
---------
STRG OPP
----------
CD1
---------
CD2
---------
CD3
---------
CD4
---------
CD5
---------
CD6
----------
CD7
---------
TOTAL
622 100.0
210 100.0
92 100.0
384 100.0
313 100.0
374 100.0
181 100.0
207 100.0
134 100.0
50 100.0
87 100.0
93 100.0
124 100.0
112 100.0
87 100.0
68 100.0
TOTAL FAVORABLE
546 87.7
167 79.3
68 74.2
356 92.7
299 95.3
318 85.1
144 79.8
189 91.4
125 93.0
41 81.6
65 74.6
83 89.4
115 92.7
104 92.7
76 87.4
61 89.8
TOTAL UNFAVORABLE
66 10.7
39 18.4
20 21.4
25 6.6
12 3.7
52 14.0
35 19.3
11 5.3
6 4.8
6 12.3
21 24.3
9 9.9
8 6.1
5 4.5
11 12.6
6 9.1
VERY FAVORABLE
425 68.3
127 60.4
53 57.7
279 72.8
239 76.3
233 62.4
109 60.2
158 76.6
106 79.0
23 45.6
49 55.9
65 70.1
94 75.2
90 80.1
54 61.5
51 74.8
SOMEWHAT FAVORABLE
121 19.4
40 18.9
15 16.5
76 19.9
59 19.0
85 22.7
36 19.6
30 14.7
19 14.0
18 36.0
16 18.7
18 19.4
22 17.5
14 12.7
22 25.8
10 15.0
VERY UNFAVORABLE
42 6.7
23 10.8
13 14.3
16 4.3
7 2.3
34 9.0
23 13.0
5 2.4
1 0.9
3 6.5
13 14.6
4 4.4
8 6.1
2 2.2
6 6.9
5 8.0
SOMEWHAT UNFAVORABLE
25 4.0
16 7.6
7 7.2
9 2.3
4 1.4
19 5.0
11 6.3
6 3.0
5 3.9
3 5.8
8 9.7
5 5.5
3 2.3
5 5.7
1 1.1
HEARD OF, NO OPINION
4 0.7
1 0.7
1 1.6
1 0.4
1 0.5
1 0.2
1 0.5
4 1.8
2 1.2
3 6.1
1 0.7
1 0.7
NEVER HEARD OF
2 0.3
1 0.4
1 1.0
2 0.4
1 1.1
1 0.6
REFUSED
4 0.6
2 1.2
2 1.8
1 0.4
1 0.5
1 0.2
1 0.4
3 1.5
1 1.1
1 1.2
2 1.5
1 1.1

Colorado Republican Survey, Jan. 30th - 31st and Feb. 4th, 2019, 622n, 3.93% MoE, Weighted Results, Magellan Strategies, 1685 Boxelder St. Suite 300, Louisville, CO 80027, 303-861-8585 Table 4-1 T5. Do you approve or disapprove of the job Donald Trump is doing as President? GENDER AGE COMBINED AGE TYPE OF REP INCOME PRIMARY V
GENERAL --------------------- -------------------------------------------------------- -------------------------------- -------------------------------- -------------------------------------------- ---------------------
TOTAL ---------
MEN
---------
WOM
---------
18-34
----------
35-44
---------
45-54
---------
55-64
---------
65 PLUS
---------
18-44
----------
45-64
---------
65+
---------
TRAD REP
---------
TRMP REP
---------
OTH REP
---------
LESS 50K
----------
51K 75K
---------
76K 125K
---------
MORE 126K
---------
PRIM
---------
GEN
----------
TOTAL
622 100.0
317 100.0
305 100.0
118 100.0
81 100.0
112 100.0
137 100.0
171 100.0
199 100.0
249 100.0
171 100.0
230 100.0
180 100.0
176 100.0
141 100.0
125 100.0
162 100.0
111 100.0
300 100.0
322 100.0
TOTAL APPROVE
558 89.8
289 91.0
270 88.5
103 87.0
67 83.0
104 93.1
128 93.6
153 89.4
170 85.4
232 93.4
153 89.4
211 91.7
180 99.6
137 77.9
127 90.0
108 86.0
149 91.9
101 90.7
280 93.3
279 86.4
TOTAL DISAPPROVE
59 9.4
28 8.8
31 10.1
14 11.7
14 17.0
7 6.2
7 5.5
17 9.7
27 13.8
14 5.8
17 9.7
18 8.0
1 0.4
36 20.5
10 7.4
18 14.0
13 8.1
10 9.3
19 6.4
39 12.2
STRONGLY APPROVE
446 71.7
227 71.5
219 71.9
66 55.5
54 66.3
87 78.1
107 78.1
129 75.6
119 59.9
194 78.1
129 75.6
159 69.2
172 95.4
89 50.8
98 69.1
92 73.5
117 72.3
79 71.0
237 79.1
209 64.8
SOMEWHAT APPROVE
112 18.1
62 19.5
51 16.6
37 31.5
14 16.8
17 15.0
21 15.5
24 13.8
51 25.5
38 15.2
24 13.8
52 22.5
8 4.3
48 27.1
29 20.9
16 12.5
32 19.5
22 19.7
43 14.2
70 21.7
STRONGLY DISAPPROVE
40 6.4
22 6.9
18 5.8
4 3.2
10 13.0
6 5.5
5 3.9
14 8.2
14 7.1
12 4.6
14 8.2
16 6.8
23 13.3
9 6.6
12 9.4
7 4.3
7 5.9
15 5.1
24 7.6
SOMEWHAT DISAPPROVE
19 3.0
6 1.8
13 4.3
10 8.5
3 4.0
1 0.7
2 1.6
3 1.5
13 6.7
3 1.2
3 1.5
3 1.1
1 0.4
13 7.2
1 0.8
6 4.6
6 3.9
4 3.4
4 1.3
15 4.6
UNSURE REFUSED
5 0.8
1 0.3
4 1.4
2 1.3
1 0.7
1 0.9
2 0.9
2 0.8
2 0.8
2 0.9
1 0.4
3 1.6
4 2.6
1 0.3
4 1.4

Colorado Republican Survey, Jan. 30th - 31st and Feb. 4th, 2019, 622n, 3.93% MoE, Weighted Results, Magellan Strategies, 1685 Boxelder St. Suite 300, Louisville, CO 80027, 303-861-8585 Table 4-2 T5. Do you approve or disapprove of the job Donald Trump is doing as President? AREA YOU LIVE IN FISCAL IDEOLOGY SOCIAL IDEOLOGY TRUMP IMAGE -------------------------------------------------------------------------------------------- -------------------------------------------- -------------------------------------------- ---------------------------------------------
TOTAL ---------
BIG CITY
---------
CITY MEN
---------
CITY WOM
----------
SUB AREA
---------
SUBS MEN
---------
SUBS WOM
---------
SMAL TOWN
---------
RURL AREA
----------
VERY CON
---------
SOME CON
---------
MOD
---------
LIB
---------
VERY CON
---------
SOME CON
----------
MOD
---------
LIB
---------
TOT FAV
---------
VERY FAV
---------
TOT UNFV
----------
VERY UNFV
---------
TOTAL
622 100.0
110 100.0
49 100.0
61 100.0
241 100.0
128 100.0
113 100.0
153 100.0
108 100.0
364 100.0
184 100.0
61 100.0
4 100.0
344 100.0
138 100.0
96 100.0
38 100.0
546 100.0
425 100.0
66 100.0
42 100.0
TOTAL APPROVE
558 89.8
102 93.0
44 91.0
58 94.6
211 87.7
114 89.1
97 86.1
138 90.2
100 92.8
346 94.9
166 89.9
41 67.7
1 27.4
324 94.2
126 91.7
80 83.2
24 62.3
540 99.0
420 99.0
13 19.3
1 1.7
TOTAL DISAPPROVE
59 9.4
6 5.6
4 9.0
2 2.8
27 11.3
13 10.2
14 12.5
15 9.8
7 6.0
18 5.1
17 9.2
17 28.6
3 72.6
19 5.4
11 8.3
13 13.5
14 35.5
3 0.6
2 0.6
53 79.4
40 96.2
STRONGLY APPROVE
446 71.7
82 74.7
35 71.7
47 77.1
160 66.3
86 67.1
74 65.3
110 72.3
88 81.1
289 79.4
121 65.4
31 50.6
1 27.4
276 80.2
91 66.4
56 58.4
19 48.5
441 80.8
397 93.6
2 2.5
SOMEWHAT APPROVE
112 18.1
20 18.3
9 19.3
11 17.5
52 21.5
28 22.0
24 20.8
27 17.9
13 11.7
57 15.6
45 24.5
10 17.2
48 14.0
35 25.3
24 24.8
5 13.8
99 18.2
23 5.4
11 16.9
1 1.7
STRONGLY DISAPPROVE
40 6.4
3 2.8
1 2.7
2 2.8
21 8.8
13 10.2
8 7.2
9 6.1
4 4.0
13 3.7
11 6.2
10 17.2
3 72.6
12 3.5
7 4.9
8 8.7
12 30.7
2 0.3
2 0.4
37 56.3
35 83.6
SOMEWHAT DISAPPROVE
19 3.0
3 2.8
3 6.3
6 2.5
6 5.3
6 3.7
2 2.0
5 1.4
6 3.1
7 11.4
7 1.9
5 3.4
5 4.8
2 4.8
2 0.3
1 0.2
15 23.1
5 12.6
UNSURE REFUSED
5 0.8
2 1.4
2 2.6
2 1.0
1 0.7
2 1.4
1 1.2
2 0.9
2 3.7
1 0.4
3 3.2
1 2.2
2 0.4
2 0.5
1 1.3
1 2.1

Colorado Republican Survey, Jan. 30th - 31st and Feb. 4th, 2019, 622n, 3.93% MoE, Weighted Results, Magellan Strategies, 1685 Boxelder St. Suite 300, Louisville, CO 80027, 303-861-8585 Table 4-3 T5. Do you approve or disapprove of the job Donald Trump is doing as President? TRUMP APPROVAL CANDIDATE
PREFERENCE ECONOMY BUILD WALL SHUT DOWN FOR WALL 2020
PRIMARY --------------------------------------------- -------------------- --------------------------------- -------------------------------------------- -------------------------------------------- ---------------------
TOTAL ---------
TOT APRV
---------
STRG APRV
---------
TOT DIS
----------
STRG DIS
---------
CON CAND
---------
MOD CAND
---------
BET TER
---------
WOR SE
----------
NO EFCT
---------
TOT SUPP
---------
STRG SUPP
---------
TOT OPP
---------
STRG OPP
---------
TOT SUPP
----------
STRG SUPP
---------
TOT OPP
---------
STRG OPP
---------
TRU MP
---------
SOME ELSE
----------
TOTAL
622 100.0
558 100.0
446 100.0
59 100.0
40 100.0
381 100.0
204 100.0
542 100.0
36 100.0
30 100.0
545 100.0
495 100.0
65 100.0
49 100.0
502 100.0
394 100.0
104 100.0
69 100.0
483 100.0
105 100.0
TOTAL APPROVE
558 89.8
558 100.0
446 100.0
368 96.5
160 78.7
532 98.2
5 13.3
13 42.7
531 97.5
488 98.6
18 27.5
6 13.0
496 98.8
390 98.9
48 45.7
17 25.1
479 99.2
48 46.1
TOTAL DISAPPROVE
59 9.4
59 100.0
40 100.0
12 3.1
40 19.7
10 1.8
30 84.3
15 50.9
11 2.0
4 0.8
45 68.8
41 83.8
5 1.0
3 0.8
54 51.4
49 71.5
3 0.6
55 53.1
STRONGLY APPROVE
446 71.7
446 79.9
446 100.0
315 82.6
107 52.5
435 80.4
2 4.4
6 19.3
439 80.5
426 86.0
3 4.2
2 3.7
419 83.5
358 90.9
16 15.6
6 8.7
425 88.2
9 8.2
SOMEWHAT APPROVE
112 18.1
112 20.1
53 13.9
53 26.2
97 17.8
3 8.9
7 23.3
92 17.0
62 12.6
15 23.3
4 9.2
77 15.2
31 8.0
31 30.0
11 16.3
53 11.1
40 37.9
STRONGLY DISAPPROVE
40 6.4
40 67.9
40 100.0
7 1.9
27 13.4
2 0.3
27 76.5
9 28.8
3 0.6
35 54.2
32 66.1
40 38.1
40 57.5
1 0.1
39 37.4
SOMEWHAT DISAPPROVE
19 3.0
19 32.1
5 1.3
13 6.3
8 1.5
3 7.9
7 22.1
8 1.4
4 0.8
10 14.6
9 17.7
5 1.0
3 0.8
14 13.2
10 13.9
2 0.5
16 15.7
UNSURE REFUSED
5 0.8
1 0.3
3 1.6
1 2.3
2 6.5
3 0.5
3 0.6
2 3.7
2 3.2
1 0.3
1 0.3
3 2.9
2 3.5
1 0.1
1 0.8

Colorado Republican Survey, Jan. 30th - 31st and Feb. 4th, 2019, 622n, 3.93% MoE, Weighted Results, Magellan Strategies, 1685 Boxelder St. Suite 300, Louisville, CO 80027, 303-861-8585 Table 4-4 T5. Do you approve or disapprove of the job Donald Trump is doing as President? FULL DAY KINDER RED FLAG REGION BY CD --------------------------------------------- -------------------------------------------- -------------------------------------------------------------------------------
TOTAL ---------
TOT SUPP
---------
STRG SUPP
---------
TOT OPP
----------
STRG OPP
---------
TOT SUPP
---------
STRG SUPP
---------
TOT OPP
---------
STRG OPP
----------
CD1
---------
CD2
---------
CD3
---------
CD4
---------
CD5
---------
CD6
----------
CD7
---------
TOTAL
622 100.0
210 100.0
92 100.0
384 100.0
313 100.0
374 100.0
181 100.0
207 100.0
134 100.0
50 100.0
87 100.0
93 100.0
124 100.0
112 100.0
87 100.0
68 100.0
TOTAL APPROVE
558 89.8
172 81.7
68 73.4
363 94.7
303 96.6
324 86.8
149 82.6
196 94.8
129 96.5
43 86.1
69 79.5
88 94.0
116 93.0
103 92.1
78 90.1
61 89.5
TOTAL DISAPPROVE
59 9.4
36 17.0
23 25.2
20 5.1
10 3.2
47 12.4
31 16.9
9 4.4
3 2.3
5 9.4
18 20.5
6 6.0
9 7.0
8 7.2
6 7.4
7 10.5
STRONGLY APPROVE
446 71.7
134 63.8
57 61.5
293 76.4
252 80.3
250 66.8
112 61.7
162 78.4
107 79.5
25 51.1
57 65.4
70 74.8
100 80.5
84 74.7
55 63.0
55 80.5
SOMEWHAT APPROVE
112 18.1
37 17.8
11 11.9
70 18.3
51 16.3
75 20.0
38 20.9
34 16.5
23 17.1
17 34.9
12 14.1
18 19.3
16 12.5
19 17.4
24 27.1
6 9.1
STRONGLY DISAPPROVE
40 6.4
22 10.5
14 15.3
16 4.3
9 2.9
33 8.7
22 12.2
6 2.9
3 2.3
2 4.6
12 13.8
2 2.6
8 6.1
3 2.8
5 5.9
7 10.5
SOMEWHAT DISAPPROVE
19 3.0
14 6.5
9 9.9
3 0.9
1 0.2
14 3.7
9 4.7
3 1.5
2 4.8
6 6.7
3 3.4
1 0.9
5 4.4
1 1.5
UNSURE REFUSED
5 0.8
3 1.3
1 1.4
1 0.2
1 0.3
3 0.8
1 0.5
2 0.8
2 1.2
2 4.5
1 0.7
2 2.5

Colorado Republican Survey, Jan. 30th - 31st and Feb. 4th, 2019, 622n, 3.93% MoE, Weighted Results, Magellan Strategies, 1685 Boxelder St. Suite 300, Louisville, CO 80027, 303-861-8585 Table 5-1 T6. Thinking now about the kind of Republican candidates that you prefer to support...Do you prefer Republican candidates who are strong fiscal and social conservatives that rarely compromise their values to work with Democrats across the aisle to get things done...OR...Do you prefer Republican candidates who are more moderate in their political views, and are willing to compromise and work with Democrats across the aisle to get things done? GENDER AGE COMBINED AGE TYPE OF REP INCOME PRIMARY V
GENERAL --------------------- -------------------------------------------------------- -------------------------------- -------------------------------- -------------------------------------------- ---------------------
TOTAL ---------
MEN
---------
WOM
---------
18-34
----------
35-44
---------
45-54
---------
55-64
---------
65 PLUS
---------
18-44
----------
45-64
---------
65+
---------
TRAD REP
---------
TRMP REP
---------
OTH REP
---------
LESS 50K
----------
51K 75K
---------
76K 125K
---------
MORE 126K
---------
PRIM
---------
GEN
----------
TOTAL
622 100.0
317 100.0
305 100.0
118 100.0
81 100.0
112 100.0
137 100.0
171 100.0
199 100.0
249 100.0
171 100.0
230 100.0
180 100.0
176 100.0
141 100.0
125 100.0
162 100.0
111 100.0
300 100.0
322 100.0
CONSERVATIVE CANDIDATES
381 61.2
202 63.5
179 58.8
70 59.3
42 51.7
68 60.8
89 64.7
112 65.7
112 56.3
157 63.0
112 65.7
146 63.4
142 78.5
72 40.9
85 60.3
77 61.4
114 70.0
61 54.9
210 70.0
171 53.1
MODERATE CANDIDATES
204 32.7
102 32.0
102 33.5
46 39.0
32 40.0
38 33.7
39 28.9
45 26.2
78 39.4
77 31.1
45 26.2
72 31.4
33 18.5
92 52.1
45 31.7
40 32.3
45 27.7
45 40.2
77 25.6
127 39.4
UNSURE REFUSED
37 6.0
14 4.4
23 7.7
2 1.6
7 8.3
6 5.4
9 6.4
14 8.1
9 4.3
15 6.0
14 8.1
12 5.2
5 3.0
12 7.0
11 8.0
8 6.2
4 2.4
5 4.9
13 4.4
24 7.5

Colorado Republican Survey, Jan. 30th - 31st and Feb. 4th, 2019, 622n, 3.93% MoE, Weighted Results, Magellan Strategies, 1685 Boxelder St. Suite 300, Louisville, CO 80027, 303-861-8585 Table 5-2 T6. Thinking now about the kind of Republican candidates that you prefer to support...Do you prefer Republican candidates who are strong fiscal and social conservatives that rarely compromise their values to work with Democrats across the aisle to get things done...OR...Do you prefer Republican candidates who are more moderate in their political views, and are willing to compromise and work with Democrats across the aisle to get things done? AREA YOU LIVE IN FISCAL IDEOLOGY SOCIAL IDEOLOGY TRUMP IMAGE -------------------------------------------------------------------------------------------- -------------------------------------------- -------------------------------------------- ---------------------------------------------
TOTAL ---------
BIG CITY
---------
CITY MEN
---------
CITY WOM
----------
SUB AREA
---------
SUBS MEN
---------
SUBS WOM
---------
SMAL TOWN
---------
RURL AREA
----------
VERY CON
---------
SOME CON
---------
MOD
---------
LIB
---------
VERY CON
---------
SOME CON
----------
MOD
---------
LIB
---------
TOT FAV
---------
VERY FAV
---------
TOT UNFV
----------
VERY UNFV
---------
TOTAL
622 100.0
110 100.0
49 100.0
61 100.0
241 100.0
128 100.0
113 100.0
153 100.0
108 100.0
364 100.0
184 100.0
61 100.0
4 100.0
344 100.0
138 100.0
96 100.0
38 100.0
546 100.0
425 100.0
66 100.0
42 100.0
CONSERVATIVE CANDIDATES
381 61.2
59 53.9
22 45.9
37 60.3
145 60.4
87 67.6
59 52.2
104 68.2
66 61.3
283 77.7
78 42.5
14 22.7
1 28.6
260 75.6
76 55.0
30 30.8
13 33.8
363 66.6
306 72.1
13 19.0
7 16.2
MODERATE CANDIDATES
204 32.7
40 36.3
21 43.4
19 30.7
81 33.6
38 29.9
43 37.7
42 27.4
38 35.4
64 17.5
95 51.5
43 70.1
2 57.7
69 20.2
55 39.6
55 57.9
24 61.7
152 27.9
94 22.0
46 69.9
31 73.4
UNSURE REFUSED
37 6.0
11 9.8
5 10.8
5 9.0
15 6.1
3 2.5
11 10.1
7 4.4
4 3.3
17 4.8
11 6.0
4 7.3
1 13.7
14 4.2
7 5.4
11 11.3
2 4.5
30 5.5
25 5.9
7 11.1
4 10.4

Colorado Republican Survey, Jan. 30th - 31st and Feb. 4th, 2019, 622n, 3.93% MoE, Weighted Results, Magellan Strategies, 1685 Boxelder St. Suite 300, Louisville, CO 80027, 303-861-8585 Table 5-3 T6. Thinking now about the kind of Republican candidates that you prefer to support...Do you prefer Republican candidates who are strong fiscal and social conservatives that rarely compromise their values to work with Democrats across the aisle to get things done...OR...Do you prefer Republican candidates who are more moderate in their political views, and are willing to compromise and work with Democrats across the aisle to get things done? TRUMP APPROVAL CANDIDATE
PREFERENCE ECONOMY BUILD WALL SHUT DOWN FOR WALL 2020
PRIMARY --------------------------------------------- -------------------- --------------------------------- -------------------------------------------- -------------------------------------------- ---------------------
TOTAL ---------
TOT APRV
---------
STRG APRV
---------
TOT DIS
----------
STRG DIS
---------
CON CAND
---------
MOD CAND
---------
BET TER
---------
WOR SE
----------
NO EFCT
---------
TOT SUPP
---------
STRG SUPP
---------
TOT OPP
---------
STRG OPP
---------
TOT SUPP
----------
STRG SUPP
---------
TOT OPP
---------
STRG OPP
---------
TRU MP
---------
SOME ELSE
----------
TOTAL
622 100.0
558 100.0
446 100.0
59 100.0
40 100.0
381 100.0
204 100.0
542 100.0
36 100.0
30 100.0
545 100.0
495 100.0
65 100.0
49 100.0
502 100.0
394 100.0
104 100.0
69 100.0
483 100.0
105 100.0
CONSERVATIVE CANDIDATES
381 61.2
368 65.9
315 70.6
12 20.4
7 17.8
381 100.0
360 66.5
8 21.7
10 33.1
366 67.2
355 71.7
11 16.7
7 15.2
353 70.4
298 75.5
20 18.8
13 18.5
342 71.0
21 20.3
MODERATE CANDIDATES
204 32.7
160 28.7
107 24.0
40 68.5
27 68.8
204 100.0
151 27.9
23 63.0
19 64.7
151 27.7
114 23.1
47 72.3
36 73.8
123 24.6
75 19.0
76 72.5
48 69.4
115 23.9
74 70.9
UNSURE REFUSED
37 6.0
30 5.4
24 5.4
6 11.0
5 13.4
30 5.6
5 15.3
1 2.2
28 5.1
26 5.2
7 11.0
5 10.9
25 5.0
22 5.5
9 8.7
8 12.1
25 5.1
9 8.8

Colorado Republican Survey, Jan. 30th - 31st and Feb. 4th, 2019, 622n, 3.93% MoE, Weighted Results, Magellan Strategies, 1685 Boxelder St. Suite 300, Louisville, CO 80027, 303-861-8585 Table 5-4 T6. Thinking now about the kind of Republican candidates that you prefer to support...Do you prefer Republican candidates who are strong fiscal and social conservatives that rarely compromise their values to work with Democrats across the aisle to get things done...OR...Do you prefer Republican candidates who are more moderate in their political views, and are willing to compromise and work with Democrats across the aisle to get things done? FULL DAY KINDER RED FLAG REGION BY CD --------------------------------------------- -------------------------------------------- -------------------------------------------------------------------------------
TOTAL ---------
TOT SUPP
---------
STRG SUPP
---------
TOT OPP
----------
STRG OPP
---------
TOT SUPP
---------
STRG SUPP
---------
TOT OPP
---------
STRG OPP
----------
CD1
---------
CD2
---------
CD3
---------
CD4
---------
CD5
---------
CD6
----------
CD7
---------
TOTAL
622 100.0
210 100.0
92 100.0
384 100.0
313 100.0
374 100.0
181 100.0
207 100.0
134 100.0
50 100.0
87 100.0
93 100.0
124 100.0
112 100.0
87 100.0
68 100.0
CONSERVATIVE CANDIDATES
381 61.2
113 54.0
44 47.9
255 66.5
227 72.4
204 54.6
91 50.4
157 75.8
106 79.4
16 32.2
49 55.8
61 65.4
86 69.3
78 69.3
50 57.2
42 61.0
MODERATE CANDIDATES
204 32.7
86 40.9
45 49.0
104 27.2
70 22.3
153 41.0
83 45.9
37 17.9
19 14.3
29 58.5
33 37.3
30 32.4
33 26.4
31 27.5
30 34.1
19 27.1
UNSURE REFUSED
37 6.0
11 5.1
3 3.1
24 6.4
17 5.3
16 4.4
7 3.7
13 6.3
8 6.3
5 9.3
6 6.9
2 2.2
5 4.3
4 3.2
8 8.7
8 12.0

Colorado Republican Survey, Jan. 30th - 31st and Feb. 4th, 2019, 622n, 3.93% MoE, Weighted Results, Magellan Strategies, 1685 Boxelder St. Suite 300, Louisville, CO 80027, 303-861-8585 Table 6-1 T7. Do you think President Trump's economic program and policies are making the economy better, making it worse or not having a real effect? GENDER AGE COMBINED AGE TYPE OF REP INCOME PRIMARY V
GENERAL --------------------- -------------------------------------------------------- -------------------------------- -------------------------------- -------------------------------------------- ---------------------
TOTAL ---------
MEN
---------
WOM
---------
18-34
----------
35-44
---------
45-54
---------
55-64
---------
65 PLUS
---------
18-44
----------
45-64
---------
65+
---------
TRAD REP
---------
TRMP REP
---------
OTH REP
---------
LESS 50K
----------
51K 75K
---------
76K 125K
---------
MORE 126K
---------
PRIM
---------
GEN
----------
TOTAL
622 100.0
317 100.0
305 100.0
118 100.0
81 100.0
112 100.0
137 100.0
171 100.0
199 100.0
249 100.0
171 100.0
230 100.0
180 100.0
176 100.0
141 100.0
125 100.0
162 100.0
111 100.0
300 100.0
322 100.0
ECONOMEY BETTER
542 87.1
282 89.0
259 85.1
100 84.8
65 81.0
103 91.6
125 91.1
146 85.1
166 83.3
227 91.3
146 85.1
202 87.9
177 98.3
132 75.2
118 83.6
107 85.5
148 91.4
97 86.8
275 91.8
266 82.6
ECONOMY WORSE
36 5.7
20 6.2
16 5.3
5 4.5
6 7.2
7 6.2
6 4.0
12 7.1
11 5.6
12 5.0
12 7.1
14 5.9
20 11.3
9 6.3
9 7.2
4 2.7
7 6.6
16 5.3
20 6.2
NO REAL EFFECT
30 4.8
12 3.9
18 5.8
10 8.1
5 5.8
2 1.6
6 4.1
8 4.9
14 7.2
7 3.0
8 4.9
10 4.3
2 1.0
16 9.2
9 6.4
7 5.9
7 4.3
3 2.4
6 1.9
24 7.5
UNSURE REFUSED
15 2.4
3 0.9
12 3.9
3 2.6
5 6.1
1 0.7
1 0.8
5 2.9
8 4.0
2 0.8
5 2.9
4 1.8
1 0.6
8 4.3
5 3.7
2 1.4
3 1.6
5 4.2
3 1.0
12 3.7

Colorado Republican Survey, Jan. 30th - 31st and Feb. 4th, 2019, 622n, 3.93% MoE, Weighted Results, Magellan Strategies, 1685 Boxelder St. Suite 300, Louisville, CO 80027, 303-861-8585 Table 6-2 T7. Do you think President Trump's economic program and policies are making the economy better, making it worse or not having a real effect? AREA YOU LIVE IN FISCAL IDEOLOGY SOCIAL IDEOLOGY TRUMP IMAGE -------------------------------------------------------------------------------------------- -------------------------------------------- -------------------------------------------- ---------------------------------------------
TOTAL ---------
BIG CITY
---------
CITY MEN
---------
CITY WOM
----------
SUB AREA
---------
SUBS MEN
---------
SUBS WOM
---------
SMAL TOWN
---------
RURL AREA
----------
VERY CON
---------
SOME CON
---------
MOD
---------
LIB
---------
VERY CON
---------
SOME CON
----------
MOD
---------
LIB
---------
TOT FAV
---------
VERY FAV
---------
TOT UNFV
----------
VERY UNFV
---------
TOTAL
622 100.0
110 100.0
49 100.0
61 100.0
241 100.0
128 100.0
113 100.0
153 100.0
108 100.0
364 100.0
184 100.0
61 100.0
4 100.0
344 100.0
138 100.0
96 100.0
38 100.0
546 100.0
425 100.0
66 100.0
42 100.0
ECONOMEY BETTER
542 87.1
94 85.9
43 87.8
51 84.4
210 87.2
112 87.6
98 86.7
136 89.1
94 86.8
342 93.9
157 85.3
37 60.5
1 27.4
315 91.7
123 89.2
77 80.7
22 57.8
517 94.8
413 97.3
18 26.9
3 6.3
ECONOMY WORSE
36 5.7
5 4.3
2 4.8
2 3.9
20 8.4
13 10.1
7 6.4
5 3.6
4 4.0
10 2.8
12 6.4
9 14.5
3 72.6
10 3.0
7 4.9
6 6.3
11 27.9
5 0.9
1 0.2
30 45.6
26 63.6
NO REAL EFFECT
30 4.8
7 6.4
2 4.4
5 8.0
8 3.1
3 2.3
5 4.1
8 5.3
6 5.3
9 2.5
11 6.2
7 12.0
13 3.7
6 4.4
6 6.0
6 14.3
14 2.6
7 1.6
14 21.6
11 25.3
UNSURE REFUSED
15 2.4
4 3.4
1 3.0
2 3.7
3 1.3
3 2.8
3 2.0
4 3.9
3 0.8
4 2.2
8 13.0
5 1.6
2 1.5
7 7.0
9 1.7
4 1.0
4 5.9
2 4.8

Colorado Republican Survey, Jan. 30th - 31st and Feb. 4th, 2019, 622n, 3.93% MoE, Weighted Results, Magellan Strategies, 1685 Boxelder St. Suite 300, Louisville, CO 80027, 303-861-8585 Table 6-3 T7. Do you think President Trump's economic program and policies are making the economy better, making it worse or not having a real effect? TRUMP APPROVAL CANDIDATE
PREFERENCE ECONOMY BUILD WALL SHUT DOWN FOR WALL 2020
PRIMARY --------------------------------------------- -------------------- --------------------------------- -------------------------------------------- -------------------------------------------- ---------------------
TOTAL ---------
TOT APRV
---------
STRG APRV
---------
TOT DIS
----------
STRG DIS
---------
CON CAND
---------
MOD CAND
---------
BET TER
---------
WOR SE
----------
NO EFCT
---------
TOT SUPP
---------
STRG SUPP
---------
TOT OPP
---------
STRG OPP
---------
TOT SUPP
----------
STRG SUPP
---------
TOT OPP
---------
STRG OPP
---------
TRU MP
---------
SOME ELSE
----------
TOTAL
622 100.0
558 100.0
446 100.0
59 100.0
40 100.0
381 100.0
204 100.0
542 100.0
36 100.0
30 100.0
545 100.0
495 100.0
65 100.0
49 100.0
502 100.0
394 100.0
104 100.0
69 100.0
483 100.0
105 100.0
ECONOMEY BETTER
542 87.1
532 95.3
435 97.6
10 16.6
2 4.3
360 94.5
151 74.3
542 100.0
516 94.8
481 97.1
18 27.1
11 21.8
484 96.5
387 98.1
42 40.7
16 23.0
467 96.7
51 48.3
ECONOMY WORSE
36 5.7
5 0.9
2 0.4
30 51.5
27 68.7
8 2.0
23 11.1
36 100.0
6 1.1
2 0.3
29 45.1
26 54.1
2 0.3
2 0.4
34 32.8
33 48.3
3 0.7
32 30.4
NO REAL EFFECT
30 4.8
13 2.3
6 1.3
15 26.0
9 21.7
10 2.6
19 9.5
30 100.0
13 2.4
9 1.8
14 21.7
9 18.8
9 1.8
5 1.1
21 20.1
16 23.4
8 1.6
17 16.1
UNSURE REFUSED
15 2.4
9 1.6
3 0.7
3 5.9
2 5.3
3 0.9
10 5.1
9 1.7
4 0.8
4 6.1
3 5.3
7 1.4
1 0.4
7 6.4
4 5.3
5 1.1
5 5.2

Colorado Republican Survey, Jan. 30th - 31st and Feb. 4th, 2019, 622n, 3.93% MoE, Weighted Results, Magellan Strategies, 1685 Boxelder St. Suite 300, Louisville, CO 80027, 303-861-8585 Table 6-4 T7. Do you think President Trump's economic program and policies are making the economy better, making it worse or not having a real effect? FULL DAY KINDER RED FLAG REGION BY CD --------------------------------------------- -------------------------------------------- -------------------------------------------------------------------------------
TOTAL ---------
TOT SUPP
---------
STRG SUPP
---------
TOT OPP
----------
STRG OPP
---------
TOT SUPP
---------
STRG SUPP
---------
TOT OPP
---------
STRG OPP
----------
CD1
---------
CD2
---------
CD3
---------
CD4
---------
CD5
---------
CD6
----------
CD7
---------
TOTAL
622 100.0
210 100.0
92 100.0
384 100.0
313 100.0
374 100.0
181 100.0
207 100.0
134 100.0
50 100.0
87 100.0
93 100.0
124 100.0
112 100.0
87 100.0
68 100.0
ECONOMEY BETTER
542 87.1
162 77.3
68 74.3
357 93.0
295 94.1
315 84.2
141 78.0
191 92.7
123 92.0
38 75.8
67 77.1
84 89.7
112 89.8
107 95.8
74 85.3
60 87.2
ECONOMY WORSE
36 5.7
21 9.9
11 12.1
14 3.7
8 2.6
29 7.8
22 12.2
3 1.5
2 1.8
5 9.7
11 13.0
3 3.0
5 4.0
2 1.5
6 6.8
4 6.3
NO REAL EFFECT
30 4.8
19 8.9
9 9.5
9 2.3
8 2.6
21 5.7
13 7.1
7 3.5
4 2.7
4 7.1
8 8.6
4 4.3
4 3.0
3 2.7
5 5.3
3 5.0
UNSURE REFUSED
15 2.4
8 3.9
4 4.1
4 1.0
2 0.7
9 2.3
5 2.6
5 2.3
5 3.5
4 7.4
1 1.3
3 3.0
4 3.2
2 2.5
1 1.4

Colorado Republican Survey, Jan. 30th - 31st and Feb. 4th, 2019, 622n, 3.93% MoE, Weighted Results, Magellan Strategies, 1685 Boxelder St. Suite 300, Louisville, CO 80027, 303-861-8585 Table 7-1 T8. Do you support or oppose building a wall along the US border of Mexico? GENDER AGE COMBINED AGE TYPE OF REP INCOME PRIMARY V
GENERAL --------------------- -------------------------------------------------------- -------------------------------- -------------------------------- -------------------------------------------- ---------------------
TOTAL ---------
MEN
---------
WOM
---------
18-34
----------
35-44
---------
45-54
---------
55-64
---------
65 PLUS
---------
18-44
----------
45-64
---------
65+
---------
TRAD REP
---------
TRMP REP
---------
OTH REP
---------
LESS 50K
----------
51K 75K
---------
76K 125K
---------
MORE 126K
---------
PRIM
---------
GEN
----------
TOTAL
622 100.0
317 100.0
305 100.0
118 100.0
81 100.0
112 100.0
137 100.0
171 100.0
199 100.0
249 100.0
171 100.0
230 100.0
180 100.0
176 100.0
141 100.0
125 100.0
162 100.0
111 100.0
300 100.0
322 100.0
TOTAL SUPPORT
545 87.6
278 87.7
266 87.4
97 81.9
66 81.8
100 89.1
126 91.8
153 89.7
163 81.9
225 90.6
153 89.7
209 90.9
178 98.8
126 71.5
123 87.5
108 86.4
149 91.8
94 84.0
278 92.7
267 82.8
TOTAL OPPOSE
65 10.5
37 11.6
29 9.4
18 15.6
13 16.6
11 9.5
8 5.7
15 8.9
32 16.0
18 7.4
15 8.9
18 7.8
1 0.5
44 25.1
16 11.6
14 10.9
13 7.8
15 13.5
22 7.3
44 13.5
STRONGLY SUPPORT
495 79.6
252 79.4
243 79.8
87 73.4
55 68.2
94 83.9
116 85.1
140 81.7
142 71.3
210 84.5
140 81.7
186 80.8
174 96.5
105 59.5
114 81.0
98 78.6
134 82.7
82 73.8
260 86.6
235 73.0
SOMEWHAT SUPPORT
50 8.0
26 8.3
23 7.7
10 8.6
11 13.5
6 5.2
9 6.8
14 7.9
21 10.6
15 6.1
14 7.9
23 10.1
4 2.3
21 12.0
9 6.5
10 7.8
15 9.0
11 10.3
18 6.1
31 9.8
STRONGLY OPPOSE
49 7.8
23 7.1
26 8.6
10 8.8
12 14.3
6 5.5
7 5.0
14 8.1
22 11.0
13 5.2
14 8.1
15 6.4
33 18.9
15 10.4
11 8.5
9 5.5
8 7.5
14 4.5
35 10.9
SOMEWHAT OPPOSE
17 2.7
14 4.4
3 0.9
8 6.8
2 2.3
5 4.0
1 0.7
1 0.8
10 5.0
5 2.2
1 0.8
3 1.4
1 0.5
11 6.2
2 1.2
3 2.3
4 2.3
7 6.0
8 2.7
9 2.7
UNSURE NO OPINION
12 1.9
2 0.7
10 3.1
3 2.5
1 1.7
2 1.4
3 2.5
3 1.5
4 2.1
5 2.0
3 1.5
3 1.3
1 0.7
6 3.3
1 0.9
3 2.7
1 0.5
3 2.5
12 3.7
REFUSED

Colorado Republican Survey, Jan. 30th - 31st and Feb. 4th, 2019, 622n, 3.93% MoE, Weighted Results, Magellan Strategies, 1685 Boxelder St. Suite 300, Louisville, CO 80027, 303-861-8585 Table 7-2 T8. Do you support or oppose building a wall along the US border of Mexico? AREA YOU LIVE IN FISCAL IDEOLOGY SOCIAL IDEOLOGY TRUMP IMAGE -------------------------------------------------------------------------------------------- -------------------------------------------- -------------------------------------------- ---------------------------------------------
TOTAL ---------
BIG CITY
---------
CITY MEN
---------
CITY WOM
----------
SUB AREA
---------
SUBS MEN
---------
SUBS WOM
---------
SMAL TOWN
---------
RURL AREA
----------
VERY CON
---------
SOME CON
---------
MOD
---------
LIB
---------
VERY CON
---------
SOME CON
----------
MOD
---------
LIB
---------
TOT FAV
---------
VERY FAV
---------
TOT UNFV
----------
VERY UNFV
---------
TOTAL
622 100.0
110 100.0
49 100.0
61 100.0
241 100.0
128 100.0
113 100.0
153 100.0
108 100.0
364 100.0
184 100.0
61 100.0
4 100.0
344 100.0
138 100.0
96 100.0
38 100.0
546 100.0
425 100.0
66 100.0
42 100.0
TOTAL SUPPORT
545 87.6
98 89.1
43 88.9
54 89.3
204 84.9
109 85.4
95 84.2
138 90.1
97 89.7
338 92.7
158 85.4
42 68.7
1 27.4
322 93.7
126 91.2
73 75.9
19 50.3
524 96.0
418 98.5
14 21.8
6 13.4
TOTAL OPPOSE
65 10.5
11 9.7
5 11.1
5 8.6
32 13.4
19 14.6
14 12.0
14 8.8
7 6.5
22 6.1
21 11.2
18 29.5
3 72.6
19 5.4
9 6.5
21 22.0
16 42.4
14 2.7
4 0.8
47 71.1
35 84.0
STRONGLY SUPPORT
495 79.6
86 78.4
37 76.6
49 79.8
187 77.7
101 78.6
87 76.7
122 79.5
92 85.5
315 86.4
141 76.4
32 53.4
1 27.4
307 89.4
108 78.4
61 63.5
15 39.2
482 88.4
408 96.2
7 9.9
2 3.9
SOMEWHAT SUPPORT
50 8.0
12 10.7
6 12.3
6 9.4
17 7.1
9 6.8
9 7.5
16 10.5
5 4.3
23 6.2
17 9.0
9 15.4
15 4.3
18 12.9
12 12.4
4 11.1
42 7.7
10 2.3
8 11.8
4 9.5
STRONGLY OPPOSE
49 7.8
6 5.9
3 6.2
3 5.6
22 9.3
10 7.6
13 11.3
12 7.6
7 6.5
13 3.6
17 9.4
15 24.2
3 72.6
16 4.7
7 4.9
12 13.0
13 32.9
7 1.2
4 0.8
39 59.1
31 73.9
SOMEWHAT OPPOSE
17 2.7
4 3.9
2 4.9
2 3.1
10 4.1
9 7.0
1 0.7
2 1.2
9 2.6
3 1.7
3 5.3
2 0.6
2 1.6
9 9.0
4 9.5
8 1.5
8 12.0
4 10.1
UNSURE NO OPINION
12 1.9
1 1.2
1 2.1
4 1.8
4 3.8
2 1.1
4 3.7
4 1.2
6 3.4
1 1.8
3 0.9
3 2.3
2 2.1
3 7.3
7 1.3
3 0.7
5 7.1
1 2.7
REFUSED

Colorado Republican Survey, Jan. 30th - 31st and Feb. 4th, 2019, 622n, 3.93% MoE, Weighted Results, Magellan Strategies, 1685 Boxelder St. Suite 300, Louisville, CO 80027, 303-861-8585 Table 7-3 T8. Do you support or oppose building a wall along the US border of Mexico? TRUMP APPROVAL CANDIDATE
PREFERENCE ECONOMY BUILD WALL SHUT DOWN FOR WALL 2020
PRIMARY --------------------------------------------- -------------------- --------------------------------- -------------------------------------------- -------------------------------------------- ---------------------
TOTAL ---------
TOT APRV
---------
STRG APRV
---------
TOT DIS
----------
STRG DIS
---------
CON CAND
---------
MOD CAND
---------
BET TER
---------
WOR SE
----------
NO EFCT
---------
TOT SUPP
---------
STRG SUPP
---------
TOT OPP
---------
STRG OPP
---------
TOT SUPP
----------
STRG SUPP
---------
TOT OPP
---------
STRG OPP
---------
TRU MP
---------
SOME ELSE
----------
TOTAL
622 100.0
558 100.0
446 100.0
59 100.0
40 100.0
381 100.0
204 100.0
542 100.0
36 100.0
30 100.0
545 100.0
495 100.0
65 100.0
49 100.0
502 100.0
394 100.0
104 100.0
69 100.0
483 100.0
105 100.0
TOTAL SUPPORT
545 87.6
531 95.1
439 98.4
11 18.7
3 8.1
366 96.1
151 74.1
516 95.4
6 17.5
13 43.5
545 100.0
495 100.0
489 97.5
389 98.6
41 39.4
17 24.6
475 98.5
44 41.8
TOTAL OPPOSE
65 10.5
18 3.2
3 0.6
45 76.9
35 89.1
11 2.9
47 23.2
18 3.3
29 82.5
14 47.4
65 100.0
49 100.0
9 1.8
1 0.4
57 54.3
50 71.7
3 0.6
57 54.5
STRONGLY SUPPORT
495 79.6
488 87.4
426 95.5
4 7.1
355 93.2
114 56.1
481 88.7
2 4.4
9 29.2
495 90.9
495 100.0
465 92.6
384 97.3
19 18.5
7 10.5
452 93.7
22 20.8
SOMEWHAT SUPPORT
50 8.0
43 7.7
13 2.9
7 11.6
3 8.1
11 2.9
37 18.0
36 6.6
5 13.1
4 14.3
50 9.1
25 4.9
5 1.3
22 21.0
10 14.1
23 4.8
22 20.9
STRONGLY OPPOSE
49 7.8
6 1.1
2 0.4
41 69.7
32 80.9
7 1.9
36 17.6
11 2.0
26 73.7
9 30.5
49 74.4
49 100.0
3 0.5
46 44.1
43 61.6
2 0.4
43 40.7
SOMEWHAT OPPOSE
17 2.7
12 2.1
1 0.2
4 7.2
3 8.2
4 0.9
11 5.6
7 1.3
3 8.8
5 16.9
17 25.6
6 1.2
1 0.4
11 10.1
7 10.0
1 0.2
14 13.7
UNSURE NO OPINION
12 1.9
9 1.7
4 1.0
3 4.4
1 2.8
4 1.1
6 2.7
7 1.4
3 9.1
4 0.8
4 1.0
7 6.3
3 3.7
4 0.9
4 3.8
REFUSED

Colorado Republican Survey, Jan. 30th - 31st and Feb. 4th, 2019, 622n, 3.93% MoE, Weighted Results, Magellan Strategies, 1685 Boxelder St. Suite 300, Louisville, CO 80027, 303-861-8585 Table 7-4 T8. Do you support or oppose building a wall along the US border of Mexico? FULL DAY KINDER RED FLAG REGION BY CD --------------------------------------------- -------------------------------------------- -------------------------------------------------------------------------------
TOTAL ---------
TOT SUPP
---------
STRG SUPP
---------
TOT OPP
----------
STRG OPP
---------
TOT SUPP
---------
STRG SUPP
---------
TOT OPP
---------
STRG OPP
----------
CD1
---------
CD2
---------
CD3
---------
CD4
---------
CD5
---------
CD6
----------
CD7
---------
TOTAL
622 100.0
210 100.0
92 100.0
384 100.0
313 100.0
374 100.0
181 100.0
207 100.0
134 100.0
50 100.0
87 100.0
93 100.0
124 100.0
112 100.0
87 100.0
68 100.0
TOTAL SUPPORT
545 87.6
175 83.4
74 80.1
348 90.6
289 92.4
318 85.1
144 79.6
189 91.7
122 91.2
40 80.8
70 80.8
84 89.7
115 92.7
104 93.2
72 82.4
59 86.4
TOTAL OPPOSE
65 10.5
30 14.4
15 16.8
30 7.9
20 6.3
48 12.8
31 17.2
14 6.7
9 6.4
10 19.2
17 19.2
5 5.7
8 6.4
7 6.1
11 12.1
9 12.5
STRONGLY SUPPORT
495 79.6
153 73.0
68 73.3
323 84.1
273 87.2
276 73.9
121 67.1
184 89.0
117 87.5
32 63.6
63 72.4
78 83.7
105 84.8
96 86.0
63 72.7
57 83.8
SOMEWHAT SUPPORT
50 8.0
22 10.4
6 6.8
25 6.5
16 5.1
42 11.2
23 12.5
6 2.7
5 3.6
9 17.1
7 8.5
6 6.0
10 7.9
8 7.2
8 9.7
2 2.6
STRONGLY OPPOSE
49 7.8
26 12.5
14 15.2
18 4.6
10 3.2
39 10.4
28 15.4
8 3.9
5 3.9
6 11.5
15 17.2
5 5.7
8 6.4
5 4.6
5 5.6
5 6.9
SOMEWHAT OPPOSE
17 2.7
4 1.9
1 1.6
13 3.3
10 3.1
9 2.5
3 1.8
6 2.8
3 2.5
4 7.7
2 2.0
2 1.5
6 6.6
4 5.6
UNSURE NO OPINION
12 1.9
5 2.2
3 3.2
6 1.5
4 1.3
8 2.0
6 3.2
3 1.6
3 2.5
4 4.6
1 0.9
1 0.7
5 5.5
1 1.1
REFUSED

Colorado Republican Survey, Jan. 30th - 31st and Feb. 4th, 2019, 622n, 3.93% MoE, Weighted Results, Magellan Strategies, 1685 Boxelder St. Suite 300, Louisville, CO 80027, 303-861-8585 Table 8-1 T9. Did you support or oppose President Trump's decision to shut down the federal government in order to get funding from Congress to build the wall? GENDER AGE COMBINED AGE TYPE OF REP INCOME PRIMARY V
GENERAL --------------------- -------------------------------------------------------- -------------------------------- -------------------------------- -------------------------------------------- ---------------------
TOTAL ---------
MEN
---------
WOM
---------
18-34
----------
35-44
---------
45-54
---------
55-64
---------
65 PLUS
---------
18-44
----------
45-64
---------
65+
---------
TRAD REP
---------
TRMP REP
---------
OTH REP
---------
LESS 50K
----------
51K 75K
---------
76K 125K
---------
MORE 126K
---------
PRIM
---------
GEN
----------
TOTAL
622 100.0
317 100.0
305 100.0
118 100.0
81 100.0
112 100.0
137 100.0
171 100.0
199 100.0
249 100.0
171 100.0
230 100.0
180 100.0
176 100.0
141 100.0
125 100.0
162 100.0
111 100.0
300 100.0
322 100.0
TOTAL SUPPORT
502 80.7
260 82.0
242 79.3
91 76.6
60 73.8
94 83.9
112 82.2
142 83.1
150 75.5
206 82.9
142 83.1
190 82.5
173 95.7
108 61.3
114 80.7
96 76.7
137 84.5
87 77.9
265 88.5
237 73.5
TOTAL OPPOSE
104 16.8
49 15.5
55 18.0
23 19.3
21 26.2
14 12.3
20 14.5
27 15.6
44 22.1
34 13.5
27 15.6
32 13.8
5 3.0
63 35.8
25 17.4
23 18.4
22 13.5
23 20.4
31 10.4
73 22.7
STRONGLY SUPPORT
394 63.4
209 65.9
185 60.8
61 51.2
44 54.3
83 73.7
97 70.8
110 64.5
104 52.5
179 72.1
110 64.5
135 58.5
154 85.2
79 45.1
91 64.2
79 63.2
111 68.2
65 58.3
213 71.1
181 56.2
SOMEWHAT SUPPORT
108 17.3
51 16.1
56 18.5
30 25.4
16 19.6
11 10.2
16 11.3
32 18.6
46 23.0
27 10.8
32 18.6
55 24.0
19 10.5
28 16.2
23 16.5
17 13.5
26 16.3
22 19.7
52 17.3
56 17.3
STRONGLY OPPOSE
69 11.1
38 12.0
31 10.2
15 12.6
12 15.3
10 8.7
11 8.0
21 12.4
27 13.7
21 8.3
21 12.4
25 10.9
1 0.8
40 22.8
14 10.0
18 14.3
14 8.5
14 12.4
25 8.2
45 13.8
SOMEWHAT OPPOSE
35 5.7
11 3.6
24 7.9
8 6.7
9 10.9
4 3.7
9 6.5
6 3.3
17 8.4
13 5.2
6 3.3
7 2.9
4 2.3
23 13.0
10 7.4
5 4.1
8 5.0
9 8.0
7 2.2
28 8.8
UNSURE NO OPINION
14 2.3
8 2.4
7 2.2
5 4.1
3 2.6
5 3.4
2 1.3
5 2.4
8 3.0
2 1.3
7 3.1
2 1.2
5 2.9
3 1.9
6 4.9
2 1.2
2 1.7
3 1.1
11 3.5
REFUSED
1 0.2
1 0.4
1 1.2
1 0.5
1 0.6
1 0.8
1 0.4

Colorado Republican Survey, Jan. 30th - 31st and Feb. 4th, 2019, 622n, 3.93% MoE, Weighted Results, Magellan Strategies, 1685 Boxelder St. Suite 300, Louisville, CO 80027, 303-861-8585 Table 8-2 T9. Did you support or oppose President Trump's decision to shut down the federal government in order to get funding from Congress to build the wall? AREA YOU LIVE IN FISCAL IDEOLOGY SOCIAL IDEOLOGY TRUMP IMAGE -------------------------------------------------------------------------------------------- -------------------------------------------- -------------------------------------------- ---------------------------------------------
TOTAL ---------
BIG CITY
---------
CITY MEN
---------
CITY WOM
----------
SUB AREA
---------
SUBS MEN
---------
SUBS WOM
---------
SMAL TOWN
---------
RURL AREA
----------
VERY CON
---------
SOME CON
---------
MOD
---------
LIB
---------
VERY CON
---------
SOME CON
----------
MOD
---------
LIB
---------
TOT FAV
---------
VERY FAV
---------
TOT UNFV
----------
VERY UNFV
---------
TOTAL
622 100.0
110 100.0
49 100.0
61 100.0
241 100.0
128 100.0
113 100.0
153 100.0
108 100.0
364 100.0
184 100.0
61 100.0
4 100.0
344 100.0
138 100.0
96 100.0
38 100.0
546 100.0
425 100.0
66 100.0
42 100.0
TOTAL SUPPORT
502 80.7
90 82.4
41 84.5
49 80.8
196 81.2
107 83.7
88 78.3
120 78.3
90 83.3
323 88.5
141 76.2
32 52.8
1 27.4
299 87.1
115 83.4
66 68.8
18 48.0
487 89.2
401 94.3
9 13.2
1 1.8
TOTAL OPPOSE
104 16.8
16 14.7
5 11.2
11 17.4
43 17.9
21 16.3
22 19.8
27 17.6
15 13.4
32 8.8
39 21.3
27 45.0
3 72.6
35 10.0
23 16.6
25 25.8
20 52.0
44 8.0
14 3.2
57 85.5
40 96.1
STRONGLY SUPPORT
394 63.4
66 60.3
32 65.8
34 56.0
150 62.1
81 63.1
69 61.0
98 64.1
74 68.8
268 73.5
96 52.2
23 38.6
1 27.4
250 72.7
82 59.8
45 47.1
15 39.3
386 70.8
343 80.9
3 4.8
1 1.8
SOMEWHAT SUPPORT
108 17.3
24 22.1
9 18.7
15 24.8
46 19.1
26 20.6
20 17.3
22 14.3
16 14.5
55 15.0
44 24.0
9 14.2
49 14.4
32 23.6
21 21.7
3 8.7
101 18.4
57 13.4
6 8.4
STRONGLY OPPOSE
69 11.1
9 8.0
5 11.2
3 5.4
30 12.6
17 13.1
13 11.9
18 11.8
10 9.3
20 5.6
23 12.7
19 32.1
3 72.6
21 6.2
14 10.4
14 14.3
18 46.9
17 3.1
5 1.2
49 74.3
40 96.1
SOMEWHAT OPPOSE
35 5.7
7 6.7
7 12.0
13 5.4
4 3.2
9 7.8
9 5.8
4 4.1
12 3.2
16 8.6
8 12.9
13 3.8
9 6.2
11 11.5
2 5.1
27 5.0
9 2.0
7 11.3
UNSURE NO OPINION
14 2.3
3 2.9
2 4.3
1 1.8
2 0.9
2 1.9
6 4.0
2 2.0
10 2.7
5 2.5
9 2.5
5 5.4
14 2.5
9 2.2
1 1.3
1 2.1
REFUSED
1 0.2
1 1.2
1 2.2
1 0.4
1 0.2
1 0.3

Colorado Republican Survey, Jan. 30th - 31st and Feb. 4th, 2019, 622n, 3.93% MoE, Weighted Results, Magellan Strategies, 1685 Boxelder St. Suite 300, Louisville, CO 80027, 303-861-8585 Table 8-3 T9. Did you support or oppose President Trump's decision to shut down the federal government in order to get funding from Congress to build the wall? TRUMP APPROVAL CANDIDATE
PREFERENCE ECONOMY BUILD WALL SHUT DOWN FOR WALL 2020
PRIMARY --------------------------------------------- -------------------- --------------------------------- -------------------------------------------- -------------------------------------------- ---------------------
TOTAL ---------
TOT APRV
---------
STRG APRV
---------
TOT DIS
----------
STRG DIS
---------
CON CAND
---------
MOD CAND
---------
BET TER
---------
WOR SE
----------
NO EFCT
---------
TOT SUPP
---------
STRG SUPP
---------
TOT OPP
---------
STRG OPP
---------
TOT SUPP
----------
STRG SUPP
---------
TOT OPP
---------
STRG OPP
---------
TRU MP
---------
SOME ELSE
----------
TOTAL
622 100.0
558 100.0
446 100.0
59 100.0
40 100.0
381 100.0
204 100.0
542 100.0
36 100.0
30 100.0
545 100.0
495 100.0
65 100.0
49 100.0
502 100.0
394 100.0
104 100.0
69 100.0
483 100.0
105 100.0
TOTAL SUPPORT
502 80.7
496 88.8
419 94.0
5 8.5
353 92.7
123 60.6
484 89.4
2 4.4
9 29.9
489 89.8
465 93.8
9 13.5
3 5.4
502 100.0
394 100.0
451 93.5
26 24.7
TOTAL OPPOSE
104 16.8
48 8.5
16 3.7
54 91.5
40 100.0
20 5.2
76 37.1
42 7.8
34 95.6
21 70.1
41 7.6
19 3.9
57 86.5
46 94.6
104 100.0
69 100.0
20 4.1
78 74.7
STRONGLY SUPPORT
394 63.4
390 69.8
358 80.4
3 5.3
298 78.1
75 36.8
387 71.4
2 4.4
5 15.1
389 71.4
384 77.5
1 2.2
394 78.6
394 100.0
374 77.4
7 6.9
SOMEWHAT SUPPORT
108 17.3
106 19.0
61 13.6
2 3.2
56 14.6
48 23.8
98 18.0
4 14.8
100 18.4
81 16.3
7 11.3
3 5.4
108 21.4
78 16.1
19 17.8
STRONGLY OPPOSE
69 11.1
17 3.1
6 1.4
49 84.4
40 100.0
13 3.4
48 23.5
16 2.9
33 93.4
16 54.0
17 3.1
7 1.5
50 75.7
43 87.5
69 66.3
69 100.0
8 1.6
59 56.5
SOMEWHAT OPPOSE
35 5.7
30 5.4
10 2.3
4 7.2
7 1.8
28 13.6
27 4.9
1 2.2
5 16.1
24 4.4
12 2.4
7 10.8
3 7.1
35 33.7
12 2.5
19 18.2
UNSURE NO OPINION
14 2.3
14 2.4
9 2.0
8 2.1
3 1.6
14 2.5
13 2.4
10 2.0
11 2.2
1 0.6
REFUSED
1 0.2
1 0.2
1 0.3
1 0.7
1 0.2
1 0.2
1 0.3
1 0.3

Colorado Republican Survey, Jan. 30th - 31st and Feb. 4th, 2019, 622n, 3.93% MoE, Weighted Results, Magellan Strategies, 1685 Boxelder St. Suite 300, Louisville, CO 80027, 303-861-8585 Table 8-4 T9. Did you support or oppose President Trump's decision to shut down the federal government in order to get funding from Congress to build the wall? FULL DAY KINDER RED FLAG REGION BY CD --------------------------------------------- -------------------------------------------- -------------------------------------------------------------------------------
TOTAL ---------
TOT SUPP
---------
STRG SUPP
---------
TOT OPP
----------
STRG OPP
---------
TOT SUPP
---------
STRG SUPP
---------
TOT OPP
---------
STRG OPP
----------
CD1
---------
CD2
---------
CD3
---------
CD4
---------
CD5
---------
CD6
----------
CD7
---------
TOTAL
622 100.0
210 100.0
92 100.0
384 100.0
313 100.0
374 100.0
181 100.0
207 100.0
134 100.0
50 100.0
87 100.0
93 100.0
124 100.0
112 100.0
87 100.0
68 100.0
TOTAL SUPPORT
502 80.7
159 75.7
62 67.7
326 84.9
276 88.2
284 76.0
123 67.8
185 89.6
120 89.2
38 76.5
61 70.3
81 87.3
103 82.7
97 86.6
64 74.0
57 83.1
TOTAL OPPOSE
104 16.8
49 23.5
29 31.5
45 11.7
25 8.0
80 21.5
54 30.1
17 8.4
11 8.5
11 22.0
26 29.7
12 12.7
14 11.3
10 9.1
20 23.5
11 16.1
STRONGLY SUPPORT
394 63.4
123 58.6
49 53.5
255 66.5
221 70.4
212 56.7
90 49.6
157 75.9
107 79.6
22 45.1
54 62.1
64 68.1
87 70.2
73 65.1
47 54.3
47 68.1
SOMEWHAT SUPPORT
108 17.3
36 17.0
13 14.1
71 18.4
56 17.8
72 19.2
33 18.2
28 13.7
13 9.6
16 31.4
7 8.2
18 19.2
16 12.5
24 21.5
17 19.7
10 14.9
STRONGLY OPPOSE
69 11.1
34 16.1
19 20.5
31 8.0
17 5.5
54 14.4
35 19.1
12 5.6
7 5.3
8 15.7
17 20.0
6 6.6
11 9.1
6 5.1
11 12.2
10 14.7
SOMEWHAT OPPOSE
35 5.7
16 7.5
10 11.0
14 3.7
8 2.5
26 7.1
20 11.0
6 2.8
4 3.2
3 6.3
8 9.6
6 6.1
3 2.2
4 4.0
10 11.3
1 1.4
UNSURE NO OPINION
14 2.3
2 0.8
1 0.8
13 3.4
12 3.8
8 2.2
2 1.3
4 2.0
3 2.3
1 1.5
6 5.0
5 4.3
2 2.5
1 0.9
REFUSED
1 0.2
1 0.4
1 0.7
1 1.1

Colorado Republican Survey, Jan. 30th - 31st and Feb. 4th, 2019, 622n, 3.93% MoE, Weighted Results, Magellan Strategies, 1685 Boxelder St. Suite 300, Louisville, CO 80027, 303-861-8585 Table 9-1 T10. Thinking ahead to the 2020 Presidential primaries next year. Do you want Donald Trump to be the Republican nominee for President or would prefer someone else to be the Republican nominee? GENDER AGE COMBINED AGE TYPE OF REP INCOME PRIMARY V
GENERAL --------------------- -------------------------------------------------------- -------------------------------- -------------------------------- -------------------------------------------- ---------------------
TOTAL ---------
MEN
---------
WOM
---------
18-34
----------
35-44
---------
45-54
---------
55-64
---------
65 PLUS
---------
18-44
----------
45-64
---------
65+
---------
TRAD REP
---------
TRMP REP
---------
OTH REP
---------
LESS 50K
----------
51K 75K
---------
76K 125K
---------
MORE 126K
---------
PRIM
---------
GEN
----------
TOTAL
622 100.0
317 100.0
305 100.0
118 100.0
81 100.0
112 100.0
137 100.0
171 100.0
199 100.0
249 100.0
171 100.0
230 100.0
180 100.0
176 100.0
141 100.0
125 100.0
162 100.0
111 100.0
300 100.0
322 100.0
DONALD TRUMP
483 77.6
254 80.2
228 74.8
82 69.8
57 70.3
94 83.8
106 77.2
141 82.3
139 70.0
199 80.2
141 82.3
181 78.5
176 97.8
97 55.4
113 79.8
97 77.4
132 81.1
78 69.6
246 82.0
237 73.5
SOMEONE ELSE
105 16.8
53 16.6
52 17.0
26 22.3
19 24.1
16 14.7
18 13.2
24 14.2
46 23.0
35 13.9
24 14.2
36 15.6
64 36.5
20 14.2
26 20.4
23 14.4
23 20.5
36 12.1
68 21.2
UNSURE UNDECIDED
35 5.6
10 3.1
25 8.2
9 8.0
5 5.7
2 1.5
13 9.6
6 3.5
14 7.0
15 6.0
6 3.5
14 5.9
4 2.2
14 8.2
8 6.0
3 2.1
7 4.4
11 9.9
18 5.9
17 5.3
REFUSED

Colorado Republican Survey, Jan. 30th - 31st and Feb. 4th, 2019, 622n, 3.93% MoE, Weighted Results, Magellan Strategies, 1685 Boxelder St. Suite 300, Louisville, CO 80027, 303-861-8585 Table 9-2 T10. Thinking ahead to the 2020 Presidential primaries next year. Do you want Donald Trump to be the Republican nominee for President or would prefer someone else to be the Republican nominee? AREA YOU LIVE IN FISCAL IDEOLOGY SOCIAL IDEOLOGY TRUMP IMAGE -------------------------------------------------------------------------------------------- -------------------------------------------- -------------------------------------------- ---------------------------------------------
TOTAL ---------
BIG CITY
---------
CITY MEN
---------
CITY WOM
----------
SUB AREA
---------
SUBS MEN
---------
SUBS WOM
---------
SMAL TOWN
---------
RURL AREA
----------
VERY CON
---------
SOME CON
---------
MOD
---------
LIB
---------
VERY CON
---------
SOME CON
----------
MOD
---------
LIB
---------
TOT FAV
---------
VERY FAV
---------
TOT UNFV
----------
VERY UNFV
---------
TOTAL
622 100.0
110 100.0
49 100.0
61 100.0
241 100.0
128 100.0
113 100.0
153 100.0
108 100.0
364 100.0
184 100.0
61 100.0
4 100.0
344 100.0
138 100.0
96 100.0
38 100.0
546 100.0
425 100.0
66 100.0
42 100.0
DONALD TRUMP
483 77.6
86 78.4
38 77.4
48 79.1
182 75.4
101 78.6
81 71.8
126 82.6
83 76.4
312 85.6
133 72.1
32 53.2
1 27.4
294 85.5
108 78.5
59 61.6
18 45.8
474 86.9
405 95.4
3 4.6
SOMEONE ELSE
105 16.8
17 15.3
9 18.0
8 13.2
46 19.1
23 18.3
23 20.0
24 16.0
13 12.2
35 9.7
39 20.9
25 41.0
3 72.6
33 9.6
26 18.9
24 25.3
19 48.8
41 7.6
9 2.0
61 91.7
41 97.9
UNSURE UNDECIDED
35 5.6
7 6.3
2 4.6
5 7.7
13 5.6
4 3.2
9 8.3
2 1.4
12 11.4
17 4.7
13 6.9
4 5.8
17 4.9
4 2.5
13 13.1
2 5.4
30 5.5
11 2.6
2 3.7
1 2.1
REFUSED

Colorado Republican Survey, Jan. 30th - 31st and Feb. 4th, 2019, 622n, 3.93% MoE, Weighted Results, Magellan Strategies, 1685 Boxelder St. Suite 300, Louisville, CO 80027, 303-861-8585 Table 9-3 T10. Thinking ahead to the 2020 Presidential primaries next year. Do you want Donald Trump to be the Republican nominee for President or would prefer someone else to be the Republican nominee? TRUMP APPROVAL CANDIDATE
PREFERENCE ECONOMY BUILD WALL SHUT DOWN FOR WALL 2020
PRIMARY --------------------------------------------- -------------------- --------------------------------- -------------------------------------------- -------------------------------------------- ---------------------
TOTAL ---------
TOT APRV
---------
STRG APRV
---------
TOT DIS
----------
STRG DIS
---------
CON CAND
---------
MOD CAND
---------
BET TER
---------
WOR SE
----------
NO EFCT
---------
TOT SUPP
---------
STRG SUPP
---------
TOT OPP
---------
STRG OPP
---------
TOT SUPP
----------
STRG SUPP
---------
TOT OPP
---------
STRG OPP
---------
TRU MP
---------
SOME ELSE
----------
TOTAL
622 100.0
558 100.0
446 100.0
59 100.0
40 100.0
381 100.0
204 100.0
542 100.0
36 100.0
30 100.0
545 100.0
495 100.0
65 100.0
49 100.0
502 100.0
394 100.0
104 100.0
69 100.0
483 100.0
105 100.0
DONALD TRUMP
483 77.6
479 85.8
425 95.4
3 5.2
1 1.7
342 89.9
115 56.6
467 86.2
3 8.9
8 25.8
475 87.2
452 91.3
3 4.6
2 4.2
451 89.9
374 94.7
20 18.8
8 11.1
483 100.0
SOMEONE ELSE
105 16.8
48 8.6
9 1.9
55 94.8
39 98.3
21 5.6
74 36.4
51 9.3
32 88.9
17 56.2
44 8.0
22 4.4
57 87.0
43 87.5
26 5.2
7 1.8
78 74.9
59 85.5
105 100.0
UNSURE UNDECIDED
35 5.6
31 5.6
12 2.7
17 4.5
14 7.0
24 4.5
1 2.2
5 18.0
26 4.8
21 4.3
5 8.3
4 8.2
25 5.0
13 3.4
7 6.4
2 3.4
REFUSED

Colorado Republican Survey, Jan. 30th - 31st and Feb. 4th, 2019, 622n, 3.93% MoE, Weighted Results, Magellan Strategies, 1685 Boxelder St. Suite 300, Louisville, CO 80027, 303-861-8585 Table 9-4 T10. Thinking ahead to the 2020 Presidential primaries next year. Do you want Donald Trump to be the Republican nominee for President or would prefer someone else to be the Republican nominee? FULL DAY KINDER RED FLAG REGION BY CD --------------------------------------------- -------------------------------------------- -------------------------------------------------------------------------------
TOTAL ---------
TOT SUPP
---------
STRG SUPP
---------
TOT OPP
----------
STRG OPP
---------
TOT SUPP
---------
STRG SUPP
---------
TOT OPP
---------
STRG OPP
----------
CD1
---------
CD2
---------
CD3
---------
CD4
---------
CD5
---------
CD6
----------
CD7
---------
TOTAL
622 100.0
210 100.0
92 100.0
384 100.0
313 100.0
374 100.0
181 100.0
207 100.0
134 100.0
50 100.0
87 100.0
93 100.0
124 100.0
112 100.0
87 100.0
68 100.0
DONALD TRUMP
483 77.6
147 69.8
60 64.7
314 81.9
266 85.0
271 72.6
119 66.0
177 85.6
115 86.1
31 62.2
58 66.1
74 78.9
106 85.3
98 87.6
60 69.4
56 81.5
SOMEONE ELSE
105 16.8
52 24.9
28 30.1
48 12.6
29 9.4
81 21.7
51 28.2
18 8.8
11 7.9
11 22.8
26 29.9
13 14.4
12 10.0
12 10.5
19 21.4
11 16.1
UNSURE UNDECIDED
35 5.6
11 5.2
5 5.2
21 5.5
17 5.6
21 5.7
10 5.8
12 5.6
8 6.0
7 15.0
3 3.9
6 6.7
6 4.7
2 2.0
8 9.2
2 2.4
REFUSED

Colorado Republican Survey, Jan. 30th - 31st and Feb. 4th, 2019, 622n, 3.93% MoE, Weighted Results, Magellan Strategies, 1685 Boxelder St. Suite 300, Louisville, CO 80027, 303-861-8585 Table 10-1 T11. Do you support or oppose state funded, full day kindergarten, regardless of the cost to Colorado taxpayers? GENDER AGE COMBINED AGE TYPE OF REP INCOME PRIMARY V
GENERAL --------------------- -------------------------------------------------------- -------------------------------- -------------------------------- -------------------------------------------- ---------------------
TOTAL ---------
MEN
---------
WOM
---------
18-34
----------
35-44
---------
45-54
---------
55-64
---------
65 PLUS
---------
18-44
----------
45-64
---------
65+
---------
TRAD REP
---------
TRMP REP
---------
OTH REP
---------
LESS 50K
----------
51K 75K
---------
76K 125K
---------
MORE 126K
---------
PRIM
---------
GEN
----------
TOTAL
622 100.0
317 100.0
305 100.0
118 100.0
81 100.0
112 100.0
137 100.0
171 100.0
199 100.0
249 100.0
171 100.0
230 100.0
180 100.0
176 100.0
141 100.0
125 100.0
162 100.0
111 100.0
300 100.0
322 100.0
TOTAL SUPPORT
210 33.8
92 28.9
119 38.9
40 33.5
38 46.9
37 33.3
37 26.8
57 33.4
78 38.9
74 29.7
57 33.4
87 37.6
44 24.4
68 38.8
52 36.6
46 36.4
55 34.2
40 35.5
71 23.5
139 43.3
TOTAL OPPOSE
384 61.7
214 67.5
170 55.7
75 63.6
38 47.3
71 63.7
94 68.7
104 60.5
113 57.0
165 66.5
104 60.5
136 58.8
129 71.7
96 54.3
82 57.8
77 61.3
98 60.4
69 61.9
221 73.6
163 50.6
STRONGLY SUPPORT
92 14.8
33 10.3
59 19.5
21 18.2
21 26.5
16 14.4
10 7.7
21 12.3
43 21.6
27 10.7
21 12.3
33 14.5
16 8.9
38 21.8
24 17.3
20 15.6
25 15.4
19 16.7
21 6.9
72 22.2
SOMEWHAT SUPPORT
118 19.0
59 18.5
59 19.4
18 15.3
16 20.4
21 18.9
26 19.1
36 21.0
35 17.4
47 19.0
36 21.0
53 23.1
28 15.5
30 17.0
27 19.3
26 20.8
31 18.8
21 18.8
50 16.7
68 21.1
STRONGLY OPPOSE
313 50.4
173 54.5
140 46.0
59 49.8
28 35.0
60 53.7
77 56.3
87 51.2
87 43.8
137 55.1
87 51.2
114 49.7
110 60.8
68 38.5
67 47.5
67 53.5
77 47.4
51 46.0
183 61.2
130 40.3
SOMEWHAT OPPOSE
71 11.3
41 13.0
29 9.7
16 13.8
10 12.3
11 10.1
17 12.4
16 9.4
26 13.2
28 11.4
16 9.4
21 9.1
20 10.9
28 15.8
15 10.3
10 7.9
21 13.0
18 16.0
37 12.4
33 10.3
UNSURE NO OPINION
28 4.5
12 3.7
17 5.4
3 2.9
5 5.9
3 3.0
6 4.5
10 6.1
8 4.1
10 3.8
10 6.1
8 3.6
7 4.0
12 6.9
8 5.6
3 2.3
9 5.5
3 2.5
9 2.9
20 6.1
REFUSED

Colorado Republican Survey, Jan. 30th - 31st and Feb. 4th, 2019, 622n, 3.93% MoE, Weighted Results, Magellan Strategies, 1685 Boxelder St. Suite 300, Louisville, CO 80027, 303-861-8585 Table 10-2 T11. Do you support or oppose state funded, full day kindergarten, regardless of the cost to Colorado taxpayers? AREA YOU LIVE IN FISCAL IDEOLOGY SOCIAL IDEOLOGY TRUMP IMAGE -------------------------------------------------------------------------------------------- -------------------------------------------- -------------------------------------------- ---------------------------------------------
TOTAL ---------
BIG CITY
---------
CITY MEN
---------
CITY WOM
----------
SUB AREA
---------
SUBS MEN
---------
SUBS WOM
---------
SMAL TOWN
---------
RURL AREA
----------
VERY CON
---------
SOME CON
---------
MOD
---------
LIB
---------
VERY CON
---------
SOME CON
----------
MOD
---------
LIB
---------
TOT FAV
---------
VERY FAV
---------
TOT UNFV
----------
VERY UNFV
---------
TOTAL
622 100.0
110 100.0
49 100.0
61 100.0
241 100.0
128 100.0
113 100.0
153 100.0
108 100.0
364 100.0
184 100.0
61 100.0
4 100.0
344 100.0
138 100.0
96 100.0
38 100.0
546 100.0
425 100.0
66 100.0
42 100.0
TOTAL SUPPORT
210 33.8
37 33.5
12 24.7
25 40.7
76 31.6
43 33.7
33 29.2
59 38.5
34 31.3
99 27.2
76 41.4
28 46.2
2 57.7
100 29.0
47 33.9
42 43.8
19 49.6
167 30.5
127 29.9
39 58.2
23 54.7
TOTAL OPPOSE
384 61.7
70 63.6
36 73.4
34 55.7
154 63.9
83 65.2
70 62.4
86 56.5
68 62.8
257 70.4
100 54.1
23 37.3
1 28.6
235 68.3
84 61.3
46 47.8
17 43.0
356 65.2
279 65.8
25 38.0
16 39.3
STRONGLY SUPPORT
92 14.8
13 11.5
2 4.0
11 17.6
29 12.0
14 10.7
15 13.4
30 19.6
16 14.9
40 11.0
35 18.8
14 22.9
1 29.2
44 12.7
18 12.8
17 17.8
13 34.8
68 12.5
53 12.5
20 29.8
13 31.7
SOMEWHAT SUPPORT
118 19.0
24 22.0
10 20.6
14 23.1
47 19.6
29 23.0
18 15.8
29 18.9
18 16.3
59 16.2
42 22.7
14 23.3
1 28.5
56 16.4
29 21.2
25 26.1
6 14.9
98 18.0
74 17.4
19 28.4
10 23.1
STRONGLY OPPOSE
313 50.4
54 49.6
29 59.0
26 42.0
125 51.7
66 51.7
59 51.8
73 47.8
56 51.6
221 60.6
74 40.2
14 23.1
1 14.9
201 58.5
67 48.5
33 34.4
11 28.0
299 54.7
239 56.3
12 17.6
7 17.6
SOMEWHAT OPPOSE
71 11.3
15 14.0
7 14.4
8 13.6
29 12.2
17 13.6
12 10.6
13 8.6
12 11.2
36 9.8
26 13.9
9 14.2
1 13.7
34 9.8
18 12.8
13 13.4
6 15.1
57 10.4
40 9.4
14 20.4
9 21.7
UNSURE NO OPINION
28 4.5
3 2.9
1 1.9
2 3.7
11 4.5
1 1.1
10 8.4
8 5.1
6 5.9
9 2.4
8 4.4
10 16.5
1 13.7
9 2.6
6 4.7
8 8.4
3 7.3
23 4.3
19 4.4
2 3.7
2 6.0
REFUSED

Colorado Republican Survey, Jan. 30th - 31st and Feb. 4th, 2019, 622n, 3.93% MoE, Weighted Results, Magellan Strategies, 1685 Boxelder St. Suite 300, Louisville, CO 80027, 303-861-8585 Table 10-3 T11. Do you support or oppose state funded, full day kindergarten, regardless of the cost to Colorado taxpayers? TRUMP APPROVAL CANDIDATE
PREFERENCE ECONOMY BUILD WALL SHUT DOWN FOR WALL 2020
PRIMARY --------------------------------------------- -------------------- --------------------------------- -------------------------------------------- -------------------------------------------- ---------------------
TOTAL ---------
TOT APRV
---------
STRG APRV
---------
TOT DIS
----------
STRG DIS
---------
CON CAND
---------
MOD CAND
---------
BET TER
---------
WOR SE
----------
NO EFCT
---------
TOT SUPP
---------
STRG SUPP
---------
TOT OPP
---------
STRG OPP
---------
TOT SUPP
----------
STRG SUPP
---------
TOT OPP
---------
STRG OPP
---------
TRU MP
---------
SOME ELSE
----------
TOTAL
622 100.0
558 100.0
446 100.0
59 100.0
40 100.0
381 100.0
204 100.0
542 100.0
36 100.0
30 100.0
545 100.0
495 100.0
65 100.0
49 100.0
502 100.0
394 100.0
104 100.0
69 100.0
483 100.0
105 100.0
TOTAL SUPPORT
210 33.8
172 30.7
134 30.1
36 61.0
22 55.6
113 29.8
86 42.2
162 30.0
21 58.4
19 62.3
175 32.1
153 31.0
30 46.4
26 54.0
159 31.7
123 31.3
49 47.4
34 48.8
147 30.4
52 50.1
TOTAL OPPOSE
384 61.7
363 65.1
293 65.7
20 33.6
16 41.0
255 67.0
104 51.2
357 65.9
14 39.9
9 29.2
348 63.8
323 65.2
30 46.4
18 36.3
326 64.9
255 64.8
45 43.1
31 44.3
314 65.1
48 46.3
STRONGLY SUPPORT
92 14.8
68 12.1
57 12.7
23 39.7
14 35.5
44 11.6
45 22.2
68 12.6
11 31.3
9 29.1
74 13.6
68 13.7
15 23.6
14 28.8
62 12.4
49 12.5
29 27.9
19 27.4
60 12.4
28 26.5
SOMEWHAT SUPPORT
118 19.0
104 18.6
77 17.4
12 21.3
8 20.1
69 18.2
41 20.0
94 17.3
10 27.0
10 33.2
101 18.6
86 17.3
15 22.7
12 25.2
97 19.2
74 18.7
20 19.6
15 21.4
87 18.0
25 23.6
STRONGLY OPPOSE
313 50.4
303 54.2
252 56.4
10 16.9
9 23.1
227 59.5
70 34.3
295 54.4
8 23.1
8 27.2
289 53.1
273 55.2
20 30.2
10 20.4
276 55.1
221 56.0
25 24.1
17 25.1
266 55.2
29 28.2
SOMEWHAT OPPOSE
71 11.3
61 10.9
42 9.3
10 16.7
7 18.0
28 7.5
34 16.9
62 11.5
6 16.8
1 2.1
58 10.7
49 10.0
11 16.1
8 15.9
50 9.9
35 8.8
20 19.0
13 19.2
48 9.9
19 18.1
UNSURE NO OPINION
28 4.5
23 4.2
19 4.2
3 5.4
1 3.4
12 3.2
13 6.6
22 4.1
1 1.8
3 8.5
22 4.0
19 3.8
5 7.3
5 9.8
17 3.4
16 4.0
10 9.5
5 6.9
22 4.5
4 3.6
REFUSED

Colorado Republican Survey, Jan. 30th - 31st and Feb. 4th, 2019, 622n, 3.93% MoE, Weighted Results, Magellan Strategies, 1685 Boxelder St. Suite 300, Louisville, CO 80027, 303-861-8585 Table 10-4 T11. Do you support or oppose state funded, full day kindergarten, regardless of the cost to Colorado taxpayers? FULL DAY KINDER RED FLAG REGION BY CD --------------------------------------------- -------------------------------------------- -------------------------------------------------------------------------------
TOTAL ---------
TOT SUPP
---------
STRG SUPP
---------
TOT OPP
----------
STRG OPP
---------
TOT SUPP
---------
STRG SUPP
---------
TOT OPP
---------
STRG OPP
----------
CD1
---------
CD2
---------
CD3
---------
CD4
---------
CD5
---------
CD6
----------
CD7
---------
TOTAL
622 100.0
210 100.0
92 100.0
384 100.0
313 100.0
374 100.0
181 100.0
207 100.0
134 100.0
50 100.0
87 100.0
93 100.0
124 100.0
112 100.0
87 100.0
68 100.0
TOTAL SUPPORT
210 33.8
210 100.0
92 100.0
157 42.1
93 51.4
41 19.9
25 18.8
16 31.3
40 45.5
29 30.8
40 32.4
38 34.3
30 34.1
18 25.9
TOTAL OPPOSE
384 61.7
384 100.0
313 100.0
201 53.8
77 42.7
154 74.5
103 76.6
31 62.3
41 47.2
61 64.9
81 64.8
71 63.2
52 59.4
48 70.3
STRONGLY SUPPORT
92 14.8
92 43.9
92 100.0
70 18.7
46 25.4
16 7.7
7 4.9
6 12.7
16 18.2
18 19.3
15 12.3
18 16.4
12 13.9
6 9.0
SOMEWHAT SUPPORT
118 19.0
118 56.1
87 23.3
47 26.0
25 12.2
19 14.0
9 18.5
24 27.3
11 11.5
25 20.1
20 17.9
18 20.2
12 16.9
STRONGLY OPPOSE
313 50.4
313 81.6
313 100.0
151 40.3
62 34.1
141 68.2
93 69.6
24 49.2
35 40.5
48 51.0
69 55.2
54 48.2
44 50.1
40 58.0
SOMEWHAT OPPOSE
71 11.3
71 18.4
51 13.5
16 8.6
13 6.3
9 7.0
7 13.2
6 6.7
13 13.9
12 9.6
17 14.9
8 9.3
8 12.2
UNSURE NO OPINION
28 4.5
15 4.1
11 5.9
12 5.6
6 4.6
3 6.4
6 7.2
4 4.3
4 2.9
3 2.5
6 6.5
3 3.8
REFUSED

Colorado Republican Survey, Jan. 30th - 31st and Feb. 4th, 2019, 622n, 3.93% MoE, Weighted Results, Magellan Strategies, 1685 Boxelder St. Suite 300, Louisville, CO 80027, 303-861-8585 Table 11-1 T12. During the state legislative session last year, a bill was introduced called the "Red Flag" law. The Red Flag law allows a judge to take guns temporarily from someone who is determined to be a significant risk to themselves or others, based on evidence presented to the judge. Knowing this information, do you support or oppose the Red Flag law? GENDER AGE COMBINED AGE TYPE OF REP INCOME PRIMARY V
GENERAL --------------------- -------------------------------------------------------- -------------------------------- -------------------------------- -------------------------------------------- ---------------------
TOTAL ---------
MEN
---------
WOM
---------
18-34
----------
35-44
---------
45-54
---------
55-64
---------
65 PLUS
---------
18-44
----------
45-64
---------
65+
---------
TRAD REP
---------
TRMP REP
---------
OTH REP
---------
LESS 50K
----------
51K 75K
---------
76K 125K
---------
MORE 126K
---------
PRIM
---------
GEN
----------
TOTAL
622 100.0
317 100.0
305 100.0
118 100.0
81 100.0
112 100.0
137 100.0
171 100.0
199 100.0
249 100.0
171 100.0
230 100.0
180 100.0
176 100.0
141 100.0
125 100.0
162 100.0
111 100.0
300 100.0
322 100.0
TOTAL SUPPORT
374 60.1
180 56.6
194 63.8
67 56.9
54 66.2
62 55.8
81 59.2
107 62.3
121 60.7
143 57.7
107 62.3
145 62.8
104 57.5
107 60.6
77 54.6
82 65.1
104 64.1
68 61.2
163 54.3
211 65.5
TOTAL OPPOSE
207 33.2
122 38.5
85 27.7
49 41.5
24 30.3
41 36.7
49 35.8
43 25.0
74 37.0
90 36.2
43 25.0
71 31.0
64 35.7
61 34.6
52 36.9
39 31.4
50 30.7
36 32.3
120 40.1
86 26.8
STRONGLY SUPPORT
181 29.1
74 23.2
107 35.2
31 25.8
29 36.3
33 29.6
32 23.6
54 31.5
60 30.1
65 26.3
54 31.5
79 34.5
44 24.2
52 29.6
38 27.2
38 30.1
50 30.9
32 28.5
76 25.3
105 32.6
SOMEWHAT SUPPORT
193 31.0
106 33.4
87 28.6
37 31.1
24 29.9
29 26.2
49 35.6
53 30.7
61 30.6
78 31.3
53 30.7
65 28.3
60 33.3
55 31.0
39 27.4
44 35.0
54 33.3
37 32.8
87 29.0
106 32.9
STRONGLY OPPOSE
134 21.6
76 23.9
58 19.1
37 31.1
13 16.3
28 25.4
30 21.9
26 15.0
50 25.1
58 23.5
26 15.0
47 20.6
46 25.7
39 21.9
37 26.0
23 18.6
38 23.7
22 20.0
79 26.5
55 17.0
SOMEWHAT OPPOSE
72 11.6
46 14.6
26 8.6
12 10.4
11 14.0
13 11.3
19 13.9
17 10.1
24 11.9
32 12.7
17 10.1
24 10.4
18 10.0
22 12.7
15 10.9
16 12.9
12 7.1
14 12.3
41 13.6
32 9.9
UNSURE NO OPINION
41 6.6
15 4.7
26 8.5
2 1.5
3 3.5
8 7.5
7 5.0
21 12.4
5 2.3
15 6.1
21 12.4
14 5.9
12 6.8
8 4.8
12 8.5
4 3.5
8 5.1
7 6.5
17 5.6
24 7.5
REFUSED
1 0.1
1 0.2
1 0.3
1 0.3
1 0.3
1 0.2

Colorado Republican Survey, Jan. 30th - 31st and Feb. 4th, 2019, 622n, 3.93% MoE, Weighted Results, Magellan Strategies, 1685 Boxelder St. Suite 300, Louisville, CO 80027, 303-861-8585 Table 11-2 T12. During the state legislative session last year, a bill was introduced called the "Red Flag" law. The Red Flag law allows a judge to take guns temporarily from someone who is determined to be a significant risk to themselves or others, based on evidence presented to the judge. Knowing this information, do you support or oppose the Red Flag law? AREA YOU LIVE IN FISCAL IDEOLOGY SOCIAL IDEOLOGY TRUMP IMAGE -------------------------------------------------------------------------------------------- -------------------------------------------- -------------------------------------------- ---------------------------------------------
TOTAL ---------
BIG CITY
---------
CITY MEN
---------
CITY WOM
----------
SUB AREA
---------
SUBS MEN
---------
SUBS WOM
---------
SMAL TOWN
---------
RURL AREA
----------
VERY CON
---------
SOME CON
---------
MOD
---------
LIB
---------
VERY CON
---------
SOME CON
----------
MOD
---------
LIB
---------
TOT FAV
---------
VERY FAV
---------
TOT UNFV
----------
VERY UNFV
---------
TOTAL
622 100.0
110 100.0
49 100.0
61 100.0
241 100.0
128 100.0
113 100.0
153 100.0
108 100.0
364 100.0
184 100.0
61 100.0
4 100.0
344 100.0
138 100.0
96 100.0
38 100.0
546 100.0
425 100.0
66 100.0
42 100.0
TOTAL SUPPORT
374 60.1
70 63.5
27 56.1
42 69.5
152 62.9
80 62.3
72 63.6
91 59.8
56 51.7
199 54.6
124 67.2
44 72.4
3 72.1
192 55.9
91 66.1
60 62.2
28 74.0
318 58.3
233 54.9
52 79.0
34 81.2
TOTAL OPPOSE
207 33.2
31 27.9
16 32.8
15 24.0
72 29.8
45 35.0
27 23.9
56 36.7
45 41.4
147 40.3
47 25.5
11 17.7
127 36.8
38 27.3
31 32.2
9 24.1
189 34.6
158 37.3
11 16.6
5 11.8
STRONGLY SUPPORT
181 29.1
37 33.4
13 26.4
24 39.0
73 30.4
31 24.5
42 37.1
47 30.8
20 18.9
92 25.2
60 32.5
26 42.3
2 58.4
93 27.1
42 30.3
25 26.2
20 51.6
144 26.5
109 25.6
35 52.6
23 56.4
SOMEWHAT SUPPORT
193 31.0
33 30.1
14 29.7
19 30.5
78 32.5
48 37.8
30 26.5
44 29.0
36 32.8
107 29.4
64 34.7
18 30.1
1 13.7
99 28.8
49 35.9
34 35.9
9 22.4
174 31.9
125 29.3
18 26.4
10 24.8
STRONGLY OPPOSE
134 21.6
20 18.4
12 24.8
8 13.3
48 19.9
25 19.6
23 20.3
35 22.6
30 27.6
101 27.6
27 14.5
7 11.0
83 24.1
25 18.3
20 20.9
5 13.8
125 22.8
106 24.9
6 9.6
1 2.9
SOMEWHAT OPPOSE
72 11.6
10 9.5
4 8.0
6 10.7
24 9.9
20 15.4
4 3.7
22 14.1
15 13.8
46 12.7
20 11.0
4 6.7
44 12.7
12 9.0
11 11.3
4 10.2
64 11.7
52 12.3
5 7.0
4 8.9
UNSURE NO OPINION
41 6.6
9 8.0
5 9.9
4 6.4
18 7.3
3 2.7
14 12.5
5 3.5
7 6.9
19 5.1
13 7.0
6 9.9
1 27.9
25 7.1
9 6.5
5 5.6
1 1.9
38 7.0
32 7.7
3 4.4
3 7.0
REFUSED
1 0.1
1 0.5
1 1.2
1 0.3
1 0.2
1 0.1
1 0.1

Colorado Republican Survey, Jan. 30th - 31st and Feb. 4th, 2019, 622n, 3.93% MoE, Weighted Results, Magellan Strategies, 1685 Boxelder St. Suite 300, Louisville, CO 80027, 303-861-8585 Table 11-3 T12. During the state legislative session last year, a bill was introduced called the "Red Flag" law. The Red Flag law allows a judge to take guns temporarily from someone who is determined to be a significant risk to themselves or others, based on evidence presented to the judge. Knowing this information, do you support or oppose the Red Flag law? TRUMP APPROVAL CANDIDATE
PREFERENCE ECONOMY BUILD WALL SHUT DOWN FOR WALL 2020
PRIMARY --------------------------------------------- -------------------- --------------------------------- -------------------------------------------- -------------------------------------------- ---------------------
TOTAL ---------
TOT APRV
---------
STRG APRV
---------
TOT DIS
----------
STRG DIS
---------
CON CAND
---------
MOD CAND
---------
BET TER
---------
WOR SE
----------
NO EFCT
---------
TOT SUPP
---------
STRG SUPP
---------
TOT OPP
---------
STRG OPP
---------
TOT SUPP
----------
STRG SUPP
---------
TOT OPP
---------
STRG OPP
---------
TRU MP
---------
SOME ELSE
----------
TOTAL
622 100.0
558 100.0
446 100.0
59 100.0
40 100.0
381 100.0
204 100.0
542 100.0
36 100.0
30 100.0
545 100.0
495 100.0
65 100.0
49 100.0
502 100.0
394 100.0
104 100.0
69 100.0
483 100.0
105 100.0
TOTAL SUPPORT
374 60.1
324 58.1
250 56.0
47 79.5
33 81.8
204 53.6
153 75.3
315 58.1
29 81.3
21 71.3
318 58.4
276 55.8
48 73.2
39 79.5
284 56.6
212 53.8
80 77.1
54 78.1
271 56.2
81 77.7
TOTAL OPPOSE
207 33.2
196 35.1
162 36.3
9 15.5
6 15.1
157 41.1
37 18.1
191 35.4
3 8.4
7 24.4
189 34.8
184 37.1
14 21.1
8 16.4
185 36.9
157 39.8
17 16.6
12 16.7
177 36.6
18 17.4
STRONGLY SUPPORT
181 29.1
149 26.8
112 25.0
31 52.4
22 55.6
91 23.9
83 40.8
141 26.0
22 61.9
13 43.2
144 26.4
121 24.5
31 47.5
28 57.2
123 24.4
90 22.8
54 52.2
35 50.0
119 24.8
51 48.7
SOMEWHAT SUPPORT
193 31.0
175 31.4
138 31.0
16 27.1
10 26.2
113 29.7
70 34.5
174 32.1
7 19.4
8 28.1
174 32.0
155 31.3
17 25.8
11 22.3
161 32.2
122 31.1
26 24.9
19 28.1
152 31.5
30 29.0
STRONGLY OPPOSE
134 21.6
129 23.2
107 23.9
3 5.2
3 7.7
106 27.9
19 9.4
123 22.8
2 6.7
4 12.0
122 22.4
117 23.7
9 13.0
5 10.7
120 23.8
107 27.1
11 10.9
7 10.3
115 23.9
11 10.1
SOMEWHAT OPPOSE
72 11.6
66 11.9
55 12.4
6 10.3
3 7.4
50 13.2
18 8.7
68 12.6
1 1.6
4 12.5
67 12.3
66 13.4
5 8.1
3 5.8
65 13.0
50 12.7
6 5.8
4 6.4
61 12.7
8 7.3
UNSURE NO OPINION
41 6.6
37 6.7
34 7.6
3 5.0
1 3.1
20 5.3
13 6.6
35 6.4
4 10.3
1 4.3
36 6.7
34 6.9
4 5.6
2 4.0
32 6.4
25 6.4
7 6.2
4 5.2
34 7.0
5 4.9
REFUSED
1 0.1
1 0.1
1 0.1
1 0.1
1 0.1
1 0.1
1 0.1
1 0.1

Colorado Republican Survey, Jan. 30th - 31st and Feb. 4th, 2019, 622n, 3.93% MoE, Weighted Results, Magellan Strategies, 1685 Boxelder St. Suite 300, Louisville, CO 80027, 303-861-8585 Table 11-4 T12. During the state legislative session last year, a bill was introduced called the "Red Flag" law. The Red Flag law allows a judge to take guns temporarily from someone who is determined to be a significant risk to themselves or others, based on evidence presented to the judge. Knowing this information, do you support or oppose the Red Flag law? FULL DAY KINDER RED FLAG REGION BY CD --------------------------------------------- -------------------------------------------- -------------------------------------------------------------------------------
TOTAL ---------
TOT SUPP
---------
STRG SUPP
---------
TOT OPP
----------
STRG OPP
---------
TOT SUPP
---------
STRG SUPP
---------
TOT OPP
---------
STRG OPP
----------
CD1
---------
CD2
---------
CD3
---------
CD4
---------
CD5
---------
CD6
----------
CD7
---------
TOTAL
622 100.0
210 100.0
92 100.0
384 100.0
313 100.0
374 100.0
181 100.0
207 100.0
134 100.0
50 100.0
87 100.0
93 100.0
124 100.0
112 100.0
87 100.0
68 100.0
TOTAL SUPPORT
374 60.1
157 74.9
70 76.0
201 52.4
151 48.1
374 100.0
181 100.0
34 67.9
50 57.9
50 53.9
76 61.0
60 54.0
61 70.2
42 61.2
TOTAL OPPOSE
207 33.2
41 19.6
16 17.2
154 40.1
141 45.0
207 100.0
134 100.0
12 24.4
29 33.8
33 35.8
41 33.2
44 39.5
26 29.8
20 29.5
STRONGLY SUPPORT
181 29.1
93 44.3
46 49.9
77 20.1
62 19.7
181 48.4
181 100.0
19 37.4
25 28.7
22 24.1
35 27.9
29 26.0
33 38.3
18 25.7
SOMEWHAT SUPPORT
193 31.0
64 30.6
24 26.1
124 32.3
89 28.4
193 51.6
15 30.5
25 29.1
28 29.8
41 33.1
31 28.0
28 31.9
24 35.5
STRONGLY OPPOSE
134 21.6
25 12.0
7 7.1
103 26.8
93 29.8
134 64.9
134 100.0
10 20.2
16 18.3
27 28.5
27 21.6
26 23.2
18 21.2
10 14.8
SOMEWHAT OPPOSE
72 11.6
16 7.5
9 10.1
51 13.3
47 15.2
72 35.1
2 4.2
14 15.5
7 7.2
14 11.6
18 16.2
7 8.5
10 14.7
UNSURE NO OPINION
41 6.6
12 5.6
6 6.9
28 7.3
21 6.8
4 7.6
7 8.3
10 10.4
7 5.8
7 6.5
6 8.5
REFUSED
1 0.1
1 0.2
1 0.2
1 0.9

Colorado Republican Survey, Jan. 30th - 31st and Feb. 4th, 2019, 622n, 3.93% MoE, Weighted Results, Magellan Strategies, 1685 Boxelder St. Suite 300, Louisville, CO 80027, 303-861-8585 Table 12-1 T13. Among the different groups of voters within the Republican Party, which of the following best describes the kind of Republican you consider yourself to be? Please wait to hear all options... GENDER AGE COMBINED AGE TYPE OF REP INCOME PRIMARY V
GENERAL --------------------- -------------------------------------------------------- -------------------------------- -------------------------------- -------------------------------------------- ---------------------
TOTAL ---------
MEN
---------
WOM
---------
18-34
----------
35-44
---------
45-54
---------
55-64
---------
65 PLUS
---------
18-44
----------
45-64
---------
65+
---------
TRAD REP
---------
TRMP REP
---------
OTH REP
---------
LESS 50K
----------
51K 75K
---------
76K 125K
---------
MORE 126K
---------
PRIM
---------
GEN
----------
TOTAL
622 100.0
317 100.0
305 100.0
118 100.0
81 100.0
112 100.0
137 100.0
171 100.0
199 100.0
249 100.0
171 100.0
230 100.0
180 100.0
176 100.0
141 100.0
125 100.0
162 100.0
111 100.0
300 100.0
322 100.0
"TRADITIONAL" REPUBLICAN
230 37.0
118 37.2
112 36.8
38 31.8
27 33.0
46 40.7
48 35.1
71 41.5
64 32.3
94 37.6
71 41.5
230 100.0
51 35.9
51 41.1
58 35.7
50 44.6
114 37.9
117 36.2
TRUMP REPUBLICAN
180 29.0
96 30.1
85 27.8
26 22.2
16 19.8
26 23.1
48 34.8
63 36.9
42 21.3
73 29.5
63 36.9
180 100.0
47 33.0
29 23.1
54 33.3
22 19.8
106 35.5
74 22.9
OTHER
176 28.3
90 28.3
86 28.3
47 39.9
34 42.0
35 31.1
35 25.4
25 14.9
81 40.7
70 27.9
25 14.9
176 100.0
37 26.0
36 29.1
41 25.1
37 33.3
65 21.8
111 34.4
UNSURE NO OPINION
35 5.7
14 4.3
22 7.1
7 6.1
4 5.2
6 5.2
7 4.8
12 6.8
11 5.7
12 4.9
12 6.8
7 5.2
8 6.7
10 5.9
3 2.3
14 4.8
21 6.5

Colorado Republican Survey, Jan. 30th - 31st and Feb. 4th, 2019, 622n, 3.93% MoE, Weighted Results, Magellan Strategies, 1685 Boxelder St. Suite 300, Louisville, CO 80027, 303-861-8585 Table 12-2 T13. Among the different groups of voters within the Republican Party, which of the following best describes the kind of Republican you consider yourself to be? Please wait to hear all options... AREA YOU LIVE IN FISCAL IDEOLOGY SOCIAL IDEOLOGY TRUMP IMAGE -------------------------------------------------------------------------------------------- -------------------------------------------- -------------------------------------------- ---------------------------------------------
TOTAL ---------
BIG CITY
---------
CITY MEN
---------
CITY WOM
----------
SUB AREA
---------
SUBS MEN
---------
SUBS WOM
---------
SMAL TOWN
---------
RURL AREA
----------
VERY CON
---------
SOME CON
---------
MOD
---------
LIB
---------
VERY CON
---------
SOME CON
----------
MOD
---------
LIB
---------
TOT FAV
---------
VERY FAV
---------
TOT UNFV
----------
VERY UNFV
---------
TOTAL
622 100.0
110 100.0
49 100.0
61 100.0
241 100.0
128 100.0
113 100.0
153 100.0
108 100.0
364 100.0
184 100.0
61 100.0
4 100.0
344 100.0
138 100.0
96 100.0
38 100.0
546 100.0
425 100.0
66 100.0
42 100.0
"TRADITIONAL" REPUBLICAN
230 37.0
51 46.9
19 39.9
32 52.5
83 34.4
46 36.3
36 32.2
54 35.3
39 36.4
142 38.9
72 38.8
15 24.5
136 39.5
59 43.0
24 25.4
9 23.9
207 37.9
155 36.6
22 33.1
16 37.5
TRUMP REPUBLICAN
180 29.0
30 27.5
14 29.6
16 25.9
66 27.3
40 31.6
25 22.6
51 33.6
30 27.6
127 34.8
43 23.4
10 16.2
1 13.7
118 34.2
38 27.9
16 16.2
6 16.1
177 32.5
172 40.5
1 1.2
OTHER
176 28.3
27 24.7
14 28.7
13 21.6
78 32.2
36 27.9
42 37.1
37 24.5
30 28.1
76 20.8
63 34.0
32 52.2
4 86.3
72 20.9
31 22.4
53 54.9
20 53.0
130 23.9
71 16.8
42 63.6
25 60.9
UNSURE NO OPINION
35 5.7
1 0.8
1 1.9
15 6.1
5 4.3
9 8.2
10 6.7
9 7.9
20 5.5
7 3.8
4 7.1
19 5.5
9 6.6
3 3.5
3 7.1
31 5.7
26 6.1
1 2.1
1 1.5

Colorado Republican Survey, Jan. 30th - 31st and Feb. 4th, 2019, 622n, 3.93% MoE, Weighted Results, Magellan Strategies, 1685 Boxelder St. Suite 300, Louisville, CO 80027, 303-861-8585 Table 12-3 T13. Among the different groups of voters within the Republican Party, which of the following best describes the kind of Republican you consider yourself to be? Please wait to hear all options... TRUMP APPROVAL CANDIDATE
PREFERENCE ECONOMY BUILD WALL SHUT DOWN FOR WALL 2020
PRIMARY --------------------------------------------- -------------------- --------------------------------- -------------------------------------------- -------------------------------------------- ---------------------
TOTAL ---------
TOT APRV
---------
STRG APRV
---------
TOT DIS
----------
STRG DIS
---------
CON CAND
---------
MOD CAND
---------
BET TER
---------
WOR SE
----------
NO EFCT
---------
TOT SUPP
---------
STRG SUPP
---------
TOT OPP
---------
STRG OPP
---------
TOT SUPP
----------
STRG SUPP
---------
TOT OPP
---------
STRG OPP
---------
TRU MP
---------
SOME ELSE
----------
TOTAL
622 100.0
558 100.0
446 100.0
59 100.0
40 100.0
381 100.0
204 100.0
542 100.0
36 100.0
30 100.0
545 100.0
495 100.0
65 100.0
49 100.0
502 100.0
394 100.0
104 100.0
69 100.0
483 100.0
105 100.0
"TRADITIONAL" REPUBLICAN
230 37.0
211 37.8
159 35.7
18 31.3
16 39.4
146 38.3
72 35.5
202 37.4
14 38.3
10 33.4
209 38.4
186 37.6
18 27.4
15 30.3
190 37.9
135 34.2
32 30.5
25 36.3
181 37.5
36 34.3
TRUMP REPUBLICAN
180 29.0
180 32.2
172 38.6
1 1.2
142 37.2
33 16.3
177 32.7
2 6.3
178 32.7
174 35.2
1 1.5
173 34.4
154 39.0
5 5.3
1 2.0
176 36.5
OTHER
176 28.3
137 24.6
89 20.0
36 61.7
23 59.0
72 18.9
92 45.0
132 24.4
20 55.4
16 54.3
126 23.1
105 21.2
44 67.7
33 68.4
108 21.5
79 20.1
63 60.4
40 58.0
97 20.2
64 61.4
UNSURE NO OPINION
35 5.7
30 5.4
25 5.7
3 5.8
1 1.6
21 5.6
6 3.2
30 5.4
2 6.3
2 5.9
31 5.8
30 6.1
2 3.4
1 1.3
31 6.2
26 6.7
4 3.9
3 3.7
28 5.8
4 4.2

Colorado Republican Survey, Jan. 30th - 31st and Feb. 4th, 2019, 622n, 3.93% MoE, Weighted Results, Magellan Strategies, 1685 Boxelder St. Suite 300, Louisville, CO 80027, 303-861-8585 Table 12-4 T13. Among the different groups of voters within the Republican Party, which of the following best describes the kind of Republican you consider yourself to be? Please wait to hear all options... FULL DAY KINDER RED FLAG REGION BY CD --------------------------------------------- -------------------------------------------- -------------------------------------------------------------------------------
TOTAL ---------
TOT SUPP
---------
STRG SUPP
---------
TOT OPP
----------
STRG OPP
---------
TOT SUPP
---------
STRG SUPP
---------
TOT OPP
---------
STRG OPP
----------
CD1
---------
CD2
---------
CD3
---------
CD4
---------
CD5
---------
CD6
----------
CD7
---------
TOTAL
622 100.0
210 100.0
92 100.0
384 100.0
313 100.0
374 100.0
181 100.0
207 100.0
134 100.0
50 100.0
87 100.0
93 100.0
124 100.0
112 100.0
87 100.0
68 100.0
"TRADITIONAL" REPUBLICAN
230 37.0
87 41.2
33 36.1
136 35.3
114 36.5
145 38.7
79 44.0
71 34.6
47 35.4
19 38.9
23 26.8
28 29.7
48 38.6
52 46.5
34 38.8
26 37.9
TRUMP REPUBLICAN
180 29.0
44 20.9
16 17.4
129 33.7
110 35.0
104 27.7
44 24.1
64 31.2
46 34.6
11 21.7
30 34.7
37 39.4
29 23.7
30 26.8
21 24.0
22 32.6
OTHER
176 28.3
68 32.5
38 41.6
96 24.9
68 21.7
107 28.5
52 28.8
61 29.5
39 28.8
19 38.0
29 33.3
26 27.7
38 30.8
22 19.7
29 33.6
13 18.6
UNSURE NO OPINION
35 5.7
11 5.4
5 4.9
23 6.1
21 6.8
19 5.1
6 3.1
10 4.7
2 1.3
1 1.3
4 5.2
3 3.2
9 6.9
8 7.1
3 3.6
7 10.9

Colorado Republican Survey, Jan. 30th - 31st and Feb. 4th, 2019, 622n, 3.93% MoE, Weighted Results, Magellan Strategies, 1685 Boxelder St. Suite 300, Louisville, CO 80027, 303-861-8585 Table 13-1 T14. Do you consider yourself to be very conservative, somewhat conservative, moderate or liberal when it comes to fiscal issues like taxes and government spending? GENDER AGE COMBINED AGE TYPE OF REP INCOME PRIMARY V
GENERAL --------------------- -------------------------------------------------------- -------------------------------- -------------------------------- -------------------------------------------- ---------------------
TOTAL ---------
MEN
---------
WOM
---------
18-34
----------
35-44
---------
45-54
---------
55-64
---------
65 PLUS
---------
18-44
----------
45-64
---------
65+
---------
TRAD REP
---------
TRMP REP
---------
OTH REP
---------
LESS 50K
----------
51K 75K
---------
76K 125K
---------
MORE 126K
---------
PRIM
---------
GEN
----------
TOTAL
622 100.0
317 100.0
305 100.0
118 100.0
81 100.0
112 100.0
137 100.0
171 100.0
199 100.0
249 100.0
171 100.0
230 100.0
180 100.0
176 100.0
141 100.0
125 100.0
162 100.0
111 100.0
300 100.0
322 100.0
VERY CONSERVATIVE
364 58.6
199 62.7
165 54.3
71 59.9
46 56.7
69 61.6
76 55.3
102 59.4
117 58.6
145 58.2
102 59.4
142 61.6
127 70.3
76 43.0
75 52.8
70 55.7
107 66.2
68 61.0
196 65.5
168 52.2
SOMEWHAT CONSERVATIVE
184 29.7
90 28.4
94 30.9
35 29.6
23 28.5
30 27.1
45 32.6
50 29.1
58 29.2
75 30.1
50 29.1
72 31.1
43 23.9
63 35.6
47 33.4
45 36.2
38 23.4
30 27.0
85 28.2
100 31.0
MODERATE
61 9.8
25 7.9
36 11.7
12 10.5
11 13.3
12 10.4
12 8.4
14 8.4
23 11.6
23 9.3
14 8.4
15 6.5
10 5.5
32 18.0
15 10.8
7 5.6
15 8.9
13 11.5
19 6.3
42 13.0
LIBERAL
4 0.7
2 0.7
2 0.6
1 1.5
3 1.7
1 0.6
3 1.7
1 0.3
4 2.0
1 0.8
1 0.7
1 0.5
4 1.3
DON'T KNOW REFUSED
8 1.3
1 0.2
8 2.5
1 0.8
5 3.6
2 1.4
6 2.4
2 1.4
2 0.9
2 1.4
3 2.2
3 2.5
1 0.7
8 2.6
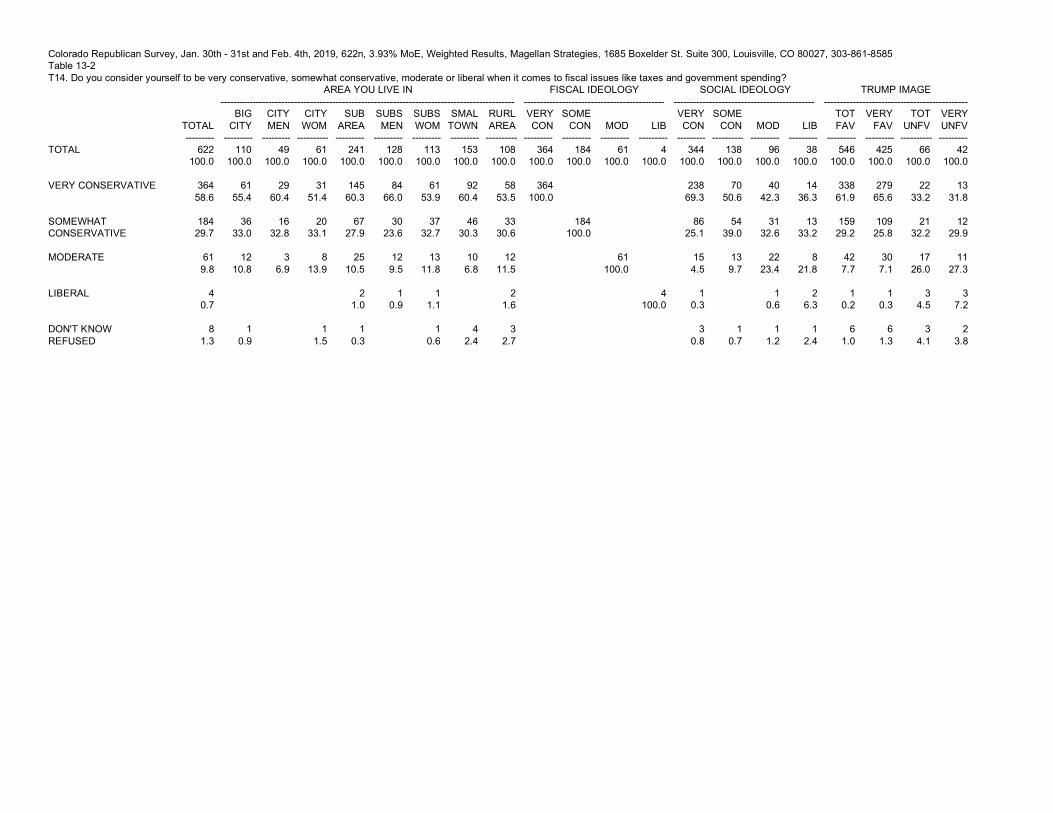
Colorado Republican Survey, Jan. 30th - 31st and Feb. 4th, 2019, 622n, 3.93% MoE, Weighted Results, Magellan Strategies, 1685 Boxelder St. Suite 300, Louisville, CO 80027, 303-861-8585 Table 13-2 T14. Do you consider yourself to be very conservative, somewhat conservative, moderate or liberal when it comes to fiscal issues like taxes and government spending? AREA YOU LIVE IN FISCAL IDEOLOGY SOCIAL IDEOLOGY TRUMP IMAGE -------------------------------------------------------------------------------------------- -------------------------------------------- -------------------------------------------- ---------------------------------------------
TOTAL ---------
BIG CITY
---------
CITY MEN
---------
CITY WOM
----------
SUB AREA
---------
SUBS MEN
---------
SUBS WOM
---------
SMAL TOWN
---------
RURL AREA
----------
VERY CON
---------
SOME CON
---------
MOD
---------
LIB
---------
VERY CON
---------
SOME CON
----------
MOD
---------
LIB
---------
TOT FAV
---------
VERY FAV
---------
TOT UNFV
----------
VERY UNFV
---------
TOTAL
622 100.0
110 100.0
49 100.0
61 100.0
241 100.0
128 100.0
113 100.0
153 100.0
108 100.0
364 100.0
184 100.0
61 100.0
4 100.0
344 100.0
138 100.0
96 100.0
38 100.0
546 100.0
425 100.0
66 100.0
42 100.0
VERY CONSERVATIVE
364 58.6
61 55.4
29 60.4
31 51.4
145 60.3
84 66.0
61 53.9
92 60.4
58 53.5
364 100.0
238 69.3
70 50.6
40 42.3
14 36.3
338 61.9
279 65.6
22 33.2
13 31.8
SOMEWHAT CONSERVATIVE
184 29.7
36 33.0
16 32.8
20 33.1
67 27.9
30 23.6
37 32.7
46 30.3
33 30.6
184 100.0
86 25.1
54 39.0
31 32.6
13 33.2
159 29.2
109 25.8
21 32.2
12 29.9
MODERATE
61 9.8
12 10.8
3 6.9
8 13.9
25 10.5
12 9.5
13 11.8
10 6.8
12 11.5
61 100.0
15 4.5
13 9.7
22 23.4
8 21.8
42 7.7
30 7.1
17 26.0
11 27.3
LIBERAL
4 0.7
2 1.0
1 0.9
1 1.1
2 1.6
4 100.0
1 0.3
1 0.6
2 6.3
1 0.2
1 0.3
3 4.5
3 7.2
DON'T KNOW REFUSED
8 1.3
1 0.9
1 1.5
1 0.3
1 0.6
4 2.4
3 2.7
3 0.8
1 0.7
1 1.2
1 2.4
6 1.0
6 1.3
3 4.1
2 3.8

Colorado Republican Survey, Jan. 30th - 31st and Feb. 4th, 2019, 622n, 3.93% MoE, Weighted Results, Magellan Strategies, 1685 Boxelder St. Suite 300, Louisville, CO 80027, 303-861-8585 Table 13-3 T14. Do you consider yourself to be very conservative, somewhat conservative, moderate or liberal when it comes to fiscal issues like taxes and government spending? TRUMP APPROVAL CANDIDATE
PREFERENCE ECONOMY BUILD WALL SHUT DOWN FOR WALL 2020
PRIMARY --------------------------------------------- -------------------- --------------------------------- -------------------------------------------- -------------------------------------------- ---------------------
TOTAL ---------
TOT APRV
---------
STRG APRV
---------
TOT DIS
----------
STRG DIS
---------
CON CAND
---------
MOD CAND
---------
BET TER
---------
WOR SE
----------
NO EFCT
---------
TOT SUPP
---------
STRG SUPP
---------
TOT OPP
---------
STRG OPP
---------
TOT SUPP
----------
STRG SUPP
---------
TOT OPP
---------
STRG OPP
---------
TRU MP
---------
SOME ELSE
----------
TOTAL
622 100.0
558 100.0
446 100.0
59 100.0
40 100.0
381 100.0
204 100.0
542 100.0
36 100.0
30 100.0
545 100.0
495 100.0
65 100.0
49 100.0
502 100.0
394 100.0
104 100.0
69 100.0
483 100.0
105 100.0
VERY CONSERVATIVE
364 58.6
346 62.0
289 64.9
18 31.6
13 33.7
283 74.4
64 31.4
342 63.2
10 28.9
9 30.5
338 62.0
315 63.6
22 34.2
13 26.6
323 64.3
268 67.9
32 30.6
20 29.6
312 64.6
35 33.8
SOMEWHAT CONSERVATIVE
184 29.7
166 29.7
121 27.0
17 29.0
11 28.5
78 20.6
95 46.6
157 29.0
12 33.1
11 37.9
158 28.9
141 28.5
21 31.5
17 35.8
141 28.0
96 24.4
39 37.7
23 34.0
133 27.6
39 37.0
MODERATE
61 9.8
41 7.4
31 6.9
17 29.7
10 26.3
14 3.6
43 20.9
37 6.8
9 24.7
7 24.3
42 7.7
32 6.5
18 27.3
15 30.1
32 6.4
23 5.9
27 26.2
19 28.2
32 6.7
25 23.8
LIBERAL
4 0.7
1 0.2
1 0.3
3 5.1
3 7.5
1 0.3
2 1.2
1 0.2
3 8.4
1 0.2
1 0.2
3 4.6
3 6.1
1 0.2
1 0.3
3 2.9
3 4.3
1 0.2
3 2.9
DON'T KNOW REFUSED
8 1.3
4 0.8
4 1.0
3 4.6
2 4.0
4 1.1
4 0.8
2 5.0
2 7.4
7 1.2
6 1.1
2 2.4
1 1.3
6 1.1
6 1.4
3 2.6
3 3.9
4 0.9
3 2.6

Colorado Republican Survey, Jan. 30th - 31st and Feb. 4th, 2019, 622n, 3.93% MoE, Weighted Results, Magellan Strategies, 1685 Boxelder St. Suite 300, Louisville, CO 80027, 303-861-8585 Table 13-4 T14. Do you consider yourself to be very conservative, somewhat conservative, moderate or liberal when it comes to fiscal issues like taxes and government spending? FULL DAY KINDER RED FLAG REGION BY CD --------------------------------------------- -------------------------------------------- -------------------------------------------------------------------------------
TOTAL ---------
TOT SUPP
---------
STRG SUPP
---------
TOT OPP
----------
STRG OPP
---------
TOT SUPP
---------
STRG SUPP
---------
TOT OPP
---------
STRG OPP
----------
CD1
---------
CD2
---------
CD3
---------
CD4
---------
CD5
---------
CD6
----------
CD7
---------
TOTAL
622 100.0
210 100.0
92 100.0
384 100.0
313 100.0
374 100.0
181 100.0
207 100.0
134 100.0
50 100.0
87 100.0
93 100.0
124 100.0
112 100.0
87 100.0
68 100.0
VERY CONSERVATIVE
364 58.6
99 47.2
40 43.5
257 66.9
221 70.5
199 53.2
92 50.7
147 71.1
101 75.1
28 55.5
50 57.0
54 57.4
72 57.6
74 66.5
49 56.6
38 56.0
SOMEWHAT CONSERVATIVE
184 29.7
76 36.4
35 37.6
100 26.0
74 23.7
124 33.2
60 33.2
47 22.8
27 19.9
19 38.1
22 25.2
31 33.5
40 32.0
31 27.4
26 29.3
16 23.8
MODERATE
61 9.8
28 13.4
14 15.1
23 5.9
14 4.5
44 11.8
26 14.2
11 5.2
7 5.0
3 6.4
12 14.0
7 7.3
10 8.2
7 6.1
11 12.6
10 15.3
LIBERAL
4 0.7
2 1.1
1 1.3
1 0.3
1 0.2
3 0.8
2 1.3
1 1.4
2 1.9
1 1.7
DON'T KNOW REFUSED
8 1.3
4 2.0
2 2.6
3 0.9
3 1.1
4 1.1
1 0.6
2 0.9
2 2.4
3 2.2
1 1.5
2 3.2

Colorado Republican Survey, Jan. 30th - 31st and Feb. 4th, 2019, 622n, 3.93% MoE, Weighted Results, Magellan Strategies, 1685 Boxelder St. Suite 300, Louisville, CO 80027, 303-861-8585 Table 14-1 T15. Do you consider yourself to be very conservative, somewhat conservative, moderate or liberal when it comes to social issues like abortion or same-sex marriage? GENDER AGE COMBINED AGE TYPE OF REP INCOME PRIMARY V
GENERAL --------------------- -------------------------------------------------------- -------------------------------- -------------------------------- -------------------------------------------- ---------------------
TOTAL ---------
MEN
---------
WOM
---------
18-34
----------
35-44
---------
45-54
---------
55-64
---------
65 PLUS
---------
18-44
----------
45-64
---------
65+
---------
TRAD REP
---------
TRMP REP
---------
OTH REP
---------
LESS 50K
----------
51K 75K
---------
76K 125K
---------
MORE 126K
---------
PRIM
---------
GEN
----------
TOTAL
622 100.0
317 100.0
305 100.0
118 100.0
81 100.0
112 100.0
137 100.0
171 100.0
199 100.0
249 100.0
171 100.0
230 100.0
180 100.0
176 100.0
141 100.0
125 100.0
162 100.0
111 100.0
300 100.0
322 100.0
VERY CONSERVATIVE
344 55.3
164 51.7
180 59.0
54 45.5
40 50.1
56 50.3
86 63.0
104 60.6
94 47.4
143 57.3
104 60.6
136 58.9
118 65.2
72 40.7
89 62.8
73 58.1
93 57.5
48 43.0
186 61.9
158 49.1
SOMEWHAT CONSERVATIVE
138 22.1
81 25.6
57 18.6
30 25.2
13 16.6
30 26.4
27 19.6
38 22.3
43 21.7
56 22.6
38 22.3
59 25.7
38 21.3
31 17.6
27 19.0
33 26.3
40 24.6
18 15.9
63 21.1
75 23.1
MODERATE
96 15.4
48 15.0
48 15.8
19 16.2
23 28.6
19 16.6
16 11.4
19 11.2
42 21.3
34 13.8
19 11.2
24 10.6
16 8.6
53 29.8
21 14.6
14 11.4
17 10.7
32 28.5
41 13.7
55 16.9
LIBERAL
38 6.2
21 6.6
18 5.8
14 11.6
4 4.6
7 6.0
6 4.3
8 4.8
18 8.8
13 5.1
8 4.8
9 4.0
6 3.4
20 11.6
3 2.3
5 3.8
12 7.2
13 11.9
10 3.3
28 8.8
DON'T KNOW REFUSED
6 1.0
4 1.1
3 0.9
2 1.4
1 0.7
2 1.6
2 1.0
2 0.8
3 1.2
2 1.0
2 0.8
3 1.5
1 0.3
2 1.3
1 0.5
1 0.7
6 2.0

Colorado Republican Survey, Jan. 30th - 31st and Feb. 4th, 2019, 622n, 3.93% MoE, Weighted Results, Magellan Strategies, 1685 Boxelder St. Suite 300, Louisville, CO 80027, 303-861-8585 Table 14-2 T15. Do you consider yourself to be very conservative, somewhat conservative, moderate or liberal when it comes to social issues like abortion or same-sex marriage? AREA YOU LIVE IN FISCAL IDEOLOGY SOCIAL IDEOLOGY TRUMP IMAGE -------------------------------------------------------------------------------------------- -------------------------------------------- -------------------------------------------- ---------------------------------------------
TOTAL ---------
BIG CITY
---------
CITY MEN
---------
CITY WOM
----------
SUB AREA
---------
SUBS MEN
---------
SUBS WOM
---------
SMAL TOWN
---------
RURL AREA
----------
VERY CON
---------
SOME CON
---------
MOD
---------
LIB
---------
VERY CON
---------
SOME CON
----------
MOD
---------
LIB
---------
TOT FAV
---------
VERY FAV
---------
TOT UNFV
----------
VERY UNFV
---------
TOTAL
622 100.0
110 100.0
49 100.0
61 100.0
241 100.0
128 100.0
113 100.0
153 100.0
108 100.0
364 100.0
184 100.0
61 100.0
4 100.0
344 100.0
138 100.0
96 100.0
38 100.0
546 100.0
425 100.0
66 100.0
42 100.0
VERY CONSERVATIVE
344 55.3
58 52.8
23 46.6
35 57.8
136 56.4
70 54.5
66 58.4
87 56.8
58 53.7
238 65.3
86 46.7
15 25.4
1 27.4
344 100.0
319 58.4
269 63.3
20 30.5
11 26.6
SOMEWHAT CONSERVATIVE
138 22.1
26 23.4
11 22.7
15 23.9
49 20.4
29 22.7
20 17.8
39 25.5
21 19.8
70 19.1
54 29.1
13 22.1
138 100.0
123 22.6
90 21.3
14 21.5
9 20.6
MODERATE
96 15.4
22 19.6
11 23.1
10 16.8
35 14.7
16 12.7
19 16.9
17 11.4
21 19.4
40 11.1
31 16.9
22 36.9
1 14.2
96 100.0
76 13.9
47 11.0
18 27.7
10 24.5
LIBERAL
38 6.2
5 4.2
4 7.5
1 1.5
18 7.6
11 8.7
7 6.3
9 5.6
6 5.6
14 3.8
13 6.9
8 13.8
2 58.4
38 100.0
24 4.3
15 3.5
11 16.8
11 26.8
DON'T KNOW REFUSED
6 1.0
2 0.9
2 1.3
1 0.6
1 0.7
2 1.6
2 0.7
1 0.3
1 1.8
4 0.7
4 1.0
2 3.5
1 1.5

Colorado Republican Survey, Jan. 30th - 31st and Feb. 4th, 2019, 622n, 3.93% MoE, Weighted Results, Magellan Strategies, 1685 Boxelder St. Suite 300, Louisville, CO 80027, 303-861-8585 Table 14-3 T15. Do you consider yourself to be very conservative, somewhat conservative, moderate or liberal when it comes to social issues like abortion or same-sex marriage? TRUMP APPROVAL CANDIDATE
PREFERENCE ECONOMY BUILD WALL SHUT DOWN FOR WALL 2020
PRIMARY --------------------------------------------- -------------------- --------------------------------- -------------------------------------------- -------------------------------------------- ---------------------
TOTAL ---------
TOT APRV
---------
STRG APRV
---------
TOT DIS
----------
STRG DIS
---------
CON CAND
---------
MOD CAND
---------
BET TER
---------
WOR SE
----------
NO EFCT
---------
TOT SUPP
---------
STRG SUPP
---------
TOT OPP
---------
STRG OPP
---------
TOT SUPP
----------
STRG SUPP
---------
TOT OPP
---------
STRG OPP
---------
TRU MP
---------
SOME ELSE
----------
TOTAL
622 100.0
558 100.0
446 100.0
59 100.0
40 100.0
381 100.0
204 100.0
542 100.0
36 100.0
30 100.0
545 100.0
495 100.0
65 100.0
49 100.0
502 100.0
394 100.0
104 100.0
69 100.0
483 100.0
105 100.0
VERY CONSERVATIVE
344 55.3
324 58.0
276 61.8
19 32.0
12 30.7
260 68.2
69 34.1
315 58.2
10 29.3
13 42.1
322 59.1
307 62.1
19 28.3
16 33.5
299 59.6
250 63.4
35 33.1
21 30.9
294 60.9
33 31.7
SOMEWHAT CONSERVATIVE
138 22.1
126 22.6
91 20.5
11 19.5
7 17.0
76 19.9
55 26.8
123 22.7
7 19.0
6 20.3
126 23.1
108 21.8
9 13.7
7 13.8
115 22.9
82 20.9
23 21.9
14 20.6
108 22.4
26 24.9
MODERATE
96 15.4
80 14.3
56 12.5
13 22.1
8 21.0
30 7.8
55 27.2
77 14.3
6 16.9
6 19.2
73 13.3
61 12.3
21 32.2
12 25.5
66 13.1
45 11.4
25 23.7
14 19.8
59 12.2
24 23.2
LIBERAL
38 6.2
24 4.3
19 4.2
14 23.3
12 29.7
13 3.4
24 11.6
22 4.1
11 29.9
6 18.4
19 3.5
15 3.0
16 24.9
13 25.9
18 3.7
15 3.8
20 19.1
18 26.0
18 3.6
19 17.9
DON'T KNOW REFUSED
6 1.0
5 0.8
4 0.9
2 3.0
1 1.6
3 0.7
1 0.3
4 0.8
2 5.0
5 1.0
4 0.8
1 1.0
1 1.3
3 0.7
2 0.4
2 2.2
2 2.6
4 0.8
2 2.2

Colorado Republican Survey, Jan. 30th - 31st and Feb. 4th, 2019, 622n, 3.93% MoE, Weighted Results, Magellan Strategies, 1685 Boxelder St. Suite 300, Louisville, CO 80027, 303-861-8585 Table 14-4 T15. Do you consider yourself to be very conservative, somewhat conservative, moderate or liberal when it comes to social issues like abortion or same-sex marriage? FULL DAY KINDER RED FLAG REGION BY CD --------------------------------------------- -------------------------------------------- -------------------------------------------------------------------------------
TOTAL ---------
TOT SUPP
---------
STRG SUPP
---------
TOT OPP
----------
STRG OPP
---------
TOT SUPP
---------
STRG SUPP
---------
TOT OPP
---------
STRG OPP
----------
CD1
---------
CD2
---------
CD3
---------
CD4
---------
CD5
---------
CD6
----------
CD7
---------
TOTAL
622 100.0
210 100.0
92 100.0
384 100.0
313 100.0
374 100.0
181 100.0
207 100.0
134 100.0
50 100.0
87 100.0
93 100.0
124 100.0
112 100.0
87 100.0
68 100.0
VERY CONSERVATIVE
344 55.3
100 47.5
44 47.2
235 61.2
201 64.2
192 51.4
93 51.5
127 61.3
83 61.9
22 44.2
41 46.9
57 61.0
76 61.4
67 59.8
42 48.3
39 56.4
SOMEWHAT CONSERVATIVE
138 22.1
47 22.2
18 19.1
84 22.0
67 21.3
91 24.3
42 23.0
38 18.2
25 18.8
9 17.5
19 22.1
26 27.6
25 20.3
22 19.7
23 26.8
13 19.4
MODERATE
96 15.4
42 20.0
17 18.5
46 11.9
33 10.5
60 15.9
25 13.9
31 14.9
20 14.9
13 25.2
16 18.8
7 7.1
18 14.5
14 12.6
16 18.7
12 17.1
LIBERAL
38 6.2
19 9.1
13 14.5
17 4.3
11 3.4
28 7.6
20 11.0
9 4.5
5 4.0
6 11.6
10 10.9
3 3.7
5 3.7
6 5.5
5 6.1
4 5.3
DON'T KNOW REFUSED
6 1.0
2 1.2
1 0.8
2 0.6
2 0.5
3 0.8
1 0.6
2 1.1
1 0.4
1 1.5
1 1.3
1 0.6
3 2.5
1 1.8

Colorado Republican Survey, Jan. 30th - 31st and Feb. 4th, 2019, 622n, 3.93% MoE, Weighted Results, Magellan Strategies, 1685 Boxelder St. Suite 300, Louisville, CO 80027, 303-861-8585 Table 15-1 And now I have a few questions for statistical purposes only... T16. How would you describe the area where you currently live? Would you say you live in... GENDER AGE COMBINED AGE TYPE OF REP INCOME PRIMARY V
GENERAL --------------------- -------------------------------------------------------- -------------------------------- -------------------------------- -------------------------------------------- ---------------------
TOTAL ---------
MEN
---------
WOM
---------
18-34
----------
35-44
---------
45-54
---------
55-64
---------
65 PLUS
---------
18-44
----------
45-64
---------
65+
---------
TRAD REP
---------
TRMP REP
---------
OTH REP
---------
LESS 50K
----------
51K 75K
---------
76K 125K
---------
MORE 126K
---------
PRIM
---------
GEN
----------
TOTAL
622 100.0
317 100.0
305 100.0
118 100.0
81 100.0
112 100.0
137 100.0
171 100.0
199 100.0
249 100.0
171 100.0
230 100.0
180 100.0
176 100.0
141 100.0
125 100.0
162 100.0
111 100.0
300 100.0
322 100.0
SUBURBAN AREA
241 38.7
128 40.3
113 37.1
57 48.2
33 41.3
45 40.0
46 33.7
60 34.9
90 45.4
91 36.6
60 34.9
83 36.0
66 36.5
78 44.1
41 29.4
46 37.1
63 39.1
56 50.4
119 39.7
122 37.8
SMALL TOWN
153 24.6
79 25.0
74 24.2
28 24.1
19 24.1
29 25.7
33 24.5
40 23.2
48 24.1
62 25.0
40 23.2
54 23.4
51 28.5
37 21.2
38 27.2
32 25.5
40 24.7
24 21.1
76 25.5
77 23.8
BIG CITY
110 17.6
49 15.4
61 19.9
21 17.5
17 21.4
15 13.0
25 18.4
32 18.6
38 19.1
40 16.0
32 18.6
51 22.3
30 16.7
27 15.4
33 23.5
27 21.2
30 18.7
7 6.1
54 18.0
56 17.2
RURAL AREA
108 17.4
55 17.3
53 17.4
12 10.2
11 13.3
21 18.4
29 21.4
36 20.8
23 11.4
50 20.0
36 20.8
39 17.1
30 16.5
30 17.3
25 17.6
18 14.0
28 17.1
22 20.2
45 15.2
63 19.4
DON'T KNOW REFUSED
10 1.7
6 1.9
4 1.4
3 3.0
3 2.0
4 2.5
6 2.5
4 2.5
3 1.3
3 1.7
4 2.0
3 2.3
3 2.2
1 0.5
2 2.2
5 1.6
6 1.7

Colorado Republican Survey, Jan. 30th - 31st and Feb. 4th, 2019, 622n, 3.93% MoE, Weighted Results, Magellan Strategies, 1685 Boxelder St. Suite 300, Louisville, CO 80027, 303-861-8585 Table 15-2 And now I have a few questions for statistical purposes only... T16. How would you describe the area where you currently live? Would you say you live in... AREA YOU LIVE IN FISCAL IDEOLOGY SOCIAL IDEOLOGY TRUMP IMAGE -------------------------------------------------------------------------------------------- -------------------------------------------- -------------------------------------------- ---------------------------------------------
TOTAL ---------
BIG CITY
---------
CITY MEN
---------
CITY WOM
----------
SUB AREA
---------
SUBS MEN
---------
SUBS WOM
---------
SMAL TOWN
---------
RURL AREA
----------
VERY CON
---------
SOME CON
---------
MOD
---------
LIB
---------
VERY CON
---------
SOME CON
----------
MOD
---------
LIB
---------
TOT FAV
---------
VERY FAV
---------
TOT UNFV
----------
VERY UNFV
---------
TOTAL
622 100.0
110 100.0
49 100.0
61 100.0
241 100.0
128 100.0
113 100.0
153 100.0
108 100.0
364 100.0
184 100.0
61 100.0
4 100.0
344 100.0
138 100.0
96 100.0
38 100.0
546 100.0
425 100.0
66 100.0
42 100.0
SUBURBAN AREA
241 38.7
241 100.0
128 100.0
113 100.0
145 39.9
67 36.4
25 41.8
2 57.7
136 39.5
49 35.8
35 36.9
18 47.6
207 38.0
151 35.7
30 45.7
21 49.5
SMALL TOWN
153 24.6
153 100.0
92 25.3
46 25.1
10 17.2
87 25.3
39 28.3
17 18.2
9 22.2
132 24.2
111 26.2
17 25.8
9 22.3
BIG CITY
110 17.6
110 100.0
49 100.0
61 100.0
61 16.7
36 19.6
12 19.4
58 16.8
26 18.6
22 22.5
5 12.0
99 18.2
78 18.4
8 12.2
4 9.6
RURAL AREA
108 17.4
108 100.0
58 15.9
33 17.9
12 20.5
2 42.3
58 16.9
21 15.6
21 21.9
6 15.8
101 18.5
78 18.4
7 9.8
5 12.2
DON'T KNOW REFUSED
10 1.7
8 2.2
2 0.9
1 1.0
5 1.5
2 1.8
1 0.6
1 2.4
6 1.1
5 1.3
4 6.5
3 6.5

Colorado Republican Survey, Jan. 30th - 31st and Feb. 4th, 2019, 622n, 3.93% MoE, Weighted Results, Magellan Strategies, 1685 Boxelder St. Suite 300, Louisville, CO 80027, 303-861-8585 Table 15-3 And now I have a few questions for statistical purposes only... T16. How would you describe the area where you currently live? Would you say you live in... TRUMP APPROVAL CANDIDATE
PREFERENCE ECONOMY BUILD WALL SHUT DOWN FOR WALL 2020
PRIMARY --------------------------------------------- -------------------- --------------------------------- -------------------------------------------- -------------------------------------------- ---------------------
TOTAL ---------
TOT APRV
---------
STRG APRV
---------
TOT DIS
----------
STRG DIS
---------
CON CAND
---------
MOD CAND
---------
BET TER
---------
WOR SE
----------
NO EFCT
---------
TOT SUPP
---------
STRG SUPP
---------
TOT OPP
---------
STRG OPP
---------
TOT SUPP
----------
STRG SUPP
---------
TOT OPP
---------
STRG OPP
---------
TRU MP
---------
SOME ELSE
----------
TOTAL
622 100.0
558 100.0
446 100.0
59 100.0
40 100.0
381 100.0
204 100.0
542 100.0
36 100.0
30 100.0
545 100.0
495 100.0
65 100.0
49 100.0
502 100.0
394 100.0
104 100.0
69 100.0
483 100.0
105 100.0
SUBURBAN AREA
241 38.7
211 37.9
160 35.8
27 46.5
21 53.3
145 38.2
81 39.7
210 38.8
20 56.4
8 25.1
204 37.5
187 37.8
32 49.3
22 46.1
196 39.0
150 38.0
43 41.4
30 43.8
182 37.6
46 43.9
SMALL TOWN
153 24.6
138 24.7
110 24.8
15 25.5
9 23.3
104 27.4
42 20.6
136 25.2
5 15.4
8 27.0
138 25.3
122 24.6
14 20.7
12 23.9
120 23.9
98 24.8
27 25.8
18 26.1
126 26.2
24 23.3
BIG CITY
110 17.6
102 18.3
82 18.4
6 10.4
3 7.6
59 15.5
40 19.6
94 17.4
5 13.2
7 23.5
98 17.9
86 17.4
11 16.3
6 13.2
90 18.0
66 16.8
16 15.4
9 12.7
86 17.8
17 16.1
RURAL AREA
108 17.4
100 18.0
88 19.7
7 11.1
4 10.9
66 17.4
38 18.8
94 17.3
4 12.0
6 19.1
97 17.8
92 18.7
7 10.8
7 14.5
90 17.9
74 18.9
15 13.9
10 14.6
83 17.1
13 12.6
DON'T KNOW REFUSED
10 1.7
7 1.2
6 1.4
4 6.4
2 4.9
6 1.5
3 1.4
7 1.3
1 3.1
2 5.3
8 1.5
8 1.6
2 3.0
1 2.3
6 1.2
6 1.6
4 3.4
2 2.8
6 1.3
4 4.1

Colorado Republican Survey, Jan. 30th - 31st and Feb. 4th, 2019, 622n, 3.93% MoE, Weighted Results, Magellan Strategies, 1685 Boxelder St. Suite 300, Louisville, CO 80027, 303-861-8585 Table 15-4 And now I have a few questions for statistical purposes only... T16. How would you describe the area where you currently live? Would you say you live in... FULL DAY KINDER RED FLAG REGION BY CD --------------------------------------------- -------------------------------------------- -------------------------------------------------------------------------------
TOTAL ---------
TOT SUPP
---------
STRG SUPP
---------
TOT OPP
----------
STRG OPP
---------
TOT SUPP
---------
STRG SUPP
---------
TOT OPP
---------
STRG OPP
----------
CD1
---------
CD2
---------
CD3
---------
CD4
---------
CD5
---------
CD6
----------
CD7
---------
TOTAL
622 100.0
210 100.0
92 100.0
384 100.0
313 100.0
374 100.0
181 100.0
207 100.0
134 100.0
50 100.0
87 100.0
93 100.0
124 100.0
112 100.0
87 100.0
68 100.0
SUBURBAN AREA
241 38.7
76 36.2
29 31.3
154 40.1
125 39.8
152 40.5
73 40.5
72 34.8
48 35.8
20 40.2
32 37.0
12 13.0
22 17.7
46 41.1
57 65.7
51 74.9
SMALL TOWN
153 24.6
59 28.0
30 32.5
86 22.5
73 23.3
91 24.4
47 26.0
56 27.2
35 25.8
31 35.4
43 46.3
59 47.1
14 12.9
6 6.7
BIG CITY
110 17.6
37 17.5
13 13.7
70 18.2
54 17.3
70 18.6
37 20.3
31 14.8
20 15.1
29 58.3
10 11.2
3 3.5
3 2.3
32 28.6
17 19.5
16 23.0
RURAL AREA
108 17.4
34 16.1
16 17.5
68 17.7
56 17.8
56 14.9
20 11.3
45 21.7
30 22.3
12 14.3
32 34.4
40 32.0
16 14.4
7 8.0
1 0.9
DON'T KNOW REFUSED
10 1.7
5 2.2
5 4.9
6 1.5
5 1.7
5 1.5
4 2.0
3 1.5
1 1.1
1 1.5
2 2.0
3 2.8
1 0.9
3 3.0
1 1.3

Colorado Republican Survey, Jan. 30th - 31st and Feb. 4th, 2019, 622n, 3.93% MoE, Weighted Results, Magellan Strategies, 1685 Boxelder St. Suite 300, Louisville, CO 80027, 303-861-8585 Table 16-1 T17. What was the total amount of income in your household last year before taxes? Was the amount... GENDER AGE COMBINED AGE TYPE OF REP INCOME PRIMARY V
GENERAL --------------------- -------------------------------------------------------- -------------------------------- -------------------------------- -------------------------------------------- ---------------------
TOTAL ---------
MEN
---------
WOM
---------
18-34
----------
35-44
---------
45-54
---------
55-64
---------
65 PLUS
---------
18-44
----------
45-64
---------
65+
---------
TRAD REP
---------
TRMP REP
---------
OTH REP
---------
LESS 50K
----------
51K 75K
---------
76K 125K
---------
MORE 126K
---------
PRIM
---------
GEN
----------
TOTAL
622 100.0
317 100.0
305 100.0
118 100.0
81 100.0
112 100.0
137 100.0
171 100.0
199 100.0
249 100.0
171 100.0
230 100.0
180 100.0
176 100.0
141 100.0
125 100.0
162 100.0
111 100.0
300 100.0
322 100.0
LESS THAN $50,000
141 22.7
66 20.7
76 24.8
25 20.9
14 17.9
14 12.9
33 24.1
54 31.8
39 19.7
47 19.1
54 31.8
51 22.0
47 25.8
37 20.8
141 100.0
67 22.3
74 23.0
$51,000 TO $75,000
125 20.1
71 22.3
55 17.9
40 33.6
6 7.2
14 12.6
30 21.6
35 20.2
46 22.9
44 17.6
35 20.2
51 22.3
29 16.0
36 20.7
125 100.0
59 19.7
66 20.5
$76,000 TO $125,000
162 26.1
82 25.9
80 26.3
35 29.3
21 26.6
39 34.9
35 25.5
32 18.9
56 28.2
74 29.7
32 18.9
58 25.1
54 29.9
41 23.2
162 100.0
77 25.8
85 26.4
MORE THAN $126,000
111 17.9
59 18.7
52 17.1
10 8.2
29 35.8
30 27.1
25 18.6
17 9.8
39 19.4
56 22.4
17 9.8
50 21.6
22 12.2
37 21.1
111 100.0
53 17.8
58 18.0
REFUSED
82 13.2
40 12.5
42 13.9
9 8.0
10 12.5
14 12.5
14 10.1
33 19.3
20 9.8
28 11.2
33 19.3
21 9.0
29 16.0
25 14.2
43 14.4
39 12.0

Colorado Republican Survey, Jan. 30th - 31st and Feb. 4th, 2019, 622n, 3.93% MoE, Weighted Results, Magellan Strategies, 1685 Boxelder St. Suite 300, Louisville, CO 80027, 303-861-8585 Table 16-2 T17. What was the total amount of income in your household last year before taxes? Was the amount... AREA YOU LIVE IN FISCAL IDEOLOGY SOCIAL IDEOLOGY TRUMP IMAGE -------------------------------------------------------------------------------------------- -------------------------------------------- -------------------------------------------- ---------------------------------------------
TOTAL ---------
BIG CITY
---------
CITY MEN
---------
CITY WOM
----------
SUB AREA
---------
SUBS MEN
---------
SUBS WOM
---------
SMAL TOWN
---------
RURL AREA
----------
VERY CON
---------
SOME CON
---------
MOD
---------
LIB
---------
VERY CON
---------
SOME CON
----------
MOD
---------
LIB
---------
TOT FAV
---------
VERY FAV
---------
TOT UNFV
----------
VERY UNFV
---------
TOTAL
622 100.0
110 100.0
49 100.0
61 100.0
241 100.0
128 100.0
113 100.0
153 100.0
108 100.0
364 100.0
184 100.0
61 100.0
4 100.0
344 100.0
138 100.0
96 100.0
38 100.0
546 100.0
425 100.0
66 100.0
42 100.0
LESS THAN $50,000
141 22.7
33 30.3
14 28.2
19 32.1
41 17.2
16 12.4
26 22.6
38 25.1
25 23.0
75 20.4
47 25.5
15 25.1
1 28.6
89 25.8
27 19.5
21 21.5
3 8.6
123 22.5
103 24.2
15 22.8
8 20.3
$51,000 TO $75,000
125 20.1
27 24.2
13 26.2
14 22.6
46 19.3
31 24.2
15 13.7
32 20.9
18 16.2
70 19.1
45 24.6
7 11.6
73 21.2
33 23.9
14 14.9
5 12.3
103 18.9
83 19.7
19 29.0
10 24.0
$76,000 TO $125,000
162 26.1
30 27.7
12 24.1
19 30.5
63 26.3
34 26.7
29 25.9
40 26.2
28 25.6
107 29.5
38 20.6
15 23.9
1 29.2
93 27.1
40 29.0
17 18.1
12 30.5
149 27.2
112 26.4
11 15.9
8 20.0
MORE THAN $126,000
111 17.9
7 6.2
3 6.7
4 5.9
56 23.3
33 25.4
24 20.9
24 15.4
22 20.8
68 18.6
30 16.3
13 21.0
1 14.2
48 13.9
18 12.9
32 33.2
13 34.6
97 17.9
66 15.6
14 21.0
10 23.5
REFUSED
82 13.2
13 11.6
7 14.8
5 8.9
33 13.9
14 11.3
19 16.9
19 12.4
16 14.4
45 12.3
24 12.9
11 18.3
1 27.9
41 12.0
20 14.7
12 12.3
5 14.0
74 13.5
60 14.1
8 11.3
5 12.2

Colorado Republican Survey, Jan. 30th - 31st and Feb. 4th, 2019, 622n, 3.93% MoE, Weighted Results, Magellan Strategies, 1685 Boxelder St. Suite 300, Louisville, CO 80027, 303-861-8585 Table 16-3 T17. What was the total amount of income in your household last year before taxes? Was the amount... TRUMP APPROVAL CANDIDATE
PREFERENCE ECONOMY BUILD WALL SHUT DOWN FOR WALL 2020
PRIMARY --------------------------------------------- -------------------- --------------------------------- -------------------------------------------- -------------------------------------------- ---------------------
TOTAL ---------
TOT APRV
---------
STRG APRV
---------
TOT DIS
----------
STRG DIS
---------
CON CAND
---------
MOD CAND
---------
BET TER
---------
WOR SE
----------
NO EFCT
---------
TOT SUPP
---------
STRG SUPP
---------
TOT OPP
---------
STRG OPP
---------
TOT SUPP
----------
STRG SUPP
---------
TOT OPP
---------
STRG OPP
---------
TRU MP
---------
SOME ELSE
----------
TOTAL
622 100.0
558 100.0
446 100.0
59 100.0
40 100.0
381 100.0
204 100.0
542 100.0
36 100.0
30 100.0
545 100.0
495 100.0
65 100.0
49 100.0
502 100.0
394 100.0
104 100.0
69 100.0
483 100.0
105 100.0
LESS THAN $50,000
141 22.7
127 22.7
98 21.9
10 17.9
9 23.4
85 22.3
45 22.0
118 21.8
9 25.0
9 30.2
123 22.7
114 23.1
16 25.1
15 30.2
114 22.7
91 23.0
25 23.6
14 20.4
113 23.3
20 19.2
$51,000 TO $75,000
125 20.1
108 19.3
92 20.6
18 30.0
12 29.7
77 20.2
40 19.9
107 19.8
9 25.3
7 24.6
108 19.9
98 19.9
14 20.8
11 22.0
96 19.2
79 20.1
23 22.0
18 25.9
97 20.1
26 24.5
$76,000 TO $125,000
162 26.1
149 26.7
117 26.3
13 22.5
7 17.4
114 29.8
45 22.1
148 27.4
4 12.2
7 23.3
149 27.3
134 27.1
13 19.3
9 18.3
137 27.3
111 28.1
22 21.0
14 20.0
132 27.3
23 22.4
MORE THAN $126,000
111 17.9
101 18.1
79 17.7
10 17.8
7 16.7
61 16.1
45 22.0
97 17.9
7 20.6
3 9.0
94 17.2
82 16.6
15 22.9
8 17.2
87 17.3
65 16.5
23 21.8
14 20.0
78 16.1
23 21.8
REFUSED
82 13.2
73 13.2
60 13.4
7 11.9
5 12.8
44 11.6
29 14.1
71 13.2
6 17.0
4 13.0
71 13.0
66 13.3
8 11.9
6 12.4
68 13.5
49 12.4
12 11.6
10 13.8
64 13.2
13 12.1

Colorado Republican Survey, Jan. 30th - 31st and Feb. 4th, 2019, 622n, 3.93% MoE, Weighted Results, Magellan Strategies, 1685 Boxelder St. Suite 300, Louisville, CO 80027, 303-861-8585 Table 16-4 T17. What was the total amount of income in your household last year before taxes? Was the amount... FULL DAY KINDER RED FLAG REGION BY CD --------------------------------------------- -------------------------------------------- -------------------------------------------------------------------------------
TOTAL ---------
TOT SUPP
---------
STRG SUPP
---------
TOT OPP
----------
STRG OPP
---------
TOT SUPP
---------
STRG SUPP
---------
TOT OPP
---------
STRG OPP
----------
CD1
---------
CD2
---------
CD3
---------
CD4
---------
CD5
---------
CD6
----------
CD7
---------
TOTAL
622 100.0
210 100.0
92 100.0
384 100.0
313 100.0
374 100.0
181 100.0
207 100.0
134 100.0
50 100.0
87 100.0
93 100.0
124 100.0
112 100.0
87 100.0
68 100.0
LESS THAN $50,000
141 22.7
52 24.6
24 26.5
82 21.3
67 21.4
77 20.6
38 21.2
52 25.2
37 27.3
11 23.1
21 24.0
30 32.4
25 20.3
21 18.8
20 22.9
12 18.1
$51,000 TO $75,000
125 20.1
46 21.7
20 21.2
77 20.0
67 21.4
82 21.8
38 20.8
39 19.1
23 17.4
10 19.5
15 17.8
20 21.0
23 18.8
19 17.0
18 20.3
20 29.9
$76,000 TO $125,000
162 26.1
55 26.4
25 27.1
98 25.5
77 24.6
104 27.8
50 27.7
50 24.2
38 28.6
12 24.6
24 27.5
19 20.7
29 23.0
40 36.1
21 24.2
17 24.4
MORE THAN $126,000
111 17.9
40 18.8
19 20.2
69 18.0
51 16.4
68 18.2
32 17.5
36 17.4
22 16.6
8 16.6
16 18.1
13 13.5
29 23.1
18 16.3
17 19.9
11 15.4
REFUSED
82 13.2
18 8.5
5 5.1
58 15.2
51 16.3
43 11.5
23 12.7
29 14.1
14 10.1
8 16.3
11 12.7
12 12.4
18 14.9
13 11.9
11 12.6
8 12.3

Colorado Republican Survey, Jan. 30th - 31st and Feb. 4th, 2019, 622n, 3.93% MoE, Weighted Results, Magellan Strategies, 1685 Boxelder St. Suite 300, Louisville, CO 80027, 303-861-8585 Table 17-1 T18. Are you male or female? GENDER AGE COMBINED AGE TYPE OF REP INCOME PRIMARY V
GENERAL --------------------- -------------------------------------------------------- -------------------------------- -------------------------------- -------------------------------------------- ---------------------
TOTAL ---------
MEN
---------
WOM
---------
18-34
----------
35-44
---------
45-54
---------
55-64
---------
65 PLUS
---------
18-44
----------
45-64
---------
65+
---------
TRAD REP
---------
TRMP REP
---------
OTH REP
---------
LESS 50K
----------
51K 75K
---------
76K 125K
---------
MORE 126K
---------
PRIM
---------
GEN
----------
TOTAL
622 100.0
317 100.0
305 100.0
118 100.0
81 100.0
112 100.0
137 100.0
171 100.0
199 100.0
249 100.0
171 100.0
230 100.0
180 100.0
176 100.0
141 100.0
125 100.0
162 100.0
111 100.0
300 100.0
322 100.0
MALE
317 51.0
317 100.0
71 60.4
36 44.7
66 59.2
65 47.7
78 45.7
107 54.0
132 52.9
78 45.7
118 51.3
96 53.0
90 51.1
66 46.4
71 56.3
82 50.6
59 53.3
153 51.2
164 50.9
FEMALE
305 49.0
305 100.0
47 39.6
45 55.3
46 40.8
72 52.3
93 54.3
92 46.0
117 47.1
93 54.3
112 48.7
85 47.0
86 48.9
76 53.6
55 43.7
80 49.4
52 46.7
146 48.8
158 49.1

Colorado Republican Survey, Jan. 30th - 31st and Feb. 4th, 2019, 622n, 3.93% MoE, Weighted Results, Magellan Strategies, 1685 Boxelder St. Suite 300, Louisville, CO 80027, 303-861-8585 Table 17-2 T18. Are you male or female? AREA YOU LIVE IN FISCAL IDEOLOGY SOCIAL IDEOLOGY TRUMP IMAGE -------------------------------------------------------------------------------------------- -------------------------------------------- -------------------------------------------- ---------------------------------------------
TOTAL ---------
BIG CITY
---------
CITY MEN
---------
CITY WOM
----------
SUB AREA
---------
SUBS MEN
---------
SUBS WOM
---------
SMAL TOWN
---------
RURL AREA
----------
VERY CON
---------
SOME CON
---------
MOD
---------
LIB
---------
VERY CON
---------
SOME CON
----------
MOD
---------
LIB
---------
TOT FAV
---------
VERY FAV
---------
TOT UNFV
----------
VERY UNFV
---------
TOTAL
622 100.0
110 100.0
49 100.0
61 100.0
241 100.0
128 100.0
113 100.0
153 100.0
108 100.0
364 100.0
184 100.0
61 100.0
4 100.0
344 100.0
138 100.0
96 100.0
38 100.0
546 100.0
425 100.0
66 100.0
42 100.0
MALE
317 51.0
49 44.5
49 100.0
128 53.1
128 100.0
79 51.9
55 50.9
199 54.6
90 48.9
25 41.3
2 55.8
164 47.7
81 58.9
48 49.8
21 54.3
278 50.9
212 49.8
33 50.3
22 53.5
FEMALE
305 49.0
61 55.5
61 100.0
113 46.9
113 100.0
74 48.1
53 49.1
165 45.4
94 51.1
36 58.7
2 44.2
180 52.3
57 41.1
48 50.2
18 45.7
268 49.1
213 50.2
33 49.7
19 46.5

Colorado Republican Survey, Jan. 30th - 31st and Feb. 4th, 2019, 622n, 3.93% MoE, Weighted Results, Magellan Strategies, 1685 Boxelder St. Suite 300, Louisville, CO 80027, 303-861-8585 Table 17-3 T18. Are you male or female? TRUMP APPROVAL CANDIDATE
PREFERENCE ECONOMY BUILD WALL SHUT DOWN FOR WALL 2020
PRIMARY --------------------------------------------- -------------------- --------------------------------- -------------------------------------------- -------------------------------------------- ---------------------
TOTAL ---------
TOT APRV
---------
STRG APRV
---------
TOT DIS
----------
STRG DIS
---------
CON CAND
---------
MOD CAND
---------
BET TER
---------
WOR SE
----------
NO EFCT
---------
TOT SUPP
---------
STRG SUPP
---------
TOT OPP
---------
STRG OPP
---------
TOT SUPP
----------
STRG SUPP
---------
TOT OPP
---------
STRG OPP
---------
TRU MP
---------
SOME ELSE
----------
TOTAL
622 100.0
558 100.0
446 100.0
59 100.0
40 100.0
381 100.0
204 100.0
542 100.0
36 100.0
30 100.0
545 100.0
495 100.0
65 100.0
49 100.0
502 100.0
394 100.0
104 100.0
69 100.0
483 100.0
105 100.0
MALE
317 51.0
289 51.7
227 50.9
28 47.4
22 55.3
202 52.9
102 49.9
282 52.1
20 55.1
12 41.2
278 51.1
252 50.9
37 56.0
23 46.3
260 51.9
209 53.0
49 47.3
38 55.0
254 52.7
53 50.5
FEMALE
305 49.0
270 48.3
219 49.1
31 52.6
18 44.7
179 47.1
102 50.1
259 47.9
16 44.9
18 58.8
266 48.9
243 49.1
29 44.0
26 53.7
242 48.1
185 47.0
55 52.7
31 45.0
228 47.3
52 49.5

Colorado Republican Survey, Jan. 30th - 31st and Feb. 4th, 2019, 622n, 3.93% MoE, Weighted Results, Magellan Strategies, 1685 Boxelder St. Suite 300, Louisville, CO 80027, 303-861-8585 Table 17-4 T18. Are you male or female? FULL DAY KINDER RED FLAG REGION BY CD --------------------------------------------- -------------------------------------------- -------------------------------------------------------------------------------
TOTAL ---------
TOT SUPP
---------
STRG SUPP
---------
TOT OPP
----------
STRG OPP
---------
TOT SUPP
---------
STRG SUPP
---------
TOT OPP
---------
STRG OPP
----------
CD1
---------
CD2
---------
CD3
---------
CD4
---------
CD5
---------
CD6
----------
CD7
---------
TOTAL
622 100.0
210 100.0
92 100.0
384 100.0
313 100.0
374 100.0
181 100.0
207 100.0
134 100.0
50 100.0
87 100.0
93 100.0
124 100.0
112 100.0
87 100.0
68 100.0
MALE
317 51.0
92 43.6
33 35.5
214 55.8
173 55.2
180 48.0
74 40.7
122 59.1
76 56.5
27 54.9
41 47.4
40 42.9
69 55.3
57 51.2
44 50.4
39 56.4
FEMALE
305 49.0
119 56.4
59 64.5
170 44.2
140 44.8
194 52.0
107 59.3
85 40.9
58 43.5
22 45.1
46 52.6
53 57.1
56 44.7
55 48.8
43 49.6
30 43.6

Colorado Republican Survey, Jan. 30th - 31st and Feb. 4th, 2019, 622n, 3.93% MoE, Weighted Results, Magellan Strategies, 1685 Boxelder St. Suite 300, Louisville, CO 80027, 303-861-8585 Table 18-1 T19. Which of the following age groups applies to you? GENDER AGE COMBINED AGE TYPE OF REP INCOME PRIMARY V
GENERAL --------------------- -------------------------------------------------------- -------------------------------- -------------------------------- -------------------------------------------- ---------------------
TOTAL ---------
MEN
---------
WOM
---------
18-34
----------
35-44
---------
45-54
---------
55-64
---------
65 PLUS
---------
18-44
----------
45-64
---------
65+
---------
TRAD REP
---------
TRMP REP
---------
OTH REP
---------
LESS 50K
----------
51K 75K
---------
76K 125K
---------
MORE 126K
---------
PRIM
---------
GEN
----------
TOTAL
622 100.0
317 100.0
305 100.0
118 100.0
81 100.0
112 100.0
137 100.0
171 100.0
199 100.0
249 100.0
171 100.0
230 100.0
180 100.0
176 100.0
141 100.0
125 100.0
162 100.0
111 100.0
300 100.0
322 100.0
18-34
118 19.0
71 22.5
47 15.4
118 100.0
118 59.4
38 16.3
26 14.6
47 26.8
25 17.5
40 31.7
35 21.3
10 8.7
48 16.1
70 21.7
35-44
81 13.0
36 11.4
45 14.7
81 100.0
81 40.6
27 11.6
16 8.9
34 19.3
14 10.2
6 4.7
21 13.2
29 26.0
29 9.7
52 16.1
45-54
112 18.0
66 20.9
46 15.0
112 100.0
112 45.0
46 19.8
26 14.3
35 19.8
14 10.3
14 11.2
39 24.1
30 27.3
57 19.1
55 17.0
55-64
137 22.0
65 20.6
72 23.5
137 100.0
137 55.0
48 20.8
48 26.4
35 19.7
33 23.4
30 23.6
35 21.5
25 22.9
66 22.1
71 21.9
65+
171 27.5
78 24.7
93 30.5
171 100.0
171 100.0
71 30.8
63 35.0
25 14.4
54 38.6
35 27.6
32 19.9
17 15.1
97 32.4
74 22.9
REFUSED
3 0.5
3 1.0
2 0.7
2 0.9
2 1.2
2 0.5
2 0.5
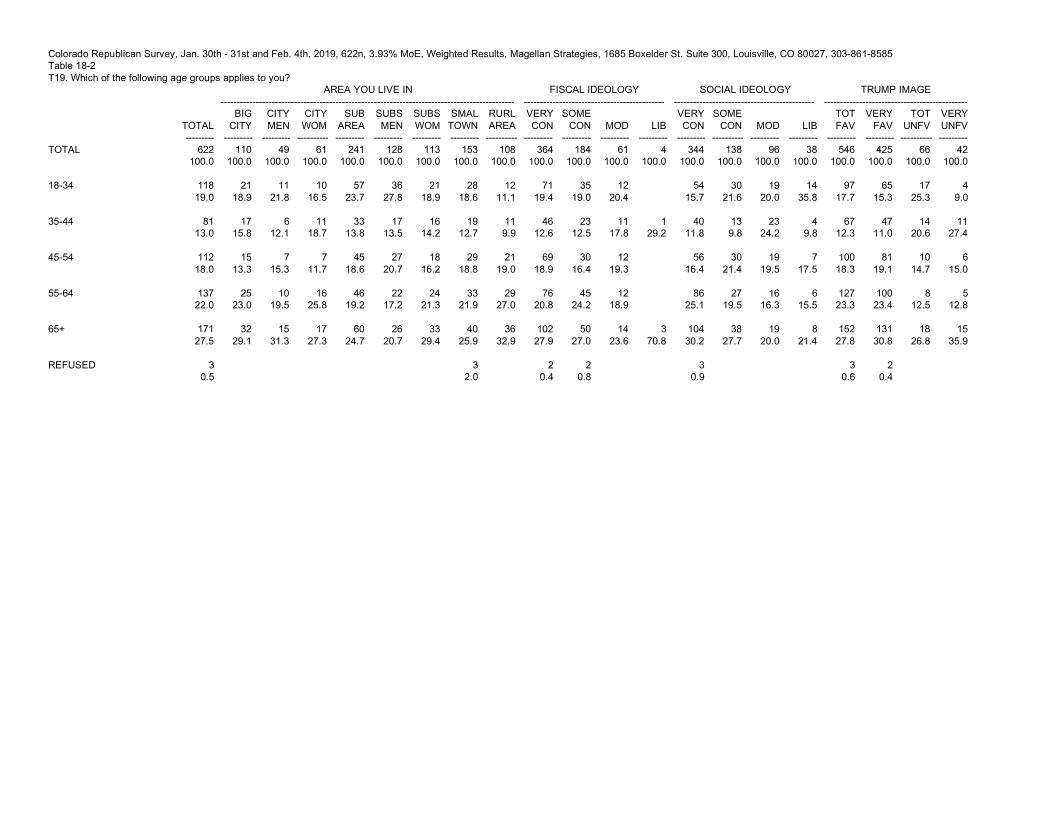
Colorado Republican Survey, Jan. 30th - 31st and Feb. 4th, 2019, 622n, 3.93% MoE, Weighted Results, Magellan Strategies, 1685 Boxelder St. Suite 300, Louisville, CO 80027, 303-861-8585 Table 18-2 T19. Which of the following age groups applies to you? AREA YOU LIVE IN FISCAL IDEOLOGY SOCIAL IDEOLOGY TRUMP IMAGE -------------------------------------------------------------------------------------------- -------------------------------------------- -------------------------------------------- ---------------------------------------------
TOTAL ---------
BIG CITY
---------
CITY MEN
---------
CITY WOM
----------
SUB AREA
---------
SUBS MEN
---------
SUBS WOM
---------
SMAL TOWN
---------
RURL AREA
----------
VERY CON
---------
SOME CON
---------
MOD
---------
LIB
---------
VERY CON
---------
SOME CON
----------
MOD
---------
LIB
---------
TOT FAV
---------
VERY FAV
---------
TOT UNFV
----------
VERY UNFV
---------
TOTAL
622 100.0
110 100.0
49 100.0
61 100.0
241 100.0
128 100.0
113 100.0
153 100.0
108 100.0
364 100.0
184 100.0
61 100.0
4 100.0
344 100.0
138 100.0
96 100.0
38 100.0
546 100.0
425 100.0
66 100.0
42 100.0
18-34
118 19.0
21 18.9
11 21.8
10 16.5
57 23.7
36 27.8
21 18.9
28 18.6
12 11.1
71 19.4
35 19.0
12 20.4
54 15.7
30 21.6
19 20.0
14 35.8
97 17.7
65 15.3
17 25.3
4 9.0
35-44
81 13.0
17 15.8
6 12.1
11 18.7
33 13.8
17 13.5
16 14.2
19 12.7
11 9.9
46 12.6
23 12.5
11 17.8
1 29.2
40 11.8
13 9.8
23 24.2
4 9.8
67 12.3
47 11.0
14 20.6
11 27.4
45-54
112 18.0
15 13.3
7 15.3
7 11.7
45 18.6
27 20.7
18 16.2
29 18.8
21 19.0
69 18.9
30 16.4
12 19.3
56 16.4
30 21.4
19 19.5
7 17.5
100 18.3
81 19.1
10 14.7
6 15.0
55-64
137 22.0
25 23.0
10 19.5
16 25.8
46 19.2
22 17.2
24 21.3
33 21.9
29 27.0
76 20.8
45 24.2
12 18.9
86 25.1
27 19.5
16 16.3
6 15.5
127 23.3
100 23.4
8 12.5
5 12.8
65+
171 27.5
32 29.1
15 31.3
17 27.3
60 24.7
26 20.7
33 29.4
40 25.9
36 32.9
102 27.9
50 27.0
14 23.6
3 70.8
104 30.2
38 27.7
19 20.0
8 21.4
152 27.8
131 30.8
18 26.8
15 35.9
REFUSED
3 0.5
3 2.0
2 0.4
2 0.8
3 0.9
3 0.6
2 0.4

Colorado Republican Survey, Jan. 30th - 31st and Feb. 4th, 2019, 622n, 3.93% MoE, Weighted Results, Magellan Strategies, 1685 Boxelder St. Suite 300, Louisville, CO 80027, 303-861-8585 Table 18-3 T19. Which of the following age groups applies to you? TRUMP APPROVAL CANDIDATE
PREFERENCE ECONOMY BUILD WALL SHUT DOWN FOR WALL 2020
PRIMARY --------------------------------------------- -------------------- --------------------------------- -------------------------------------------- -------------------------------------------- ---------------------
TOTAL ---------
TOT APRV
---------
STRG APRV
---------
TOT DIS
----------
STRG DIS
---------
CON CAND
---------
MOD CAND
---------
BET TER
---------
WOR SE
----------
NO EFCT
---------
TOT SUPP
---------
STRG SUPP
---------
TOT OPP
---------
STRG OPP
---------
TOT SUPP
----------
STRG SUPP
---------
TOT OPP
---------
STRG OPP
---------
TRU MP
---------
SOME ELSE
----------
TOTAL
622 100.0
558 100.0
446 100.0
59 100.0
40 100.0
381 100.0
204 100.0
542 100.0
36 100.0
30 100.0
545 100.0
495 100.0
65 100.0
49 100.0
502 100.0
394 100.0
104 100.0
69 100.0
483 100.0
105 100.0
18-34
118 19.0
103 18.4
66 14.7
14 23.6
4 9.4
70 18.4
46 22.7
100 18.5
5 14.9
10 32.0
97 17.8
87 17.5
18 28.2
10 21.3
91 18.0
61 15.4
23 21.9
15 21.6
82 17.1
26 25.2
35-44
81 13.0
67 12.0
54 12.0
14 23.4
10 26.4
42 11.0
32 15.9
65 12.1
6 16.2
5 15.6
66 12.1
55 11.1
13 20.5
12 23.7
60 11.9
44 11.1
21 20.3
12 17.9
57 11.8
19 18.6
45-54
112 18.0
104 18.7
87 19.6
7 11.9
6 15.6
68 17.9
38 18.5
103 18.9
7 19.4
2 5.9
100 18.3
94 19.0
11 16.3
6 12.5
94 18.7
83 20.9
14 13.2
10 14.0
94 19.4
16 15.7
55-64
137 22.0
128 22.9
107 24.0
7 12.8
5 13.4
89 23.2
39 19.4
125 23.0
6 15.4
6 18.6
126 23.1
116 23.5
8 11.9
7 14.1
112 22.4
97 24.6
20 19.0
11 15.8
106 21.9
18 17.3
65+
171 27.5
153 27.4
129 29.0
17 28.4
14 35.3
112 29.5
45 22.0
146 26.9
12 34.1
8 27.8
153 28.1
140 28.2
15 23.2
14 28.3
142 28.3
110 28.0
27 25.6
21 30.7
141 29.2
24 23.2
REFUSED
3 0.5
3 0.6
3 0.7
3 1.5
3 0.6
3 0.6
3 0.6
3 0.6
3 0.6

Colorado Republican Survey, Jan. 30th - 31st and Feb. 4th, 2019, 622n, 3.93% MoE, Weighted Results, Magellan Strategies, 1685 Boxelder St. Suite 300, Louisville, CO 80027, 303-861-8585 Table 18-4 T19. Which of the following age groups applies to you? FULL DAY KINDER RED FLAG REGION BY CD --------------------------------------------- -------------------------------------------- -------------------------------------------------------------------------------
TOTAL ---------
TOT SUPP
---------
STRG SUPP
---------
TOT OPP
----------
STRG OPP
---------
TOT SUPP
---------
STRG SUPP
---------
TOT OPP
---------
STRG OPP
----------
CD1
---------
CD2
---------
CD3
---------
CD4
---------
CD5
---------
CD6
----------
CD7
---------
TOTAL
622 100.0
210 100.0
92 100.0
384 100.0
313 100.0
374 100.0
181 100.0
207 100.0
134 100.0
50 100.0
87 100.0
93 100.0
124 100.0
112 100.0
87 100.0
68 100.0
18-34
118 19.0
40 18.9
21 23.3
75 19.6
59 18.8
67 18.0
31 16.9
49 23.8
37 27.5
19 38.8
12 14.3
17 18.1
15 11.8
24 21.3
20 22.6
11 16.6
35-44
81 13.0
38 18.0
21 23.3
38 10.0
28 9.0
54 14.3
29 16.2
24 11.9
13 9.8
7 13.8
13 14.8
10 10.9
18 14.4
14 12.2
9 10.4
10 15.2
45-54
112 18.0
37 17.7
16 17.5
71 18.6
60 19.2
62 16.7
33 18.3
41 19.9
28 21.2
5 10.8
14 16.4
14 15.2
29 23.5
24 21.4
17 19.4
8 11.8
55-64
137 22.0
37 17.5
10 11.4
94 24.5
77 24.6
81 21.7
32 17.9
49 23.7
30 22.4
9 18.5
21 24.0
20 21.9
29 23.6
24 21.1
17 19.8
16 23.6
65+
171 27.5
57 27.2
21 22.9
104 27.0
87 27.9
107 28.5
54 29.8
43 20.7
26 19.1
9 18.1
27 30.5
29 30.6
33 26.8
27 24.0
24 27.9
22 32.8
REFUSED
3 0.5
2 0.7
2 1.7
2 0.4
2 0.5
3 0.8
2 0.9
3 3.3

Colorado Republican Survey, Jan. 30th - 31st and Feb. 4th, 2019, 622n, 3.93% MoE, Weighted Results, Magellan Strategies, 1685 Boxelder St. Suite 300, Louisville, CO 80027, 303-861-8585 Table 19-1 REGION BY CD GENDER AGE COMBINED AGE TYPE OF REP INCOME PRIMARY V
GENERAL --------------------- -------------------------------------------------------- -------------------------------- -------------------------------- -------------------------------------------- ---------------------
TOTAL ---------
MEN
---------
WOM
---------
18-34
----------
35-44
---------
45-54
---------
55-64
---------
65 PLUS
---------
18-44
----------
45-64
---------
65+
---------
TRAD REP
---------
TRMP REP
---------
OTH REP
---------
LESS 50K
----------
51K 75K
---------
76K 125K
---------
MORE 126K
---------
PRIM
---------
GEN
----------
TOTAL
622 100.0
317 100.0
305 100.0
118 100.0
81 100.0
112 100.0
137 100.0
171 100.0
199 100.0
249 100.0
171 100.0
230 100.0
180 100.0
176 100.0
141 100.0
125 100.0
162 100.0
111 100.0
300 100.0
322 100.0
CD1
50 8.0
27 8.6
22 7.4
19 16.3
7 8.5
5 4.8
9 6.7
9 5.3
26 13.1
15 5.9
9 5.3
19 8.4
11 6.0
19 10.7
11 8.1
10 7.7
12 7.5
8 7.4
24 7.9
26 8.1
CD2
87 14.0
41 13.0
46 15.0
12 10.5
13 15.9
14 12.8
21 15.3
27 15.6
25 12.7
35 14.1
27 15.6
23 10.1
30 16.8
29 16.5
21 14.8
15 12.4
24 14.7
16 14.1
45 15.0
42 13.0
CD3
93 15.0
40 12.6
53 17.5
17 14.3
10 12.5
14 12.7
20 14.9
29 16.7
27 13.6
35 13.9
29 16.7
28 12.1
37 20.4
26 14.7
30 21.4
20 15.7
19 11.9
13 11.3
47 15.6
47 14.5
CD4
124 20.0
69 21.7
56 18.2
15 12.4
18 22.1
29 26.1
29 21.4
33 19.5
33 16.4
59 23.5
33 19.5
48 20.9
29 16.3
38 21.8
25 17.9
23 18.6
29 17.7
29 25.8
53 17.6
72 22.2
CD5
112 18.0
57 18.1
55 17.9
24 20.2
14 16.9
24 21.4
24 17.3
27 15.7
37 18.8
48 19.1
27 15.7
52 22.6
30 16.6
22 12.5
21 14.9
19 15.2
40 24.9
18 16.3
60 20.1
52 16.1
CD6
87 14.0
44 13.8
43 14.2
20 16.6
9 11.3
17 15.1
17 12.6
24 14.2
29 14.4
34 13.7
24 14.2
34 14.7
21 11.6
29 16.6
20 14.2
18 14.1
21 13.0
17 15.6
43 14.2
44 13.8
CD7
68 11.0
39 12.2
30 9.8
11 9.6
10 12.8
8 7.2
16 11.8
22 13.1
22 10.9
24 9.7
22 13.1
26 11.3
22 12.4
13 7.2
12 8.8
20 16.3
17 10.3
11 9.4
28 9.5
40 12.4

Colorado Republican Survey, Jan. 30th - 31st and Feb. 4th, 2019, 622n, 3.93% MoE, Weighted Results, Magellan Strategies, 1685 Boxelder St. Suite 300, Louisville, CO 80027, 303-861-8585 Table 19-2 REGION BY CD AREA YOU LIVE IN FISCAL IDEOLOGY SOCIAL IDEOLOGY TRUMP IMAGE -------------------------------------------------------------------------------------------- -------------------------------------------- -------------------------------------------- ---------------------------------------------
TOTAL ---------
BIG CITY
---------
CITY MEN
---------
CITY WOM
----------
SUB AREA
---------
SUBS MEN
---------
SUBS WOM
---------
SMAL TOWN
---------
RURL AREA
----------
VERY CON
---------
SOME CON
---------
MOD
---------
LIB
---------
VERY CON
---------
SOME CON
----------
MOD
---------
LIB
---------
TOT FAV
---------
VERY FAV
---------
TOT UNFV
----------
VERY UNFV
---------
TOTAL
622 100.0
110 100.0
49 100.0
61 100.0
241 100.0
128 100.0
113 100.0
153 100.0
108 100.0
364 100.0
184 100.0
61 100.0
4 100.0
344 100.0
138 100.0
96 100.0
38 100.0
546 100.0
425 100.0
66 100.0
42 100.0
CD1
50 8.0
29 26.5
15 31.4
14 22.5
20 8.3
11 8.8
9 7.7
28 7.6
19 10.3
3 5.2
22 6.4
9 6.3
13 13.1
6 15.1
41 7.4
23 5.3
6 9.2
3 7.8
CD2
87 14.0
10 8.9
5 10.8
4 7.4
32 13.4
12 9.6
20 17.6
31 20.1
12 11.6
50 13.6
22 11.9
12 20.1
1 29.2
41 11.9
19 14.0
16 17.1
10 24.7
65 11.9
49 11.5
21 31.9
13 30.6
CD3
93 15.0
3 3.0
1 2.7
2 3.1
12 5.0
6 4.7
6 5.4
43 28.3
32 29.7
54 14.7
31 16.9
7 11.2
2 42.3
57 16.6
26 18.7
7 6.9
3 8.9
83 15.3
65 15.4
9 13.9
4 9.9
CD4
124 20.0
3 2.6
3 4.6
22 9.1
10 8.1
12 10.4
59 38.3
40 36.8
72 19.7
40 21.6
10 16.8
76 22.2
25 18.4
18 18.9
5 12.1
115 21.1
94 22.0
8 11.5
8 18.3
CD5
112 18.0
32 29.2
15 30.7
17 28.1
46 19.1
26 20.0
20 18.1
14 9.4
16 14.9
74 20.4
31 16.6
7 11.3
67 19.5
22 16.0
14 14.7
6 15.9
104 19.0
90 21.1
5 7.5
2 5.8
CD6
87 14.0
17 15.5
8 15.7
9 15.3
57 23.8
30 23.1
28 24.5
6 3.8
7 6.5
49 13.5
26 13.8
11 18.1
42 12.2
23 17.0
16 17.1
5 13.8
76 13.9
54 12.6
11 16.6
6 14.4
CD7
68 11.0
16 14.4
4 8.7
12 18.9
51 21.3
33 25.7
18 16.2
1 0.5
38 10.5
16 8.8
10 17.3
1 28.5
39 11.2
13 9.6
12 12.2
4 9.4
61 11.3
51 12.1
6 9.4
5 13.1
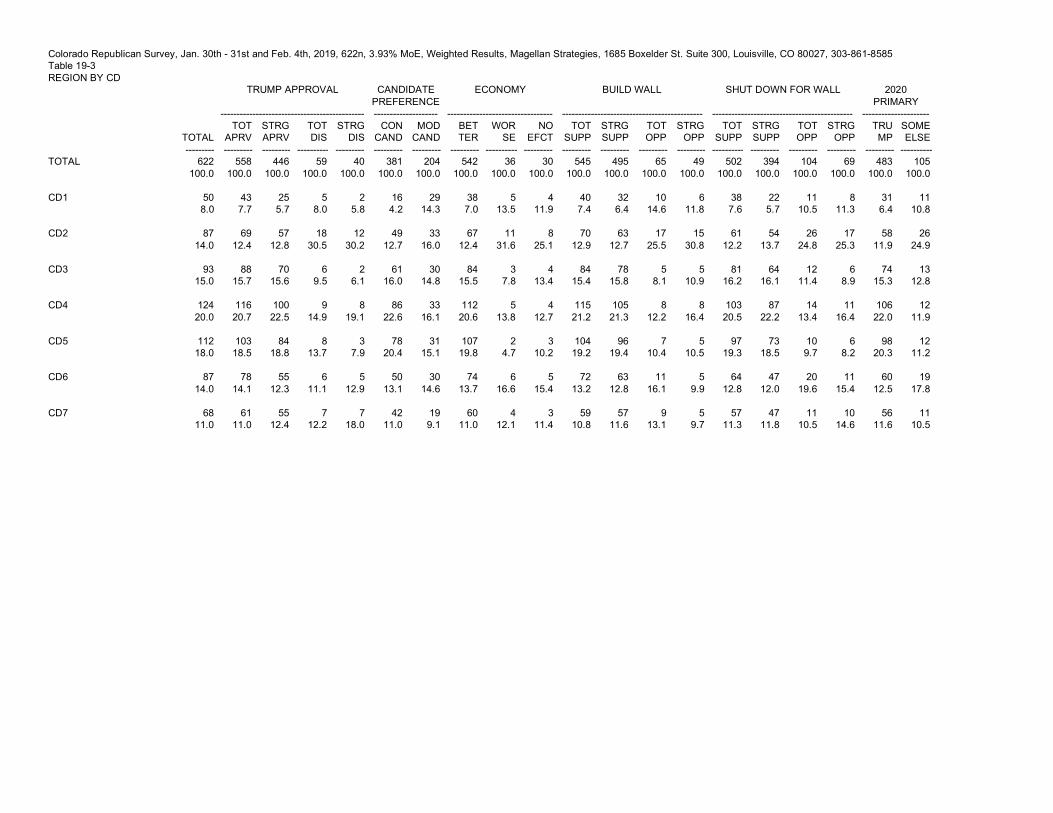
Colorado Republican Survey, Jan. 30th - 31st and Feb. 4th, 2019, 622n, 3.93% MoE, Weighted Results, Magellan Strategies, 1685 Boxelder St. Suite 300, Louisville, CO 80027, 303-861-8585 Table 19-3 REGION BY CD TRUMP APPROVAL CANDIDATE
PREFERENCE ECONOMY BUILD WALL SHUT DOWN FOR WALL 2020
PRIMARY --------------------------------------------- -------------------- --------------------------------- -------------------------------------------- -------------------------------------------- ---------------------
TOTAL ---------
TOT APRV
---------
STRG APRV
---------
TOT DIS
----------
STRG DIS
---------
CON CAND
---------
MOD CAND
---------
BET TER
---------
WOR SE
----------
NO EFCT
---------
TOT SUPP
---------
STRG SUPP
---------
TOT OPP
---------
STRG OPP
---------
TOT SUPP
----------
STRG SUPP
---------
TOT OPP
---------
STRG OPP
---------
TRU MP
---------
SOME ELSE
----------
TOTAL
622 100.0
558 100.0
446 100.0
59 100.0
40 100.0
381 100.0
204 100.0
542 100.0
36 100.0
30 100.0
545 100.0
495 100.0
65 100.0
49 100.0
502 100.0
394 100.0
104 100.0
69 100.0
483 100.0
105 100.0
CD1
50 8.0
43 7.7
25 5.7
5 8.0
2 5.8
16 4.2
29 14.3
38 7.0
5 13.5
4 11.9
40 7.4
32 6.4
10 14.6
6 11.8
38 7.6
22 5.7
11 10.5
8 11.3
31 6.4
11 10.8
CD2
87 14.0
69 12.4
57 12.8
18 30.5
12 30.2
49 12.7
33 16.0
67 12.4
11 31.6
8 25.1
70 12.9
63 12.7
17 25.5
15 30.8
61 12.2
54 13.7
26 24.8
17 25.3
58 11.9
26 24.9
CD3
93 15.0
88 15.7
70 15.6
6 9.5
2 6.1
61 16.0
30 14.8
84 15.5
3 7.8
4 13.4
84 15.4
78 15.8
5 8.1
5 10.9
81 16.2
64 16.1
12 11.4
6 8.9
74 15.3
13 12.8
CD4
124 20.0
116 20.7
100 22.5
9 14.9
8 19.1
86 22.6
33 16.1
112 20.6
5 13.8
4 12.7
115 21.2
105 21.3
8 12.2
8 16.4
103 20.5
87 22.2
14 13.4
11 16.4
106 22.0
12 11.9
CD5
112 18.0
103 18.5
84 18.8
8 13.7
3 7.9
78 20.4
31 15.1
107 19.8
2 4.7
3 10.2
104 19.2
96 19.4
7 10.4
5 10.5
97 19.3
73 18.5
10 9.7
6 8.2
98 20.3
12 11.2
CD6
87 14.0
78 14.1
55 12.3
6 11.1
5 12.9
50 13.1
30 14.6
74 13.7
6 16.6
5 15.4
72 13.2
63 12.8
11 16.1
5 9.9
64 12.8
47 12.0
20 19.6
11 15.4
60 12.5
19 17.8
CD7
68 11.0
61 11.0
55 12.4
7 12.2
7 18.0
42 11.0
19 9.1
60 11.0
4 12.1
3 11.4
59 10.8
57 11.6
9 13.1
5 9.7
57 11.3
47 11.8
11 10.5
10 14.6
56 11.6
11 10.5

Colorado Republican Survey, Jan. 30th - 31st and Feb. 4th, 2019, 622n, 3.93% MoE, Weighted Results, Magellan Strategies, 1685 Boxelder St. Suite 300, Louisville, CO 80027, 303-861-8585 Table 19-4 REGION BY CD FULL DAY KINDER RED FLAG REGION BY CD --------------------------------------------- -------------------------------------------- -------------------------------------------------------------------------------
TOTAL ---------
TOT SUPP
---------
STRG SUPP
---------
TOT OPP
----------
STRG OPP
---------
TOT SUPP
---------
STRG SUPP
---------
TOT OPP
---------
STRG OPP
----------
CD1
---------
CD2
---------
CD3
---------
CD4
---------
CD5
---------
CD6
----------
CD7
---------
TOTAL
622 100.0
210 100.0
92 100.0
384 100.0
313 100.0
374 100.0
181 100.0
207 100.0
134 100.0
50 100.0
87 100.0
93 100.0
124 100.0
112 100.0
87 100.0
68 100.0
CD1
50 8.0
16 7.4
6 6.9
31 8.1
24 7.8
34 9.0
19 10.3
12 5.9
10 7.5
50 100.0
CD2
87 14.0
40 18.9
16 17.2
41 10.7
35 11.3
50 13.5
25 13.8
29 14.3
16 11.9
87 100.0
CD3
93 15.0
29 13.7
18 19.5
61 15.8
48 15.2
50 13.4
22 12.4
33 16.2
27 19.9
93 100.0
CD4
124 20.0
40 19.2
15 16.6
81 21.0
69 21.9
76 20.3
35 19.2
41 20.0
27 20.0
124 100.0
CD5
112 18.0
38 18.3
18 20.0
71 18.4
54 17.2
60 16.2
29 16.1
44 21.4
26 19.4
112 100.0
CD6
87 14.0
30 14.1
12 13.2
52 13.5
44 13.9
61 16.4
33 18.4
26 12.5
18 13.8
87 100.0
CD7
68 11.0
18 8.4
6 6.7
48 12.5
40 12.7
42 11.2
18 9.7
20 9.8
10 7.5
68 100.0