color television industry india
TRANSCRIPT

MANAGERIAL ECONOMICS
Demand Forecasting:
The Colour Television Market
Adrija Chakraborty (F09063)
Aman Gupta (F09067)
Pritha Gupta (F09102)
Sofia Saxena (F09115)
This report primarily does a demand forecasting of Color TVs in the years to come. In this forecasting, various standard and accepted forecasting techniques are used for accurate prediction.

ContentsABSTRACT................................................................................................................................................3
INTRODUCTION:......................................................................................................................................3
DEMAND FORECASTING..........................................................................................................................7
NECESSITY OF DEMAND FORECASTING:..................................................................................................7
RECENT TRENDS IN DEMAND FORECASTING:..........................................................................................9
METHODS OF DEMAND FORECASTING USED FOR COLOUR TELEVISION DEMAND PREDICTION:.........11
CONSUMER ELECTRONICS MARKET IN INDIA: COLOUR TELEVISION.....................................................16
THE COLOUR TV INDUSTRY POST LIBERALISATION:...............................................................................17
DEMAND FORECASTING FOR COLOUR TELEVISION...............................................................................20
CONCLUSION:........................................................................................................................................23
REFERENCES:.........................................................................................................................................24
2 | P a g e

AbstractWith the flow of information and with increasing rural spending the demand for consumer electronics has increased many folds. Each year thousands of new products are introduced and each product is unique. In this cut throat competition it becomes essentially important and retail and production firms need to take into account various factors including the lead time and seasonality of goods. In this report, we study the various techniques used by retailers in India to perform demand forecasting and analysis. We present a study where we understand that historical data and judgmental techniques are primarily used for forecasting of demand.
INTRODUCTION:In the last five years colour television industry (CTV) has witnessed drastic changes in the intensity of competition. Exchange schemes, free gifts, price offs, prizes, deferred payment schemes and other incentives as promotional tools have been deployed by the players, which certainly have made the market, vibrant and pulsating. A major factor contributing to the growth has been availability of consumer financing schemes. Concomitantly, the industry is going through turbulent transformation. Companies are relooking at their strategies and are desperate for growth. Since this is a technology driven industry, companies need to constantly improvise, innovate and customise their products. Coloured cabinets, headphones, 3-D 360 degree sound technology and e-mail TV, plasma TV and golden eye technology are just a few examples. The last few years have seen a quantitative and qualitative change in TV technology and software. With the advent of several local and foreign satellite channels, demand for CTVs has seen a rise.
In fact, the television manufacturing industry has come a long way since the big black and white TV sets to the modern day ultra-thin Plasma and LCD TV sets. With the ever changing technology the Television industry has adapted itself suitably to cater to the changing tastes of the consumer.Although the top players viz. LG, Sony, Videocon, Phillips, Samsung and Onida have drastically reduced prices, they have gained more volume due to increasing market size and higher penetration levels, coupled with conscious shift towards flat colour televisions. Aggressive and innovative marketing strategies and technological advances have led to strong brand differentiation and prices. In the process the industry has evolved with products available at different price points at all levels. This process was also facilitated by growth in production in the organised segment and domestic availability of multinational brands due to lowering of import duties and other liberal measures. The television industry appears to have two clearly differentiated segments. The MNCs have an edge over their Indian counterparts in terms of technology, aggressive marketing strategy, economies of scale in branding through international events and associations combined with a steady flow of capital. The sale of TVs also tends to be event driven. During the Cricket World Cup in 1999, CTV sales recorded a phenomenal rise of 40-50%.
3 | P a g e

BASIC CONCEPTS OF DEMAND AND SUPPLY
Supply and demand is perhaps one of the most fundamental concepts of economics and it is the backbone of a market economy. Demand refers to how much (quantity) of a product or service is desired by buyers. The quantity demanded is the amount of a product people are willing to buy at a certain price; the relationship between price and quantity demanded is known as the demand relationship. Supply represents how much the market can offer. The quantity supplied refers to the amount of a certain good producers are willing to supply when receiving a certain price. The correlation between price and how much of a good or service is supplied to the market is known as the supply relationship. Price, therefore, is a reflection of supply and demand. The relationship between demand and supply underlie the forces behind the allocation of resources. In market economy theories, demand and supply theory will allocate resources in the most efficient way possible.
THE LAW OF DEMAND
The law of demand states that, if all other factors remain equal, the higher the price of a good, the less people will demand that good. In other words, the higher the price, the lower the quantity demanded. The amount of a good that buyers purchase at a higher price is less because as the price of a good goes up, so does the opportunity cost of buying that good. As a result, people will naturally avoid buying a product that will force them to forgo the consumption of something else they value more. The graph below shows that the curve is a downward slope. A, B and C are points on the demand curve. Each point on the curve reflects a direct correlation between quantity demanded (Q) and price (P). So, at point A, the quantity demanded will be Q1 and the price will be P1, and so on. The demand relationship curve illustrates the negative relationship between price and quantity demanded. The higher the price of a good the lower the quantity demanded (A), and the lower the price, the more the good will be in demand (C).
4 | P a g e

THE LAW OF SUPPLY
Like the law of demand, the law of supply demonstrates the quantities that will be sold at a certain price. But unlike the law of demand, the supply relationship shows an upward slope. This means that the higher the price, the higher the quantity supplied. Producers supply more at a higher price because selling a higher quantity at a higher price increases revenue. A, B and C are points on the supply curve. Each point on the curve reflects a direct correlation between quantity supplied (Q) and price (P). At point B, the quantity supplied will be Q2 .
Time and Supply
Unlike the demand relationship, however, the supply relationship is a factor of time. Time is important to supply because suppliers must, but cannot always, react quickly to a change in demand or price. So it is important to try and determine whether a price change that is caused by demand will be temporary or permanent. Let's say there's a sudden increase in the demand and price for umbrellas in an unexpected rainy season; suppliers may simply accommodate demand by using their production equipment more intensively. If, however, there is a climate change, and the population will need umbrellas year-round, the change in demand and price will be expected to be long term; suppliers will have to change their equipment and production facilities in order to meet the long-term levels of demand.
EQUILIBRIUM
When supply and demand are equal (i.e. when the supply function and demand function intersect) the economy is said to be at equilibrium. At this point, the allocation of goods is at its most efficient because the amount of goods being supplied is exactly the same as the amount of goods being demanded. Thus, everyone (individuals, firms, or countries) is satisfied with the current economic condition. At the given price, suppliers are selling all the goods that they have produced and consumers are getting all the goods that they are demanding. As you can see on the chart, equilibrium occurs at the intersection of the demand and supply curve, which indicates no allocative inefficiency. At this point, the price of the goods will be P* and the quantity will be
5 | P a g e

Q*. These figures are referred to as equilibrium price and quantity. In the real market place equilibrium can only ever be reached in theory, so the prices of goods and services are constantly changing in relation to fluctuations in demand and supply.
DEMAND DETERMINANTS TO BE CONSIDERED IDEALLY TO DETERMINE THE DEMAND FOR TV SETS ARE:
(i) Savings (ii) Number & quality of Telecasting (iii) Technical improvements in TV Sets (iv) Repair and maintenance services (v) Price (vi) Credit facilities (vii) Distribution of income / wealth (viii) Population (ix) Excise Govt. Policy with respect to tax, license, entertainment, community
development etc
6 | P a g e

DEMAND FORECASTING
Meaning of demand forecast
A demand forecast is the prediction of what will happen to your company's existing product sales. It would be best to determine the demand forecast using a multi-functional approach. The inputs from sales and marketing, finance, and production should be considered. The final demand forecast is the consensus of all participating managers. You may also want to put up a Sales and Operations Planning group composed of representatives from the different departments that will be tasked to prepare the demand forecast.
Determination of the demand forecasts is done through the following steps:
Determine the use of the forecast Select the items to be forecast Determine the time horizon of the forecast Select the forecasting model(s) Gather the data Make the forecast Validate and implement results
NECESSITY OF DEMAND FORECASTING:Often forecasting demand is confused with forecasting sales. But, failing to forecast demand ignores two important phenomena. There is a lot of debate in the demand planning literature as how to measure and represent historical demand, since the historical demand forms the basis of forecasting. Should we use the history of outbound shipments or customer orders or a combination of the two to proxy for demand.
Stock effects
The effects that inventory levels have on sales. In the extreme case of stock-outs, demand coming into your store is not converted to sales due to a lack of availability. Demand is also untapped when sales for an item are decreased due to a poor display location, or because the desired sizes are no longer available. For example, when a consumer electronics retailer does not display a particular flat-screen TV, sales for that model are typically lower than the sales for models on display. And in fashion retailing, once the stock level of a particular sweater falls to the point where standard sizes are no longer available, sales of that item are diminished.
7 | P a g e

Market response effects
The effect of market events that are within and beyond a retailer’s control. Demand for an item will likely rise if a competitor increases the price or if you promote the item in your weekly circular. The resulting sales increase reflects a change in demand as a result of consumers responding to stimuli that potentially drive additional sales. Regardless of the stimuli, these forces need to be factored into planning and managed within the demand forecast.
In this case demand forecasting uses techniques in causal modeling. Demand forecast modeling considers the size of the market and the dynamics of market share versus competitors and its effect on firm demand over a period of time. In the manufacturer to retailer model, promotional events are an important causal factor in influencing demand. These promotions can be modeled with intervention models or use a consensus process to aggregate intelligence using internal collaboration with the Sales and Marketing functions.
Purpose of demand forecasting
The purpose of demand forecasting differs according to the type of forecasting.(a)Short term forecasting (b)Long term forecasting
(a) Purpose of short term forecasting
It is difficult to define short run for a firm because its duration mat differ according to the nature of the commodity. For a highly sophisticated automatic plant 3 months time may be considered as short run while for another plant the duration may extend to 6 months or one year. Time duration may be set for demand forecasting depending upon how frequent the fluctuations in demand are. Short term forecasting can be undertaken by the firm for the following purposes:
(i) Appropriate scheduling of production to avoid problems of over production and under-production.
(ii) Proper management of inventories, i.e, purchasing raw material at appropriate time when their prices are low, and avoiding over-stocking.
(iii) Evolving suitable price strategy to maintain consistent sales.
(iv) Formulating a suitable sales strategy in accordance with the changing pattern of demand and extent of competition among the firms.
8 | P a g e

(v) Forecasting financial requirement for the short period.
(b) Purpose of long term forecasting
(i)Planning of a new project, expansion and modernization of an existing unit, diversification and technological up gradation.
(ii)Planning long term financial requirement. As planning for raising funds requires considerable advance notice, long term sales forecasts are quite essential to access long term financial requirement.
(iii)Planning man power requirements.Tranining and personnel development are long term propositions, taking considerable time to complete .They can be started well in advance only on the basis of estimates of manpower requirement assessed according to long term sales forecasts.
RECENT TRENDS IN DEMAND FORECASTING:
1. More firms are giving importance to demand forecasting than a decade ago.2. Since forecasting requires close cooperation and consultation with many specialists, a
team spirit has developed.3. Better kind of data and improved forecasting techniques have been developed.4. There is a greater emphasis on sophisticated techniques such as using computers.5. New products’ forecasting is still in infancy.6. Forecasts are usually broken down in monthly forecasts.7. In spite of the application of newer and modern techniques, demand forecasts are still not
too accurate.8. The usefulness of personal feel or subjective touch has been accepted.9. Top-down approach is more popular then bottom-up approach.
9 | P a g e

Methods of Demand Forecasting
Qualitative Approach Quantitative Approach
Consumer’s survey Method
Sale force composite
Jury of executive opinion
Time Series Forecasting Method
Casual Model
Delphi Method
10 | P a g e

METHODS OF DEMAND FORECASTING USED FOR COLOUR TELEVISION DEMAND PREDICTION:
We are using following methods of forecasting:
Moving average Trend projection method Least square method Linear regression method
We are estimating demand for television for the next 5 years:
2010,2011,2012,2013 and 2014.This is done using the data for the previous five years:
2003,2004 ,2005,2006,2007 and 2008. 2009 is taken as the base year.
MOVING AVERAGE METHOD:
Moving average techniques forecast demand by calculating an average of actual demands from a specified number of prior periods .Each new forecast drops the demand in the oldest period and replaces it with the demand in the most recent period; thus, the data in the calculation "moves" over time .
Moving Average = (Sum of the most recent n data values)/n Moving average: At = (Dt + Dt-1 + Dt-2 + ... + Dt-N+1 ) / N
where N = total number of periods in the average
forecast for period t+1: Ft+1 = At
Key Decision: N - How many periods should be considered in the forecast
Disadvantages:
Higher value of N - greater smoothing, lower responsiveness Lower value of N - less smoothing, more responsiveness The more periods (N) over which the moving average is calculated, the less susceptible
the forecast is to random variations, but the less responsive it is to changes A large value of N is appropriate if the underlying pattern of demand is stable A smaller value of N is appropriate if the underlying pattern is changing or if it is
important to identify short-term fluctuations
11 | P a g e

One has to retain a great deal of data and carry it along with him till the end of forecast period.
All the data in the sample are weighed equally . If more recent data are more valid than older data ,why not give them greater weight?
TREND PROJECTION METHOD:
Trend projection method is a classical method of business forecasting. This method is essentially concerned with the study of movement of variable through time. The use of this method requires a long and reliable time series data. The trend projection method is used under the assumption that the factors responsible for the past trends in variables to be projected (e.g. sales and demand) will continue to play their part in future in the same manner and to the same extend as they did in the past in determining the magnitude and direction of the variable.
Through trend projection method we can forecast a time series that has a long term trend. The trend component should reflect the gradual shifting-in this case growth of the time series values
Equation for linear trend
Tt = b0 + b1t,
Tt = trend value of the time series in the period t
b0 = intercept of the trend line
b1 = slope of the trend line
t=time
Computing the slope (b1) and intercept (b0)
b1 = (∑tYt - (∑t∑Yt)/n )/((∑t2 –(∑t)2/n)
b0 = ∑Yt/n –b1∑t/n
12 | P a g e

There are three (3) techniques of trend projection based on time –series data.
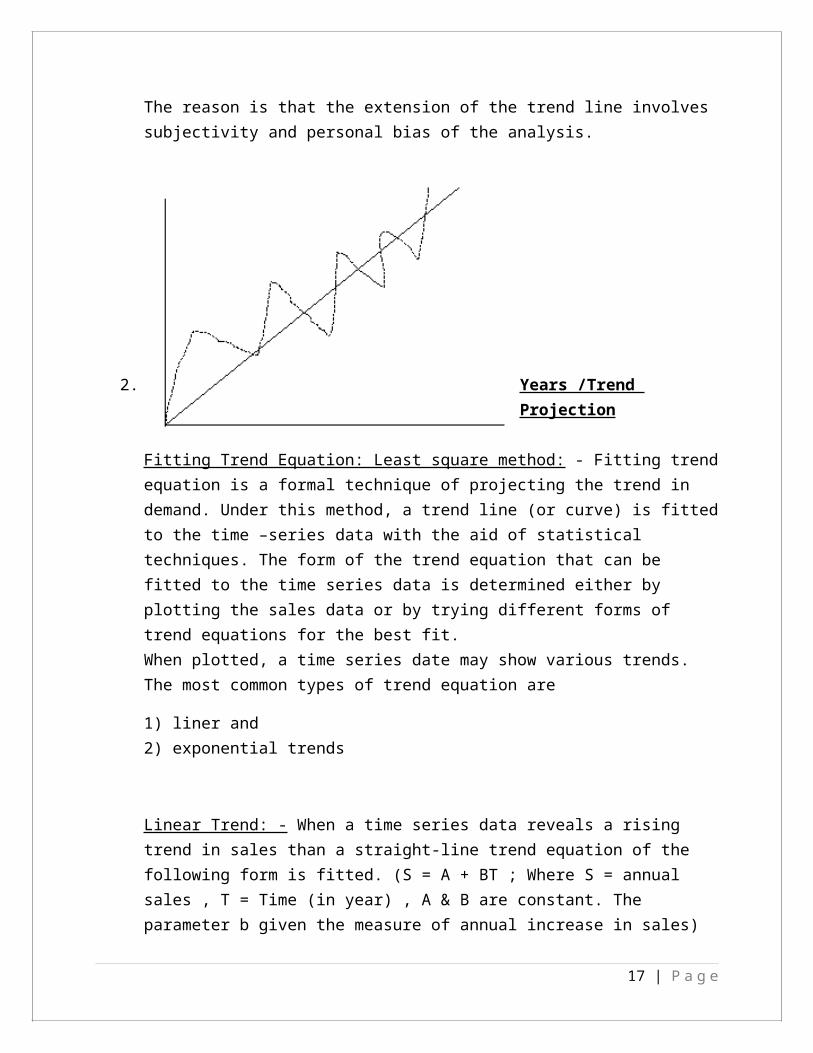
1. Graphical Method: - under this method, annual sales data is plotted on a graph paper and a line is drawn through the plotted points. Then a free hand line is so drawn that the total distance between the line and the point is minimum. Although this method is very simple and least expensive, the projections made through this method are not very reliable. The reason is that the extension of the trend line involves subjectivity and personal bias of the analysis.
2. Years /Trend Projection
Fitting Trend Equation: Least square method: - Fitting trend
equation is a formal technique of projecting the trend in demand. Under this method, a trend line (or curve) is fitted to the time –series data with the aid of statistical techniques. The form of the trend equation that can be fitted to the time series data is determined either by plotting the sales data or by trying different forms of trend equations for the best fit. When plotted, a time series date may show various trends. The most common types of trend equation are
1) liner and2) exponential trends
Linear Trend: - When a time series data reveals a rising trend in sales than a straight-line trend equation of the following form is fitted. (S = A + BT ; Where S = annual sales , T = Time (in year) , A & B are constant. The parameter b given the measure of annual increase in sales)
13 | P a g e

Exponential trend:- When sales ( or any dependent variable) have increased over the past years at an increasing rate or at a constant percentage rate, than the appropriate trend equation to be used is an exponential trend equation of any of the following type ( Y = aebt , Or its semi – logarithmic form -> Log y = = log a + bt; This form of trend equation is used when growth rate is constant.)
3. Double log trend equation of equation
Y = aTB
Or it’s double logarithmic form
Log y = log a + b log t
This form of trend equation is used when growth rate is increasing.
Advantages of trend projection method:
It is a very simple method. This method provides reasonably accurate forecasts. It is quick and inexpensive.
Disadvantages of trend projection method:
Can be used only if past data is available. It is not necessary that past trends will continue to hold good in the future also There is no analysis of casual relations between the demand and time series explaining
the why’s of it.
LINEAR REGRESSION MEHTOD:
A simple forecasting method that calculates a straight line. By its nature, the straight line it produces suggests that it is best suited to data that is expected to change by the same absolute amount in each time period. The mathematical equation shows that the variable y varies by a constant a and increasing (or decreasing) over time (denoted by x) by factor b.
14 | P a g e

yt = a + b*x --------eqn (1)
Here a and b are constants and are calculated as under using 2 simultaneous linear equations:
∑y=n*a+ b*∑x ---------eqn (2)
∑x*y=a*∑x+ b*∑x^2 -------eqn (3)
Solve above 2 equations(eqn (2) and (3)) to get the value for a and b and then put value of a and b in equation (1).
From equation (1) calculate y(demand forecasting variable) by putting different values of x for different years.
Advantages of linear regression method:
It explicitly addresses casual relationships that are evident in the real world. These include effects of prices, income changes, marketing programmes and competitor’s action on tourism demand.
It aids assessment of alternative business plans: Managers can simulate the effect of various government policies or marketing plans (for example: taxes, expenditure, regulations and subsidies) on tourism demand.
Least square method:
In this method we use the equation:
y=a + bx; ------ (1)
where,
a=∑y/n;
b=∑(xy)/∑x2;
n=no. Of years for which the values are given;
a and b are constants.
We find the values of a and b and put in equation 1st. From this equation we calculate value of y(demand forecasting variable)based on different values of x for different years.
For even number of years: We need to take the middle 2 years average as the base year and then calculate the value of x.
15 | P a g e

For odd number of years: We just directly take the middle year as the base year.
CONSUMER ELECTRONICS MARKET IN INDIA: COLOUR TELEVISIONThe consumer electronics market is one of the largest segments in the electronics industry in India. With a market size of Rs.15,897.13 crore ($3.89 billion) in 2006, catering to a population of more than 100 crore people, the consumer electronics industry in India is poised for strong growth in the years to come.
SOURCE: ELCINA REPORT 2007-08
It is predicted that the Indian audio/video consumer electronics industry will grow to Rs.26,931.13 crore ($6.59 billion) by 2011, rising at a Compound Annual Growth Rate (CAGR) of 10.0 per cent from Rs.18,390 crore ($4.5 billion) in 2007.
The growth will be aided by a multitude of factors, including:
Growing consumer confidence due to rising disposable incomes; Easy financing schemes that are making purchases possible; Increased local manufacturing;
16 | P a g e
Expanding distribution networks; Sporting events, such as the Cricket World Cup.
Television continues to be the mainstay of the consumer electronics industry in India with the transition slowly occurring to newer technologies such as LCD and PDP.
The history of the Indian television industry dates back to 1982, the year when India hosted the Asian Games. There was a huge demand for colour televisions all through the 80s.
In 1984-1985, the colour television industry was growing at an astounding rate of 140.3%. However, in 1985-86, it fell to 68.6%, 15% in 1988-89 and finally in the year 1989-90 it touched a rock bottom level of 5%. In 1991-92, the Indian economy was going through a balance of payment crisis. As a result of this, for the first time in the history of Indian colour television, one saw a deceleration in the sales of colour televisions at -14.5%. During this period, the prices of colour televisions skyrocketed due to the high import duties imposed on colour picture tubes.
THE COLOUR TV INDUSTRY POST LIBERALISATION:The Colour TV industry in India has seen a gamut of changes in the past one decade as liberalization set in the Indian subcontinent making its market highly competitive and consumer driven. With the fast changing liberalization policies, changing and growing demands of the consumers made the industry competitive. The constant desire of the companies (domestic or international) to have a major share in the market often leads them to die many deaths which has became a hackneyed phenomenon in this sector of Liberalized India if the companies are not in able to cope with changing reforms and the changing tastes and preferences of the consumers. The foreign player entered the Indian market since the Indian economy increasingly interdependent almost over the last one and half decades.
Consumers in India with open markets on an average are enjoying lower prices, improved consumption, improved savings and rising standards of living. Before liberalization in India, the consumer was at the mercy of the producer and savings management were prevailing in the sense that individuals saved and then consumed. This might be because of no financing facilities, no credit card facilities and moreover demand side economic were prevailing.
After liberalization the total scenario has changed- consumers in India moved from savings management to expenditure management. This is because of the availability of goods and services at lower price, availability of credit cards, availability of finance at low interest and in
17 | P a g e

some cases zero interest and moreover the death of power of monopoly in many sectors because of the entry of the foreign players. Producers have become price takers rather than price setters. The tastes and preferences, life style and consumption patterns of the consumers have also changed. Like other third world countries, people in India have started spending much more money on eating out; started buying a flat or a car because of the availability of credit cards and easy financing facilities; more number of people have been travelling abroad after liberalization and there has been a distinct shift from joint family system to that of nuclear families.
As per the estimates of the confederation of Indian Industry (CII) the Indian consumer durable industry is Rs 20,000 crore business industry. The industry is highly dominated by the foreign players occupying the top slots in the market shares.
From a recent data obtained from the Equitymaster.com the market share of all the MNCs in the colour TV segment is about 65%. The biggest attraction for these players is the growing Indian middle class, which is approximately 250 million, and also low penetration levels characterize this market. Most of the segments in this sector are characterized by intense competition, emergence of new companies (especially MNC’s), introduction of state-of-the-art models, price discounts and exchange schemes. There is a significant shift today. 15-20 years ago, it was a Seller's market. Customers had to buy what was available. There was absolutely no choice. But today, it is entirely different. It is a Buyer's market. There is plenty of choice, both in terms of brands and the items. It has helped in widening the product base of consumer durables. Also, technological changes have helped the boom in the industry. TV sets are still the fastest growing category among household durables. During the last two years 11.5% of Indian homes bought a TV set. This figure is even higher among the top eight metros at 21.3% about one in every five home in these cities acquired a TV set in the last two years.
Because of the entry of the foreign players we felt that in the Indian Colour T.V. Industry the following changes have taken place, according to the Father of Economics Adam Smith in his book wealth of Nations (1776):
1. Economic substitutability and technical substitutability: The colour T.V industry is facing intense competition and in the process new innovations in the form of giving additional features are taking place,
2. Indifference in brand preference: The consumers are indifferent in choosing the brand because whatever the brand that the consumer is going to purchase gives the same satisfaction. This because the features of T.V in almost all the brands are same and there is a negligible difference in the prices. However in case of local made company products are cheaper. Hence we can define the indifference in brand preference as the locus of all brands in which the consumer gets the same level of satisfaction
3. Excludability: The producers are not excluding the customer before going to produce the product like how they well ventilated before liberalization. Without due care and
18 | P a g e

attention, the relationship between producer and consumer becomes much more akin to a gibberish than a purchase and sale one.
4. Rivalry: in the information era economy the use or enjoyment will no longer necessarily involve rivalry. Especially with most tangible goods like TV, if X uses one brand of TV there is no guarantee that Y also uses the same brand. Free market price provides the producer with an ample award for its effort. It also leads to the appropriate level of production.
5. Transparency: The consumers know what they want and what they are buying so that they can effectively take the advantage of competition and comparison –shop and moreover the marginal cost of information is zero. Hence the producers should be transparent.
As a result of which the entrenched position of the Indian market leaders in CTVs’ like Videocon, BPL and Onida has been challenged by the MNCs such as LG, AIWA, Akai, Panasonic, Samsung, Sony, Philips and Sharp; some in a perceptible way and others threatening to do so.
Some of the growth drivers because of which CTV market is growing fast are:
Increased awareness Increase in disposable income Emergence of nuclear families Rising availability Declining prices
Many MNC and domestic companies are now making India as a manufacturing centre because:
Low cost skilled labor Tax free zones i.e. SEZs Qualified workforce Untapped domestic market Excellent supply base for glass and colour picture tubes
Some economic measures that have also played a role in this phenomenal growth are:
Custom duty on colour picture tubes (CPT’s) lowered to 20% from 25% Abatement rates on TV sets have changed from 35% to 40% Special additional duty on customs of 4% was done away with Single rate of excise duty at 16%
19 | P a g e

YearDeviations from the middle of 2005
and 2006
Square of
deviation
Sales(in
million no.)
Product of deviation and sales
valueX X2 Y XY
2003 -5 25 8.5 -42.52004 -3 9 9.25 -27.52005 -1 1 10.25 -10.252006 1 1 11.75 11.752007 3 9 14.5 43.52008 5 25 16.5 82.5
DEMAND FORECASTING FOR COLOUR TELEVISIONWe have already seen that there are various methods of demand forecasting. Here, we are going to forecast the demand for colour television using three popular techniques, namely, regression equation using least square, Moving Average Method and Trend Projection Method.
Regression equation method
The regression equation is given as:
Y= a + bX
Where, a= ∑Y/ n and b=∑XY/ ∑X2
Here, a=11.79, b=0.82
Year Deviations Sales
X y2009 7 17.522010 9 19.152011 11 20.792012 13 22.422013 15 24.062014 17 25.69
20 | P a g e

A graph of the future trend in sales of colour television is given as below:
Moving Average
Moving Average = (Sum of the most recent n data values)/n
To Illustrate the moving average method, consider the sales figures w.r.t Fig (i). Here we take a two year moving average. The moving average calculation for the first two years for the time series is
Moving average = (8.5+9.25)/2
The moving average as the forecast for the third year i.e. 2005 is then taken. Because the actual values observed in 2005 is 10.25, the forecast error for 2005 is obtained by finding the difference between the observed value of the time series and the forecast.
The calculation for the second two year moving average is
Moving average= (9.25+10.25)/2 .Thus the calculated result is as follows:
YearTime Series
Value
Moving Average Forecast
Forecast Error
Squared Forecast Error
2003 8.52004 9.252005 10.25 8.875 1.375 1.8906252006 11.75 9.75 2 42007 14.5 11 3.5 12.252008 16.5 13.125 3.375 11.3906252009 15.5
21 | P a g e

One variation to this method is the weighted moving averages which involves selecting a different weight for each data value and the computing the weighted average of the most recent n values.
Forecast for 2009=((11.75*(1/6))+(14.5*(2/6))+(16.5*(3/6)))= 15.041
Trend Projection Method
Through trend projection method we can forecast a time series that has a long term trend. The trend component should reflect the gradual shifting-in this case growth of the time series values
Equation for linear trend
Tt = b0 + b1t
Tt = trend value of the time series in the period tb0 = intercept of the trend lineb1 = slope of the trend linet=time
Computing the slope (b1) and intercept (b0)
b1 = (∑tYt - (∑t∑Yt)/n )/((∑t2 –(∑t)2/n)b0 = ∑Yt/n –b1∑t/n
Therefore the trend projection is done as:
22 | P a g e
Year (t) Sales Value(Yt)
Yt(t) t^2
1 8.5 8.5 12 9.25 18.5 43 10.25 30.75 94 11.75 47 165 14.5 72.5 256 16.5 99 36

Sum of t =21 ;Sum of Sales Value Yt =70.75 ; Yt *t = 276.25 ; t^2 =91
Therefore, µt =3.5 µY =11.791
Applying the formula,
b1 =1.64 ; b0 = 6.05
Linear Trend,Tt=6.05+1.64*t
Therefore Trend for year 2009, T7=6.05+1.64*7=17.53
Thus, the trend for the next five years is given below:
Year Forecast
2009 17.532010 19.172011 20.812012 22.452013 24.09
CONCLUSION:With the advent of new technologies and new markets opening up the positive trend for consumer electronics especially television is bound to seen in subsequent years. The above demand forecasting analysis done through regression analysis, moving average and trend projection method suggests that demand for Color Television Sets will increase in next 5 years.
23 | P a g e

REFERENCES:1) ELCINA report for the year 2007-082) FICCI consumer durable goods survey, 20073) LIBERALIZATION AND COLOR T.V. INDUSTRY IN INDIA by SESHAIAH, Venkata
and KRISHNA, Radha4) Indian Television Industry: A Strategic Analysis by Seema Gupta5) Various statistical and Legal advisory sites
24 | P a g e