colonoscopy quality: impact on outcomes · learning objectives following this presentation,...
TRANSCRIPT

Colonoscopy Quality: Impact on Outcomes
Great Plains Quality Innovation Network
September 27, 2016
Durado Brooks, MD, MPH
Managing Director, Cancer Control Intervention

Learning Objectives
Following this presentation, participants will be able to:
• Discuss the role of quality colonoscopy in CRC prevention and adenomatous polyp detection
• Understand evidence-based quality indicators for colonoscopy
• Recognize and avoid overuse of screening and surveillance colonoscopy
• Identify responsibilities of endoscopy facilities and teams related to quality improvement in screening for CRC

Colorectal Cancer (CRC)
• 2nd most common cause of cancer death in the US
• More than 134,000 new cases expected in US in 2015
• Nearly 50,000 US deaths
• 1.2 million Americans living with CRC
• Incidence and death rates have fallen steadily past 20 years
Cancer Facts and Figures 2015

4% 11% 27% (2000-2011)
CRC mortality decline per decade:
15%
Year of death
Overall CRC death rate decline in the US
Siegel et al, CEBP 2015

Decline in CRC Incidence
• Decline due to:
– Improvements in treatment
– Screening earlier cancer detection and improved outcomes
– Screening polyp removal prevention
• Recent study estimates that screening has prevented approximately 550,000 cases of colorectal cancer in the US over the past three decades.
Yang, Cancer 2014

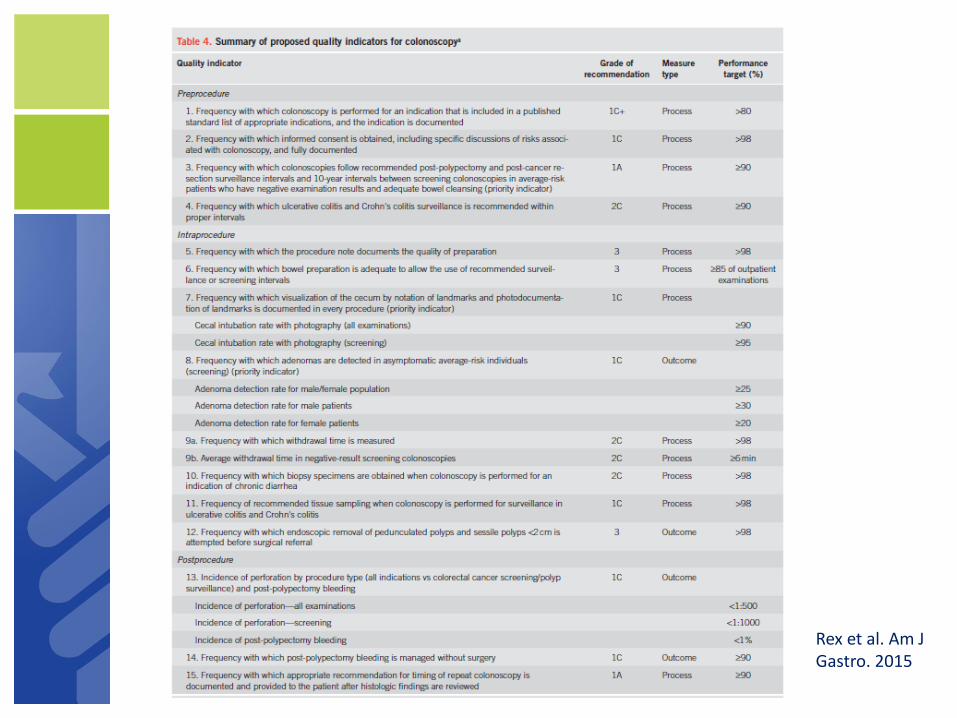
Rex et al. Am J Gastro. 2015

Key Quality Indicators
• Prep Quality
• Cecal Intubation Rate
• Withdrawl Time
• Adenoma Detection Rate (ADR)*
• Appropriate Follow Up Intervals
*Can be viewed as a function of the other quality measures.
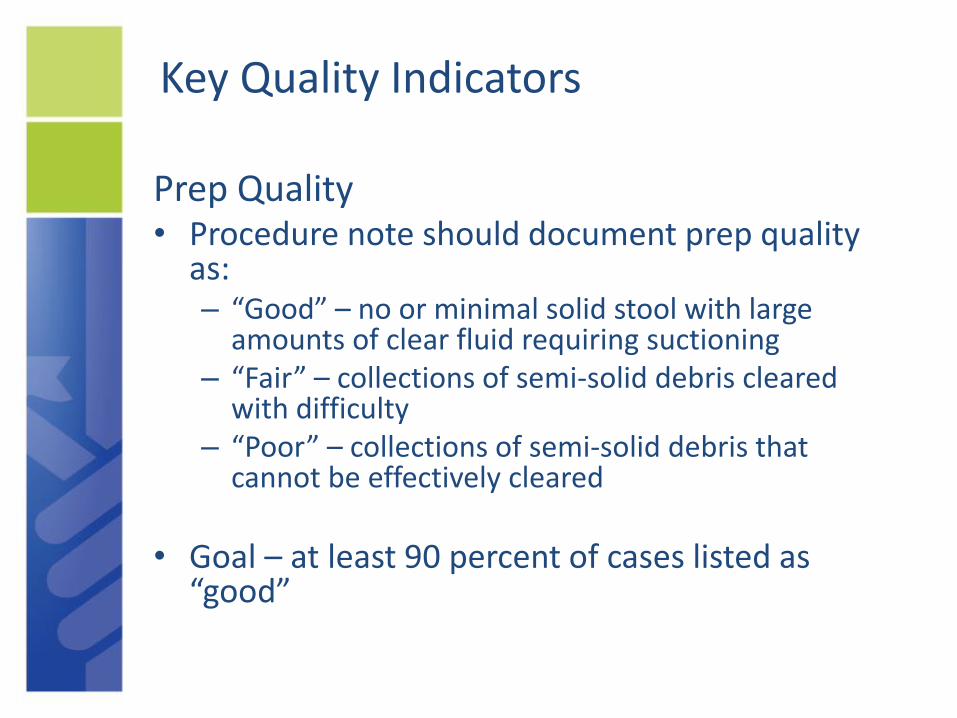
Key Quality Indicators
Prep Quality • Procedure note should document prep quality
as: – “Good” – no or minimal solid stool with large
amounts of clear fluid requiring suctioning – “Fair” – collections of semi-solid debris cleared
with difficulty – “Poor” – collections of semi-solid debris that
cannot be effectively cleared
• Goal – at least 90 percent of cases listed as “good”

Patient prep
Good prep in right colon
Poor prep in right colon

Patient prep
• Most commonly recommended is now polyethylene glycol (PEG)
• PEG is safer than sodium phosphate (NaP) in patients with CHF or renal/hepatic compromise
• Split dosing is better tolerated and more effective

Key Quality Indicators
Prep Quality Impacts:
– Follow up interval
• Poor prep often requires short follow up
– Complication rate
– Cecal intubation rate
– Adenoma detection rate

ADR vs. prep quality
Volume 75, No. 3 : 2012 Gastrointestinal Endoscopy

Key Quality Indicators
Cecal Intubation Rate • Tip of the colonoscope is passed beyond the
ileocecal valve lip, allowing effective visualization of the medial wall of the cecum lying proximal to the ileocecal valve
• Photo-documentation important to confirm that the cecum was intubated.
• Recommended benchmarks (ACG/ASGE task force) – 90% for all exams – 95% for screening exams
• Low intubation rates associated with low ADR and increased risk of interval cancers

Key Quality Indicators
Withdrawl Time
• Withdrawal time, not including polyp resection, should avg at least 6–9 min
• Strong correlation with ADR in some studies
Barclay et al. NEJM;2006;355:2533

Key Quality Indicators
Adenoma Detection Rate (ADR) • ADR – rate of detection of adenomatous polyps at
screening colonoscopy in population age 50+
• At least one adenoma should be found 30 percent of the time in men, and 20 percent of the time in women (25 percent composite*)
• Studies indicate wide variation in ADR, even among clinicians in same practice
• ADR inversely associated with risk for:
– Interval cancers (cancer after “normal” screening exam, diagnosed before next screen is due)
– CRC death
*ACG/ASGE task force 2015
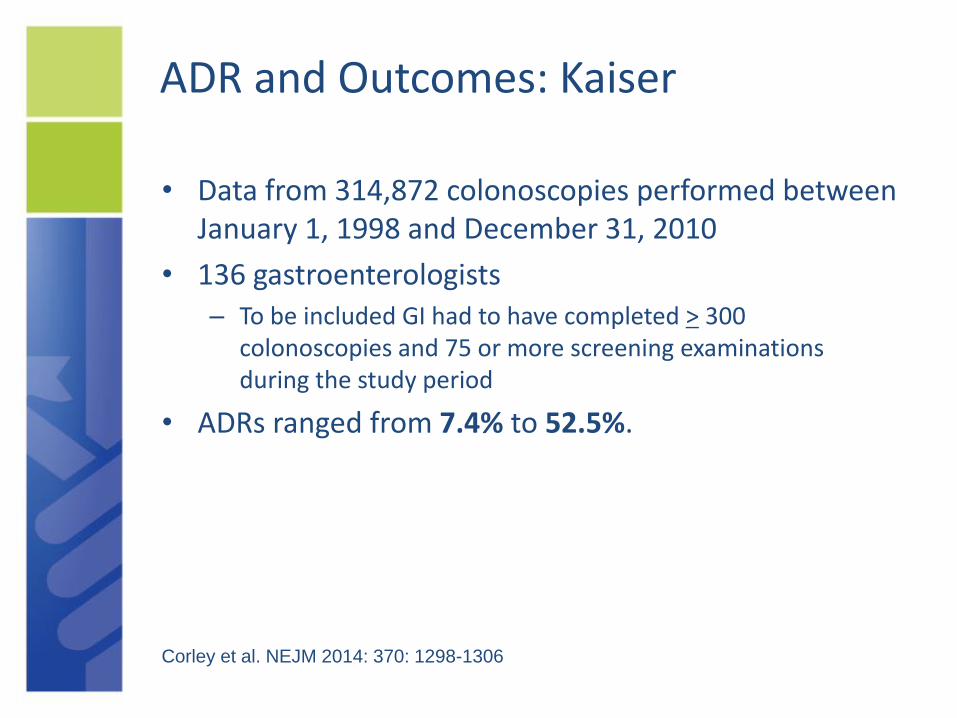
ADR and Outcomes: Kaiser
• Data from 314,872 colonoscopies performed between January 1, 1998 and December 31, 2010
• 136 gastroenterologists – To be included GI had to have completed > 300
colonoscopies and 75 or more screening examinations during the study period
• ADRs ranged from 7.4% to 52.5%.
Corley et al. NEJM 2014: 370: 1298-1306

©2009 American Cancer Society, Inc. No.0052.19
ADR and Risk of Interval Cancer
Corley et al. NEJM 2014: 370: 1298-1306
Quintile 1 – ADR < 20% Quintile 5 – ADR > 33%

©2009 American Cancer Society, Inc. No.0052.19
ADR and Risk of Fatal Cancer
Corley et al. NEJM 2014: 370: 1298-1306
Quintile 1 – ADR < 20% Quintile 5 – ADR > 33%

Improving ADR
What does not work? • Mandating longer withdrawal time does not
increase the ADR (Sawhaney, et al. Gastro 2008;135;1892)
• Passive notification does not increase ADR (Shaukat et al. CGH 2009;7:1335)

Improving ADR
Proven interventions • Physician report cards and standardized
practice protocols are effective (Kahi et al. Gastrointest Endosc 2013; Keswani et al. Am J Gastroenterol 2015)
• Educational interventions can increase the ADR (Coe et al. Am J Gastro 2013;108:219)

Mayo Endoscopic Quality Improvement Program (EQUIP)
• ADRs measured at baseline
• 15 endoscopists randomly assigned to undergo EQUIP training.
• Baseline and post-training study ADRs examined for all endoscopists (trained and un-trained) to evaluate the impact of training.
• A total of 1,200 procedures were completed in each of the two study phases

Mayo “Endoscopic Quality Improvement Program (EQUIP study)” • Training
– 2 Educational sessions (1-1.5 hours each)
• Techniques to improve detection (with videos)
• Videos of highest ADR physicians
– Monthly feedback on ADR and WD time
• Results posted on ASC wall (de-identified)
• Individual informed of ADR and group data
– Measured ADR at baseline
– Repeat after intervention
Coe et al. Am J Gastro 2013;108:219

Individual endoscopist ADRs in EQUIP (phase I and phase II)

Colonoscopy Follow Up Intervals
• In the average-risk population, colonoscopy screening is recommended in all current guidelines at 10-year intervals.
• Post-polypectomy surveillance intervals vary, depending on histology, size and number of lesions removed.
• Screening and post-polypectomy surveillance colonoscopy is frequently performed at intervals that are shorter than those recommended in guidelines.
• Performing colonoscopy too often not only increases patients’ exposure to procedural harm, but also drains resources that could be more effectively used to adequately screen those in need.

Appropriate Colonoscopy Intervals
• For those at average risk, begin at 50 years old and repeat every 10 years if results are negative
• Patients with first-degree relative diagnosed with CRC at age 60 are considered average risk

Appropriate Colonoscopy Intervals
• Patients with more than one first-degree relative with CRC or one first-degree relative diagnosed before age 60 should be screened every five years beginning at age 40 (or 10 years before the age at which relative was diagnosed with CRC)

Recommended Follow Up Intervals
No polyp
Small hyperplastic polyps
1-2 small tubular
adenomas
3-10 tubular adenomas
>10 adenomas
Any adenoma >10 mm
Any adenoma with villous
elements or hi-grade dysp
10 years
10 years
5-10 years
3 years
<3 years
3 years
3 years
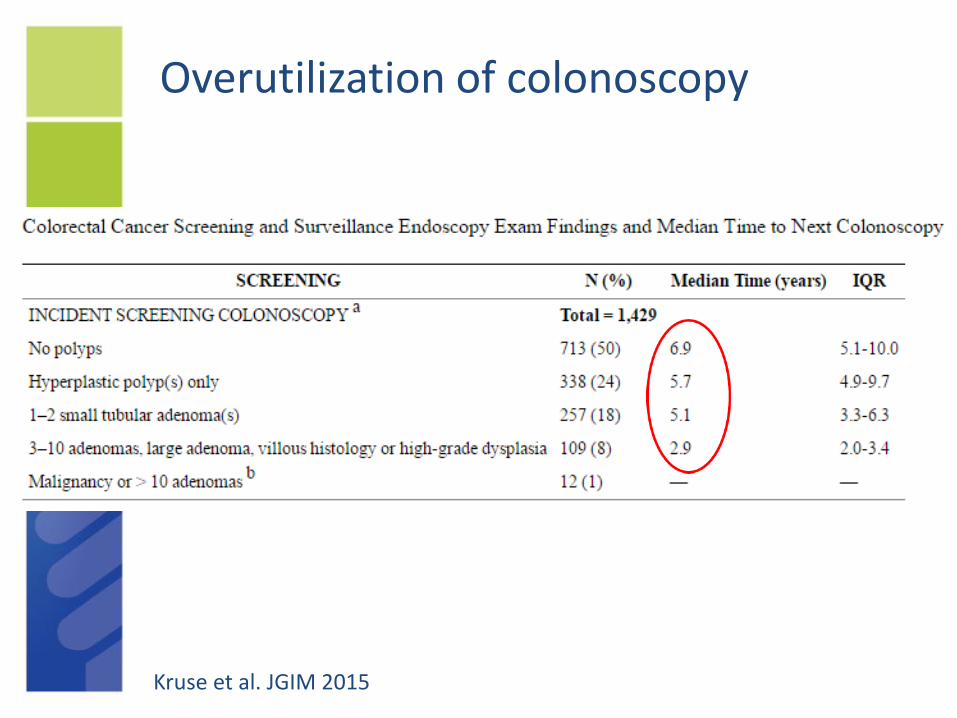
Overutilization of colonoscopy
Kruse et al. JGIM 2015

Overutilization of colonoscopy
• Among 12,071 Medicare beneficiaries (ages 70+) who underwent polypectomy/biopsy from 2001-2004, 45.7 percent had a repeat colonoscopy in five years (Cooper G, et al. Cancer 2013; DOI: 10.1002/cncr.27990)
• Among 24,000 Medicare beneficiaries who had normal colonoscopy from 2001-2003, 46.2 percent had a repeat colonoscopy within seven years (Goodwin J, et al. Arch Intern Med, May 11, 2011)

©2009 American Cancer Society, Inc. No.0052.19 Goodwin JS et al. Arch Intern Med 2011;171:1335-43
(-)Colonoscopy for screening indication
(-) colonoscopy (all indications)
% repeat CSP 50% 30%
4yr 5yr 6
Overuse of Colonoscopy Screening After a Negative Exam in the Medicare Population
All patients with complete colonoscopy

Other quality measures
• Documentation of Informed consent
– Includes discussion of risks (bleeding, perforation, infection, etc.)
– Also includes benefits of colonoscopy and alternative screening tests
• Number of mucosally-based pedunculated polyps and sessile lesions removed by endoscopic resection
• Incidence of perforation, other complications

A quality colonoscopy report
• Date and time of procedure
• Procedure planned
• Patient information
• Risk factors and co-morbidities
• Indications for colonoscopy
• Signed consent
• Sedation or anesthesia plan
• Colonoscope type, model, no.
• Adequacy of bowel prep
• Reached cecum? Retroflexed?
• Withdrawal time in minutes
• Findings
• Number of specimens sent to lab
• Assessment
• Unplanned complication/events
• Pathology
• Recommendations
• Follow-up plan/recall

Select References
• Cancer Facts and Figures. American Cancer Society 2015.
• Anderson JC, Butterly LF. Colonoscopy: Quality Indicators. Clin Transl Gastroenterol. 2015 Feb; 6(2): e77
• Rex DK, Schoenfeld PS, Cohen J, et al. Quality indicators for colonoscopy. Gastrointest Endosc. 2014;81:31–53
• Johnson et al. Optimizing Adequacy of Bowel Cleansing for Colonoscopy: Recommendations From the US Multi-Society Task Force on Colorectal Cancer. Gastroenterology 2014;147:903–924
• Corley et al. Adenoma detection rate and risk of colorectal cancer and death. N Engl J Med. 2014 Apr 3; 370(14):1298-306
• Coe et al. An endoscopic quality improvement program improves detection of colorectal adenomas. Am J Gastroenterol. 2013 Feb; 108(2):219-26
• Goodwin JS et al. Overuse of Screening Colonoscopy in the Medicare Population. Arch Intern Med 2011;171:1335-43