colloidal processing of non-oxide ceramic powders in aqueous medium
TRANSCRIPT

Colloidal Processingof Non-Oxide Ceramic Powders
in Aqueous Medium
Eric Laarz
Stockholm 2000
Department of Materials Scienceand Engineering
The Brinell CentreInorganic Interfacial Engineering
Colloidal Processingof Non-Oxide Ceramic Powders
in Aqueous Medium
Eric Laarz
Akademisk avhandling
Som med tillstånd av Kungliga Tekniska Högskolan framlägges till offentlig granskning föravläggande av teknisk doktorsexamen onsdagen den 29 november 2000 kl. 13.00 iKollegiesalen, KTH, Valhallavägen 79, Stockholm.
Stockholm 2000

Adress to the author:
Eric LaarzInstitute for Surface ChemistryP.O. Box 5607SE � 11486 StockholmSweden
ISBN 91-7170-649-6
Denna avhandling är skyddad enligt upphovsrättslagen. Alla rättigheter förbehålles.
Copyright © Eric Laarz
All rights reserved. No parts of this thesis may be reproduced without written permission fromthe author.

Abstract
Aspects belonging to a wide range of ceramic processing steps, from powdercharacterization to sintering, have been investigated in this thesis. The work includedpreparation and characterization of aqueous single and multi-component systems ofnon-oxide ceramic powders.
The deagglomeration and dispersion of an as-received Si3N4 powder was related to thenature of the interparticle bonds and the powder surface chemistry. The relativeimportance of several mechanisms responsible for the break-up of agglomerates wereevaluated using mildly agitated, dilute suspensions. Large, secondary agglomerates thatare held together by attractive surface forces decay rapidly due to hydrodynamic shearand repulsive electrostatic surface forces. The oxidized Si3N4 crystallites in small,primary agglomerates are bonded together by strong, solid interparticle necks. Slowdisintegration of primary agglomerates was improved by neck dissolution at elevatedtemperatures and alkaline pH; extensive dissolution at pH=12 increased the ionicstrength in solution and, thus, lead to flocculation. The dissolution rate constants andactivation energy for silicon nitride were found to be similar to amorphous silica.
Stabilization of silicon nitride particles with adsorbed anionic polyelectrolytes wasinvestigated by direct measurement of interparticle forces, and by characterization ofelectrokinetic and rheological suspension properties. Measurements using a novelspherical Si3N4 probe showed that adsorption of poly(acrylic acid) (PAA) at pH>pHiep
leads to repulsive interparticle forces with dominating electrostatic and negligible stericcontributions. Adsorption of anionic, methacrylic copolymers with graftedpoly(ethylene oxide) side-chains (PMAA-PEO) onto Si3N4 resulted in a rheologicalprofile nearly identical to that of the PAA-stabilized system. It was concluded that thecopolymer adsorbes as a flat layer due to attractive interactions between surface sitesand the PMAA and PEO segments. The analysis of interparticle forces in the presentSi3N4/PAA system and the ZrO2/PAA system in other studies suggests that PAAassumes an extended interfacial conformation at pH>pHiep only when relaxation of thepolymer chains at the interface is inhibited by formation of irreversible surface-segmentbonds.
Electrokinetic and rheological measurements were employed to characterize the effectof polyelectrolyte addition on suspension properties of powder mixtures (i.e. TiN/TiC-Al2O3 with PAA and WC-Co with polyethyleneimine additions). It was demonstratedhow optimization of the processing scheme and pH-control lead to well-dispersed,colloidally stable multi-component systems. The evaluation of TiN/TiC-Al2O3
composite microstructures after freeze-granulation and hot-pressing showed thathomogeneous and dense sintered bodies could be produced when TiN or TiCparticulates and whiskers were used as a reinforcing phase. Composites with TiNnanoparticles exhibited grain growth of either the matrix or the secondary phasedepending on the TiN concentration.
Keywords: ceramic, hard metal, suspension, aqueous, non-oxide, processing, colloidal,silicon nitride, titanium nitride, titanium carbide, tungsten carbide, polyelectrolyte,composite, dispersant, rheology, atomic force microscopy, electrokinetics, dissolution,deagglomeration, stabilization, interparticle forces, polymer conformation,microstructure
List of Papers
The papers listed below are included in this thesis and will be referred to with thecorresponding Roman numeral.
I. L. Bergström, E. Laarz and R. Greenwood�Electroacoustic Studies of Aqueous Ce-ZrO2 and Si3N4 Suspensions�pp. 229-241 in Handbook on Ultrasonic and Dielectric CharacterizationTechniques for Suspended Particles, Edited by J. Texter and V. A. Hackley, TheAmerican Ceramic Society, Westerville, (1998).
II. E. Laarz, B. V. Zhmud and L. Bergström�Dissolution and Deagglomeration of Silicon Nitride in Aqueous Medium�Journal of the American Ceramic Society, 83, 2394-2400, (2000).
III. E. Laarz and L. Bergström,�Deagglomeration, Dissolution and Stabilization of Silicon Nitride inAqueous Medium�in Ceramic Transactions Series, Proceedings of the 7th International Conferenceon Ceramic Powder Processing Science, Inuyama, Japan; Edited by S. Hirano,G.L. Messing, N.E. Claussen, The American Ceramic Society, Westerville, (inpress).
IV. E. Laarz, A. Meurk, J. A. Yanez and L. Bergström�Silicon nitride colloidal probe measurements: Interparticle forces and therole of surface-segment interactions in poly (acrylic acid) adsorption�Journal of the American Ceramic Society, (submitted).
V. E. Laarz and L. Bergström�The effect of anionic polyelectrolytes on the properties of aqueous siliconnitride suspensions�Journal of the European Ceramic Society, 20, 431-440, (2000).
VI. E. Laarz and L. Bergström�Dispersing WC-Co Powders in Aqueous Media with Polyethylenimine�International Journal of Refractory Metals & Hard Materials, (in press).
VII. E. Laarz, M. Carlsson, B. Vivien, M. Johansson, M. Nygren and L. Bergström�Colloidal processing of Al2O3-based composites reinforced with TiN andTiC particulates, whiskers and nanoparticles�Journal of the European Ceramic Society, (accepted for publication).
I am the main author of all publications except for Paper I. I had no part in the work onzirconia presented in Paper I or the molecular dynamics simulations presented in Paper II,which were contributed by Richard Greenwood and Boris Zhmud, respectively.

Papers listed below are not included in the thesis but contain some information relevant to thecolloidal processing of ceramic powders.
VIII. E. Laarz, G. Lenninger and L. Bergström�Aqueous Silicon Nitride Suspensions: Effect of Surface Treatment on theRheological and Electrokinetic Properties�Key Engineering Materials, 132-136, 285-288, (1997).
IX. J. A. Yanez, E. Laarz and L. Bergström�Viscoelastic properties of particle gels�Journal of Colloid and Interface Science, 209, 162-172, (1999).
Summary of Papers
Paper I Electroacoustic Studies of Aqueous Ce-ZrO2 and Si3N4 Suspensions
The electrokinetic properties of moderately concentrated zirconia andsilicon nitride suspensions were investigated with an electroacousticmethod. The measured electrokinetic properties of Ce-ZrO2 suspensionswere in good agreement with rheological measurements; both methodssuggest an isoelectric point of pHiep≈8. A significantly lower isoelectricpoint was obtained with microelectrophoresis of dilute suspensions.Possible effects of powder dissolution and equilibration time on theelectrokinetic suspension properties at high and low surface-to-volumeratios are discussed. A strong influence of leaching and oxidationtreatment on the electrokinetic properties of Si3N4 powder could be shownby using the electroacoustic characterization technique.
Paper II Dissolution and Deagglomeration of Silicon Nitride in Aqueous Medium
Silicon nitride undergoes hydrolysis and dissolution when subjected to anaqueous environment. Molecular dynamics simulations suggest thathydrolysis proceeds through nucleophilic attack of water with theformation of an intermediate molecular complex involving a penta-coordinated silicon. It was found that the dissolution of an oxidized siliconnitride powder resembles that of silica: the dissolution rate could bedescribed using a simple kinetic equation with a dissolution activationenergy of 52 kJ mol-1. The deagglomeration of a fine silicon nitridepowder under mild agitation was evaluated; it is shown that the peptizationkinetics at room temperature is dominated by the break-up of particle-particle bonds due to hydrodynamic friction and cluster attrition. Forbreak-up of hard agglomerates of small particles the dissolution ofinterparticle necks plays an important role.
Paper III Deagglomeration, Dissolution and Stabilization of Silicon Nitride inAqueous Medium
General features of the deagglomeration process, including the effect ofdissolution, were outlined. The model was used to assess experimentalresults on the deagglomeration of silicon nitride powder. We observedrapid disintegration of large agglomerates, primarily held together byattractive surface forces, followed by a significantly slower break-down ofsmall agglomerates where interparticle necks keep the crystallites together.Strategies to promote deagglomeration were discussed based on themeasured dissolution kinetics and suspension rheology. Also, the benefitin completing powder deagglomeration prior to the stabilization step withthe aim to obtain a colloidally stable, deagglomerated suspension isillustrated.

Paper IV Silicon nitride colloidal probe measurements: Interparticle forces and therole of surface-segment interactions in poly (acrylic acid) adsorption
Direct measurements of forces between silicon nitride surfaces in thepresence of poly(acrylic acid) (PAA) are presented. The force-distancecurves were obtained at pH>pHiep with an AFM colloidal-probe techniqueusing a novel spherical silicon nitride probe attached to the AFMcantilever. It was found that PAA adsorbes onto the negatively chargedsilicon nitride surface which results in an increased repulsive surfacepotential. The steric contribution to the interparticle repulsion is small andthe layer conformation remains flat even at high surface potentials or highionic strength. The general features of the stabilization of ceramic powderswith PAA were discussed; it is suggested that PAA adsorbs onto siliconnitride by sequential adsorption of neighbouring segments (�zipping�)which results in a flat conformation. In contrast, the long-range steric forcefound in the ZrO2/PAA system at pH>pHiep arises because the stretchedequilibrium bulk conformation of the highly charged polymer is preservedvia the formation of strong, irreversible surface-segment bonds uponadsorption.
Paper V The effect of anionic polyelectrolytes on the properties of aqueous siliconnitride suspensions
The effect of anionic polyelectrolytes on the electrokinetic and rheologicalproperties of concentrated Si3N4 suspensions was investigatedexperimentally. It is shown that polyelectrolyte adsorption and, thus,colloidal stability at pH> pHiep
Si N3 4 is strongly dependent on the surface
charge density of the solid phase. Comparing anionic methacrylic acidcomb copolymer modifications with grafted poly(ethylene oxide) chains(PMMA-PEO) with poly(acrylic acid) (PAA) showed that the grafted PEOchains have a minor influence on the colloidal stability. The effect ofexcess addition of polyelectrolyte was discussed; the observed significantincrease in suspension viscosity could be attributed to the increased ionicstrength caused by the release of associated counterions of the polymerfunctional groups.
Paper VI Dispersing WC-Co Powders in Aqueous Media with Polyethylenimine
The effect of polyethylenimine (PEI) on the the flow properties ofconcentrated aqueous WC-Co suspensions was evaluated. Theinvestigated parameters were polymer concentration, polymer molecularweight, pH, powder solubility, and ageing time. It was found that simplemixing of powder, water and PEI (at concentrations above 0.3 wt%) issufficient to obtain well-dispersed, low-viscous suspensions without theneed for pH adjustment or further additives. Almost identical flowbehavior was observed over the investigated pH range 7-10.8. Effects ofageing and powder solubility on the colloidal stability were negligibleover the investigated time span of 36 hours. Adsorption of PEI withMw=10000 results in thinner adsorbed layers as compared to PEI withMw=25000, which is reflected by a lower suspension viscosity at highsolids loading (40 vol%).

Paper VII Colloidal processing of Al2O3-based composites reinforced with TiN andTiC particulates, whiskers and nanoparticles
A colloidal processing route has been developed for the preparation ofdense and homogeneous Al2O3�TiN/TiC composites. The dispersion andrheological properties of mixtures of TiN or TiC particulates and Al2O3
particles were investigated using electrokinetics and steady-shearrheology. It was found that well-dispersed aqueous suspensions with lowviscosity could be prepared by adding a poly(acrylic acid) dispersant andcontrolling pH in the alkaline range. This processing scheme was alsosuitable for preparation of whisker and nanoparticle compositesuspensions. The alumina-based composite suspensions with a secondary-phase concentration of 25 vol.% were freeze-granulated and hot-pressed,and the resulting bodies were fully densified with well-dispersedsecondary phases. Homogeneous Al2O3�TiN nanoparticle compositescould only be prepared with additions of up to 5 vol.% nanoparticles;higher additions resulted in enhanced agglomeration and subsequent graingrowth of the nanoparticles.

Colloidal Processing of Non-Oxide Ceramic Powders in Aqueous Medium
AbstractList of PapersSummary of Papers
1. Introduction ..................................................................................................... 1
2. Experimental Methods .................................................................................... 5
2.1. Force Measurements .................................................................................. 52.2. XPS Measurements .................................................................................... 72.3. Elektrokinetic Measurements ..................................................................... 72.4. Rheological Measurements ......................................................................... 102.5. Materials ..................................................................................................... 13
3. Powder Characterization .................................................................................. 17
3.1. Powder Dissolution and Surface Chemistry ................................................ 17
3.1.1. Surface Chemistry of Si3N4 .................................................................. 173.1.2. Dissolution of Si3N4 ............................................................................. 193.1.3. Surface Chemistry and Dissolution Behavior of TiC, TiN, WC, and Co 25
3.2. Summary .................................................................................................... 27
4. Deagglomeration and Dispersion ..................................................................... 28
4.1. Deagglomeration and Dispersion of Si3N4 ................................................... 284.2. Summary .................................................................................................... 34
5. Stabilization of Colloidal Suspensions ............................................................. 35
5.1. Forces between Si3N4 Surfaces in Electrolyte Solution .................................. 355.2. Stabilization of Si3N4 by Polymer Adsorption ............................................. 375.3. The Effect of Multivalent Cations on PAA Adsorption ............................... 405.4. The Role of Surface-Segment Interactions in PAA Adsorption ................... 435.5. Addition of Copolymers to Si3N4 Suspensions ............................................. 465.6. Dispersing WC-Co Powders Using Polyethyleneimine ................................ 495.7. Preparation of TiN/TiC-Al2O3 Composite Suspensions ............................... 535.8. Summary .................................................................................................... 55
6. Consolidation and Densification ...................................................................... 57
6.1. Consolidation and Densification of TiN/TiC-Al2O3 Composites .................. 576.2. Summary .................................................................................................... 61
7. Concluding Remarks and Suggestions for Future Work ............................. 62
8. References .......................................................................................................... 63
Acknowledgements

1
1. Introduction
Ceramic materials are used in applications where their material-specific properties allowmuch better performance compared to other materials ofmetallic or organic character,for example. Typical applications for ceramic materials may, for instance, require highstrength, corrosion resistance or wear resistance. The ceramic materials used in thiswork - Si3N4, WC-Co, TiN/TiC-Al2O3 � have in common that they are used for themanufacturing of cutting and drilling tools. Additional applications are, however,numerous and can be more material specific (e.g. high-temperature applications ofSi3N4).
The strong interatomic bonding in ceramics lends the ceramic body an inherentbrittleness, which makes it very susceptible to cracking. The formation of cracks, whichare often self-propagating, leads to catastrophic failure of a ceramic component. Cracksoriginate at inhomogeneities in the material. Impurities, inclusions of foreign materials,pores, and agglomerates are common inhomogeneities that cause cracking in a ceramicbody. The strength of a ceramic component can be related to the size of the defect orinhomogeneity by the Griffith equation
σ =YK
CIC
where the fracture stress, σ, is a function of fracture toughness, KIC, defect size, C, and ageometrical factor , Y, which relates to the defect shape and position.
Hence, increasing fracture toughness and/or decreasing defect size leads to an increasedmaterial strength. Similarly, one realizes immediately that the defect with the biggestsize is likely to initiate cracking first. Therefore, it is very important to eliminate notonly a fraction but all of the large defects. It is one of the main goals of the colloidalprocessing approach to minimize the size and number of inhomogeneities and to assurean upper limit or cut-off defect size. It should be pointed out that a homogeneous phasedistribution in the ceramic component is not less important for non-structuralapplications (e.g. where ceramics with specific optical or magnetic properties aredesired). A homogeneous distribution also minimizes the amount of additives required.
Powder processing is commonly carried out in a sequence of processing steps, typicallyinvolving
� powder production� powder deagglomeration and dispersion in a liquid� consolidation� densification
In each of these steps inhomogeneities might be introduced, and the further oneproceeds in the process chain the more difficult it is to remove the heterogeneities. Infact, in most cases defect removal is very difficult and the best strategy is to avoidformation or introduction of inhomogeneities.
2
The process of dispersing a powder in a liquid medium starts with immersion andwetting of powder surfaces by the liquid phase. The difference in surface energies of theliquid and solid phases provides a driving force for the wetting process 1. Similar tooxides, the oxidized surfaces of commercial nitride and carbide ceramic powders areusually hydrophilic and possess a high surface energy as compared to water, so thatspontaneous wetting takes place. Mechanical forces can be employed to enhance thisprocess (e.g. powder particles may be readily dispersed when mixed with water in apowder mill).
The surface chemistry and dissolution behavior of ceramic particles dispersed in waterare of central importance in aqueous processing of colloidal suspensions. The surfacechemistry determines the pH-dependent surface charge density and, consequently,electrostatic interactions between colloidal particles. Accordingly, the colloidal stabilityof a suspension is largely controlled by the magnitude and range of repulsiveelectrostatic interparticle forces relative to attractive surface forces. Clearly, knowledgeabout the surface chemistry of the components in a ceramic suspension becomes evenmore important when dealing with interactions between particles in heterogeneousmixtures of ceramic powders. In the same manner, electrostatic effects that have itsorigin in the material-specific surface equilibria of dissociation or protonation reactionsat surface sites can be dominant in the interaction between ceramic surfaces and chargedsolutes (e.g. polyelectrolytes).
Colloidal particles in a ceramic suspension are subject to interparticle forces and theconcept of colloidal processing builds on the control and modification of these forces.Depending on the origin of the acting forces different force-distance relationships areobserved and the total force can be attractive or repulsive. Since the interactionpotentials largely influence suspension properties (e.g. suspension rheology andstructure), one of the major goals in colloidal processing is to modify the totalinterparticle force in a controlled manner such as to obtain the desired force-distanceprofile.
Uncontrolled flocculation is undesirable in ceramic processing, since it introducesinhomogeneities in the suspension. Hence, once a deagglomerated and well-dispersedsuspension has been produced, it is of major importance to stabilize the particles insuspension by introduction of an energy barrier against flocculation. Such a barrier canbe established by �coating� the particles with a layer of organic or inorganic material. Ifsuch a layer gives rise to repulsive forces that overcompensate the van der Waalsattractive forces at all distances, the suspension can be stabilized against flocculation. Infact, especially in multi-component systems (which comprise the majority of all systemsof technical interest), the use of dispersing agents, often called dispersants, is often theonly way to achieve the desired state of suspension.
A number of different strategies have been developed in the past, all based on thefundamental idea of a �protective� surface layer. The most frequently used techniquesthat can be carried out �in-situ� in aqueous media are summarized as
� adsorption of inorganic species� adsorption of surfactants� adsorption or grafting of small molecules� adsorption of polymers

3
It is clear that all methods have their inherent weaknesses and advantages and thestabilizing effect depends on the specific characteristics of all components in thesystem. However, polymer adsorption is probably the most widely used approach andhas proven successful for a broad range of ceramic systems.
In a simplified view of the polymer-induced stabilization, the layer of polymermolecules adsorbed at the solid/liquid interface may be described as a barrier thatinhibits close approach of two particles, and, thus, prevents flocculation. The barriereffect depends, among other factors, strongly on the segment density profile which canbe described by the fraction of segments in loops, trains and tails (see Figure below). Ifthe polymer posesses chargeable functional groups (i.e. macromolecules known aspolyelectrolytes), additional electrostatic interactions have to be taken into account. Forexample, adsorbing polyelectrolytes can induce electrosteric stabilization where there isa steric and an electrostatic contribution to the repulsive interparticle potential.
Surf
ace
Tail
Train
Loop
Tail
Train
Mon
omer
Con
cent
ratio
n
Distance from surface
The mechanisms that control polymer adsorption and polymer-induced stabilization (orflocculation) have been subject of intensive scientific and industrial research in the past.However, the involved mechanisms are very complex and there is still numerousquestions that have to be answered in order to gain a full understanding of such systemsor to develop tools for the prediction of polymer adsorption and polymer-inducedstabilization (or flocculation).
It should be mentioned that physical powder properties can also play a role in colloidalprocessing of ceramics (e.g. particle density, size distribution, surface area andmorphology). High particle densities can lead to unwanted sedimentation during slurryhandling and, in the case of powder mixtures, density differences can lead to differentialsettling and the associated formation of undesirable suspension inhomogeneities.Particle size distribution and morphology strongly affect suspension rheology at highparticle concentrations (e.g. a high fraction of fines leads to dramatically increased

4
viscosities). Particle size and the correlated surface area are also important fordensification, the higher the surface area the higher the driving force for sintering.
A well-dispersed and colloidally stable suspension must be consolidated prior tosintering. In some forming techniques the suspension is actually flocculated in�situ inorder to obtain a higher consolidated or green body strength. In other techniquessufficient green-body strength is achieved by drainage or evaporation of the suspendingmedium. For example, granualtion followed by pressing or slip casting may bementioned.
The work described in this thesis is an attempt to apply principles of colloid science tothe processing of non-oxide ceramic powders. Different aspects belonging to a widerange of processing steps, spanning from powder characterization to sintering, will bediscussed. However, two aspects received special attention. First, the effect of powdersolubility on surface chemistry and deagglomeration of hard agglomerates in an as-received powder was investigated. Using silicon nitride as a model system, generalfeatures of the deagglomeration process at conditions where powder dissolution occurswill be outlined. Second, the effect of various polyelectrolytes on the stabilization ofseveral single and multi-component systems will be discussed.

5
2. Experimental Methods
2.1. Force Measurements
Measurements of interparticle forces have been carried out with an Atomic ForceMicroscope (AFM), an instrument type belonging to the group of Scanning ProbeMicroscopes (SPM). In the AFM a cantilever with a tip is used as a force sensor; whenmoved towards another surface the cantilever deflects in response to the tip-surfaceinteraction force. The surface separation distance is changed by expansion orcontraction of a piezo crystal attached to one of the interacting surfaces. Dimensionalchanges of the piezo crystal are controlled by an applied voltage. The cantileverdeflection is detected with the help of a laser beam that is reflected off the cantileversurface; changes in cantilever deflection cause a change in the position of the reflectedbeam on a position-sensitive photo diode detector (Figure 2.1). At small tip-sampleseparations the force acting on the tip can be approximated by Hooke�s law
F kc c= − δ (2.1)
where kc is the cantilever spring constant and δc the cantilever deflection. The value forkc can be obtained by a calibration procedure (e.g. as described by Cleveland et al 2).Normal to the surface the spatial resolution can be on the order of 10-2 Å, but is usuallyreduced by one or two orders of magnitude due to thermal or electrical noise. The δc
values are obtained by determining the relation between the photo diode voltage andcantilever deflection. This is achieved by means of a feedback loop between the detectorvoltage and the voltage applied to the piezo crystal. A linear relationship between thesetwo parameters is established by changing the piezo voltage in the so-called constantcompliance region (i.e. once the tip and surface make hard contact). Knowing thisrelation, it becomes possible to express the cantilever deflection in length units. Theabsolute surface separation is obtained by defining zero separation as the onset of theconstant compliance region. The measured force is calibrated by setting zero force at asurface separation exceeding the range of interaction forces.
LaserDetector
Cantilever
Sample
Computer XYZ piezo
Figure 2.1: Schematic drawing of the experimental AFM set-up (Courtesy AndersMeurk).

6
In this work the force-distance relationship was obtained with the so-called colloidal-probe technique, where a spherical probe is attached to the cantilever tip. The diameterof the probe was determined with a scanning electron microscope. Knowing the proberadius, the interaction potential per unit area, W(D), can be derived by using theDerjaguin approximation for a sphere interacting with a flat surface
W DF D
R( )
( )=
2π(2.2)
where D is the surface separation and R the probe radius. The interaction potentialderived from experimental force measurements can be compared to the interactionpotentials described in the Derjaguin-Landau-Verwey-Overbeek theory (DLVO-theory).In the framework of the DLVO theory, the total interaction potential is calculated bysummation of van der Waals and double layer interaction potentials.
The van der Waals interaction energy per unit area, VvdW(D), between a sphere and a flatsurface separated by a medium is defined as
V DAR
DvdW ( ) = −6
(2.3)
where A is the Hamaker constant. The derivative of Equation 2.3 with respect to Ddelivers an expression for the van der Waals force. The van der Waals force is alwaysattractive for like materials irrespective of the medium. For ceramic materials in anaqueous medium the force is always attractive, even in the case of dislike solids.
The double layer interaction potential arises when two equally charged surfacesapproach each other. The surface charges on both surfaces are neutralizedelectrostatically by counterion clouds. When the ion clouds overlap they induce anosmotic pressure. The osmotic pressure between a sphere and a flat surface leads to arepulsive double layer interaction potential per unit area, Vedl(D),
V DkTR
e
ze
kT
edlD( ) =
=
∞ −128
4
2
2
0
π ρ γκ
γψ
κ
with tanh
(2.4)
where k is the Boltzmann constant, T the temperature, ρ∞ the bulk counterion density, zthe counterion valence, e the electronic charge, and ψ0 the surface potential. The Debyelength κ-1 is the characteristic exponential decay length of the double layer interactionand is described by the expression
κρ
εε− ∞
−
=
∑1
2 2
0
12
,i i
i
e z
kT (2.5)
where ε0 is the permittivity of free space and ε the dielectric constant of the medium. Ata given temperature the Debye length is determined only by the ions in solution. Forexample, for an aqueous 1:1-electrolyte at 25 °C

7
κ − =11
2
0 304. nm
I (2.6)
with I being the total ionic strength.
The main limitations of the above described method for force measurements is theuncertainty in the determination of surface separation distance. In some cases it mightbe difficult to accurately define the point of zero separation. Also, the zero-forcecalibration may introduce a certain error due to thermal or electrical noise. It may benoted that the Derjaguin approximation used is only valid if the curvature of interactingsurfaces is large compared to the surface separation distance. Another condition forvalidity is that the smallest radius of curvature must be larger than the length scale onwhich the interaction force decays to zero.
2.2. XPS Measurements
X-ray photoelectron spectroscopy (XPS), also known as ESCA (Electron Spectroscopyfor Chemical Analysis), can be used to determine the chemical composition of a samplesurface. The sample is placed in a high vacuum chamber and irradiated with a well-defined X-ray beam. The irradiation of the sample material causes photoelectrons to beemitted from the core level of the atoms. Emitted photoelectrons are collected by adetector that records a spectrum of kinetic photoelectron energies. The kinetic energy,Ekin, of the photoelectrons is given by the expression
E h Ekin B= − −ν φ (2.7)
where hv is the characteristic energy of the X-ray photon and φ is the work functionterm. The work function term is a constant whose value depends on sample andinstrument characteristics. The binding energy, EB, is element specific; hence, theevaluation of the kinetic energy spectrum allows the identification of the sample surfacecomposition. Photoelectrons that have been emitted without energy loss arepredominantly detected and the corresponding analysis depth is on the order of 5-10 nm.
In this work, XPS spectra were obtained using a Mg Kα X-ray source (hv=1254 eV)operated at 240 W (12 kV, 20 mA) and an analysis area of approximately 1 mm2. Detailspectra were acquired with a pass energy of 80 eV. Intensity peaks in the spectratogether with sensitivity factors were used to determine relative elementalconcentrations in the analysis volume. Sensitivity factors were used as supplied by theinstrument manufacturer (i.e. 0.27 for for Si 2p, 0.66 for O 1s, 0.42 for N 1s, and 0.25for C 1s peaks).
2.3. Electrokinetic Measurements
Electrophoretic and electroacoustic methods were employed for electrokinetic zeta-potential measurements on charged particles in aqueous suspension. The zeta-potentialis the electric potential associated with the plane of shear which surrounds a chargedparticle moving in an electric field. The plane of shear is the dividing surface between

8
the bulk suspending medium and a hydrodynamically stagnant water layer that followsthe particle in its movement.
Electrophoretic characterization relies on the measurement of the electrokineticmobility, µE, of the charged particles
µE
v
E= (2.8)
with v being the particle velocity and E the electric field strength. The velocity of aparticle is dependent on its total charge, Q, according to
v EF
QE Ee= =µ µ (2.9)
where Fe is the force on the particle due to the electric field. Fe is balanced by theviscous drag force, Fv, which, in the case of a spherical particle, leads to
µπ η π ηE
V
vQ
F
vQ
Rv
Q
R= = =
6 6 (2.10)
with R being the particle radius and η the viscosity of the liquid medium. The totalcharge of a particle, Q, can be estimated with by
Q R= 4πε ζ (2.11)
where ζ is the zeta-potential.
Including the Henry function, f(κR), the zeta potential can now be related to themobility as follows
µεζη
κE f R=23
( ) (2.12)
where the value of f(κR) varies from 1 to 1.5 as κR changes from 0 to ∞. In this work,the Smoluchowski limit of a small double layer thickness compared to the particle size(κR>>1) was assumed, and the corresponding value f(κR) =1.5 was used in calculationsof the zeta-potential. The accurate determination of the particle velocity in theinstrument is achieved by means of light scattering. Two coherent laser beams arefocused in a manner that they cross in a volume element of the so-called stationary layerin the cell. In the stationary layer the particle velocity is not influenced byelectroosmosis effects. The scattered light of a high number of particles is collected by aphotomultiplier and the measured auto-correlation function can be converted to particlevelocities by using a Fourier transform. The use of this method is restricted to verydilute suspensions, with particle volume concentrations, φ, on the order of 10-5, to avoidmultiple scattering and particle agglomeration.
The limitation in particle concentration of the electrophoresis method can be overcome,to some extent, by the use of electroacoustic methods. The AcoustoSizer instrument

9
used in the present work applies a sinusoidally alternating high-frequency voltage to thesuspension. The charged particles oscillate at a frequency in accordance with theapplied field. The velocity of the particle movement and, thus, the particle dynamicmobility, µD, is dependent on particle mass and surface charge density. The dynamicmobility is a complex quantity, having a magnitude and a phase angle. The phase angleis a measure of the time lag between the oscillation of the electric field and the particleoscillation.
The particle oscillations result in a pressure wave at the suspension boundaries, whichgives rise to the so-called electrokinetic sonic amplitude (ESA). The ESA signal isrelated to the volume-averaged dynamic mobility, ⟨µD⟩, by the expression
ESA F
R p R dR
D
D
ω ω φρρ
µ
µ µ ω
( ) = ( )
= ( ) ( )∞
∫
∆Z (2.13 a)
(2.13 b),0
where ω is the angular frequency of the applied field, F(ω) is an instrument constant, ρis the density of the liquid medium, ∆ρ is the density difference between medium andparticle, p(R)dR the mass fraction of particles with a radius in the interval R -0.5dR<R<R+0.5dR, and Z is a constant related to the acoustic impedance of thesuspension. F(ω) and Z are accessible by standard calibration procedures.
For a suspension of spherical particles and φ≤0.02, the dynamic mobility can be relatedto the zeta-potential by
µεζη
α λ ε ω
αωρη
ωωε
D PG f
fR
K
= ( ) + ( )[ ]
( ) =
= ∞
23
1
2
, , '
'
with G and
(2.14)
where λ is the Dukhin number 3, εP is the dielectric constant of the particles, and K∞ isthe electrical conductivity of the liquid. The G(α) factor represents the effect of inertiaon the dynamic mobility. For thin double layer systems (κR>>1) one can use a value off(λ,εP, ω�)=0.5, if polarization effects due to surface conductance or a high εP value arenegligible. 4,5
At φ>0.02 the measured apparent zeta-potentials are corrected according to
ζ ζ
φφ
φ φ
corr
se
s
=
( ) = +
+ ( )[ ]{ }
−
2 1
4 1
10 1
with . (2.15)
This approximation is valid if the following conditions apply; the extent of electricaldouble layer overlap is low and/or the particle surface potential remains constant even

10
with increasing double layer overlap. 6 By assuming a log-normal particle sizedistribution and applying an electric field with a spectrum of frequencies, a numericalfitting algorithm based on Equations 2.13-15 can be used to derive the zeta-potentialand the particle size distribution of the sample from the measured dynamic mobilityvalues.
2.4. Rheological Measurements
Rheology is used to describe the deformation of a material in response to an appliedmechanical force. The evaluation of rheological data can provide information on flowproperties and structural characteristics of a suspension. In this work a controlled-stressinstrument equipped with a concentric-cylinder geometry was used. When using thisexperimental set-up, a cup with radius ro is loaded with the sample and a cylindrical toolwith radius ri is lowered into the cup (ri<ro). By applying a torque on the inner cylinder,a shear force is applied to the sample that fills the gap between the rotating innercylinder and the stationary outer wall. The applied torque is controlled such that adesired shear stress, σ, or shear rate, γ̇ , is established. The shear rate is determined bymeasuring the rotational velocity of the tool with an electro-optical device. The shearstress is the force per area that arises between two parallel surfaces in contact that moverelative to each other. The shear rate describes the velocity gradient (usually in units ofreciprocal seconds) between two parallel surfaces that are separated at a finite distance.
Three categories of rheological measurements are commonly distinguished, namelysteady-state, transient, and oscillatory. In general, the ratio of shear stress to shear ratedefines the viscosity of a material
ησγ
=˙
(2.16)
In steady-shear measurements a constant shear rate is applied to the sample until theresulting shear stress reaches a constant value. Figure 2.2 illustrates steady-shear flowcurves typical for materials with solid-like or liquid like shear response.
solid-like, with yielding
liquid-like(shear stress ∝ shear rate)
liquid-like
solid-like, with yielding(viscosity ∝ shear rate-1)
shea
r st
ress
shear rate shear rate
visc
osity
Figure 2.2: Examples of solid-like and liquid-like behavior in a steady-shearexperiment.
11
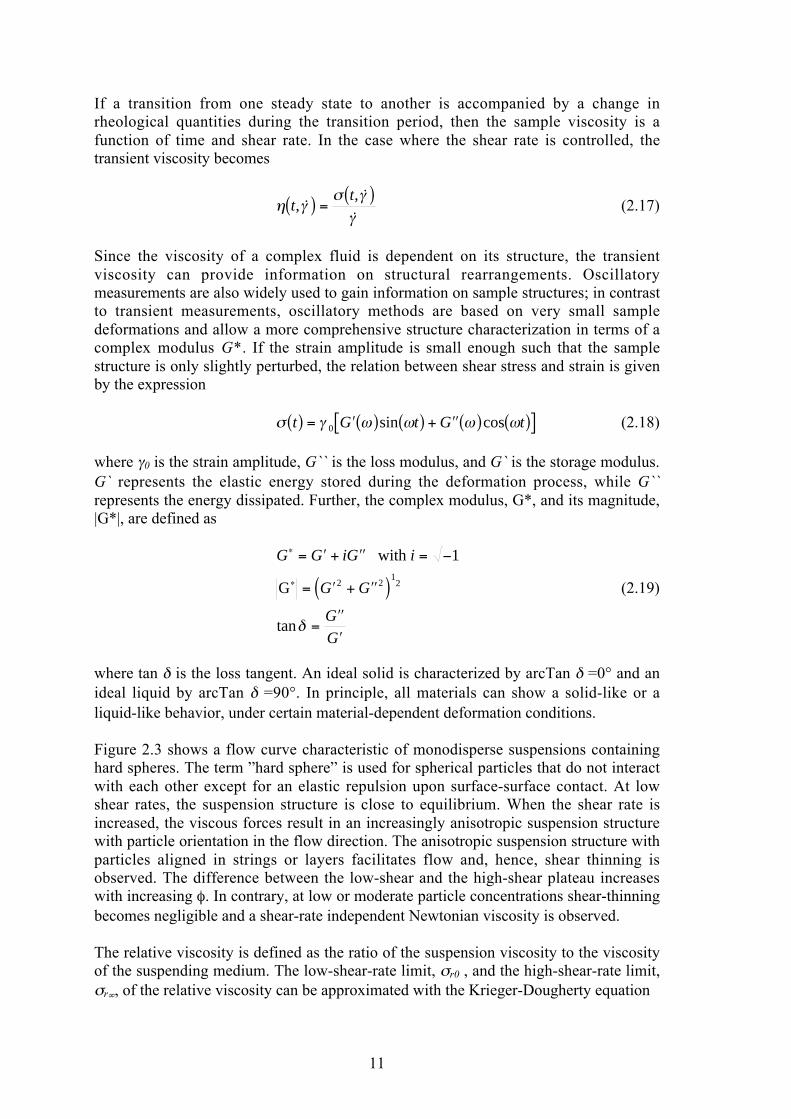
If a transition from one steady state to another is accompanied by a change inrheological quantities during the transition period, then the sample viscosity is afunction of time and shear rate. In the case where the shear rate is controlled, thetransient viscosity becomes
η γσ γγ
tt
, ˙, ˙
˙( ) =
( ) (2.17)
Since the viscosity of a complex fluid is dependent on its structure, the transientviscosity can provide information on structural rearrangements. Oscillatorymeasurements are also widely used to gain information on sample structures; in contrastto transient measurements, oscillatory methods are based on very small sampledeformations and allow a more comprehensive structure characterization in terms of acomplex modulus G*. If the strain amplitude is small enough such that the samplestructure is only slightly perturbed, the relation between shear stress and strain is givenby the expression
σ γ ω ω ω ωt G t G t( ) = ′( ) ( ) + ′′( ) ( )[ ]0 sin cos (2.18)
where γ0 is the strain amplitude, G`` is the loss modulus, and G` is the storage modulus.G` represents the elastic energy stored during the deformation process, while G``represents the energy dissipated. Further, the complex modulus, G*, and its magnitude,|G*|, are defined as
G G iG i
G G
G
G
∗
∗
= ′ + ′′ = −
= ′ + ′′( )
=′′′
with
G
1
2 21
2
tanδ
(2.19)
where tan δ is the loss tangent. An ideal solid is characterized by arcTan δ =0° and anideal liquid by arcTan δ =90°. In principle, all materials can show a solid-like or aliquid-like behavior, under certain material-dependent deformation conditions.
Figure 2.3 shows a flow curve characteristic of monodisperse suspensions containinghard spheres. The term �hard sphere� is used for spherical particles that do not interactwith each other except for an elastic repulsion upon surface-surface contact. At lowshear rates, the suspension structure is close to equilibrium. When the shear rate isincreased, the viscous forces result in an increasingly anisotropic suspension structurewith particle orientation in the flow direction. The anisotropic suspension structure withparticles aligned in strings or layers facilitates flow and, hence, shear thinning isobserved. The difference between the low-shear and the high-shear plateau increaseswith increasing φ. In contrary, at low or moderate particle concentrations shear-thinningbecomes negligible and a shear-rate independent Newtonian viscosity is observed.
The relative viscosity is defined as the ratio of the suspension viscosity to the viscosityof the suspending medium. The low-shear-rate limit, σr0 , and the high-shear-rate limit,σr∞, of the relative viscosity can be approximated with the Krieger-Dougherty equation

12
ηφφ
ηφφ
ηη ηφη
η φ
η φ
φ
rm
rm
S
S
m
m
00
0
1
1
0
= −
= −
[ ] =−
−[ ]
∞∞
−[ ]
→
∞
(2.20)
(2.21)
with lim
where the maximum particle volume fraction in the low-shear and high-shear limit isgiven by φm0 and φm∞, respectively. The [η]-parameter is known as the intrinsicviscosity.
ηr0
ηr∞
A
B
C
D
log
(rel
ativ
e vi
scos
ity)
log (dimensionless shear rate)
Figure 2.3: Characteristic flow curve displaying dimensionless relative viscosityversus dimensionless shear rate (also called Peclet number7). Indicated arethe limiting low-shear-rate viscosity (A), the shear thinning region (B),and the limiting high-shear-rate viscosity (C). Shear thickening at highshear rates is also indicated (D).
The rheological response of hard-sphere suspensions is affected by adsorbed or graftedlayers of polymer. The influence of the layer becomes more pronounced with increasingφ. One can account for a thin surface layer simply by introducing an effective particlevolume fraction, φeff ,
φ φeff R= +
13∆ (2.22)
where ∆ is the layer thickness. Equation 2.22 is often a good approximation when thelayer thickness is small relative to the particle radius. With increasing ∆ /R thedeformability of the layers becomes more important and a modified Cross equation is abetter approximation

13
η ηη η
σ
σσ
r rr r
r
m
r
b
R
kT
= +−
+ ( )
=
∞∞0
3
1
with
(2.23)
where m is a fitting paramter.
In fact, the hard-sphere model has been most successful in the description of non-aqueous systems. The theoretical description of aqueous suspensions is significantlymore complicated because of non-negligible long-ranged attractive or repulsiveinterparticle interactions. However, the flow curve of a colloidally unstable suspensionwith attractive interparticle forces exhibits a close similarity with the one seen in Figure2.3. The shear thinning is much more pronounced when compared to hard spheresystems. This can be attributed to the break-up of particle aggregates. At low shear ratesthe aggregates are held together by attractive van der Waals forces. With increasingshear rate the flocs are broken up by hydrodynamic forces and the liquid that wasimmobilized within the aggregates is released. Due to the presence of attractiveinterparticle forces a critical stress, the so-called yield stress, may be required to initiateflow in the suspension (see Figure 2.2). Using the correlation between interparticleforces and the corresponding rheological response as discussed above, rheologicalmethods provide a convenient tool to obtain information on the colloidal state of asuspension. For example, at moderate particle concentrations the flow curve of acolloidally unstable suspension displays strong shear thinning, whereas a colloidallystable suspension is characterized by a nearly Newtonian behavior. Newtonian behavioris characterized by a constant, shear-rate independent viscosity (i.e. η γ η˙( ) ≈ ∞r ).
The above models do not take into account the effect of particle morphology or particlesize distribution. The influence of these two parameters on suspension rheology can bequite substantial. Depending on the relative volume fraction of fine and coarse particles,the suspension viscosity may be decreased by approximately an order of magnitude ascompared to a suspension with monodisperse particles. Furthermore, the suspensionviscosity is often increased for a given φ when the particle morphology deviates fromspherical. This effect is particularly important at high shear rates because it may lead tostrong shear thickening (see Fig. 2.3).
2.5. Materials
In this section powder properties and polymer characteristics of materials used in thiswork are summarized. Data were either taken from the manufacturers product data sheetor obtained experimentally. Theoretical densities, specific surface area and particle sizedistributions (PSD) of the powders are listed in Table 2.1. Particle size distributionswere measured by means of X-ray gravitational sedimentation analysis. Particle sizes ofthe TiNnano powder were estimated from the specific surface area obtained by BETnitrogen adsorption analysis.
Similar to WC, the TiN and TiC powders display an equiaxed particle morphology withsharp edges. X-ray diffraction measurements showed TiN and TiC as the only

14
crystalline phases in the respective powders. Both, TiN and TiC powders, exhibited anamorphous surface oxide layer as indicated by XPS studies (Paper VII).
The silicon nitride powder was manufactured with the imide decomposition process 8
and consists mainly of crystalline α-phase (>95 wt%). The used batch had a totaloxygen content of 1.3 wt%. The silicon nitride materials used in the AFMmeasurements, i.e. a flat wafer substrate and a spherical probe, have been characterizedby means of XPS measurements (Paper IV). The results indicated that untreated wafersurfaces have an O/Si atomic ratio of 0.41 and a N/Si ratio of 1.1. The peaks in thespectrum were symmetrical for Si(2p) and N(1s), with respective binding energies of102.1 and 397.6 eV. The atomic ratios and binding energies indicate an intermediatestate between silicon oxynitride ( Si ON2 2) and silicon nitride ( Si N3 4 ). 9,10
The spherical probes were produced by nitridation of silica spheres in flowing ammoniagas at 1000 °C. Evaluation of the XPS spectra for the nitrided spheres yielded O/Si andN/Si atomic ratios of 1.1 and 1.0, respectively. The respective Si(2p) and N(1s) bindingenergies were 102.7 and 398 eV. Electrokinetic measurements indicated an isoelectricpoint of pHiep=4.0±0.5, which is well above the isoelectric point of SiO2 and Si ON2 2
(pHiep≈2). 9 The XPS and electrokinetics data suggest that the nitrided spheres have asurface composition close to that of an oxidized silicon nitride powder.
A brief compilation of polymer characteristics are given in Table 2.2. Thepolyelectrolyte structures are presented schematically in Figures 2.4-2.6. The chemicalstructure of the two PMAA-PEO modifications is identical except for the length of thePEO side-chains and the ionic species used to neutralize the acidic functional groups.The grafted PEO chains of PMAA-PEO 104N are shorter compared to PMAA-PEO168. PMAA-PEO 168 is a sodium salt of a methacrylic copolymer, whereas PMAA-PEO 104N is neutralized with ammonium ions. PAA and PMAA-PEO are anionicpolyelectrolytes that act as a weak acid in aqueous solutions. The degree of dissociationof the anionic polyelectrolytes increases with increasing pH. At around pH≈3 theyapproaching an undissociated, neutral state where precipitation occurs.
PEI is a weak base and the degree of protonation of this cationic polyelectrolyteincreases with decreasing pH. PEI is water-soluble up to a pH of about 11.5 where thecharge density approaches zero. 11 The polymerization mechanism of ethylenimineallows the formation of different intermediate oligomers with various structures. Thisleads to a highly branched polymer containing primary, secondary, and tertiary aminegroups in 25/50/25 ratio and branching sites approximately every 3 to 3.5 nitrogenatoms. 12 Accordingly, what is shown in Figure 2.6 only illustrates the importantstructural features and should not be regarded as a repeat unit of the polymer.

15
Table 2.1: Data on physical powder properties (* BET equivalent spherical diameter).powdergrade
theoreticaldensity
specificsurface
area
meanparticle size(supplier)
PSD(measured)
[µm]
[g dm-3] [m2 g-1] [µm] d16 d50 d84
α-Si3N4 SN-E10Ube Ind.
Japan
3.18 10.4 0.4 - - -
WC/Comixture
(92/8 wt%)
SandvikCoromantSweden
14.8(Co 8.86)(WC 15.7)
0.8(WC)
- 0.52 1.2 2.2
TiN Grade CH.C. StarckGermany
5.22 3.1 1.05 1.2 2.1 3.4
TiC STD 120H.C. StarckGermany
4.93 2.7 1.4 1.5 3.2 5.4
TiNnano nano TiNH.C. StarckGermany
5.22 44.9 0.030* - 0.026* -
α-Al2O3 AKP 30Sumitomo
Japan
3.97 - 0.3 - - -
Table 2.2: Polyelectrolytes used in this workpoly(acrylic
acid)ammonium saltof poly(acrylic
acid)
methacrylic acidcomb copolymer
with graftedpoly(ethylen oxide)
branchedpolyethyleneimine
Denotation PAA-50000 PAA-10000 PMAA-PEO 104N(PMAA-PEO 168)
PEI-10000(PEI-25000)
Mw 50.000 10.000 32.700 (43.200) 10.000 (25.000)MW/MN - 1.6 3.5 (6.4) -acid/baseproperties
weak acid weak acid weak acid, NH4-salt(weak acid, Na-salt)
weak base
trade name PAAPolysciences
USA
Dispex A40Allied Colloids
GB
SSP 104N(SSP 168)
Takemoto, Japan
PEIPolysciences, USA
(Sigma Aldrich)see paper IV IV, V, VII V VI

16
C
H
CH2
C=O
O-NH4+
N
Figure 2.4: Chemical structure of the ammonium salt of poly(acrylic acid).
C
CH3
CH2
C=O
O-Na+
a
C CH2
C=O
OCH3
b
H
C CH2
Y
O
c
R
CH2CH2O Rn
C
CH3
CH2
X
SO3-Na+
d
N
X=CH2 , CH2O
Y=CH2 , C=O
R=H , CH3
Figure 2.5: Chemical structure of the PMAA-PEO comb block-copolymer. In thedepicted structure acidic functional groups possess associated sodiumions.
NH2
NH
H2N
NH2
H2N
NH
H3N
Figure 2.6: Schematic figure showing the structural features of PEI in the fullyprotonated state.

17
3. Powder Characterization
3.1. Powder Dissolution and Surface Chemistry
The dissolution behavior of a ceramic material may play a crucial role in colloidalprocessing, since it can strongly affect the surface chemistry; the elemental surfacecomposition may be changed in the course of dissolution or dissolution/precipitationprocesses. Also, the release of ionic species due to dissolution will change the ionicstrength in solution and, thus, alter the electrostatic interaction potential. Equallyimportant, dissolution can have a pronounced influence on agglomeration anddeagglomeration processes in aqueous ceramic suspensions (see Chapter 4).
Probably all ceramic materials used in technical applications dissolve to some extentwhen exposed to an aqueous environment. The dissolution rate, however, can vary byseveral orders of magnitude depending on the chemical composition and structure of thesolid and the solution conditions. Hence, some ceramics are readily dissolved, whileothers exhibit a negligible dissolution rate. However, the dissolution rate is usuallystrongly temperature and pH dependent. Due to the large number of parameters thatinfluence the dissolution, with many of them not directly accessible by experimentalmethods, there is a lack of comprehensive theories that can predict the dissolutionbehavior of ceramics in water. Consequently, it is common practice to describe thedissolution of a specific material in terms of experimentally determined dissolution rateconstants.
The focus in this chapter is placed on the surface chemistry and dissolution kinetics ofsilicon nitride powder at alkaline pH. This choice is mainly motivated by the stronginterdependency of disssolution and surface chemistry of silicon nitride, and thepronounced effect on colloidal stability and deagglomeration (see Chapter 4). Aftergiving a brief account of earlier investigations on the surface chemistry of siliconnitride, thermodynamic and kinetic aspects of the hydrolysis and dissolution in aqueoussuspension are addressed. Experimental data on the dissolution kinetics at differenttemperatures and pH are presented and the overall activation energy for dissolution isdetermined. Additionally, similarities in the dissolution behavior of silicon nitride andsilica are discussed. Finally, a short summary of results regarding surface chemistry anddissolution of other ceramic materials used in this thesis is given.
3.1.1. Surface Chemistry of Si3N4
The surface chemistry of silicon nitride is well described by the dissociation andprotonation reactions of amphoteric silanol (Si-OH) and basic secondary amine (Si2-NH) surface groups in water 9
(3.1 a)
(3.1 b)
Si (3.1 c)2
SiOH SiO H
SiOH SiOH H
NH Si NH H
K
K
K
A
A
B
1
2
2
2 2 2
← → +
← → +
← → +
− +
+ +
+ +

18
where KA1, KA2 and KB are equilibrium constants. The estimated and experimentallydetermined values for the equilibrium constants are given in Table 3.1. The surfacereactions and the surface densities of the two surface groups determine the pH-dependent surface charge density of silicon nitride and, thus, the isoelectric point, pHiep
(i.e. the pH where the net surface charge becomes zero).
Table 3.1: Literature values for the equilibrium constants KA1, KA2 and KB. Data wasestimated 9 or obtained experimentally by titration 13 and atomic force microscopy. 14
estimated potentiometric titration AFM measurementsKA1 1.59×10⁻⁷ 3.10×10⁻⁸ 2.01×10⁻⁶
KA2 5.89×10² - -KB 1.00×10⁻⁹ 1.29×10⁻⁸ 1.21×10⁻⁵
Based on Eq. 3.1, Bergström and Bosted derived an expression that relates the pHiep tothe relative amount of silanol, NA, and secondary amine groups, NB, 9
N
N
KK
K
K
K
B
A
pH
A
A
ApH
pH
BpH
B
iep
iep
iep
iep
=
−−
+
+
−
−
−
−
10
1010
1 10
1
2
2
10
1+10K
-pH
-pH
A1
iep
iep
(3.2)
Relatively good agreement between NB/NA ratios calculated with Equation 3.2 and N/O-ratios obtained by XPS-measurements on powder surfaces was reported. 9
Previous studies have shown that the pHiep of Si3N4 powders can vary dramaticallydepending on the powder synthesis process, powder treatment (thermal, chemical ormechanical), and wet processing conditions. 8,9,15-23 This has been attributed todifferences in the oxygen content of the powder surface, which is mainly dictated byoxidation in air and hydrolysis reactions in water of the thermodynamically unstableSi3N4.
The oxidation of silicon nitride in air proceeds according to
Si N O SiO NK3 4 2 2 23 3 2+ ← → + (3.3)
when silica is assumed to be the main oxidation product. Investigations on pureSi3N4�films confirmed the presence of an amorphous, oxygen-rich surface layer withthe oxygen concentration gradually increasing towards the surface. 24 The hydrolysis ofsilicon nitride in water can be described with the overall reaction
Si N H O SiO NHK3 4 2 2 36 3 4+ ← → + (3.4)
assuming that silica is the main hydrolysis product. For the oxidation reaction in air, asimilar reaction can be written when silicon oxynitride is the oxidation product. The

19
silicon oxide reaction product is present in the form of an amorphous surface layer,whereas the ammonia dissolves in water and protonates according to
NH NH HK4 3+ +← → + (3.5)
3.1.2. Dissolution of Si3N4
The oxidized surface layer on silicon nitride is soluble in water and leaching studieshave shown that not only oxidation and hydrolysis but also dissolution maysignificantly alter the surface composition and the associated surface charge. 9,20,21 Theeffect of oxidation and dissolution on the surface chemistry of silicon nitride is reflectedin electrokinetic zeta-potential measurements and XPS-measurements on oxidized andleached powders as shown in Figure 3.1 and Table 3.2. The leaching treatment consistedof dialyzing a dilute powder suspension against 0.01 M NaOH solution. An oxidationtreatment of the as-received powder shifted the pHiep to acidic values, whereas theleaching treatment caused a shift to basic values (Figure 3.1). Both treatments lead tocorresponding changes in elemental O/Si and N/Si ratios of the surface layer (Table3.2). These results agree with the suggested interdependency of the surface layer oxygencontent, the relative amount of Si-OH and Si2-NH surface groups, and the surfacecharge density.
-60
-40
-20
0
20
40
60
0 2 4 6 8 10 12 14
p H
Zet
a-P
ote
nti
al
[m
V]
dialyzed
as-received
oxidized
Figure 3.1: Zeta-potential of Si3N4 suspensions at 10 vol% solids loading: as-receivedpowder (!), after oxidation in air for 8 hours at 800 °C (❍), and afterdialyzing against 0.01 M NaOH for several days (#). The counterionconcentration was [Na+]=0.01 M in all experiments.

20
Table 3.2: Results of XPS-measurements on the as-received and modified siliconnitride powders used for zeta-potential measurements (Figure 3.1).Sample N/Si O/Si N (1s) binding
energySi (2p) binding
energyas-received 1.03 0.59 394.4 eV 99.0 eVoxidized 0.85 0.80 394.6 eV 99.2 eVdialyzed 1.33 0.19 397.7 eV 101.7 eV
The kinetics of silicon nitride dissolution was evaluated by studying the release ofsilicon as a function of time at varying pH and temperature (Figure 3.2). Except for theexperiment conducted at pH=12, where NaOH was added, all dissolution experimentswere performed without pH-adjustment. In these cases the release of ammonia(Equation 3.5) buffered the suspensions at pH=8.7±0.2.
0
5
10
15
20
25
30
35
0
500
1000
1500
2000
0 5 10 15 20 25
Si-C
ON
CE
NT
RA
TIO
N [
mm
ol d
m-3
]
(SiO
2) so
l-CO
NC
EN
TR
AT
ION
[pp
m]
TIME [days]
25 °C40 °C60 °C79 °C
7 °C
25 °C (5 vol%, pH 12)
(1 vol%, pH 9)
Figure 3.2: Kinetics of silicon release in dilute suspensions of silicon nitride powder atpH=9 and pH=12. The experimental points are approximated by Equation3.7 (solid lines) using the parameters listed in Table 3.3. The dotted line isa least-squares fit to the experimental data points.
First, the results of the leaching experiments at pH≈9 are considered. It is seen that theoxidized silicon nitride powder releases silicon quite readily and a saturation level isreached within days. Dissolution proceeds faster and a higher plateau value is reached athigher temperatures. The experimentally determined amount of silicon dissolved fromthe oxidized silicon nitride surface at room temperature is around 170 ppm which issimilar to reported values for amorphous silica, [SiO2]sol≈100-150 ppm at pH=3-9 25.
For a well-defined and completely dispersed suspension, it is possible to formulate adissolution rate expression
21
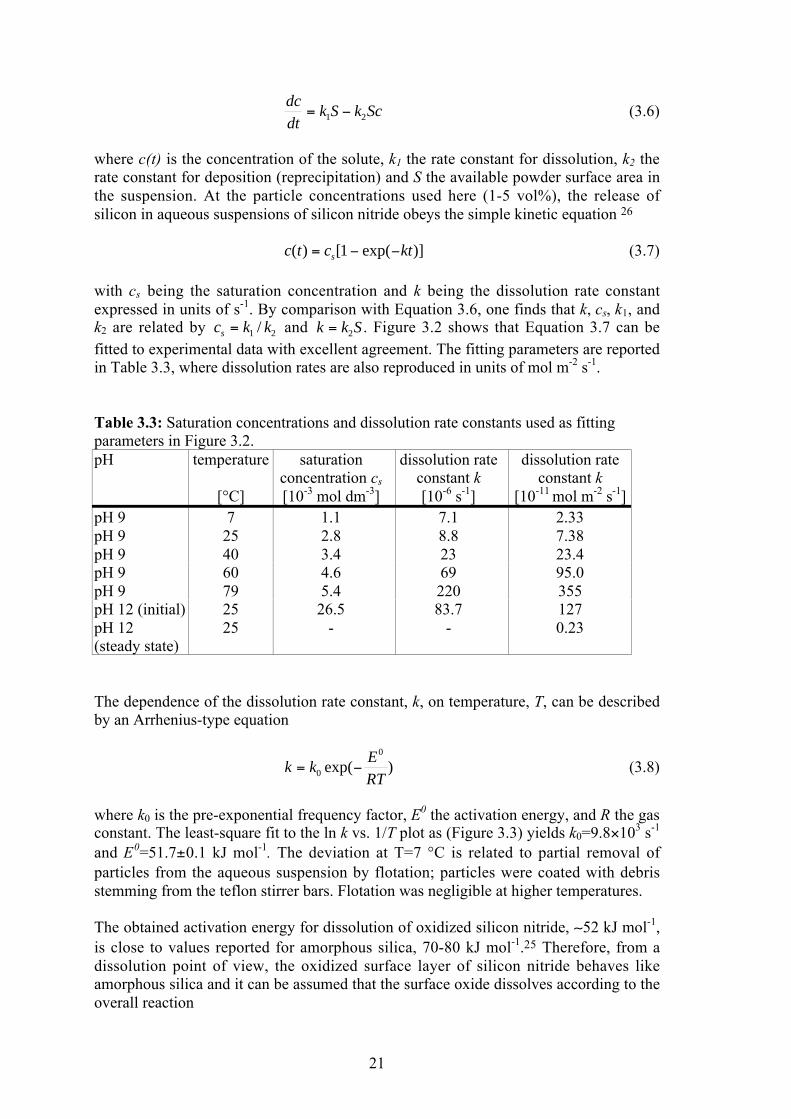
dc
dtk S k Sc= −1 2 (3.6)
where c(t) is the concentration of the solute, k1 the rate constant for dissolution, k2 therate constant for deposition (reprecipitation) and S the available powder surface area inthe suspension. At the particle concentrations used here (1-5 vol%), the release ofsilicon in aqueous suspensions of silicon nitride obeys the simple kinetic equation 26
c t c kts( ) [ exp( )]= − −1 (3.7)
with cs being the saturation concentration and k being the dissolution rate constantexpressed in units of s-1. By comparison with Equation 3.6, one finds that k, cs, k1, andk2 are related by c k ks = 1 2/ and k k S= 2 . Figure 3.2 shows that Equation 3.7 can befitted to experimental data with excellent agreement. The fitting parameters are reportedin Table 3.3, where dissolution rates are also reproduced in units of mol m-2 s-1.
Table 3.3: Saturation concentrations and dissolution rate constants used as fittingparameters in Figure 3.2.pH temperature
[°C]
saturationconcentration cs
[10-3 mol dm-3]
dissolution rateconstant k[10-6 s-1]
dissolution rateconstant k
[10-11 mol m-2 s-1]pH 9 7 1.1 7.1 2.33pH 9 25 2.8 8.8 7.38pH 9 40 3.4 23 23.4pH 9 60 4.6 69 95.0pH 9 79 5.4 220 355pH 12 (initial) 25 26.5 83.7 127pH 12(steady state)
25 - - 0.23
The dependence of the dissolution rate constant, k, on temperature, T, can be describedby an Arrhenius-type equation
k kE
RT= −0
0
exp( ) (3.8)
where k0 is the pre-exponential frequency factor, E0 the activation energy, and R the gasconstant. The least-square fit to the ln k vs. 1/T plot as (Figure 3.3) yields k0=9.8×10³ s-1
and E0=51.7±0.1 kJ mol-1. The deviation at T=7 °C is related to partial removal ofparticles from the aqueous suspension by flotation; particles were coated with debrisstemming from the teflon stirrer bars. Flotation was negligible at higher temperatures.
The obtained activation energy for dissolution of oxidized silicon nitride, ∼52 kJ mol-1,is close to values reported for amorphous silica, 70-80 kJ mol-1.25 Therefore, from adissolution point of view, the oxidized surface layer of silicon nitride behaves likeamorphous silica and it can be assumed that the surface oxide dissolves according to theoverall reaction

22
SiO H O Si OH2 2 42+ ↔ ( ) (3.9)
yielding colloidal silica Si(OH)4 or other silicate species in solution. 9,26
-14
-13
-12
-11
-10
-9
-8
0.0028 0.0029 0.003 0.0031 0.0032 0.0033 0.0034 0.0035 0.0036
ln k
1/T [K-1]
Figure 3.3: Arrhenius plot of ln k versus 1/T for the dissolution rate constants. Thedotted line depicts the least-squares fit to data points at 25 °C≤T≤79 °C.
The dissolution rate of oxides show strong variations; MgO and CoO for example, arehighly soluble and dissolve rapidly in water while TiO2 and Al2O3 are relatively inert. 27
Such differences can be explained by material-specific interatomic bonds strengths. TheSi-O bond strength in SiO2 tetrahedra has approximately 50% covalent character, asestimated from electronegativity differences of the silicon and oxygen atoms 28.According to Segall et al,27 crystalline oxides with predominantly covalent interatomicbonds have a characteristic low dissolution rate as compared to ionic oxides. Thedissolution rate for oxidized silicon nitride is slightly higher than dissolution ratesattributed by Segall et al to the class of insulating covalent oxides (i.e. k<10-11 mol m-2
s-1) 27. This is most likely related to the amorphous structure of the surface layer; Iler,for example, reported that crystalline silica (α-quartz) dissolves slower than amorphoussilica. 25
It has been suggested previously that the dissolution rate of insulating covalent oxidesincreases at alkaline pH, due to nucleophilic attack of water on metal-oxygen bonds. 27
Xiao and Lasaga described the pH-dependent hydrolysis of silica by means of ab initioquantum mechanical simulations. 29,30 Their calculations suggest that the hydroxyl ionis a catalyst for the hydrolysis of siloxane bonds; hydrolysis via nucleophilic attack ofwater on Si-O-Si bridges is affected by the protonation state of the silanol surfacegroups. The activation energies for hydrolysis are 121, 100, and 79 kJ mol-1 for thecases where the respective surface silanols at the Si-O-Si bridge are neutral (Si-OH),protonated ( Si OH− +
2 ), or deprotonated (Si-O-). It was further suggested that hydroxyl-

23
catalyzed hydrolysis involves the formation of a transitional pentacoordinated Si-complex prior to the subsequent cleavage of the bridging siloxane bond. In fact, thehydrolysis of silica is actually controlled by the formation of the transitional complex.This step involves the highest activation energy of 79 kJ mol-1, the final rupture of theSi-O-Si bond involves an energy barrier of only 19 kJ mol-1. 29,30
The solublity of the dissolution product, silicic acid Si(OH)4, increases dramatically atpH>10. 25 This is most likely due to the formation of [Si(OH)5]-1 complexes in solution;molecular orbital calculations predict stable [Si(OH)5]-1 complexes in solution. 31 Thesimulations imply a reaction described as
Si OH OH Si OH OH SiO H O( ) ( ) [ ( ) ] [( ) ]4 51
31
2+ ↔ ↔ •− − − (3.10)
where both, the pentacoordinated silicon-complex and the hydration complex, haveequal potential energies.
The above information allows a more detailed discussion of the peculiarities of siliconnitride dissolution at pH=12 and T=25 °C. Figure 3.2 shows that data points of theinitial dissolution stage at this pH can be fitted with Equation 3.7. In contrast to thedissolution at pH=9, no saturation plateau is reached at longer times. Instead, oneobserves a slow dissolution characterized by a constant increase in concentration ofdissolved silicon. The absence of a saturation plateau can be explained by the formationof pentacoordinated Si-complexes according to Equation 3.10 and the correspondingincrease in silicon solubility.
It is seen that the estimated dissolution rate constants for the initial and the later stagedissolution at pH=12 differ by three orders of magnitude, with the latter one being muchlower than the dissolution rate constant at pH=9 (Table 3.3). Hence, the ratedetermining step of the overall dissolution reaction in the constant-rate regime at pH=12is not the same as in the initial stage of dissolution or in the dissolution experiments atpH=9. An explanation for this behavior can be based on the data in Figure 3.4, wherethe time-dependent evolution of dissolved silicon concentration in solution is correlatedto the change in surface composition expressed in terms of the O/Si atomic ratio.
The O/Si ratio reaches a constant value of 0.2 at about the same time as the constant-rate regime for the release of silicon begins. This correlation suggests that leachingreduces the thickness of the oxidized surface layer until a minimum thicknesscorresponding to O/Si=0.2 is reached. At this point, a dynamic equilibrium isestablished where dissolution (Equation 3.9) can only proceed if new silica-like surfaceoxide is formed via hydrolysis of the Si3N4 bulk phase (Equation 3.4). Hence, theexperimentally observed transition at pH=12 from an initial regime with a highdissolution rate to a constant-rate regime with a very low dissolution rate is related to achange in rate-determining mechanisms. Apparently, the activation energy forhydrolysis of silicon nitride must be significantly higher than the activation energy forthe dissolution of the amorphous surface oxide.

24
0.1
0.2
0.3
0.4
0.5
0.6
0.7
0
5
10
15
20
25
30
35
0 1 2 3 4 5
O/S
i a
tom
ic r
atio
Si-
con
cen
trat
ion
[m
mo
l d
m-3
]
Time [days]
O/Si at particle surface
Si in solution
Figure 3.4: Si concentration in solution (❑) and elemental O/Si ratio of the particlesurface layer (") obtained for a 5 vol% Si3N4 suspension leached atpH=12 and T=25 °C (Solid lines are meant to guide the eye).
The analysis of Si3N4 hydrolysis reactions with the help of molecular dynamicssimulations is rather intricate. Compared to the simpler case of silica, Si-O and Si-Nbonds, and the corresponding much higher number of complex structures have to betaken into account when dealing with Si3N4. The results of quantum-chemical and ab-initio computations evaluating the formation and stability of penta-coordinated siliconcomplexes in the process of silicon nitride hydrolysis are presented in Paper II. It isshown that nucleophilic attack of water or hydroxyl ions on silicon nitride surfacesleads to the formation of stable molecular complexes whose stability increases togetherwith the degree of hydrolysis. This is in line with the observed slow dissolution rate atpH=12 where the Si3N4 hydrolysis becomes the rate determining step. Based on thesimulation results, the following mechanism of hydrolysis can be proposed
Si
NH
NH
H+Si
NH
NH2+
H2OSi
NH
NH2+
OH2 Si
NH
Si
NH
NH2
+OH2
OH
++ NH3
The hydrolysis reaction is initiated by increasing the electrophility of silicon viaprotonation of the adjacent amino group. This makes the silicon accessible fornucleophilic attack by water. A penta-coordinated silicon complex is likely to be formedand after redistribution of charges, it decays eliminating the ammonium ion.
It should be added that the dissolution mechanism may also be affected by the presenceof alkali ions (i.e. there is some evidence that the dissolution rate can be increased by

25
increasing the ionic strength). 32 It has been shown that the formation of ion-pairsbetween surface groups and alkali ions can be quite extensive; in the study by Foissyand Persello 33 on precipitated silica, approximately 90% of the negatively chargedsilanol groups had formed ion pairs with sodium ions at pH=9. Calculations based onatomistic simulation techniques predict that silica surfaces with Si-O-⋅⋅⋅Na+ ion pairshave an increased surface energy compared to completely hydrolyzed Si-OH surfaces;34 such an increase in surface energy is expected to promote dissolution. This has beencorroborated by experimental studies which showed that the dissolution rate of quartzvaried with the type of alkali ion. 35
It is interesting to note that there is a correlation between the Na-concentration and theO/Si-ratio in the silicon nitride surface layer during dissolution. This correlation isshown for the dissolution experiment at pH=12, where the powder was dialyzed against0.01 M NaOH (Figure 3.5).
0
0.5
1
1.5
2
0
0.5
1
1.5
2
0 20 40 60 80 100
O/S
i a
tom
ic r
atio
Na
[a
t%]
Dialysis time [h]
O/Si
N a
Figure 3.5: XPS surface-analysis on silicon nitride powder taken from 5 vol%suspensions dialyzed against 0.01 M NaOH.
The simultaneous decrease of Na concentration and O/Si-ratio suggests a porousstructure of the surface oxide layer which can be penetrated by water and Na+-ions. It isunlikely that Na is incorporated into the surface oxide phase by solid state diffusion atroom temperature. 36,37
3.1.3. Surface Chemistry and Dissolution Behavior of TiC, TiN, WC, and Co
XPS studies on the TiN and TiC powders indicate the presence of an oxidized surfacelayer. It has been reported previously that WC powder has an oxidized surface layerwith a composition corresponding to WO3. 38 Cobalt metal oxidizes to form CoO,Co2O3, or mixed oxides like Co3O4 on the surface. 39 Measured values and literaturevalues of the isoelectric points of the powders are listed in Table 3.4.

26
Table 3.4: Isoelectric points of powders used in this work.pHiep reference
WC ∼2 38
Co3O4 7.3 40
TiN 4.3 this workTiC 4.3 this work
α� Al2O3 9.2 this work
The zeta-potential measurements showed that the isoelectric points of the TiC and TiNmaterials are nearly identical, i.e. pHiep ≈ 4.3 in NaCl electrolyte solution (Figure 3.6).In comparison, the isoelectric point of the α�alumina powder is much higher(pHiep ≈ 9.2). Measurements at various ionic strengths confirmed that NaCl acts as anindifferent electrolyte in all cases.
-60
-40
-20
0
20
40
60
-60
-40
-20
0
20
40
60
0 2 4 6 8 10 12 14
Zet
a P
ote
nti
al
[mV
]
p H
TiN
TiC
Al2O
3
TiC (Whisker)
Figure 3.6: Zeta-potential measurements on selected powders in 0.01 M NaClelectrolyte (Lines are meant to guide the eye).
The zeta-potential values for Al2O3 suspensions compare well with other researchersresults. 41-43 Previously reported pHiep-values for TiN and TiC powders are somewhatless consistent with the present data; different grades of TiN powders showed a pHiep inthe range pH=3-5 44-47 and a pHiep≈2 has been found for TiC. 48 However, as shown forsilicon nitride, synthesis route and post-synthesis treatment of thermodynamicallyunstable non-oxide ceramic powders strongly affect the surface oxygen content and thecorrelated area density of potential-determining surface groups. Accordingly, increasingsurface oxidation will shift the isoelectric point of the acidic TiN and TiC powderstowards the value for the less acidic oxide TiO2 (pHiep≈6). 49
Dissolution of TiC and TiN powders in aqueous media was found to be negligible overpractically the entire pH range. Only at the very acidic conditions (pH=0.8) was asignificant concentration of ∼100 ppm Ti detected after 72 days of leaching. This may
27
be related to the high stability of titanium oxide surface phases, e.g. TiO2 is known todissolve at a very slow rate of less than 10-11 mol m-2 s-1. 27
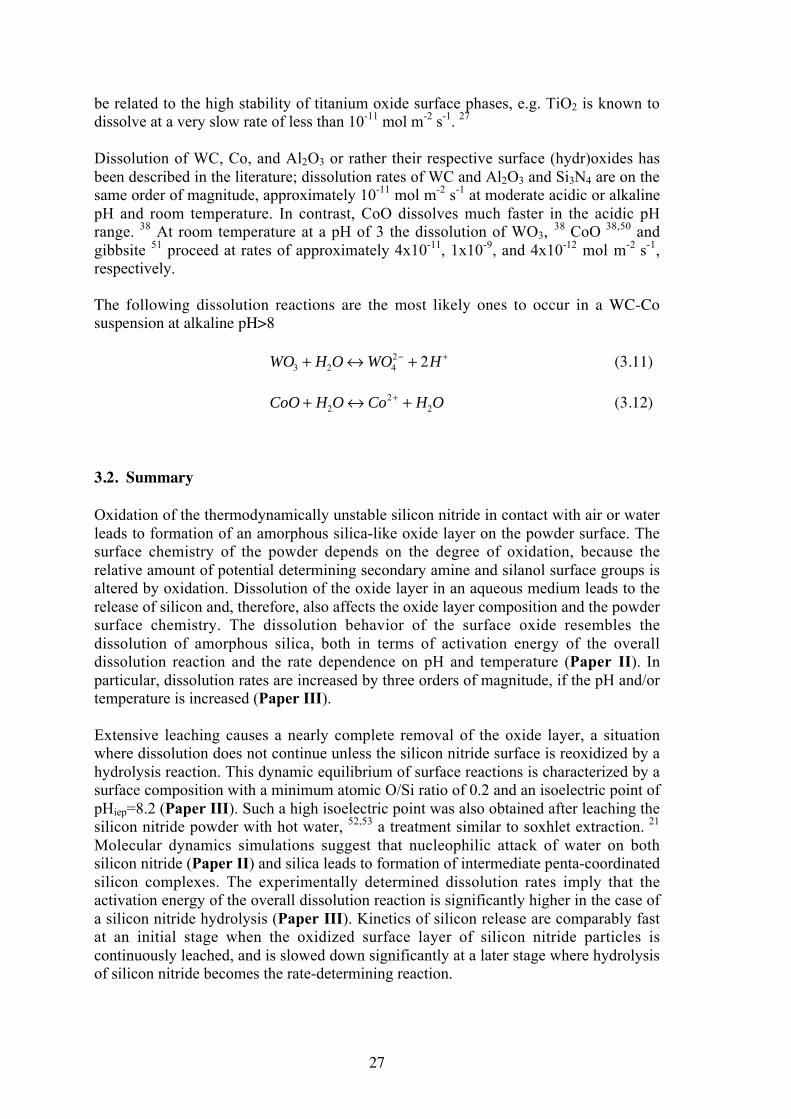
Dissolution of WC, Co, and Al2O3 or rather their respective surface (hydr)oxides hasbeen described in the literature; dissolution rates of WC and Al2O3 and Si3N4 are on thesame order of magnitude, approximately 10-11 mol m-2 s-1 at moderate acidic or alkalinepH and room temperature. In contrast, CoO dissolves much faster in the acidic pHrange. 38 At room temperature at a pH of 3 the dissolution of WO3, 38 CoO 38,50 andgibbsite 51 proceed at rates of approximately 4x10-11, 1x10⁻⁹, and 4x10-12 mol m-2 s-1,respectively.
The following dissolution reactions are the most likely ones to occur in a WC-Cosuspension at alkaline pH>8
WO H O WO H3 2 42 2+ ↔ +− + (3.11)
CoO H O Co H O+ ↔ ++2
22 (3.12)
3.2. Summary
Oxidation of the thermodynamically unstable silicon nitride in contact with air or waterleads to formation of an amorphous silica-like oxide layer on the powder surface. Thesurface chemistry of the powder depends on the degree of oxidation, because therelative amount of potential determining secondary amine and silanol surface groups isaltered by oxidation. Dissolution of the oxide layer in an aqueous medium leads to therelease of silicon and, therefore, also affects the oxide layer composition and the powdersurface chemistry. The dissolution behavior of the surface oxide resembles thedissolution of amorphous silica, both in terms of activation energy of the overalldissolution reaction and the rate dependence on pH and temperature (Paper II). Inparticular, dissolution rates are increased by three orders of magnitude, if the pH and/ortemperature is increased (Paper III).
Extensive leaching causes a nearly complete removal of the oxide layer, a situationwhere dissolution does not continue unless the silicon nitride surface is reoxidized by ahydrolysis reaction. This dynamic equilibrium of surface reactions is characterized by asurface composition with a minimum atomic O/Si ratio of 0.2 and an isoelectric point ofpHiep=8.2 (Paper III). Such a high isoelectric point was also obtained after leaching thesilicon nitride powder with hot water, 52,53 a treatment similar to soxhlet extraction. 21
Molecular dynamics simulations suggest that nucleophilic attack of water on bothsilicon nitride (Paper II) and silica leads to formation of intermediate penta-coordinatedsilicon complexes. The experimentally determined dissolution rates imply that theactivation energy of the overall dissolution reaction is significantly higher in the case ofa silicon nitride hydrolysis (Paper III). Kinetics of silicon release are comparably fastat an initial stage when the oxidized surface layer of silicon nitride particles iscontinuously leached, and is slowed down significantly at a later stage where hydrolysisof silicon nitride becomes the rate-determining reaction.

28
4. Deagglomeration and Dispersion
Fine, sub-micronsized powders are always agglomerated in the dry, as-received state.The dispersion process is strongly dependent on the strength of the interparticle bondsthat keep the agglomerates together and the mechanisms that act to break the bonds.Removal or break-down of particle agglomerates is especially important considering thedetrimental effect of such inhomogeneities on the mechanical properties of a sinteredceramic body. It is well known that both the size and number density ofinhomogeneities play a crucial role in determining the strength and reliability of aceramic material. 54,55
In this work the deagglomeration of silicon nitride powder immersed in water has beeninvestigated. Based on experimental results some general features of thedeagglomeration process of fine ceramic powders are outlined. Particular attention hasbeen paid to the role of powder dissolution in the deagglomeration process.
4.1. Deagglomeration and Dispersion of Si3N4
A dilute suspension of as-received silicon nitride powder was mildly agitated on amagnetic stirrer and the evolution of the particle size distribution (PSD) was measuredwith a light scattering technique as a function of agitation time (Figure 4.1). Whencomparing this size distribution with electron microscopy results (Figure 4.2) itbecomes evident that large agglomerates of primary particles are present in thesuspension; the light scattering results indicate agglomerate sizes considerably largerthan the size of the primary particles or crystallites. According to transmission electronmicroscopy (TEM) investigations the size of the primary particles in the silicon nitridepowder fall in the range of 50 to 200 nm (Figure 4.2), whereas the agglomerates insuspension have a size of up to 200 µm (Figure 4.2). A primary particle size of 50 to200 nm agrees well with the 90 nm BET equivalent particle size derived from themeasured surface area value of 10.4 m2 g-1.
Figure 4.1 shows that large agglomerates, with sizes between 50 and 200 µm arecontinuously broken down with time, and the population of smaller agglomerates (∼1µm in size) is seen to increase. The two populations consist of agglomerates that aredenoted as primary and secondary agglomerates in the following discussion. Theabsence of peaks at intermediate sizes in the PSD during deagglomeration suggests thatprimary agglomerates are eroded away from the large, secondary agglomerates (i.e.primary agglomerates constitute the building blocks of the secondary agglomerates).Hence, suspensions contain a hierarchy of agglomerates where the relative abundance ofdifferent size populations is constantly changing during the deagglomeration process. Aconceptual view of this process is depicted in Figure 4.3.
Deagglomeration proceeds through the break-up of interparticle bonds in theaggregates. For this to happen, the applied force has to be larger than the adhesion forcebetween particles in the aggregate. For a dilute suspension subjected to mild agitation,hydrodynamic drag will be the dominating force on the aggregate.

29
Figure 4.1: Dynamics of particle size distribution in a mildly agitated 1 vol% Si3N4
suspension at pH≈9 and 25 °C. The initial distribution (traced out by thedotted line) is characterized by a relatively large abundance of largeagglomerates that disappear at long times in favor of smaller agglomerates(solid line).
Figure 4.2: Bright-field TEM micrograph of the as-received silicon nitride powdershowing crystallites at a high magnification (bar upper right corner≡50nm).

30
agglomeratesprimary
agitation
agglomeratelarge
50 µm
mild
agglomeratesprimary
50 µm
primary agglomerate
crystallites100 nm
Figure 4.3: Schematic drawing illustrating the break-down of secondary agglomerates.
The magnitude of the drag force, Fd, exerted on a single particle of radius R in a flowfield is approximately
F Rd ≈ 6πυη (4.1)
where v is the fluid velocity and η the fluid viscosity.
The hydrodynamic drag force required to separate two particles is proportional to theinterparticle adhesion force, Fad,
F Fd ad≈ γ (4.2)
where γ is a numerical constant. The mechanism for hydrodynamic detachment ispoorly understood, but, as discussed previously by Desset 56, γ is close to unity whenthe drag force acts perpendicular to the surface and much smaller when thehydrodynamic force is parallel to the surface. 56,57 Desset suggested γ=0.01-0.1 as areasonable estimate for the detachment of small particles in a shear flow field. 56
For particles that are held together by attractive van der Waals forces, the adhesiveinterparticle force, Fad, can be approximated with
FAR
Dad ≈ 6 2 (4.3)
where A is the Hamaker constant and D the surface separation distance. This adhesiveinterparticle force is reduced by electrostatic repulsion at solution conditions where thesurfaces carry a charge (see also Chapter 2.1.). The deagglomeration experiments wereperformed at pH≈9 which is about 2.5 pH units above the isoelectric point of siliconnitride powder (Figure 3.1). Therefore, it is expected that the net adhesive force betweenthe silicon nitride particles is substantially smaller than Equation 4.3 predicts.
By equating the expressions in Equation 4.2 and 4.3 one can obtain an estimate for therelative velocity between the particle and fluid phase required to separate two particles

31
by hydrodynamic shear forces. Assuming that the maximum van der Waals attraction is reduced by one order of magnitude due to electrostatic repulsion between the charged surfaces and inserting the values γ=0.01, 56 A=5×10-20 J, 58 and D=0.2 nm, 54 one obtains ν≈10-2 m s-1. This value lies within the range of flow rates induced by moderate stirring, ∼1-10 mm s-1. Hence, it can be concluded that secondary agglomerates are held together by attractive van der Waals forces. Apparently, the bonding forces between particles in primary agglomerates are much stronger than attractive surface forces, since primary agglomerates survive the stirring agitation (Figure 4.1) and even the ultrasonic treatment used to prepare the electron microscopy samples. For example, the TEM micrograph in Figure 4.4 displays particles in a freeze-dried suspension droplet, which was taken from an ultrasonicated suspension at pH 10. Clearly, agglomerates of 0.5-1 µm size can be distinguished in the micrograph.
Figure 4.4: TEM micrograph of as-received Si3N4 powder showing primary agglomerates (bar upper right corner≡500 nm).

32
The high strength of the primary agglomerates can be explained by the presence of rigid interparticle bridges, so-called necks. For example, measurements on boehmite 59 and silica 60 agglomerates with interparticle necks indicated agglomerate strengths of ≥20 MPa, values at least one order of magnitude higher than bond-strength estimates based on van der Waals forces only. 59 The interparticle necks in boehmite and silica were formed when the powder was dried, due to reprecipitation of dissolved species at particle contact points. Depending on the amount of dissolved material the size of the necks can be quite large (i.e. ranging from 10-100 nm). In the case of sparingly soluble, synthetic non-oxide powders like silicon nitride, necks in the as-received powder may be formed during pyrolysis or calcination of precursor materials 8,54 and/or through surface oxidation at particle contact points during storage. Therefore, the neck size should be on the same order as the thickness of the oxidized surface layer, i.e. approximately 1-10 nm. 61-63 A correlation between deagglomeration and dissolution is expected when interparticle necks consist of a soluble oxidic phase similar to that found on the particle surfaces. One expects that the neck size will be reduced by dissolution at a rate dictated by the dissolution kinetics. The effect of dissolution in alkaline medium on the neck size can be evaluated by using the experimentally determined dissolution rate constants. The decay of the neck radius with time, h(t), is related to the dissolution rate according to
h(t) ≈≈≈≈ h −−−−kmtρ
with km gcm −−−−2s−−−−1[[[[ ]]]]==== 10 −−−−4 MSiN 4/ 3k mol m−−−−2s −−−−1[[[[ ]]]]
(4.4)
where ρ is the density of the dissolved material and MSiN 4/3
=46.6 g mol-1. Assuming a neck density of 2 g cm-3 and using the k-values in Table 3.4, one finds that the neck radius should decrease by 1nm after approximately one week at 25 °C and after only three hours at 80 °C and pH=9. At pH=12 and 25 °C the same effect is obtained after 9 hours. Thus, the decay rate is strongly temperature and pH dependent. These estimates also show that silica based necks with a radius on the order of 1–10 nm can dissolve completely over reasonably short times when pH and/or temperature are increased. The effect of dissolution on deagglomeration was evaluated experimentally by rheological measurements using the steady-shear response of concentrated silicon nitride suspensions prepared at solution conditions corresponding to varying dissolution kinetics (Figures 4.5 and 4.6). The untreated reference suspension with a volume fraction of 35% prepared at pH 9.4 in 0.01 M NaCl-solution is shown in Figure 4.5. It displays a weak shear thinning behavior, with the viscosity approaching a high shear plateau. Subjecting the powder to a 0.01 M NaOH solution results in a significant decrease in the viscosity. The pH of this suspension decreased rapidly during sample preparation, reaching pH 9.3 after about 30 min. It should be noted that in both cases the viscosity measurements were carried out as soon as mixing, ultrasonication, and equlibration of the samples was completed (i.e. after less than 30 min). The viscosity at high shear rates represents the hydrodynamic resistance to flow, which is mainly controled by the efficiency of particle packing. Hence, the reduction in

33
viscosity suggests that the alkaline conditions result in a rapid break-up of primaryagglomerates, which releases immobilized liquid and allows improved particle packing.
0.01
0.1
1 10 100 1000
Vis
cosi
ty
[P
a s]
Shear Rate [s- 1]
in 10 mM NaCl-solutionwith NaOH additions (pH 9.4)
in 10 mM NaOH-solution (pH 9.3)
leached at pH 12
dialyzed against 10 mM NaOH(pH 11.6, 34 vol%)
Figure 4.5: The steady-shear viscosity of 35 vol% suspensions at pH≈9.5 and pH≈12(solid lines are meant to guide the eye).
0.01
0.1
1
10
100
0.001 0.01 0.1 1 10 100 1000
Vis
cosi
ty
[P
a s]
Shear Rate [s- 1]
35 vol%, leached
(50 mM Na+)
43 vol%, dialyzed (10 mM Na+)
43 vol%, leached
(55 mM Na+)
34 vol%, dialyzed (10 mM Na+)
Figure 4.6: The steady-shear viscosity of 35 and 43 vol% suspensions at pH≈12. Theapproximate counter-ion concentration in solution is given in parenthesis(solid lines are meant to guide the eye).
An attempt to obtain an even lower viscosity by subjecting the powder to extensiveleaching by keeping the suspension at pH 12 for two weeks was unsuccessful. Thesuspension displayed a strongly shear thinning behavior (Figure 4.5), typical of aflocculated suspension in which large flocs are broken down by the applied shear. The

34
flocculation was induced by the high ionic strength in this system. High counterion-concentrations, approximately 50 mM Na+, were obtained because NaOH had to becontinuously added to maintain the pH at 12. This effect is caused by the ionization ofsilicic acid at high pH, in accordance with Equation 3.10. Since the silicic acid insolution is produced through powder dissolution, the amount of sodium hydroxideneeded to keep a constant pH should be directly proportional to the amount of dissolvedmaterial.
In contrast, if the excess Na+ and silicic acid are removed by dialysis, the degree ofshear thinning and the viscosity are substantially reduced (Figure 4.6). The dialyzedsuspension displays a nearly Newtonian shear behavior at 35 vol% with a high-shearviscosity comparable to a suspension viscosity at only 20 vol% measured directly aftermixing (see Chapter 5). Similar results are obtained at 43 vol% solids loading (Figure4.6). Hence, strong leaching leads to deagglomerated and low-viscous suspensions evenat very high particle concentrations, but flocculation occurs if the correspondingincrease in counterion concentration is allowed to exceed the critical flocculationconcentration of the system.
4.2. Summary
The findings described in this chapter illustrated deagglomeration of a fine siliconnitride powder under mild agitation proceeds in two stages. The relatively rapid decayof the large, secondary agglomerates is dominated by the break-up of adhesive particle-particle bonds originating from attractive surface forces. The slower break-up of hard,relatively small primary agglomerates (~1 µm) could be related to the continuousweakening of interparticle necks due to dissolution. It was found that the magnitude ofthe imposed hydrodynamic drag forces determines the rate of agglomerate during theearly stage, whereas dissolution processes take over as the rate determining mechanismduring the later stage.
The high strength of interparticle necks in primary agglomerates implies that neckseither have to be dissolved or broken by excessive mechanical forces to obtain adeagglomerated suspension. In a concentrated suspension subjected to high energymilling inertial forces transmitted through collisions with other clusters or the millingmedia become important and make the deagglomeration process a mixture of clustererosion and attrition. Although intense milling often is the solution, optimization of thedissolution rate may solve a deagglomeration problem in a shorter time with muchsmaller energy consumtion. For the oxidized silicon nitride system, rapid dissolution isobtained at high pH at elevated temperatures. It is also necessary, however, to optimizethe peptization process with regard to the amount of added base. Attempting to achievedeagglomeration at room temperature solely by neck dissolution requires high amountsof base and the associated increase in ionic strength can lead to flocculation.
35
5. Stabilization of Colloidal Suspensions
The dominant interparticle forces in colloidal ceramic suspensions are usually van derWaals forces and electric double layer forces. The van der Waals forces are alwaysattractive in aqueous suspensions of ceramic materials. Coulombic forces are repulsivein simple one-component systems, but may become attractive in multi-componentsystems. The magnitude of both, the van der Waals and the electric double layer forces,is a strong function of surface separation and, for the latter, also strongly dependent onpH and ionic strength. In suspensions containing organic additives additional polymer-induced forces are also of significance.
In this work, mainly the effect of adsorbed polyelectrolyte on interparticle forces andsuspension properties will be described. Prominent issues discussed within this contextare the effect of adsorption mechanism, adsorbed layer conformation, polyelectrolytestructure, multivalent ions in solution, and processing scheme design. The presentedresults describe the effect of polyelectrolyte addition on interparticle forces andsuspension properties in single-component and multi-component systems. Theevaluation of experimental results has been based upon direct force, electrokinetic andrheological measurements.
In the first section of this chapter direct measurements of forces between silicon nitridesurfaces in pure electrolyte are discussed. A flat wafer and a novel colloidal probe,produced by nitridation of a silica sphere, were used. Knowing the probe radius, it waspossible to evaluate the obtained interaction forces by means of DLVO theory.Subsequent sections deal with colloidal probe measurements of interparticle forces inthe presence of PAA and Y3+ ions. Based on these results, a discussion will elucidatethe role of surface-segment interactions in PAA adsorption onto silicon nitride andzirconia surfaces. Finally, results of electrokinetic and rheological measurements areused to evaluate the effect of PMAA-PEO copolymers on suspension properties.
5.1. Forces between Si3N4 Surfaces in Electrolyte Solution
Normalized AFM force�distance curves between a silicon nitride sphere and a flatsurface at different pH values and electrolyte concentrations are shown in Figure 5.1. Apurely attractive force is detected in the pH-range 4.1�4.5, whereas measurements athigher pH display a long-range double layer force followed by an attractive van derWaals force at close separations. The estimated van der Waals force is also plotted inFigure 5.1 but accounts only partly for the observed attraction.

36
Figure 5.1: Normalized forces measured between a Si N3 4 probe and a Si N3 4 flatsurface in 1 mM NaCl at pH 3.5 (!), 4.1 ("), 4.9 (#) and 5.5 ($). Thethick line is the estimated van der Waals-force, whereas the thin lines aremeant to guide the eyes.
As discussed in Chapter 3, the isoelectric point of a silicon nitride material is stronglyaffected by powder synthesis and treatment. Hence, it is likely that the attractive regionat pH=4.1�4.5 is caused by a small mismatch in pHiep of the interacting surfaces.However, the mismatch in pHiep of the silicon nitride probe and substrate is sufficientlysmall to assume a symmetrical system with equal surface potentials,
ψ 0 , in the pH-
range of interest (pH≥5.5).
With this approach it is possible to fit DLVO theory to the measured forces using a non-linear Poisson-Boltzmann equation. 64 A value of 4 85 10 20. × − J was assigned to the non-retarded Hamaker constant. 58 A good fit could be obtained with the measured forcesbeing within the limits of constant charge and constant potential boundary conditions.However, it should be pointed out that silicon nitride does not strictly conform to eitherof these limitations, especially at close separations, due to charge regulationmechanisms 14. Fitted surface potentials at pH=8.5 and pH=5.5 for different NaClelectrolyte concentrations are listed in Table 5.1. The fitted potential values
ψ 0 =30
mV at pH 5.5 and ψ 0 =50 mV at pH 8.5 in a 5 mM NaCl solution agree reasonably
well with zeta-potential values of an oxidized silicon nitride powder (Figure 3.2). Theobserved decrease in surface potential with increasing ionic strength (Table 5.1) issomewhat surprising but may be related to different affinities of silanol and secondaryamine surface groups for ion-pair formation with Na+ and Cl- counterions.

37
Table 5.1: Fitted surface potentials, ψ 0 , for Si3N4 in pure electrolyte.
ionic strength
[mM NaCl]
surface potential ψ 0
at pH=5.5[mV]
surface potential ψ 0
at pH=8.5[mV]
0.1 30 901 25 505 30 50
5.2. Stabilization of Si3N4 by Polymer Adsorption
The normalized force-distance curve for silicon nitride surfaces after 3 h adsorption ofPAA from a 500 ppm PAA-50000 solution at pH 5.5 (I=1.1 mM) is shown in Figure5.2. It can be seen that the calculated total ionic strength is in good agreement with thedetermined Debye length. The surfaces experience a long-range repulsion followed byattraction at close separations. At the point where the force gradient of the attractive vander Waals force exceeds the cantilever spring constant (i.e. at a surface separation of ∼4nm), the probe jumps into contact. The applied force has to be increased further toachieve hard wall contact, suggesting a thin (<2 nm) adsorbed layer of PAA.
The extent of PAA adsorption was estimated from the surface potentials extracted fromtheoretical fits with DLVO-theory. A fitted potential of ψ 0 =50 mV after PAA
adsorption was compared to ψ 0 =30 mV of silicon nitride in pure electrolyte at equal
pH (Table 5.1). The force�distance curve taken after flushing with 0.1 mM NaClsolution at pH 8.5 shows two characteristic features (Figure 5.2): A jump-in at ∼7 nmseparation and a barrier of ∼4 nm thickness, which is overcome at a compression forceof 2.1 mN m-1. Changing the pH back to 5.5 by flushing with a fresh electrolyte solutionrecovered the original force curve; hence, no significant desorption of PAA was inducedby the pH increase.
The relative small increase in surface potential suggests that only low amounts of PAAwere adsorbed. This is not unexpected since adsorption isotherms for PAA adsorptiononto silicon nitride powders also showed low adsorbed amounts (i.e. on the order of0.05 mg m-2 at pH>pHiep). 65 The low affinity isotherms can be attributed to theelectrostatic repulsion between the negatively charged surface and polyelectrolyte(Paper V).
The adsorbed PAA layer attains a comparably flat conformation at the solid/liquidinterface. Comparing the layer thickness with the root-mean-square end-to-end distance( R0
2 ≈ 5-10 nm for Mw=10000) 66 of the polymer in solution suggests that a substantial
reconformation of the polymer chains at the interface occurs upon adsorption. Thisimplies that chain reconformation at the interface is faster than polymer transport to theinterface. Fast adsorption of coiled chains is expected to result in high polymer densitiesat the surface and mutual blocking of the relaxation process, thus leading to thickeradsorbed layers. Hence, it appears that the electrostatic repulsion between surface andpolyelectrolyte causes a very slow adsorption kinetics as pointed out previously byCohen Stuart et al 67. This gives the adsorbing macromolecules time to relax into a flatinterfacial conformation.

38
Figure 5.2: Normalized forces measured between a Si N3 4 probe and a Si N3 4 flatsurface after adsorption from a 500 ppm PAA-50000 solution(I= 1 1 10 3. × − M) at pH 5.5 (❍ ), and after subsequent flushing with
0.1 10 3× − M NaCl at pH 8.5 ("). Lines in the inset are fits with DLVO-theory using constant charge and constant potential boundary conditions.The fitted potentials are ψ 0 =50 mV and ψ 0 =95 mV, respectively.
Force-distance curves were also measured at a higher total ionic strength (Figure 5.3) toinvestigate the importance of electrostatic interactions on PAA adsorption. Theadsorption from a 2000 ppm PAA-10000 solution at pH=5.5 (I=19 mM) leads to forcecurves exhibiting a weak electrostatic interaction with an exponential decay at 10-15 nmseparation, followed by a van der Waals attraction. The inset in Figure 5 shows that theDebye length corresponding to the calculated ionic strength agrees well with the long-range tail of the force curve. A polymeric (steric) force is detected at surface separationssmaller than 7 nm. Compressing the adsorbed PAA-10000 layer reveals a layerthickness of approximately 3-4 nm, which is approximately twice as thick as the PAA-50000 layer adsorbed at low ionic strength. This supports the notion that screening theelectrostatic repulsion by increasing the ionic strength results in a higher adsorbedamount of PAA. However, the range of the steric force is still quite small, which impliesa relatively flat PAA layer.
The average molecular weight of the polyelectrolyte is not expected to affect theadsorption behavior, because of polydispersity effects. It was previously shown by deLaat and van den Heuvel 68 that repulsive electrostatic interactions between adsorbedand arriving polydisperse PAA cause a selective adsorption of certain molecular-weightfractions. At short times only small chains adsorb as they have a higher diffusioncoefficient and a small total polymer charge. With time small chains are replacedbecause of the thermodynamically favoured adsorption of larger chains. However, due

39
to the electrostatic barrier there is a molecular weight limit above which no adsorptionoccurs on a reasonable time scale 68,69.
Figure 5.3: Normalized forces measured between a Si N3 4 probe and a Si N3 4 flatsurface after adsorption at pH 5.5: 2000 ppm PAA-10000 solution(I= 1 9 10 2. × − M) (!), 500 ppm PAA-50000 solution (I= 2 2 10 2. × − M)containing 0 1 10 3. × − M YCl3 (❍) and subsequent flushing with
0.1 10 3× − M NaCl at pH 5.5 (#). Lines in the inset are fits with DLVO-theory using constant charge and constant potential boundary conditions(#). The fitted potential is ψ 0 =90 mV. The thick solid line represents the
decay length (κ-1=2.2 nm) of the electrostatic potential for a 1:1 electrolyteat 1 9 10 2. × − M concentration.
Based on this information, it is estimated that the molecular weight limit for adsorptionin our experiments is roughly 10,000. Hence, in the limit of the experimental time scaleemployed here, the molecular weight difference is not considered to be a critical factor.This assumption is supported by the results of Hackley�s work, who investigated PAAadsorption onto silicon nitride as a function of pH and polymer molecular weight. 65 AtpH>pHiep he observed no dependence of the maximum adsorbed amount on themolecular weight in the range Mw=5,000-150,000.
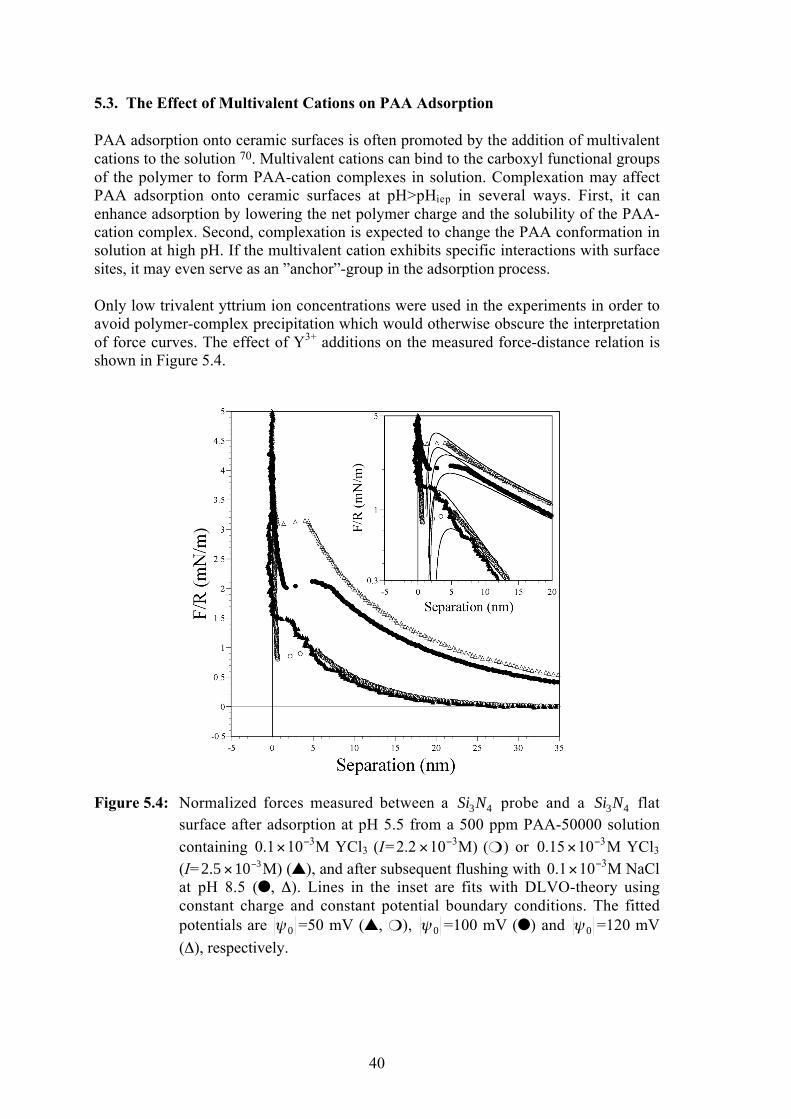
40
5.3. The Effect of Multivalent Cations on PAA Adsorption
PAA adsorption onto ceramic surfaces is often promoted by the addition of multivalentcations to the solution 70. Multivalent cations can bind to the carboxyl functional groupsof the polymer to form PAA-cation complexes in solution. Complexation may affectPAA adsorption onto ceramic surfaces at pH>pHiep in several ways. First, it canenhance adsorption by lowering the net polymer charge and the solubility of the PAA-cation complex. Second, complexation is expected to change the PAA conformation insolution at high pH. If the multivalent cation exhibits specific interactions with surfacesites, it may even serve as an �anchor�-group in the adsorption process.
Only low trivalent yttrium ion concentrations were used in the experiments in order toavoid polymer-complex precipitation which would otherwise obscure the interpretationof force curves. The effect of Y3+ additions on the measured force-distance relation isshown in Figure 5.4.
Figure 5.4: Normalized forces measured between a Si N3 4 probe and a Si N3 4 flatsurface after adsorption at pH 5.5 from a 500 ppm PAA-50000 solutioncontaining 0 1 10 3. × − M YCl3 (I= 2 2 10 3. × − M) (❍) or 0 15 10 3. × − M YCl3
(I= 2 5 10 3. × − M) ("), and after subsequent flushing with 0.1 10 3× − M NaClat pH 8.5 (#, ∆). Lines in the inset are fits with DLVO-theory usingconstant charge and constant potential boundary conditions. The fittedpotentials are ψ 0 =50 mV (", ❍), ψ 0 =100 mV (#) and ψ 0 =120 mV
(∆), respectively.

41
Adsorption at pH 5.5 from a solution of total ionic strength I=2.2 mM containing 0.1mM YCl3 is reminiscent of forces measured between surfaces with PAA adsorbed froma Y3+-free solution as displayed in Figure 5.2 (i.e. a thin, barely detectable polymerlayer is formed). The inset in Figure 5.4 shows that the surface potential of ψ 0 =50 mV
extracted from a fit with I=2.2 mM is the same as for PAA adsorption from a Y3+-freesolution at I=1.1 mM. Flushing with a pH=8.5 0.1 mM NaCl solution produces asurface potential value of ψ 0 =100 mV and a swelling of the adsorbed layer to
approximately double the thickness.
It is interesting to note that the probe jumps into contact at separation distancessignificantly larger than those predicted by DLVO-theory (see insert Figure 5.4), even atthe high surface potentials obtained after flushing with pure electrolyte solution(ψ 0 =100 mV). This is a clear indication of the presence of an additional attractive
force acting at short distances between the approaching polymer layers. The notion ofan additional attractive force is supported by results obtained when using a slightlymodified experimental procedure. After the first adsorption and the force measurementdiscussed above (Figure 5.4), the sample cell was flushed with a fresh PAA solutioncontaining 0.15 mM Y3+ at pH 5.5. The interaction forces measured 2 h after flushingare also shown in Figure 5.4. After the second adsorption period the attractive van derWaals force is masked by a short-ranged repulsion. It seems that additional polymer didadsorb despite the high surface potential (ψ 0 =50 mV) established after the first
adsorption period, which also suggests the presence of an attractive force between theadsorbed layer and polymer in solution.
The experiment was continued by flushing a second time with a pH=5.5 polymersolution, this time containing 0.1 mM Y3+ and 20.5 mM NaCl (I=22 mM). Thecorresponding force-distance relationship is included in Figure 5.3 and was measuredafter allowing 2 h time for adsorption from this solution. Similar to the measurementwith a high ionic strength solution that did not contain yttrium (Figure 5.3), theinteraction curve exhibits a monotonic repulsive force at all distances uponcompression. The total ionic strength, I, is comparable in both measurements with andwithout the addition of Y3+, but the decay length at separation distances >10 nm is muchlarger in the latter case and clearly not attributive to an electrostatic force (see inset inFig. 5.3). However, after flushing with pure NaCl electrolyte solution (I=0.1 mM) at pH5.5 the repulsive force can be fitted to DLVO-theory and a jump into contact occurs at∼4 nm separation distance (Figure 5.3). Hence, it appears that the long-range, non-electrostatic repulsive force seen in Figure 5.3 for the sample with Y3+ content is causedby weakly bound polymer aggregates that can be removed by flushing with newsolution.
Most decompression curves exhibited a deep attractive separation minimum. Figure 5.5shows a typical example of a compression-decompression cycle where the adhesionforce is overcome by the applied pull-off force and the probe jumps out. Thedecompression minimum was slightly lower for surfaces with adsorbed PAA than forsurfaces in pure electrolyte. This is probably related to the higher surface potentialwhich reduces the interparticle adhesion. In the measurement after the third adsorptionperiod (note that I=22 mM and [Y3+]=0.1 mM) a dramatic change occured in that thesingle decompression minimum is replaced by a detachment force curve of a saw-toothshape (Figure 5.5). The long-range attraction seen in the decompression curve is typical

42
of bonds loosening consecutively with increasing decompression distance, 71 a directconsequence of �bridging� effects. Similar decompression force curves have beenreported previously and were attributed to physical chain entanglement ofinterpenetrating polymer layers 72 or single polymer chains bridging between bothsurfaces 73,74 (what is commonly referred to as �bridging�).
Figure 5.5: Comparison of force measurement cycles of compression anddecompression in 500 ppm PAA-50000 solution containing 0 1 10 3. × − MYCl3 at pH 5.5. The total ionic strength is I= 2 2 10 2. × − M (!) andI= 2 2 10 3. × − M (❍). The inset shows the compression curves on asemilogarithmic scale fitted with DLVO-theory according to constantcharge and constant potential boundary conditions (❍). The fitted potentialis ψ 0 =50 mV. The thick solid line represents the decay length (κ-1=2.1
nm) of the electrostatic potential for a 1:1 electrolyte at 2 2 10 2. × − Mconcentration.
Since the decompression curves at low total ionic strength (Figure 5.5) or at high totalionic strength without yttrium addition (not shown) displayed only a singledecompression minimum, it is believed that the total ionic strength and Y3 +
concentration are critical factors in the formation of bonds that are responsible for thesaw-tooth decompression curve. The total ionic strength affects the polyelectrolyteconformation in bulk solution and thus the average distance between chargeablefunctional groups. The average segment-segment distance decreases at increased ionicstrength and upon mechanical compression between approaching surfaces. Moreover, amultivalent cation can bind to more than one polymer functional group forming apolymer-cation complex. Therefore, it is possible that the combination of increasing the

43
ionic strength and mechanical compression leads to an increased complexation of PAAwith Y3+ and eventually, at sufficiently high yttrium concentrations, to the formation ofa polymer network (i.e. �gelation�). Disrupting the bonds in such a network upondecompression would then lead to the saw-tooth type of force-distance curve observedin the experiment.
5.4. The Role of Surface-Segment Interactions in PAA Adsorption
In the following some arguments are put forward that stress the necessity to invoke adetailed picture of surface-segment interactions to explain the observed differences ininterparticle interactions in the Si3N4/PAA and the ZrO2/PAA system. When comparingour direct force measurements with those of Guldberg-Pedersen and Bergström 75 wenote a striking difference in the PAA conformation at the Si3N4/H2O and the ZrO2/H2Ointerface. At pH>pHiep PAA adsorbes in an extended conformation onto the ZrO2
surface 75 and, in contrast, as a flat layer on Si3N4.
An attempt to explain this difference on the grounds of electrostatic interactions is notstraightforward since both systems are not analogue to each other in terms of surfacecharge and polymer charge. In the Si3N4/PAA system there is a higher surface potential(|ψ0|≈30 mV at I=0.1 mM) for surfaces exposed to pure electrolyte solution and a lowerdegree of PAA dissociation (α≈0.3) at pH=5.5> pHiep
Si N3 4 . This situation has to be
compared with the lower surface potential (|ψ0|≈20 mV at I=0.1 mM) and a fullydissociated PAA in the ZrO2/PAA system at pH=8.3> pHiep
ZrO2 . 75 It should be noted that
pH-pHiep≈1 in both cases.
The fact that negatively charged PAA adsorbes at pH>pHiep is often attributed to thepresence of non-electrostatic surface-segment interactions. However, using anadsorption model based on electrostatics only, Hoogeveen et al 76 showed that theheterogeneity of a powder surface in terms of surface sites can explain adsorption undersuch conditions. They suggested that close to the pHiep the coexistence of positive andnegative surface sites allows a surface-segment attraction on a local scale. Accordingly,adsorption can take place even when the net surface charge is of the same sign as thecharge on the polyelectrolyte. It is clear that this type of electrostatically controlledadsorption is limited to a pH region close to the pHiep where local charge heterogeneityis sufficiently high.
The different range of steric interactions is not readily explained with this model. Onemight argue that the high charge density of the polymer chains at pH=8.3 and theresulting strong lateral repulsion between neighbouring chains leads to a stretchedconformation at the ZrO2 surface. On the other hand, the slow adsorption kinetics at thispH would certainly allow for reconformation at the interface leading to a flat,energetically more favourable, conformation like that observed for PAA adsorption ontoSi3N4. 77 Also, PAA adsorption on zirconia has been observed at pH far away from thepHiep (pH-pHiep>3) where the surface density of positive surface sites is likely to benegligible. 78,79
An approximate measure of the surface charge heterogeneity can be obtained byestimating the relative abundance of positive and negative surface sites for silicon

44
nitride at pH=5.5, and for ZrO2 at pH=8.3 and pH=9.5. The measured surface potentialsfor silicon nitride and zirconia at the respective pH, surface site models suggested in theliterature, and the corresponding values for the dissociation constants of silicon nitride 9
and zirconia 80 surface reactions can be employed for the calculations. By assumingψ 0
3 4Si N (pH 5.5)=-30 mV and pHiepSi N3 4 =4.7 and estimating a relative surface site density
with Equation 3.2 one obtains Si NH Si OH Si O2 2 2−[ ] + −[ ]( ) −[ ]+ + −/ ≈0.2 for pH=5.5. In the
case of zirconia, assuming ψ 02ZrO (pH 8.3)=-20 mV, ψ 0
2ZrO (pH 9.5)=-25 mV, 75 and
pHiepZrO2 =7.6 80 yields Zr OH Zr O−[ ] −[ ]+ −
2 / ≈0.2 and 0.001 for pH=8.3 and pH=9.5,
respectively. These calculated ratios can be used only as rough estimates, but they seemto confirm earlier assumptions that the relative amount of positive surface sites issignificant at a pH close to the pHiep and decays rapidly with increasing pH.
In order to discuss the aspect of non-electrostatic surface-segment interactions in moredetail, one can take advantage of recent Monte Carlo (MC) simulations reported byPonomarev et al 81 and Cosgrove et al 82,83. In most of these MC simulations a chainlength of 100 segments was assumed, which is close to that of PAA-10000 (N≈110).These investigations focused on the effect of strength and reversibility of surface-segment bond formation on polymer adsorption; two types of segment-surfaceinteractions were defined, roughly characterized as strong physisorption and strong(irreversible) chemisorption. Ponomarev et al and Cosgrove et al concluded that thepolymer relaxes in a flat, thermodynamically favourable, interfacial conformation forthe case of physisorption. As soon as irreversible chemisorption is allowed for, theadsorption behavior changes drastically; now, by establishing irreversible bonds thepolymer �locks� itself at the interface in a conformation that is very similar to itsequilibrium bulk conformation. Additionally, by tracking the cumulative fraction ofsequential monomer adsorptions Ponomarev et al were able to show that physisorptionproceeds by �zipping� of chains onto the surface. According to this mechanism �trains�are preferentially formed, whereas the probability for �loop� and �tail� formation ismuch less.
This model is also applicable to polyelectrolyte adsorption, since it is based on short-ranged segment-surface interactions at the solid/liquid interface. The schematic drawingin Figure 5.6 is intended to illustrate the main features, and differences, of PAAadsorption onto Si3N4 and ZrO2 at pH>pHiep. PAA chains that have passed theelectrostatic barrier are attracted by the positive surface sites on the silicon nitridesurface and relax into a flat conformation at the interface, irrespective of theirequilibrium bulk conformation. Only if the ionic strength is high, an increased supplyrate of molecules to the surface will cause a blocking of this spreading process and,thus, a thicker polymer layer.
PAA chains that approach a zirconia surface at pH>8 have an extended, roughly rod-like equilibrium bulk conformation. Due to the electrostatic field close to the surface,the main rod axis is aligned perpendicular to the surface on approach. Hence, PAAchains make a �head-on� initial contact with the surface. The electrostatic attractioninduced by positive surface sites should then lead to successive flattening. However, asdescribed above, the formation of irreversible bonds can inhibit or at least slow downthis flattening process. With increasing adsorbed amounts an extended �mushroom�-likeconformation is stabilized by lateral electrostatic interactions between neighbouringchains. Increasing the ionic strength should reduce the electrostatic adsorption barrier

45
and decrease the range of lateral interactions, thus leading to faster adsorption kineticsand higher adsorbed amounts.
t=0 t1>0 t2>t1
t=0 t1>0 t2>t1
Si3N4
ZrO2
+
-
-
++ - ---- +- ---- - ---- --
++ - ---- +- ---- - ---- -- ++ - ---- +- ---- - ---- --
++ ----- +- ---- - ---- --
---
---
--- -
-
-
- -- -
- - --
-
-
-- --
-
-
--
- - -- -
-- -- -
-
-
-
-- - --
--- -
-
-
-
-- - --
--
- - - - - -
- --
-
-
- - - - -+ + + ++ --
- - - - -+ + + ++ --
- - --
-- --
-
-
- - --- -
--
--
---
-
- --
--
-----
----
--- -
-
-
-
-----
- -- - ---
-
-
-
-----
- -- - ---
-
--
---
-- -
-- -
-
-
--
---
---
-- -
--
--
---
--
-
-- -
-
irreversible bonds
- ----
-- -
---
--
--
-
-
--
- --
- -- -- --
-- --- -
-
- ---
-
- --
-
--
-
-
--
--
--- -
-
--
---
-
-
---
-
-
-
----
- --
-
--
-
-
-
-- -- ---
-
-
-
-- -
--
---
- -
- --
-
- - ---
- ---- -
--- -- -
- --
--
-
- -- -
--
-- - -
-
- -
- -
--
-
--
-
- --
Figure 5.6: Schematic drawing showing the adsorption of PAA onto a) silicon nitrideat pH=5.5 and b) zirconia at pH=8.3. In both cases the solution pH obeysthe condition pH-pHiep≈1.
It turns out that this qualitative view of PAA adsorption onto ZrO2 including theformation of irreversible surface-segment bonds coincides very well with theexperimental results obtained by Guldberg-Pedersen and Bergström. 75,77 They wereable to fit force-distance curves with a scaling expression, thus confirming a�mushroom�-like conformation of PAA at the zirconia surface. 75 Their ellipsometrydata showed that PAA adsorption kinetics on ZrO2 is faster at pH=7 than at pH=8.5 andcan be increased by raising the ionic strength. It should be pointed out that the adsorbedamount (after 4 h adsorption time) is much higher at pH=7 than at pH=8.5. 77 This resultcan not be explained if one considers only electrostatic interactions; at pH=7 the nearlyuncharged surface state (i.e. zero net charge) should strongly promote the formation of aflat adsorbed layer. Hence, invoking the action of strong, irreversible surface-segmentinteractions provides a more satisfying description of PAA adsorption onto zirconia.
Additional evidence for this hypothesis can be found in experimental work on theinteraction of metal oxide surfaces with complexing agents. For example, Dobson andMcQuillan 84,85 used in-situ infrared spectroscopy methods to analyze the adsorption ofaliphatic and aromatic carboxylic acids from aqueous solution onto zirconium oxide.Particularly the mono- and dicarboxylic acids can be considered as model compoundswith regard to the adsorption of PAA onto ceramic surfaces. They found that bothmonodentate and bidentate aliphatic carboxylic acids form coordination complexes withthe zirconium cation at the surface. Compared to the monocarboxylic acids the bidentateacids form a more stable surface complex. Malonic acid and oxalic acid were able to
46
bind in the form of a bidentate mononuclear complex, whereas the longer chaindicarboxylic acids were able to bridge their carboxylic functional groups between twosurface sites. Consequently, the interaction of PAA with zirconia via a formation ofcoordinative surface complexes appears to be a reasonable assumption.
To date there there has been no study that suggests the complex formation of aliphaticcarboxylic acids with silicon nitride or silica surfaces in water. The work of Pokrovskiet al 86,87and Öhman et al 88 rather indicate the inability of silicon to form acoordination complex with carboxylic acids. It might be added that the complexation ofnitrogen in silicon nitride with carboxylic acid groups is not likely because secondaryamine surface groups are protonated at all pH of interest.
5.5 Addition of Copolymers to Si3N4 Suspensions
Copolymers of polymethacrylic acid (PMAA) and polyethylene oxide (PEO) wereadded to 20 vol% silicon nitride suspensions. Two modifications of a PMAA-PEOcomb-copolymer were used, one with shorter grafted PEO side-chains (PMAA-PEO104 N) and one with longer grafted PEO chains (PMAA-PEO 168). The silicon nitridepowder had an isoelectric point of pHiep=5.8. The adsorption isotherms of PMAA-PEO104N displayed an adsorption plateau value, Γm, of 0.25 mg m-2 at pH=7, which is fivetimes higher than the adsorption plateau of PAA-10000. Despite the higher adsorbedamounts of PMAA-PEO 104N as compared to PAA, the pH-dependent rheologicalresponse of Si3N4 suspensions is qualitatively the same for both polyelectrolytes (PaperV).
This result implies that any electrostatic or steric repulsion induced by adsorbed PMAA-PEO on silicon nitride is not significantly stronger than in the case of adsorbed PAA.This means that PMAA-PEO, like PAA, adsorbes as a flat layer. This conclusion isdifferent to the interpretation given in Paper V. However, a PAA-like adsorptionbehavior is likely since the methacrylic backbone of the co-polymer is chemically verysimilar to PAA. Nevertheless, for such a flat backbone conformation one would tend tobelieve that the grafted PEO side-chains extend out into solution and provide a stericbarrier. This is obviously not the case; thus, it can be speculated that even the PEO side-chains experience an attractive surface-segment interaction.
It has been suggested by other researchers that the ether-oxygen in PEO chains formshydrogen-bonds with uncharged surface silanol-groups. 89,90 Eremenko et al reportedsignificant adsorption of high-molecular weight PEO onto plasma-synthesized Si3N4
with a high surface oxygen content (pHiep=3.5) at a pH as high as 11.8. This suggeststhat uncharged silanol groups may also exist on silicon nitride surfaces in alkalinesolution, thus providing adsorption sites for PEO segments over a wide pH range.
Additional evidence for adsorption of PEO side-chains onto silicon nitride is providedby the electrokinetic measurements shown in Figure 5.7. Zeta-potential values forsuspensions containing PMAA-PEO 104N and PAA coincide with those of a polymer-free suspension at pH>8. Hence, no adsorption occurs in this pH range. At pH<8adsorption occurs and leads to increased absolute zeta-potential values. The relativedifference in potential increase in the presence of PAA and PMAA-PEO 104N suggests

47
that PMAA-PEO 104N carries a lower charge per polymer unit mass than PAA. Thedifference in polymer charge density is predicted theoretically by the differences inchemical structure and also experimentally observed in potentiometric titration ofpolymer solutions.
However, when adding PMAA-PEO 168 the resulting electrokinetic potential deviatessignificantly from the values in the polymer-free system over the whole pH range. Infact, a reduction in zeta-potential as compared to the polymer-free system occurs atalkaline pH. This is an indirect indication for the adsorption of PMAA-PEO 168. Hence,it must be concluded that PMAA-PEO 168 exhibits a higher adsorption affinity thanPMAA-PEO 104N or PAA at highly alkaline pH. The increased surface-segmentattraction can be attributed to the PEO side-chains, since chemical structures of PMAA-PEO 168 and PMAA-PEO 104N are nearly identical except for the length of the graftedPEO chains.
-60
-40
-20
0
20
40
0 2 4 6 8 10 12
p H
Zet
a P
ote
nti
al
[mV
]
no dispersant
(1.5 wt%)
PAA (0.4 wt%)
PMAA-PEO 104N (1.5 wt%)PMAA-PEO 168
Figure 5.7: Zeta potential versus pH for various polymeric additives at 10 vol% solidsfraction; (❑) no polymer, (❍) 0.4 wt% PAA, (!) 1.5 wt% PMAA-PEO104N, (") 1.5 wt% PMAA-PEO 168.
The above arguments imply, at least for alkaline pH, that PMAA-PEO 168 adsorbs as arather weakly charged polymer with a more extended conformation than PMAA-PEO104N or PAA. However, no reduced suspension viscosities were observed that could berelated to steric repulsion. In contrary, suspension viscosities are higher (at pH>8.5)than in the other systems. The increased viscosity is caused by polymer bridgingbetween particle surfaces. Apparently, the electrostatic barrier for the weakly chargedPMAA-PEO 168 is low enough to allow adsorption of the high-molecular weightfraction of the highly polydisperse polymer (MW/MN=6.4). Yet, adsorbed amountsappear to be below surface saturation and bridging becomes possible (Paper V).
Related to the different number of chargeable functional groups per unit polymer mass,suspensions containing PMAA-PEO or PAA display a substantial difference inrheological response to excess polymer addition (i.e. additions exceeding the minimum
48
amount needed for surface saturation). While the viscosity increase is rather pronouncedupon increasing the excess concentration of PAA, addition of excess PMAA-PEO has anegligible effect. For example, upon 2 wt% PAA and PMAA-PEO addition at pH=7 thesuspension viscosity increases by 100% and 10%, respectively, compared to theminimum viscosity value.
Several mechanisms can be ruled out as an explanation. Polymer bridging effects can beexcluded because in this concentration regime all particle surfaces are saturated withadsorbed polymer. The addition of the polyelectrolytes in the correspondingconcentration range results in a neglible increase in the viscosity of the continuousphase; hence, relative viscosity effects can be ruled out. It is unlikely that the increase inviscosity is related to an increasing thicknesses of the adsorbed layer with addedamount. Such an effective volume effect is not likely to occur for fully covered surfaces.The fact that the systems containing polyelectrolytes with higher molecular weightsthan PAA-10000 (i.e. PMAA-PEO 168 with Mw=43200 and PMAA-PEO 104N withMw=32700) actually display the lowest viscosities at pH=7 is a strong indication thateffective volume effects are neglible.
Moving the focus to the associated counter-ions of the polyelectrolyte salts provides aplausible explanation for the observed viscosity increase. Excess addition ofpolyelectrolyte gives rise to an increased counter ion concentration in solution due todissociation of polymer functional groups. This change in ionic strength cansignificantly affect the colloidal stability. Gourmand 91 concluded in a previous studythat the poor stability of alumina suspensions upon excess addition of PAA at pH 9 wasrelated to the increase in ionic strength. With increasing ionic strength the electrostaticdouble layer forces are expected to become very short-ranged and the extendedpolyelectrolyte layer will collapse due to the screening of the electrostatic repulsionbetween charged sites of adjacent polyelectrolyte chains. Hence, the repulsive,electrosteric forces may become too short-ranged to inhibit flocculation. Thishypothesis is tested by showing the suspension viscosity as a function of counterionconcentration in the solution instead of the polyelectrolyte concentration (Figure 5.8).The counterion concentration was obtained from potentiometric acid-base titration ofthe respective polyelectrolytes.
It was found that the marked increase in viscosity corresponds to a backgroundelectrolyte concentration of more than 50 mM. Figure 5.8 also shows that the excessaddition of PMAA-PEO resulted in counter-ion concentrations below 30 mM.Therefore, the relatively small increase in viscosity upon addition of relatively highamounts of PMAA-PEO 104N (in wt% dwb) is due to the low levels of dissociatedcations. In line with previous conclusions, this result also implies that the number ofchargeable groups per unit mass of polymer is lower for PMAA-PEO 104N comparedto PAA.

49
0.01
0.1
1
0 20 40 60 80 100
Vis
cosi
ty
[Pa
s]
Counter-ion concentration [mM]
PAA
PMAA-PEO 104N
Figure 5.8: Steady shear viscosity at a shear rate of 50 s-1 for 20 vol% suspensions atpH 7 as a function of counterion concentration; (!) PAA, (❑) PMAA-PEO 104N (lines are meant to guide the eye).
5.6. Dispersing WC-Co Powders Using Polyethyleneimine
In this section it will be shown that well dispersed aqueous WC-Co suspensions can bemade by using polyethylenimine (PEI) as a dispersing agent. PEI is a cationicpolyelectrolyte and acts as a weak base in aqueous solutions. Steady shear rheology wasused to determine the flow behavior of moderate to highly concentrated WC-Coslurries. Based on the rheology results, the effect of polymer concentration, polymermolecular weight, pH, powder solubility, and ageing on the flow behavior has beenevaluated. Polymer concentrations are expressed in weight percent with respect to thedry powder weight.
The WC-Co suspensions display a strong shear-thinning behavior at low PEIconcentrations (<0.3 wt%), typical of a flocculated suspension. At higher PEIconcentrations (>0.3 wt%), however, the degree of shear thinning is substantiallyreduced and the flow curves are nearly Newtonian. This behavior is typical of acolloidally stable suspension at intermediate solids concentrations. The weak shearthinning is related to a perturbation of the equilibrium suspension structure by shearforces (see Chapter 2.4). It was found that increasing the PEI concentration above 0.3wt% does not affect the steady shear properties; these suspensions display nearly thesame viscosity of 10 mPa s (at 50 s-1 shear rate) irrespective of the PEI concentration(Figure 5.9).

50
8
8.5
9
9.5
10
10.5
11
0.001
0.01
0.1
1
0 0.5 1 1.5 2
pH
Visco
sity at 50 s-1 sh
ear rate [Pa s]wt% PEI
PEI (Mw=25000)
Figure 5.9: Steady shear viscosity of 20 vol% WC-Co suspensions at 50 s-1 shear rateas a function of added amount PEI-25000. The resulting suspension pH(12 hours after milling) is also plotted versus PEI concentration (lines aremeant to guide the eye).
Since WC particles carry a negative net charge at pH>2, 38 the dominating driving forcefor PEI adsorption is most likely the electrostatic attraction between the positivelycharged polymer and the negatively charged WC surface. No direct measurement of thelayer thicknesses of PEI adsorbed on ceramic surfaces has been reported. Direct forcemeasurements have shown that polyvinylamine, a linear cationic polyelectrolyte withsmall side-groups, adsorbes on negatively charged glass surfaces as a flat layer. 92 It canbe assumed that the highly charged and flexible polyvinylamine adsorbs onto theoppositely charged surface by the zipping mechanism discussed in the previous section.
However, due to steric effects and intramolecular repulsion imposed by its branchedstructure, PEI molecules may not be able to spread out on a surface to the same extentas a flexible, linear homopolymer. The �backbone-length� of the branched PEImolecule depends on the degree of branching and may be described with an effectivedegree of polymerisation, Neff. Branched PEI contains primary, secondary and tertiaryamine groups in an approximate number-ratio of 25/50/25, where the tertiary aminegroups constitute the branching points. 12 When assuming that the probability ofbranching is the same for all nitrogen atoms, and as long as the above ratio of aminegroups remains constant, Neff can be estimated by
NN
An
A A A A A A
effn
n n n n
=+( )
{ }
= −( ) + = =− − −
34 1
1 2 3
2 0 11 2 1 0 1
with = , , ,....
with ,
(5.1)
where N represents the total number of NH(CH2)2 units and the degree of branchingincreases with n. For example, the calculated Neff value for a PEI molecule withMW=25.000 and the shortest possible branches (i.e. similar to polyvinylamine) yieldsNeff(n=0)≈435. A hydrodynamic radius of 3-5 nm for a branched PEI with Mw=17000-37000 has been reported previously. 93,94 It has also been suggested that the highly

51
branched PEI has a spherical conformation in solution, with a radius slightly dependenton the degree of protonation. 94,95 A value of Neff(n=4)≈14 corresponds roughly to aspherical PEI structure. A sphere radius of about 3 nm is obtained when assuming an N-N distance of 0.4 nm, which agrees well with the experimental value. Hence, it can beassumed that the limits of lateral spreading for adsorbing PEI are determined by itsdegree of branching. Experimental data obtained with an AFM imaging method confirmthis assumption; the hydrodynamic radius and the diameter of adsorbed singlemolecules were found to agree reasonably well. 94 However, one expects a differencebetween the coil diameter in solution and the thickness of the adsorbed layer; due toelectrostatic attraction between polymer charges and surface charges the adsorbingmolecule is likely to collapse upon adsorption. Some earlier studies suggest a collapseto 1-3 nm layer thickness. 94,96 Pfau et al 94 proposed that the extent of polymercompression is mainly related to the relative difference in charge density between thepolymer and substrate. Thus, it is possible that steric interactions in the WC-Co/PEIsystem become more important as a stabilizing mechanism with increasing pH, becausea more alkaline pH causes a decreased degree of protonation of the polymer. Therheology measurements give indirect evidence for this assumption; even at pH=10.8where PEI is almost uncharged, the suspension is well dispersed and shows a nearlyNewtonian shear response (Paper VI).
In aqueous WC-Co suspensions with pH>8, dissolution takes place according toEquations 3.11-12. Andersson and Bergström pointed out that the acidic WO3 and thebasic CoO surfaces together act as a buffer system in WC-Co suspensions. 38 Thus,when no PEI is added the actual pH changes with time are fairly small and the pHshould be in the range of pH=8-8.5 (for a 92/8 wt% WC-Co mixture) for the time scaleof the experiments presented here. Upon addition of PEI the buffering capacity of thedescribed mechanism is eventually exceeded and the pH increases to pH=10.8 at 1.5wt% PEI addition (Figure 5.9). The increase in pH with increasing PEI concentrationcan be atttributed to the protonation of the amine groups of PEI. The pH of WC-Cosuspensions containing PEI does not change with time which suggests that thedissolution of WC is of minor importance. This is supported by previous work thatshowed that the dissolution rate of WC powder at alkaline pH is heavily reduced inWC-Co (92/8 wt%) suspensions as compared to WC suspensions; probably due to theformation of a surface complex. 38
To further elucidate the effect of pH on the rheological properties, a series of 20 vol%WC-Co samples with equal polyelectrolyte content (0.5 wt% PEI-25000) were preparedat different pH. In the range pH=7-9 all samples were well dispersed displayingidentical shear behavior with a low viscosity and slight shear thinning (Figure 5.10). AtpH≈7 or lower it was impossible to equilibrate a sample at a constant pH for any longertime period. Dissolution of Co (or rather the CoO surface layer) releases OH- (Equation3.12) which increases the pH. However, it was possible to measure the viscosity rightafter the addition of HCl and the steady shear properties were essentially identical withthe suspensions at higher pH (Figure 5.10). Only at the highly alkaline pH (pH=9.8) didthe suspension display severe shear thinning (Figure 5.11). This might be due toprecipitation of Co(OH)2 on the WC particle surfaces according to the reaction
Co2+ + 2H2O ↔ Co(OH)2 + 2H+ (5.2)

52
0.001
0.01
0.1
1
10
100
1000
104
0.01 0.1 1 10 100 1000
pH 7.0pH 7.8pH 8.5pH 9.1pH 9.8
Vis
cosi
ty
[Pa
s]
Shear rate [s-1]
PEI (Mw=25000)
Figure 5.10: Steady shear viscosities of 20 vol% WC-Co suspensions containing 0.5wt% PEI 25000. The suspension pH was adjusted directly after millingby addition of acid or base (The pH denoted in the legend was measured12 hours after pH adjustment).
If the pH is increased above a critical level right after milling, the rapid precipitation ofcobalt hydroxide may inhibit adsorption of the positively charged polyelectrolyte;hence, the adsorbed amount of PEI is insufficient to stabilize the suspension.This result should be contrasted with the good stability and low degree of shear thinningof the slurry stabilized with 1.5 wt% PEI at a pH of 10.8. It should be noted that the pHincreases more slowly in this case due to the protonation of PEI; hence, there is apossibility that PEI adsorption has reached equilibrium before Co(OH)2 precipitationoccurs.
0.001
0.01
0.1
1
10
100
1000
104
0.01 0.1 1 10 100 1000
20 vol%, 0.3 wt% PEI 10000, pH 8.3 40 vol%, 0.3 wt% PEI 10000, pH 8.4 20 vol%, 0.5 wt% PEI 25000, pH 8.4 40 vol%, 0.5 wt% PEI 25000, pH 8.3
Vis
cosi
ty
[Pa
s]
Shear rate [s-1]
Figure 5.11: Steady shear viscosities of 20 vol% and 40 vol% WC-Co suspensionscontaining 0.3 wt% PEI-10000 and 0.5 wt% PEI-25000 (The pH denotedin the legend was measured 12 hours after milling).

53
The effect of the molecular weight of the PEI dispersant can be deduced from steady-shear measurements on WC-Co suspensions containing 0.3 wt% PEI-10000 and 0.5wt% PEI-25000 (Figure 5.11). For the 20 vol% suspensions, no effect of molecularweight on the flow behavior can be seen. Both suspensions display a weak shearthinning behavior with a viscosity of ∼10 mPa s at a shear rate of 50 s-1. Apparently,electrostatic and/or steric repulsive forces are of sufficient magnitude and range toprevent flocculation for the lower molecular weight PEI dispersant. At 40 vol% solidsloading, however, lower viscosities are recorded for the suspension containing PEI10000. This can be explained by the smaller effective volume of the suspended phase insuspensions with PEI 10000 as compared to suspensions with PEI 25000. The effectivevolume fraction scales with the adsorbed polymer layer thickness according to Equation2.22. Hence, it can be concluded that adsorbed layers of PEI-25000 are thicker thanadsorbed layers of PEI-10000. This effect can be of importance when slurries with amaximum solids loading are desired.
5.7. Preparation of TiN/TiC-Al2O3 Composite Suspensions
The reinforcing particulate phase needs to be well dispersed in the matrix phase in orderto achieve optimized properties of a composite material. In this section a colloidalprocessing route for aqueous Al2O3-TiN/TiC systems will be described. Thedevelopment of an optimized processing scheme will be based mainly on the results ofelectrokinetic and rheological experiments. Its applicability to systems containing TiNand TiC phases with a wide range of morphologies will be assessed.
Based on the the surface chemistry of TiN and TiC (Chapter 3), the processing schemedepicted in Figure 5.12 was developed for the preparation of TiN/TiC-Al2O3 compositesuspensions. As shown in detail in previous work, well-dispersed α-Al2O3 suspensionswith an inherent suspension pH-value of pH≈9 are obtained by simply mixing deionizedwater, powder, and >0.2 wt% PAA. 41-43 Upon addition of 0.5 wt% PAA to the aluminasuspension the pHiep shifts to acidic values (pHiep ≈ 3) due to polyelectrolyte adsorption.41-43 From the processing scheme it can be seen this was done in the first milling step;TiN or TiC was added in the second milling step.
Mixing and Dispersing I) Al2O3 + H2O + PAA
Freeze Granulationin Liquid Nitrogen
Mixing and Dispersing II) Addition of TiN/TiC
pH 9
Equilibration
Freeze Drying of Granules
Sieving
Sintering(1700 °C, 28 Mpa, 1.5 h in Ar)
Figure 5.12: Processing scheme for composite preparation.

54
Before and after adding TiN or TiC, the suspensions show almost no shear thinning,thus indicating a well-dispersed suspension. However, if addition of PAA is omitted, aflocculated, strongly shear-thinning suspension is obtained (Figure 5.13). Clearly, theabsence of flocculation is related to the electrostatic repulsion between alumina particleswith adsorbed PAA layers and the TiN or TiC particles; both are highly negativelycharged at pH=9.
10-4
10-3
10-2
10-1
100
101
102
0.1 1 10 100 1000
Vis
cosi
ty
[Pa
s]
Shear Rate [s-1]
Al2O
3-TiN (no PAA)
Al2O
3-TiN (0.5 wt% PAA)
Al2O
3-TiC (0.5 wt% PAA)
Al2O
3 (0.5 wt% PAA)
}
Figure 5.13: Steady-shear flow curves of 20 vol% composite suspensions at pH≈9.
10-3
10-2
10-1
100
101
102
0.01 0.1 1 10 100 1000
Vis
cosi
ty
[Pa
s]
Shear Rate [s-1]
5 vol% (nano)25 vol% (micron) }
10 vol%
20 vol%
25 vol%
Figure 5.14: Steady-shear flow curves of 20 vol% composite suspensions with variousTiNnano concentrations and 0.5 wt% PAA at pH≈9.
Figure 5.14 shows the flow curves of composite suspensions containing TiNnano. Usingnanosized TiN of up to 5 vol% (of the total solids loading) does not change the flowbehavior compared to suspensions containing 25 vol% micron-sized TiN. A slightviscosity increase at 10 vol% TiNnano concentration is observable, whereas even higherconcentrations leading to substantial shear-thinning. This effect might be related to the

55
change in particle size distribution when adding TiNnano or an induced aggregation dueto changes in suspension pH upon TiNnano addition. The pH of an alumina suspensiondispersed with 0.5 wt% PAA changes from 9.1 to 8.2 upon addition of 20 vol% TiNnano,which can result in enhanced homocoagulation of the TiN particles.
Another factor contributing to the high viscosity might be the interaction betweenTiNnano particles and PAA macromolecules. Previous results on the electrokinetics andrheology of TiNnano particles dispersed with polyacrylic-type dispersants imply thatPAA can adsorb on titanium nitride. 44,47 These studies suggested that adsorption occurseven at a pH where both particles and polymer carry negative charges. Hence, it ispossible that in the present system weak adsorption (i.e. adsorption below the saturationlevel) of PAA on TiNnano causes bridging flocculation at high TiNnano particleconcentrations and, thus, a higher suspension viscosity.
5.8 Summary
A novel probe for direct measurement of forces between silicon nitride surfaces hasbeen introduced (Paper IV). By using this probe in AFM measurements, it could beshown that PAA adsorbes in a flat conformation onto silicon nitride surfaces. Hence,PAA adsorption at pH>pHiep can stabilize moderately concentrated silicon nitridesuspensions in the range |pHiep-pH|<1.5, as indicated by a near-Newtonian shearresponse, but the stabilization mechanism is purely electrostatic. The adsorbed amountcan be increased by increasing the ionic strength, but adsorbed layers are still rather flat.In the presence of multivalent yttrium cations, adsorption behaviour is practicallyunchanged. However, polymer/cation complexation can lead to adsorption of additionalweakly bound polymer which is easily removed. In the presence of yttrium ionsattractive non-electrostatic forces act between surfaces with adsorbed polymer and athigh total ionic strength, long-range adhesion forces are observed.
In the light of the above conclusions, the results of electrokinetic and rheologicalmeasurements suggest that PMAA-PEO copolymers also adsorb onto Si3N4 in a flatinterfacial conformation despite the grafted PEO side-chains. This is probably due tohydrogen-bonding between PEO moieties and surface silanol groups.
The pronounced differences in steric interactions in the Si3N4/PAA and the Zr2O3/PAAsystems at pH>pHiep have been explained by the presence of strong electrostaticsurface-segment interactions in the former (if pH is sufficiently close to pHiep) andstrong, irreversible surface-segment interactions in the latter system. Moreover, it seemsto be feasible to use this approach for the interpretation of suspension properties of otherPAA-stabilized ceramic powders besides those discussed here. For example, it may beno coincidence that sodium or ammonium-salts of PAA are very efficient in stabilizingnot only ZrO2 but also Al2O3 and TiO2 at very high particle concentrations (>50 vol%).Like ZrO2, Al2O3 and TiO2 exhibit surface complexation with carboxylic acids inaqueous solution. 84,85,97,98 Mixing such an oxide powder with water and a sufficientamount of PAA-salt buffers the suspension pH at pH>8. 79 These two factors togethercreate conditions for PAA adsorption that are very similar to those discussed here inconnection with the ZrO2/PAA system.
56
The effect of polyethylenimine additions on the dispersion of WC-Co (92/8 wt%)powder mixtures in water has been evaluated by means of steady shear rheology. Insummary, it was shown that well dispersed, slightly shear thinning 20 vol% WC-Cosuspensions can be obtained at additions of more than 0.3 wt% PEI. The presumablyelectrostatically driven adsorption of the cationic polymer onto the negatively chargedWC particles leads to stabilization of the WC-Co suspensions. The possibility that thestabilization mechanism changes from predominantly electrostatic to mainly stericrepulsion with increasing pH and, hence, decreasing protonation has been discussed.PEI of molecular weights 10000 and 25000 were equally able to stabilize the aqueousWC-Co suspensions. The lower viscosity for the highly concentrated suspensions usingthe lower molecular weight PEI could be attributed to a lower adsorbed layer thicknessand thus a lower effective volume fraction of the suspended phase. However,flocculation could be induced by addition of strong bases; it is speculated that this effectis related to Co(OH)2 precipitation on WC surfaces which inhibits PEI adsorption.
Finally, it was shown that well-dispersed, low-viscous TiN/TiC-Al2O3 compositesuspensions with 20 vol% solids loading (minimum viscosities of the compositesuspensions were in the range 3-4 mPas) can easily be produced with all investigatedalumina-based composite systems by using the same processing scheme.
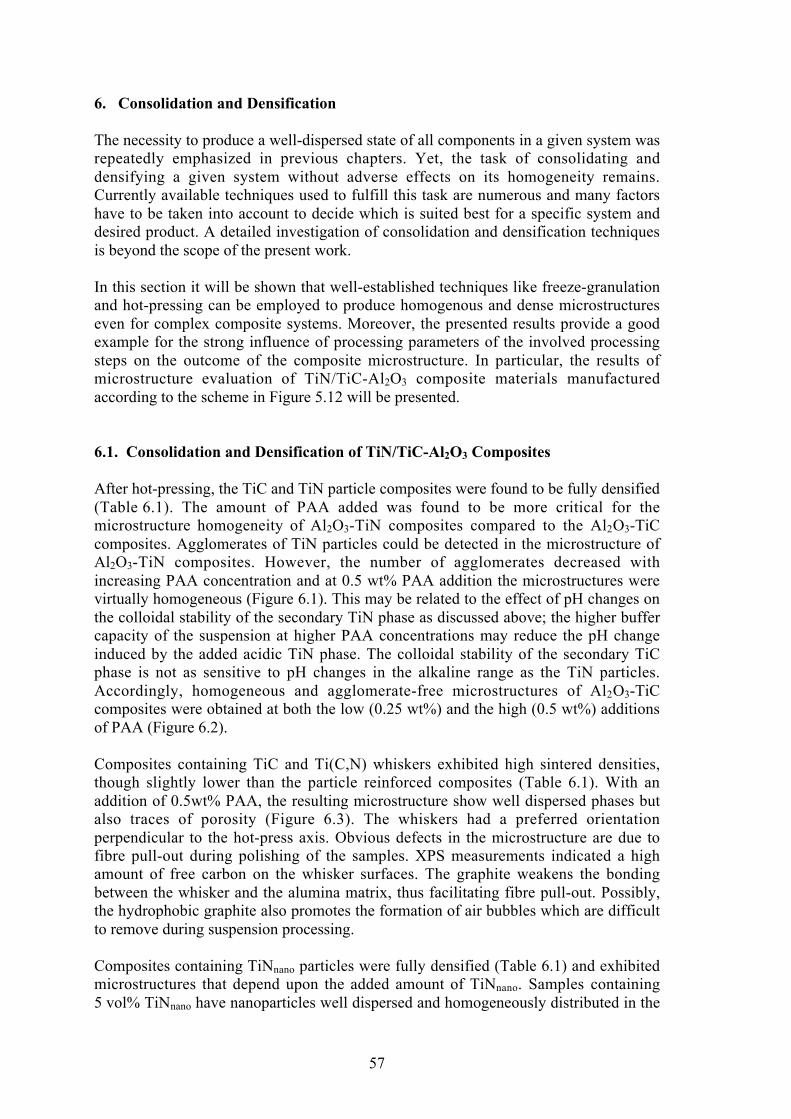
57
6. Consolidation and Densification
The necessity to produce a well-dispersed state of all components in a given system wasrepeatedly emphasized in previous chapters. Yet, the task of consolidating anddensifying a given system without adverse effects on its homogeneity remains.Currently available techniques used to fulfill this task are numerous and many factorshave to be taken into account to decide which is suited best for a specific system anddesired product. A detailed investigation of consolidation and densification techniquesis beyond the scope of the present work.
In this section it will be shown that well-established techniques like freeze-granulationand hot-pressing can be employed to produce homogenous and dense microstructureseven for complex composite systems. Moreover, the presented results provide a goodexample for the strong influence of processing parameters of the involved processingsteps on the outcome of the composite microstructure. In particular, the results ofmicrostructure evaluation of TiN/TiC-Al2O3 composite materials manufacturedaccording to the scheme in Figure 5.12 will be presented.
6.1. Consolidation and Densification of TiN/TiC-Al2O3 Composites
After hot-pressing, the TiC and TiN particle composites were found to be fully densified(Table 6.1). The amount of PAA added was found to be more critical for themicrostructure homogeneity of Al2O3-TiN composites compared to the Al2O3-TiCcomposites. Agglomerates of TiN particles could be detected in the microstructure ofAl2O3-TiN composites. However, the number of agglomerates decreased withincreasing PAA concentration and at 0.5 wt% PAA addition the microstructures werevirtually homogeneous (Figure 6.1). This may be related to the effect of pH changes onthe colloidal stability of the secondary TiN phase as discussed above; the higher buffercapacity of the suspension at higher PAA concentrations may reduce the pH changeinduced by the added acidic TiN phase. The colloidal stability of the secondary TiCphase is not as sensitive to pH changes in the alkaline range as the TiN particles.Accordingly, homogeneous and agglomerate-free microstructures of Al2O3-TiCcomposites were obtained at both the low (0.25 wt%) and the high (0.5 wt%) additionsof PAA (Figure 6.2).
Composites containing TiC and Ti(C,N) whiskers exhibited high sintered densities,though slightly lower than the particle reinforced composites (Table 6.1). With anaddition of 0.5wt% PAA, the resulting microstructure show well dispersed phases butalso traces of porosity (Figure 6.3). The whiskers had a preferred orientationperpendicular to the hot-press axis. Obvious defects in the microstructure are due tofibre pull-out during polishing of the samples. XPS measurements indicated a highamount of free carbon on the whisker surfaces. The graphite weakens the bondingbetween the whisker and the alumina matrix, thus facilitating fibre pull-out. Possibly,the hydrophobic graphite also promotes the formation of air bubbles which are difficultto remove during suspension processing.
Composites containing TiNnano particles were fully densified (Table 6.1) and exhibitedmicrostructures that depend upon the added amount of TiNnano. Samples containing5 vol% TiNnano have nanoparticles well dispersed and homogeneously distributed in the

58
matrix phase. All nano-composites contained micron-sized TiNnano agglomerates, inamounts increasing with increasing TiNnano content. At 5 vol% TiNnano concentration thenano-particles were located both within the alumina grains and the grain boundaries(Figure 6.4). In this sample the alumina grain coarsening was pronounced. At 10 and 20vol% TiNnano the alumina grain coarsening was suppressed; TiNnano particles formedlarge agglomerates at the alumina grain boundaries, thus acting as a grain growthinhibitor (Figures 6.5 and 6.6).
Table 6.1: Composition of sintered samples and measured density after hot pressing.
Composition Amount of PAA addedwith respect to dry
powder weight Al2O3
(wt.%)
Density after hot-pressing in percenttheoretical density
(% TD)1 Al2O3 0.25 1002 Al2O3 0.5 1003 Al2O3−25 vol%TiC 0.25 1004 Al2O3−25 vol%TiC 0.5 1005 Al2O3−25 vol%TiN 0.25 1006 Al2O3−25 vol%TiN 0.5 1007 Al2O3−5 vol%TiNnano 0.5 1008 Al2O3−10 vol%TiNnano 0.5 1009 Al2O3−20 vol%TiNnano 0.5 10010 Al2O3−20 vol%Ti(C,N)whiskers 0.5 9811 Al2O3−25 vol%TiCwhiskers 0.5 98
Figure 6.1: SEM micrograph of the sample cross-section perpendicular to the pressingdirection of Al2O3 - 25vol% TiN (0.5 wt% PAA).

59
Figure 6.2: SEM micrographs of the sample cross-section perpendicular to thepressing direction of Al2O3 � 25 vol% TiC composite (0.5 wt% PAA).
Figure 6.3: SEM micrographs of the sample cross-section perpendicular to thepressing direction of Al2O3 - 20vol% Ti(C,N)whisker (0.5 wt% PAA).

60
Figure 6.4: SEM micrographs of thermally etched sample cross-sections parallel to thepressing direction of a hot-pressed Al2O3-5 vol% TiNnano composite with0.5 wt% PAA.
Figure 6.5: SEM micrographs of thermally etched sample cross-sections parallel to thepressing direction of a hot-pressed Al2O3-10 vol% TiNnano composite with0.5 wt% PAA.

61
Figure 6.6: SEM micrographs of thermally etched sample cross-sections parallel to thepressing direction of a hot-pressed Al2O3-20 vol% TiNnano composite with0.5 wt% PAA.
6.2 Summary
The aim of this study was to develop an aqueous colloidal processing route suitable forthe preparation of TiN/TiC-Al2O3 composites with a dense and homogeneousmicrostructure. In summary, the assessment of composite microstructures showed thatthe processing scheme is applicable to all investigated composite materials. In all casesit is possible to obtain well-dispersed secondary TiN and TiC phases in the aluminamatrix phase by controlling suspension pH and amount of PAA added. 98-100% of thetheoretical density was achieved after sintering. The homogeneity of TiC containingcomposite microstructures was not affected by pH variations in the alkaline rangeduring wet processing. For Al2O3-TiN composite materials highly alkaline processingconditions are preferred in order to prevent agglomeration of TiN particulates. Varyingthe content of TiNnano revealed that there is an optimum concentration below whichexcessive alumina grain growth occurs whereas at higher concentrations TiN particlestend to form agglomerates at the grain boundaries. The location of the optimumconcentration will depend upon the pressing conditions.

62
7. Concluding Remarks and Suggestions for Future Work
Results presented in this thesis outline the factors that determine deagglomeration andstabilization of silicon nitride. It is hoped that the processing of other systems wherestrong particle agglomerates may cause problems (e.g. in nanopowder systems) canbenefit from this work. As already indicated by the studies on the WC-Co/PEI system,one also expects that dissolution/reprecipitation reactions can significantly affectpowder surface chemistry and polymer adsorption in multi-component systems.
Many consolidation techniques for the manufacturing of complex-shaped ceramic parts(e.g. gelcasting, DCC, robocasting) require the use of suspensions with very high solidsloading. The results on PAA adsorption and interfacial conformation presented heresuggest that this is achieved only in a limited number of systems when using simplehomopolymer polyelectrolytes. This emphasizes the need for polymeric dispersants witha more complex structure. In parallel, a better understanding of material-specificsurface-segment interactions is required to predict the dispersant performance in a givensystem. In this context, the importance of computer simulations (e.g. Monte Carloalgorithms and molecular dynamics simulations) as a tool for the prediction of polymeradsorption and conformation at interfaces is likely to increase dramatically.Simultaneously, scanning probe microscopy will continue to serve as an excellentexperimental method for the measurement of interparticle forces. The number ofceramic surfaces that can be used in force measurements will certainly be extended inthe future.

63
8. References
1) Pugh, R. J. "Dispersion and Stability of Ceramic Powders in Liquids" in Surfaceand Colloid Chemistry in Advanced Ceramics Processing, edited by Pugh, R. J.and Bergström, L.; surfactant science series, Vol. 51; Marcel Dekker: New York,(1994); pp 127-192.
2) Cleveland, J. P.; Manne, S.; Bocek, D.; Hansma, P. K. "A non-destructivemethod for determining the spring constant of cantilevers for scanning forcemicroscopy"; Rev. Sci. Instrum, (1993), 64, 403-405.
3) Lyklema, J. Fundamentals of Interface and Colloid Science; Academic Press:London, (1995); Vol. II.
4) Hunter, R. J. "Review - Recent developments in the electroacousticcharacterisation of colloidal suspensions and emulsions"; Colloid Surf. A, (1998),141, 37-65.
5) Löbbus, M.; Sonnfeld, J.; van Leeuwen, H. P.; Vogelsberger, W.; Lyklema, J."An Improved Method for Calculating Zeta-Potentials from Measurements of theElectrokinetic Sonic Amplitude"; J. Colloid Interface Sci., (2000), 229, 174-183.
6) Johnson, S. B.; Russell, A. S.; Scales, P. J. "Volume Fraction Effects in ShearRheology and Electroacoustic Studies of Concentrated Alumina and KaolinSuspensions"; Colloid Surf. A, (1998), 141, 119-130.
7) Larson, R. G. The Structure and Rheology of Complex Fluids; Oxford UniversityPress: New York, (1999).
8) Yamada, T. "Preparation and Evaluation of Sinterable Silicon Nitride Powder byImide Decomposition Method"; Am. Ceram. Soc. Bull., (1993), 72, 99-106.
9) Bergström, L.; Bostedt, E. "Surface Chemistry of Silicon Nitride Powders:Electrokinetic Behaviour and ESCA Studies"; Colloid Surf., (1990), 49, 183-197.
10) Bergström, L.; Pugh, R. J. "Interfacial Characterization of Silicon NitridePowders"; J. Am. Ceram. Soc., (1989), 72, 103-109.
11) Horn, D. "Polyethylenimine - Physicochemical Properties and Applications"; inPolymeric Amines and Ammonium Salts edited by Goethals, E. J.; PergamonPress: Oxford, (1979), pp 333-355.
12) Dick, C. R.; Ham, G. E. "Characterization of Polyethylenimine"; J. Macromol.Sci.-Chem., (1970), A 4, 1301-1314.
13) Sonnefeld, J. "Determination of surface charge density parameters of siliconnitride"; Colloid Surf. A, (1996), 108, 27-31.
14) Zhmud, B. V.; Meurk, A.; Bergström, L. "Evaluation of Surface IonizationParameters from AFM Data"; J. Colloid Interface Sci., (1998), 207, 332-343.
15) Peuckert, M.; Greil, P. "Oxygen distribution in silicon nitride powders"; J.Mater. Sci., (1987), 22, 3717-3720.
16) Stadelmann, H.; Petzow, G.; Greil, P. "Effects of Surface Purification on theProperties of aqueous Silicon Nitride Suspensions"; J. Eur. Ceram. Soc., (1989),5, 155-163.
17) Bergström, L.; Ernstsson, M.; Gruvin, B.; Brage, R.; Nyberg, B.; Carlström,E. "The Effect of Wet and Dry Milling on the Surface Properties of SiliconNitride Powders" in Ceramics Today - Tomorrow's Ceramics, edited byVincenzini, P.; Elsevier Science Publishers B.V.: Amsterdam, (1991), pp. 1005-1014.
18) Greil, P.; Nitzsche, R.; Friedrich, H.; Hermel, W. "Evaluation of OxygenContent on Silicon Nitride Powder Surface from the Measurement of theIsoelectric Point"; J. Eur. Ceram. Soc., (1991), 7, 353-359.

64
19) Lange, H.; Wötting, G.; Winter, G. "Silicon Nitride - From Powder Synthesis toCeramic Materials"; Angew. Chem. Int. Edition , (1991), 30, 1579-1597.
20) Natansohn, S.; Pasto, A. E.; Rourke, W. J. "Effect of Powder SurfaceModifications on the Properties of Silicon Nitride Ceramics"; J. Am. Ceram. Soc.,(1993), 76, 2273-2284.
21) Hackley, V. A.; Wang, P. S.; Malghan, S. G. "Effects of soxhlet extraction onthe surface oxide layer of silicon nitride powders"; Mater. Chem. Phys., (1993),36, 112-118.
22) Dressler, W.; Riedel, R. "Progress in Silicon-Based Non-Oxide StructuralCeramics"; Int. J. Refract. Hard Mater., (1997), 15, 13-47.
23) Laarz, E.; Lenninger, G.; Bergström, L. "Aqueous Silicon Nitride Suspensions:Effect of Surface Treatment on the Rheological and Electrokinetic Properties";Key Eng. Mater., (1997), 132-136, 285-288.
24) Raider, S. I.; Flitsch, R.; Aboof, J. A.; Plisken, W. A. "Surface Oxidation ofSilicon Nitride Films"; J. Electrochem. Soc., (1976), 123, 560-565.
25) Iler, R. K. The Surface Chemistry of Silica; John Wiley & Sons: New York,(1979).
26) Zhmud, B. V.; Bergström, L. "Dissolution Kinetics of Silicon Nitride inAqueous Suspension"; J. Colloid Interface Sci., (1999), 218, 582-584.
27) Segall, R. L.; Smart, R. S. C.; Turner, P. S. "Oxide Surfaces in Solution" inSurface and Near-Surface Chemistry of Oxide Materials edited by Nowotny, J.and Dufour, L.-C.; Elsevier Science Publishers B. V.: Amsterdam, (1988), pp527-576.
28) Richerson, D. W. Modern Ceramic Engineering; 2 ed.; Marcel Dekker: NewYork, (1992).
29) Xiao, Y.; Lasaga, A. C. "Ab initio quantum mechanical studies of the kineticsand mechanisms of quartz dissolution: OH-catalysis"; Geochim. Cosmochim.Acta, (1996), 60, 2283-2295.
30) Xiao, Y.; Lasaga, A. C. "Ab initio quantum mechanical studies of the kineticsand mechanisms of silicate dissolution: H+(H3O
+) catalysis"; Geochim.Cosmochim. Acta, (1994), 58, 5379-5400.
31) Kubicki, J. D.; Xiao, Y.; Lasaga, A. C. "Theoretical reaction pathways for theformation of [Si(OH)5]1- and the deprotonation of orthosilicic acid in basicsolution"; Geochim. Cosmochim. Acta, (1993), 57, 3847-3853.
32) Vogelsberger, W.; Löbbus, M.; Sonnefeld, J.; Seidel, A. "The influence of ionicstrength on the dissolution process of silica"; Colloid Surf. A, (1999), 159, 311-319.
33) Foissy, A.; Persello, J. "Surface Group Ionization on Silicas" in The SurfaceProperties of Silica; edited by Legrand, A. P., Ed.; John Wiley & Sons:Chichester, (1998).
34) de Leeuw, N. H.; Higgins, F. M.; Parker, S. C. "Modeling the Surface Structureand Stability of α-Quartz"; J. Phys. Chem. B, (1999), 103, 1270-1277.
35) Deleuze, M.; Goiffon, A.; Ibanez, A.; Philippot, E. "Solvent Influence onKinetics and Dissolution Mechanism of Quartz in Concentrated Basic Media(NaOH, KOH, LiOH)"; J. Solid State Chem., (1995), 118, 254-260.
36) Cheong, J. S.; Mukundhan, P.; Du, H. H. "Improved Oxidation Resistance ofSilicon Nitride by Aluminium Implantation: I, Kinetics and OxideCharacteristics"; J. Am. Ceram. Soc., (2000), 83, 154-160.

65
37) Cheong, J. S.; Mukundhan, P.; Du, H. H. "Improved Oxidation Resistance ofSilicon Nitride by Aluminium Implantation: II, Analysis and Optimization"; J.Am. Ceram. Soc., (2000), 83, 161-165.
38) Andersson, K. M.; Bergström, L. "Oxidation and Dissolution of TungstenCarbide Powder in Water"; Int. J. Refrac. Metal Hard Mater., (2000), 18, 35-43.
39) Sandling, S. Dissolution and Corrosion Inhibition of Cobalt in Aqueous Medium;Diploma Work, Uppsala University: Stockholm, (1999).
40) Ardizzone, S.; Spinolo, G.; Trasatti, S. "The Point of Zero Charge of Co3O4
Prepared by Thermal-decomposition of Basic Cobalt Carbonate"; Electrochim.Acta, (1995), 40, 2683-2686.
41) Cesarano III, J.; Aksay, I. A. "Processing of Highly Concentrated Aqueous α-Alumina Suspensions Stabilized with Polyelectrolytes"; J. Am. Ceram. Soc.,(1988), 71, 1062-67.
42) Bergström, L. "Rheological properties of Al2O3-SiC whisker compositesuspensions"; J. Mater. Sci., (1996), 31, 5257-5270.
43) Santhiya, D.; Nandini, G.; Subramanian, S.; Natarajan, K. A.; Malghan, S.G. "Effect of polymer molecular weight on the adsorption of polyacrylic acid atthe alumina-water interface"; Colloid Surf. A, (1998), 133, 157-163.
44) Wäsche, R.; Steinborn, G. "Influence of the Dispersants in Gelcasting ofNanosized TiN"; J. Eur. Ceram. Soc., (1997), 17, 421-426.
45) Wäsche, R.; Steinborn, G.; Baader, F. "Elektrokinetische Messungen zurCharakterisierung wässriger nanodisperser TiN-suspensionen"; Fortschrittsber.DKG, (1995), 151-158.
46) Nass, R.; Albayrak, S.; Aslan, M.; Schmidt, H. "Colloidal Processing andSintering of nano-scale TiN" in Ceramic Transactions, Vol. 51; edited byHausner, H., Messing, G. L. and Hirano, S.-I., The American Ceramic Society,Westerville, (1995).
47) Shih, C.-J.; Hon, M.-H. "Electrokinetic and Rheological Properties of AqueousTiN Suspensions with Ammonium Salt of Poly(methacrylic Acid)"; J. Eur.Ceram. Soc., (1999), 19, 2773-2780.
48) Yeh, C.-H.; Hon, M.-H. "Dispersion and Stabilization of Aqueous TiCSuspensions"; Ceram. Int., (1995), 21, 65-68.
49) Dupont, L.; Foissy, A. "Evaluation of the Adsorption Trends of a LowMolecular-Weight Polyelectrolyte with a Site-Binding Model"; Colloid Surf. A,(1996), 110, 235-248.
50) Arnison, B. J.; Segall, R. L.; Smart, R. S. C.; Turner, P. S. "SemiconductingOxides: Effects of Solid and Solution Properties on Dissolution Kinetics ofCobaltous Oxide"; J. Chem. Soc. Faraday Trans. I, (1981), 77, 535-545.
51) Ganor, J.; Mogollón, J. L.; Lasaga, A. C. "Kinetics of gibbsite dissolution underlow ionic strength conditions"; Geochim. Cosmochim. Acta, (1999), 63, 1635-1651.
52) Kallay, N.; Biscan, J.; Smolic, T.; Zalac, S.; Krajnovic, M. "PotentiometricDetermination of Reaction Enthalpies at Silicon Nitride/Water Interface"; PolishJ. Chem., (1997), 71, 594-602.
53) Biscan, J.; Kallay, N.; Smolic, T. "Determination of iso-electric point of siliconnitride by adhesion method"; Colloid Surf. A, (2000), 165, 115-123.
54) Lange, F. F. "Powder Processing Science and Technology for IncreasedReliability"; J. Am. Ceram. Soc., (1989), 72, 3-15.

66
55) Carlström, E. "Surface and Colloid Chemistry in Ceramics: An overview" inSurface and Colloid Chemistry in Advanced Ceramics Processing, edited byPugh, R. J. and Bergström, L.; surfactant science series, Vol. 51; Marcel Dekker:New York, (1994); Vol. 51, pp 1-28.
56) Desset, S.; Spalla, O.; Cabane, B. "Redispersion of Alumina Particles in Water";Langmuir; in press.
57) Sharma, M. M. "Factors controlling the hydrodynamic detachment of particlesfrom surfaces"; J. Colloid Interface Sci., (1992), 149, 121-134.
58) Bergström, L. "Hamaker constants of inorganic materials"; Advances in Colloidand Interface Science, (1997), 70, 125-169.
59) Kwon, S.; Messing, G. L. "The Effect of Particle Solubility on the Strength ofNanocrystalline Agglomerates: Boehmite"; NanoStruct. Mater., (1997), 8, 399-418.
60) Maskara, A.; Smith, D. M. "Agglomeration during the Drying of Fine SilicaPowders, Part II: The Role of Particle Solubility"; J. Am. Ceram. Soc., (1997), 80,1715-1722.
61) Chu, S.-M. The dispersion of silicon nitride in aqueous media; M.Sc. thesis,MIT, (1990).
62) Rahaman, M. N.; Boiteaux, Y.; de Jonghe, L. C. "Surface Characterization ofSilicon Nitride and Silicon Carbide Powders"; Am. Ceram. Soc. Bull., (1986), 65,1171-1176.
63) Wang, P. S.; Hsu, S. M.; Malghan, S. E.; Wittberg, T. N. ; J. Mater. Sci.,(1991), 26, 3249-3952.
64) Chan, D. Y. C.; Pashley, R. M.; White, L. R. "A simple algorithm for thecalculation of the electrostatic repulsion between identical charged surfaces inelectrolyte"; J. Colloid Interface Sci., (1980), 77, 283-285.
65) Hackley, V. A. "Colloidal Processing of Silicon Nitride with Poly(acrylic acid): I,Adsorption and Electrostatic Interactions"; J. Am. Ceram. Soc., (1997), 80, 2315-2325.
66) Walczak, W. J.; Hoagland, D. A.; Hsu, S. L. "Spectroscopic Evaluation ofModels for Polyelectrolyte Chain Conformation in Dilute Solution";Macromolecules, (1996), 29, 7514-7520.
67) Cohen Stuart, M. A.; Hoogendam, C. W.; de Keizer, A. "Kinetics ofpolyelectrolyte adsorption"; J. Phys.: Condens. Matter, (1997), 9, 7767-7783.
68) de Laat, A. W. M.; van den Heuvel, G. L. T. "Molecular weight fractionation inthe adsorption of polyacrylic acid salts onto BaTiO3"; Colloid Surf. A, (1995), 98,53-59.
69) de Laat, A. W. M.; van den Heuvel, G. L. T.; Böhmer, M. R. "Kinetic aspectsin the adsorption of polyacrylic acid salts onto BaTiO3"; Colloid Surf. A, (1995),98, 61-71.
70) Foissy, A.; El Attar, A.; Lamarche, J. M. "Adsorption of Polyacrylic Acid onTitanium Dioxide"; J. Colloid Interface Sci., (1983), 96, 275-287.
71) Lee, G. U.; Chrisey, L. A.; Colton, R. J. "Direct measurement of the forcesbetween complementary strands of DNA"; Science, (1994), 266, 771-773.
72) Palmqvist, L. M.; Lange, F. F.; Sigmund, W.; Sindel, J. "Dispersion andConsolidation of Alumina Using a Bis-Hydrophylic Diblock Copolymer"; J. Am.Ceram. Soc., (2000), 83, 1585-1591.
73) Li, H.; Liu, B.; Zhang, X.; Gao, C.; Shen, J.; Zou, G. "Single-Molecule ForceSpectroscopy on Poly(acrylic acid) by AFM"; Langmuir, (1999), 15, 2559-2565.

67
74) Butt, H.-J.; Kappl, M.; Mueller, H.; Raiteri, R. "Steric Forces Measured withthe Atomic Force Microscope at Various Temperatures"; Langmuir, (1999), 15,2559-2565.
75) Guldberg Pedersen, H.; Bergström, L. "Forces Measured between ZirconiaSurfaces in Poly(acrylic acid) Solutions"; J. Am. Ceram. Soc., (1998), 82, 1137-1145.
76) Hoogeveen, N. G.; Cohen Stuart, M. A.; Fleer, G. J. "PolyelectrolyteAdsorption on Oxides I. Kinetics and Adsorbed Amounts"; J. Colloid InterfaceSci., (1996), 182, 133-145.
77) Guldberg-Pedersen, H.; Bergström, L. "Stabilizing ceramic suspensions usinganionic polyelectrolytes: adsorption kinetics and interparticle forces"; ActaMateriala, (2000), in press.
78) Wang, J.; Gao, L.; Sun, J.; Li, Q. "Surface Characterization of NH4PAA-Stabilized Zirconia Suspensions"; J. Colloid Interface Sci., (1999), 213, 552-556.
79) Pettersson, A.; Marino, G.; Pursiheimo, A.; Rosenholm, J. B. "ElectrostericStabilization of Al2O3, ZrO2, and 3Y-ZrO2 Suspensions: Effect of Dissociationand Type of Polyelectrolyte"; J. Colloid Interface Sci., (2000), 228, 73-81.
80) Persin, M.; Randon, J.; Sarrazin, J.; Larbot, A.; Guizard, C.; Cot, L."Influence of Membrane-Solution Interface on the Performance of ZirconiaUltrafiltration Membrane"; J. Colloid Interface Sci., (1992), 154, 416-422.
81) Ponomarev, A. L.; Sewell, T. D.; Durning, C. J. "Adsorption of Isolated,Flexible Polymers onto a Strongly Attractive Surface"; Macromolecules, (2000),33, 2662-2669.
82) Cosgrove, T.; Prestidge, C. A.; King, S. M.; Vincent, B. "Fourier TransformInfrared Spectroscopy and Monte Carlo Studies on the Dynamics of Physisorbingand Chemisorbing Polymers"; Langmuir, (1992), 8, 2206-2209.
83) King, S. M.; Cosgrove, T. "A Dynamical Monte Carlo Model of PolymerAdsorption"; Macromolecules, (1993), 26, 5414-5422.
84) Dobson, K. D.; McQuillan, A. J. "In situ infrared spectroscopic analysis of theadsorption of aliphatic carboxylic acids to TiO2, ZrO2, Al2O3, and Ta2O3 fromaqueous solution"; Spectrochim. Acta Part A, (1999), 55, 1395-1405.
85) Dobson, K. D.; McQuillan, A. J. "In situ infrared spectroscopic analysis of theadsorption of aromatic carboxylic acids to TiO2, ZrO2, Al2O3, and Ta2O3 fromaqueous solution"; Spectrochim. Acta Part A, (2000), 56, 557-565.
86) Pokrovski, G. S.; Schott, J. "Experimental study of the complexation of siliconand germanium with aqueous organic species: Implications for germanium andsilicon transport and Ge/Si ratio in natural waters"; Geochim. Cosmochim. Acta,(2000), 62, 3413-3428.
87) Pokrovski, G. S.; Martin, F.; Hazemann, J.-L.; Schott, J. "An X-ray absorptionfine structure spectroscopy study of germanium-organic ligand complexes inaqueous solution"; Chem. Geology, (2000), 163, 151-165.
88) Öhman, L.-O.; Nordin, A.; Sedeh, I. F.; Sjöberg, S. "Equilibrium and StructuralStudies of Silicon (IV) and Aluminium (III) in Aqueous Solution. 28. Formationof Soluble Silicic Acid-Ligand Complexes as Studied by Potentiometric andsolubility Measurements"; Acta Chem. Scand., (1991), 45, 335-341.
89) Mathur, S.; Moudgil, B. M. "Adsorption Mechanism(s) of Poly(Ethylene Oxide)on Oxide Surfaces"; J. Colloid Interface Sci., (1997), 196, 92-98.
68
90) Eremenko, B. V.; Malysheva, M. L.; Bezuglaya, T. N.; Savitskaya, A. N."Stability of Silicon Nitride Suspensions: 2. Adsorption of Poly(ethylene oxide)and Its Effect on the Stability of Aqueous Suspensions"; Colloid Journal, (1997),59, 38-46.
91) Gourmand, M. ; Ph.D. thesis, L'Universite Paris IV: Paris, (1998).92) Poptoshev, E.; Rutland, M. W.; Claesson, P. M. "Surface Forces in Aqueous
Polyvinylamine Solutions. I. Glass Surfaces"; Langmuir, (1999), 15, 7789-7794.93) Park, I. H.; Choi, E.-J. "Characterization of branched polyethyleneimine by laser
light scattering"; Polymer, (1996), 37, 313-319.94) Pfau, A.; Schrepp, W.; Horn, D. "Detection of a Single Molecule Adsorption
Structure of Poly(ethylenimine) Macromolecules by AFM"; Langmuir, (1999),15, 3219-3225.
95) Hostetler, R. E.; Swanson, J. W. "Diffusion into and Adsorption ofPolyethylenimine on Porous Silica Gel"; J. Polymer. Sci., (1974), 12, 29-43.
96) Radeva, T.; Petkanchin, I. "Electric Properties and Conformation ofPolyethyleneimine at the Hematite-Aqueous Solution Interface"; J. ColloidInterface Sci., (1997), 196, 87-91.
97) Vermöhlen, K.; Lewandowski, H.; Narres, H.-D.; Koglin, E. "Adsorption ofpolyacrylic acid on aluminium oxide: DRIFT spectroscopy and ab initiocalculations"; Colloid Surf. A, (2000), 170, 181-189.
98) Awatani, T.; Dobson, K. D.; McQuillan, A. J.; Ohtani, B.; Uosaki, K. "In situinfrared spectroscopic studies of adsorption of lactic acid and related compoundson the TiO2 and CdS semiconductor photocatalyst surfaces from aqueoussolution"; Chem. Lett., (1998), 8, 849-850.

Acknowledgements
�Coffee�Johan, who knows what would have happened if we hadn�t stopped for that decisivecoffee break in a cafe in Potsdam ........ (Sorry, still don�t like it black). Thank you forall the help and your incredible enthusiasm!
�Luck is not a factor�Producing results for a Ph.D. thesis requires just a decent amount of hard work and, inthe best case, some intuition, one might guess. Well, that�s only part of the truth. I hadthe luck to meet a lot of fascinating people during the four and a half years inStockholm and, even better, many of them have been my collegues at YKI. I would liketo thank all the people at YKI for creating a very enjoyable atmosphere, essential forachieving results in a reasonable time. It was your help and cooperative attitude thatmade everything possible!
�How reproducible is this?�The constellation of great scientists I worked with at YKI, is certainly not reproducible.Thanks to these individuals I learned a lot of things that I don�t want to miss (e.g.colloid science, how to eat noodle-soup with chop sticks, how to sleep after anearthquake, etc). Lennart, your advice and support has been extremely important for mywork. In 8 words: I couldn�t think of a better supervisor! Anders, without you I wouldhave been lost both in the desert and �between two semi-infinite surfaces� (to mentiononly a few things)! Joe, thanks for pushing �up-hill�, not only at Kebnekaise! Evgeni,Hendrik, Brian, Orlando, Peter, Boris, Goran, Locke-I wish there had been more timefor �cross-talk�; I don�t know what was more impressive, your knowledge or your senseof humor! (Evgeni, if that�s the symptoms of �bulgaria�, where do I get the virus?).Brian, thank you also for reducing the �size and amount of defects� in my thesis!
�Cross the sea�Norman, Dries, Rauni, Rodrigo � I think we reached further than just Grinda or bird-shitisland. Together we made it to the United States, Holland, Finland, Chile, Germany andthis magic place known as Skarpö! What�s next?
�Hide and seek�Andzelika, and Eva � thank you for many small but important things in �lab-life�, i.e. ahelping hand, a good joke, a smile on a rainy day, and stirrer bars!
�3M�Mats, Mats, and Mats at SU�I definitely enjoyed working together with you. 100% fun!
�The real world�Olof, Mattias, Anders, Erik, Bo and Rolf are thanked for good collaboration andsupport!
�Är du dum eller?�Rainer, Kati, Julia, Kay, Monica, Bruno, Georg, Fredrik, Maria, Xavier, Nathalie, Olli.Thanx for all the stupid, dangerous, illegal and unhealthy moments in Sweden!
�Finally�Marie and Pär are thanked for moral and technical support during the last hectic weeks(or was it months?).