colloidal nanoparticle size control: experimental and
TRANSCRIPT

1
Colloidal Nanoparticle Size Control: Experimental and Kinetic
Modeling Investigation of the Ligand-Metal Binding Role in
Controlling the Nucleation and Growth Kinetics
Saeed Mozaffari,a,# Wenhui Li,a,# Coogan Thompson,a Sergei Ivanov,b Soenke Seifert,c Byeongdu
Lee, d Libor Kovarik,e and Ayman M. Karima,*
a Virginia Polytechnic Institute and State University, Blacksburg, VA 24060, United States
b Center for Integrated Nanotechnologies, Los Alamos National Laboratory, Los Alamos, NM 87545, United States
c Advanced Photon Source, Argonne National Laboratory, Argonne, IL 60439, United States
d X-ray Science Division, Argonne National Laboratory, Argonne, IL 60439, United States
e Environmental Molecular Science Laboratory, Pacific Northwest National Laboratory, P.O. Box 999, Richland,
Washington 99352, United States
# equal contribution
* Corresponding author, [email protected]
Palladium (II) Acetate Recrystallization. 0.75 g palladium acetate (Pd(OAc)2) was dissolved in 40 mL anhydrous
acetic acid under stirring in a flask. After palladium acetate could not dissolve further, the solution temperature was
increased to 100 ℃ until all the palladium acetate was dissolved. Then the solution was quickly filtered. The filtrate
was transferred into glass vials, and cooled down slowly to room temperature overnight in a water bath. After the
palladium acetate crystal formed, we separated the solution from the crystal. Washed the crystal with small amount
of hexane to remove the acid residual, and dried the crystal through nitrogen flow overnight. The crystal product was
stored in the nitrogen glovebox for further use.
Trioctylphosphine (TOP) Distillation. The trioctylphosphine was distilled under nitrogen atmosphere under low
vacuum. The distillate above 192 ℃ was collected, and stored in the glovebox.
Ex-situ Small-angle X-ray Scattering (SAXS) Experiments. Ex-situ SAXS measurements were performed on
Bruker N8 Horizon equipped with Cu (Kα radiation, λ = 1.54 Å) source, 2D VÅNTEC-500TM detector and SCATEXTM
scatter-free pinholes. The colloidal nanoparticle solution samples were loaded in sealed quartz capillaries (d = 1.5 mm
or 2.0 mm). For absolute scale calibration, water was used as the standard liquid. All the measurements were taken in
vacuum (2 mbar) at room temperature. Data processing and analysis were performed using Bruker SAXS software.
The spectra were fitted using Schultz size distribution model.
Electronic Supplementary Material (ESI) for Nanoscale.This journal is © The Royal Society of Chemistry 2017

2
TEM Results.
Figure S1. TEM images of Pd nanoparticles in (a) toluene and (b) pyridine. The average particle sizes in toluene and
pyridine were 1.8±0.4 and 4.3±0.5 nm, respectively. Reaction conditions: 10 mM Pd(OAc)2 in 50:50 solvent:hexanol,
trioctylphosphine:Pd = 2:1, T = 100 °C.
SAXS Spectra.
Figure S2. a) Original SAXS data after absolute scaling and Schultz polydisperse spherical model fitting at different
reaction times; b) The temporal evolution of the number of particles and their average size in pyridine. Reaction
conditions: 10 mM Pd(OAc)2 in 50:50 pyridine:hexanol, trioctylphosphine:Pd = 2:1, T = 100 °C.

3
Figure S3. Polydispersity as a function of time. Reaction conditions: 10 mM Pd(OAc)2 in 50:50 solvent:hexanol,
trioctylphosphine:Pd = 2:1, T = 100 °C.
Damköhler Number (Da). The ratio of reaction rate to the diffusion rate, Da, can be estimated as
2[ ]
Da ( )growth
AB
k Ar
D
.1 ABD is the diffusion coefficient of Pd(II) complex in toluene or pyridine solutions that can
be calculated using Stokes-Einstein equation2 (6
BAB
eff
k TD
R , where kB, T, Reff and are the Boltzmann constant,
the absolute temperature, the effective radius of the diffusing molecule (in our case Pd(II) complex binding with TOP),
and the solvent viscosity, respectively), [A] is the concentration of Pd(II) that will be reduced on the nanoparticle
surface, growthk is the growth rate constant, and r is the radius of the growing particle. The Da for the nanoparticles
having a radius of 1 nm was ~10-8 which indicates that the growth is not diffusion limited.
Extracting nucleation and growth rates from the model and in-situ experimental data. From the kinetic model,
the nucleation and Growth/Nucleation rates can be calculated as follows
1Nucleation rate
nuc
A
k AN
m
(#nuclei/lit.s) (1A)
1Nucleation rate nuck A (mol/lit.s) (1P)
2Growth rate growthk A B (mol/lit.s) (2P)
2 2
1 1
model
Growth ( )
Nucleation
growth growth
nuc nuc
k A B k B
k A k
(unitless) (2A)

4
Specifically, the nucleation rate calculated in equation (1A) is the number of nuclei per unit volume per unit time
(#nuclei/lit.s). However, to compare the rates of growth and nucleation, it is required that both have the same units
(i.e. mol/lit.s). Therefore, the nucleation rate used in equation (1P) does not include m or avogadro’s number so the
units become mol/lit.s.
Using the experimentally measured number of particles ( expPN ), the nucleation rate at a short time interval ( t )
can be estimated through:
expNucleation rate (exp)=
PN
t
(3A)
By estimating the rate of nucleation, the growth rate can be extracted from the slope of total number of atoms in all
formed nanoparticles (Үexp). Үexp includes the total number of Pd atoms that contribute to form nuclei and assist with
the particle growth (both nucleation and growth events). Therefore,
exp expGrowth rate (exp)= ( )
P
A
Y N m
t t N
(4A)
The dimensionless Growth/Nucleation rate can be written as follows:
exp exp exp
expexp exp
( )Growth
( ) = 1Nucleation
( ) ( )
P
A
P P
A A
Y N m Y
t t N t
N Nm m
t N t N
(5A)
The number of particles per liter of solution Np can be determined through the integration of the nucleation rate
(equation 1A) and considering the number of atoms per nucleus (m) as shown below:
1
0
d
f
nuc Ap
tk A N
N tm
(6A)
The smallest measured nanoparticle size using SAXS at the early stage of the reaction was about 0.6±0.3 nm.
Therefore, in the absence of other information on the size of the nucleus, we assumed that the nucleus consists of 4
atoms. There have been a wide range of reported values for atoms/nucleus for different metals including 4 (Pt)3, 6
(Ir)4, 9 (Au)5, 10 (Au)6.
For Pt, Pd and other fcc metals, to form the 1st shell it needs 13 atoms in total7, which is 0.8 nm. For a nucleus, it is
possible that the nucleus consists of fewer atoms than a full first shell.
Estimation of nucleation and growth rate constants from the in-situ experimental data. As discussed above the
nucleation and growth rates can be estimated from the experiment. Therefore, the nucleation rate at the early stage is
used to estimate the nucleation rate constant as shown below:
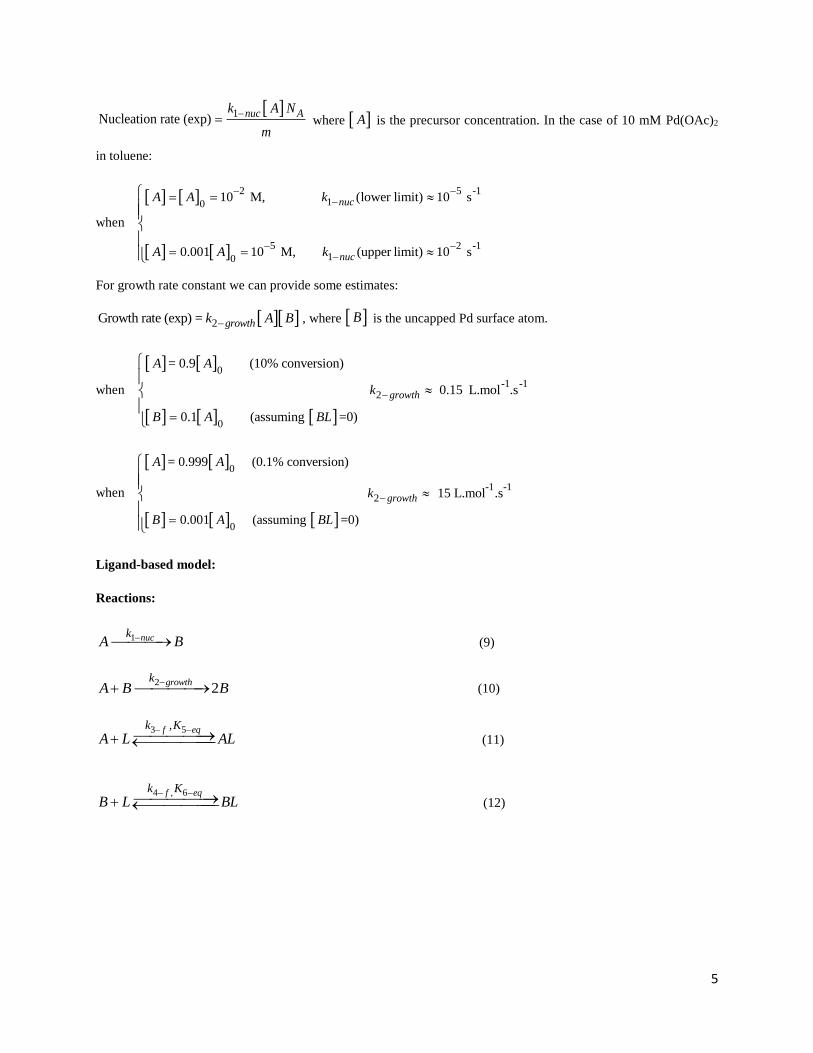
5
1Nucleation rate (exp)
nuc Ak A N
m
where A is the precursor concentration. In the case of 10 mM Pd(OAc)2
in toluene:
when
2 5 -110
5 2 -110
10 M, (lower limit) 10 s
0.001 10 M, (upper limit) 10 s
nuc
nuc
A A k
A A k
For growth rate constant we can provide some estimates:
2Growth rate (exp) = growthk A B , where B is the uncapped Pd surface atom.
when
0
-1 -12
0
= 0.9 (10% conversion)
0.15 L.mol .s
0.1 (assuming =0)
growth
A A
k
B A BL
when
0
-1 -12
0
= 0.999 (0.1% conversion)
15 L.mol .s
0.001 (assuming =0)
growth
A A
k
B A BL
Ligand-based model:
Reactions:
1 nuckA B (9)
22
growthkA B B
(10)
3 5,
f eqk K
A L AL
(11)
4 , 6f eqk K
B L BL
(12)
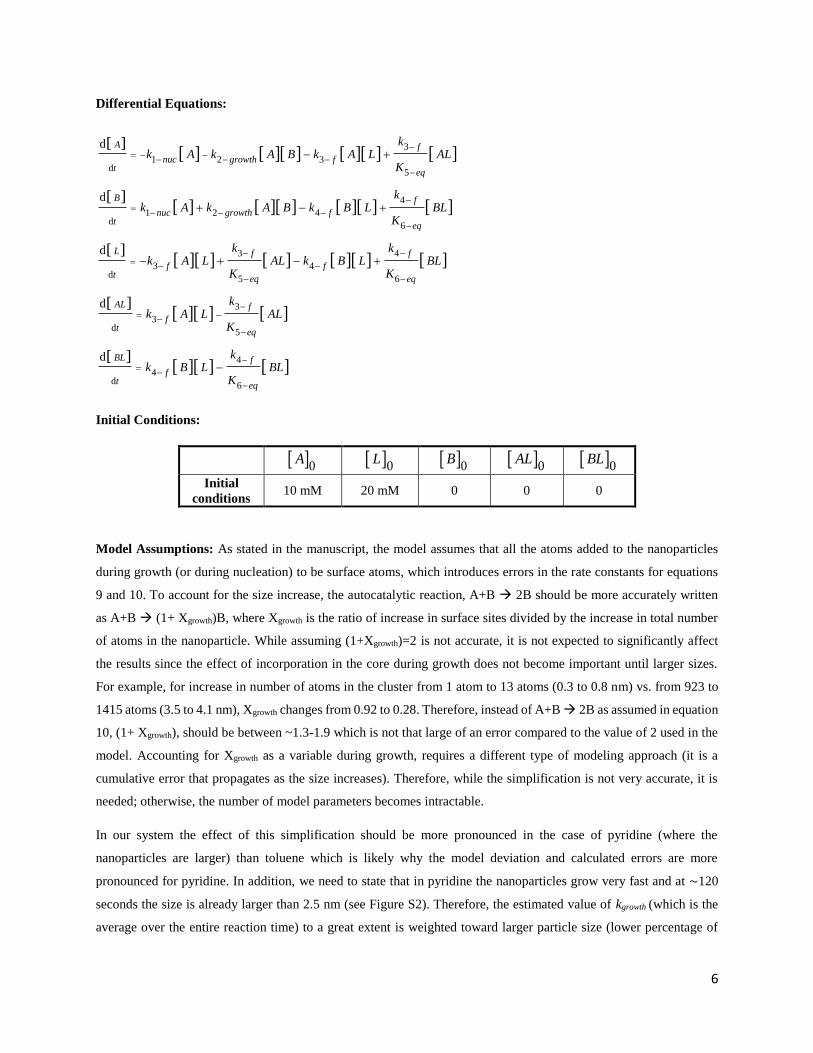
6
Differential Equations:
3
1 2 3d 5
4
1 2 4d 6
3 4
3 4d 5 6
3
3d 5
4
4d 6
d
d
d
d
d
A f
nuc growth ft eq
B f
nuc growth ft eq
L f f
f ft eq eq
AL f
ft eq
BL f
ft eq
kk A k A B k A L AL
K
kk A k A B k B L BL
K
k kk A L AL k B L BL
K K
kk A L AL
K
kk B L BL
K
Initial Conditions:
0A 0L 0B 0AL 0BL
Initial
conditions 10 mM 20 mM 0 0 0
Model Assumptions: As stated in the manuscript, the model assumes that all the atoms added to the nanoparticles
during growth (or during nucleation) to be surface atoms, which introduces errors in the rate constants for equations
9 and 10. To account for the size increase, the autocatalytic reaction, A+B 2B should be more accurately written
as A+B (1+ Xgrowth)B, where Xgrowth is the ratio of increase in surface sites divided by the increase in total number
of atoms in the nanoparticle. While assuming (1+Xgrowth)=2 is not accurate, it is not expected to significantly affect
the results since the effect of incorporation in the core during growth does not become important until larger sizes.
For example, for increase in number of atoms in the cluster from 1 atom to 13 atoms (0.3 to 0.8 nm) vs. from 923 to
1415 atoms (3.5 to 4.1 nm), Xgrowth changes from 0.92 to 0.28. Therefore, instead of A+B 2B as assumed in equation
10, (1+ Xgrowth), should be between ~1.3-1.9 which is not that large of an error compared to the value of 2 used in the
model. Accounting for Xgrowth as a variable during growth, requires a different type of modeling approach (it is a
cumulative error that propagates as the size increases). Therefore, while the simplification is not very accurate, it is
needed; otherwise, the number of model parameters becomes intractable.
In our system the effect of this simplification should be more pronounced in the case of pyridine (where the
nanoparticles are larger) than toluene which is likely why the model deviation and calculated errors are more
pronounced for pyridine. In addition, we need to state that in pyridine the nanoparticles grow very fast and at ~120
seconds the size is already larger than 2.5 nm (see Figure S2). Therefore, the estimated value of kgrowth (which is the
average over the entire reaction time) to a great extent is weighted toward larger particle size (lower percentage of

7
surface sites) where (1+ Xgrowth) is between 1.3 and 1.5. Therefore, this assumption cannot have a significant effect on
our modeling results but will affect the absolute value of kgrowth, which should be larger to account for the lower Xgrowth.
Extended ligand-based model. We considered other possible reactions that can occur during the formation of Pd
nanoparticles. We expanded the ligand-based model by adding the following reactions: nucleation through ligand-
precursor complex ( AL ), reversible reaction of ligand with the AL 2i.e. AL , and autocatalytic surface growth
through reduction of AL on the particle surface. The reactions in model system are shown below:
Extended ligand-based model:
Reactions:
1 nuckA B (a)
2
nuc capkAL BL
(b)
83 ,
eqf Kk
ALA L
(c)
94 ,
2 eqf Kk
ALAL L
(d)
105 ,
eqf Kk
B L BL
(e)
62
growthkA B B
(f)
7
growth capkAL B B BL
(g)

8
Differential Equations:
2
3
1 6 3d 8
5
1 6 5d 10
3 4 5
3 4 5d 8 9 10
3
2 3 4d 8
d
d
d
d
A f
nuc growth ft eq
B f
nuc growth ft eq
L f f f
f f ft eq eq eq
AL f
nuc cap f ft eq
kk A k A B k A L AL
K
kk A k A B k B L BL
K
k k kk A L AL k AL L AL k B L BL
K K K
kk AL k A L AL k AL L
K
2
2
2
4
7
9
4
4d 9
5
2 5 7d 10
d
d
f
growth cap
eq
AL f
ft eq
BL f
nuc cap f growth capt eq
kAL k AL B
K
kk AL L AL
K
kk AL k B L BL k AL B
K
Initial Conditions:
0A 0L 0B 0AL 2 0AL 0BL
Initial
conditions 10 mM 20 mM 0 0 0 0
We should note that more than one TOP can bind to the Pd(OAc)2 precursor which is considered in the extended
ligand-based model. However, thermodynamic studies conducted for PdCl2 (and likely other Pd complexes such as
Pd(OAc)2) demonstrated that the equilibrium binding constant for the second TOP binding2
2 )( eq
K
ALAL L
is around two orders of magnitude lower than for the first binding1
)( eq
K
ALA L
.8 This experimental report8
was also in good agreement with our modeling result. Therefore, it is reasonable to account only for the first TOP
binding in the kinetic model.
Estimation of Model Parameters. The forward reaction rate constants (kf) and equilibrium constants (Keq, reverse
rate constants were constrained by thermodynamics, i.e. r
f
eq
k
Kk ) were estimated by simultaneously minimizing
the sum of normalized squared errors between the model and experiments for Np (number of particles) and Ү (total
number of atoms in all formed nanoparticles) in Matlab (using fminsearch). The sum of normalized squared errors, J,
is expressed as:

9
2 2
exp model -exp -model
exp -exp1 1
- -min
P P
Pi i
Y Y N N
Y NJ
(7A)
where is the number of data points. To calculate J without bias based on the number of points collected at early
versus later reaction times, the data points were selected to yield an even distribution along both the x-axis (time) and
y-axis (Np or Ү). Also, due to the non-linearity of kinetic models, there might not be a unique set of parameters.9
Therefore, we implemented a parameter space search to find multiple parameter sets that can reasonably capture the
in-situ data. To discriminate between different kinetic models (for models having different number of parameters), the
normalized posterior probability10 was calculated for each individual model. The kinetic model with the highest
probability value is statistically the most likely model.9, 10
Model Discrimination. The posterior probability of each model candidate based on Bayesian analysis can be written
as follows:10
22
' ( Z, ) 2 ( ) exp ( )
2
jP
j
j j
SP N P N
(1B)
where ( Z, ) jP N is the posterior probability of model jN for data Z with variance of , jP the number of
parameters estimated in the model jN , ( )jP N the prior probability, and ' jS the sum of residual squares.
Normalization of the posterior probability over model candidates gives
( Z, ) ( Z, )
( Z, )
j
j
P NN
P N
(2B)
The model with the highest probability, ( Z, )jN , is statistically the most likely model.
Model ( Z, )jN
Finke-Watzky (2 parameters) 0.31
Ligand-based model (6 parameters) 0.54
Extended ligand-based model (10 parameters) 0.15

10
Finke-Watzky two-step model.
Figure S4. Finke-Watzky model- considering only the total number of atoms (Y). The rate constants are 1 nuck =1.77
10-4 s-1 and 2 growthk
= 6 10-2 L.mol-1.s-1. Reaction conditions: 10 mM Pd(OAc)2 in 50:50 toluene:hexanol,
trioctylphosphine:Pd = 2:1, T = 100 °C.
Figure S5. Finke-Watzky model- considering both the total number of atoms (Y) and number of particles (NP). The
rate constants are 1 nuck =1.74 10-5 s-1 and 2 growthk
=2.5 10-1 L.mol-1.s-1. Reaction conditions: 10 mM Pd(OAc)2 in
50:50 toluene:hexanol, trioctylphosphine:Pd = 2:1, T = 100 °C.

11
Ligand-based model (considering ligand interactions with both precursor and particle surface).
Table S1. The estimated rate constants extracted for three different sets of in-situ data in toluene. Reaction conditions:
Pd(OAc)2 in 50:50 toluene:hexanol, T = 100 °C.
k1-nuc
k2-growth
k3-f
(A+L)
k4-f
(B+L)
K5-eq
(A+L)
K6-eq
(B+L)
Units s-1 L.mol-1.s-1 L.mol-1.s-1
L.mol-1.s-1 L.mol-1
L.mol-1
10 mM Pd
TOP:Pd=2 2.45 10-5 8.49 10-1 7.9 10-3 2.1 10-1 2.18 101 1.27 103
10 mM Pd
TOP:Pd=1 2.9 10-5 8.39 10-1 4.2 10-3 3 10-1 1.84 101 1.2 103
25 mM Pd
TOP:Pd=2 1.8 10-5 10 10-1 4.7 10-3 3 10-1 1.5 101 1 103
Ligand-based Model (considering ligand interaction only with particle surface).
Figure S6. Ligand-based model (considering ligand interaction only with the particle surface). The rate constants are
1 nuck =1.7 10-5 s-1, 2 growthk =2.5 10-1 L.mol-1.s-1, f B Lk = 1.92 10-2 L.mol-1.s-1, and eq B L
K
= 7.05 L.mol-1.
Reaction conditions: 10 mM Pd(OAc)2 in 50:50 toluene:hexanol, trioctylphosphine:Pd = 2:1, T = 100 °C.

12
Growth/Nucleation ratio prediction in toluene using Finke-Watzky and ligand-based models.
Figure S7. Growth/Nucleation ratio using Finke-Watzky11 and ligand-based models. Growth/Nucleation always
increased with time in the case of Finke-Watzky two-step model. Reaction conditions: 10 mM Pd(OAc)2 in 50:50
toluene:hexanol, trioctylphosphine:Pd = 2:1, T = 100 °C.
Bound ligand to metal ratio in toluene. Other important information that can be extracted from the model is bound
ligand (this includes the ligand binding with both the precursor and Pd surface atoms) to metal ratio with respect to
the reaction time. The bound-ligand/metal can be defined as:
0
0
Bound ligand
Metal
freeLL
A
(1C)
where 0
L is the initial concentration of ligand (TOP), 0A the initial concentration of metal precursor, and free
L the
concentration of free TOP. As shown in Figure S8, the bound-ligand/metal ratio increases with time.
Figure S8. Bound-ligand/metal ratio. Reaction conditions: 10 mM Pd(OAc)2 in 50:50 toluene:hexanol,
trioctylphosphine:Pd = 2:1, T = 100 °C.

13
Growth rates comparison in toluene and pyridine using ligand-based model.
Figure S9. Growth rates comparison in toluene and pyridine. Reaction conditions: 10 mM Pd(OAc)2 in 50:50
solvent:hexanol, trioctylphosphine:Pd = 2:1, T = 100 °C.
Predictive Synthesis. To use the model for predicting the size under different conditions, we first extracted the size
from the model assuming that the nanoparticles are monodisperse using the following equation:
11 133 3
modelmodel
model
avg6 6
p
w w
A
YD
N
M N M
N
(1D)
where Ү and Np are the total number of atoms in all formed nanoparticles (mol/L) and the number of particles (per
liter of solution), respectively. The mean number of atoms per particle Navg in model is calculated by dividing the total
number of atoms in all formed nanoparticles by the number of particles at any given time.
Figure S10. Prediction of size (left) and number of particles (right) as a function of time in toluene and pyridine
using ligand-based. Reaction conditions: Pd(OAc)2 in 50:50 solvent:hexanol, trioctylphosphine:Pd = 2:1, T = 100
°C.

14
Figure S11. Prediction of final particle size a function of TOP concentration in toluene and pyridine using ligand-
based model. Reaction conditions: 10 mM Pd(OAc)2 in 50:50 solvent:hexanol, T = 100 °C.
Generality of the Ligand-Based Model. In the case of Pd (Teranishi et al.12), we lowered the binding constant of
ligand to the surface by 1-2 orders of magnitude as it is known that PVP is a much weaker capping ligand than TOP13,
see Tables S1 and S2. With respects to thiol-Au system (Hostetler et al.14), thiol strongly binds to the surface of Au
nanoparticles, which can affect the particle growth rate.15, 16, 17 Additionally, thiols interact with the gold precursor and
reduce Au(III) to Au(I).18, 19 The Au(III)/Au(I) ratio in solution depends on the amount of thiol added to the system.6,
18, 19 Therefore, we expect that the thiol binding to the nanoparticle surface and to the Au precursor will both be
important in determining the final size.
Table S2. The rate constants used for prediction of final Pd particle size as a function of PVP:Pd ratio (experimental
data was reported by Teranishi et al.12).
k1-nuc
k2-growth
k3-f
(A+L)
k4-f
(B+L)
K5-eq
(A+L)
K6-eq
(B+L)
Units s-1 L.mol-1.s-1
L.mol-1.s-1 L.mol-1.s-1
L.mol-1 L.mol-1
PVP-Pd 1.2210-6 8.4910-1 1.810-2 2 10-2 1.2 4.2 101
Table S3. The rate constants used for prediction of final Au particle size as a function of thiol:Au ratio (experimental
data was reported by Hostetler et al.14).
k1-nuc
k2-growth
k3-f
(A+L)
k4-f
(B+L)
K5-eq
(A+L)
K6-eq
(B+L)
Units s-1 L.mol-1.s-1
L.mol-1.s-1 L.mol-1.s-1
L.mol-1 L.mol-1
Thiol-Au 0.82 10-6 8.4910-1 7.93 10-3 2.1 2.18 101 1.27 104

15
Figure S12. Calculated final particle sizes as a function thiol:Au14 ratios ([HAuCl4]=10 mM). We considered thiol to
interact irreversibly with gold nanoparticle (i.e. B L BL ) similar to the work done by Perala et al6.
Figure S13. Growth/Nucleation rate ratios under different concentrations of ligand and precursor in toluene (left) and
pyridine (right).
Kinetic Descriptor for Final Nanoparticle Size. The correlation for the final size (D )f in Figure 9 as a function of
Growth/Nucleation can be written as follows:
13
Growth Final Size (D = ( ) +
Nucleation) f (1E)
The values of (slope) and (intercept) were determined to be 0.48 and 0.4, respectively.
From equation (1E) we can see that when nucleation is much higher than the growth rateGrowth
0Nucleation
( ) , the
intercept represents the nucleus size of ~ 0.4 nm.

16
Equilibrium approach analysis in toluene using ligand-based model. With respect to the reactions 11
(3 5,f eqk K
A L AL
) and 12 4 , 6
( ),f eqk K
B L BL
we can examine how far these two reversible reactions
are from the equilibrium:
3 5
4 , 6
0
0
,
5 5
6 6
-TOP
-TOP
Pd(II)
Pd(II) TOP
Pd
Pd TOP
pproach to equilibrium for reaction (
pproach to equilibrium for reactio
A )
A ( )n
f eq
f eq
k K
eq eq
k K
eq
A L ALK K
B L BLK K
AL
A L
BL
B L
eq
(1F)
5 eqK and 6 eqK are the equilibrium constants for ligand binding with the precursor and Pd surface atom,
respectively. As mentioned in the manuscript, at t = 0, 3 5,f eqk K
ALA L
is considered at equilibrium. Since
the concentration of the metal precursor, A , is dropping fast due to the fast autocatalytic surface growth, less A is
present in the solution as time proceeds (also concentration of free ligands decreases with time due to association with
the surface atoms B to form BL ). As a result, reaction 3 5,f eqk K
A L AL
gets far from the equilibrium and
more AL starts to decompose. On the other hand, with time, the particle capping reaction,4 , 6f eqk K
B L BL
,
gets closer to equilibrium (see Figure S14c).

17
Figure S14. Equilibrium approach analysis for reactions of ligand with precursor ( AL ) and particle surface ( BL ).
Reaction conditions: 10 mM Pd(OAc)2 in 50:50 toluene:hexanol, trioctylphosphine:Pd = 2:1, T = 100 °C.
References
1. Chen, X.; Schröder, J.; Hauschild, S.; Rosenfeldt, S.; Dulle, M.; Förster, S. Simultaneous SAXS/WAXS/UV–Vis Study of the Nucleation and Growth of Nanoparticles: A Test of Classical Nucleation Theory. Langmuir 2015, 31 (42), 11678-11691. 2. Adachi, K.; Watarai, H. Interfacial aggregation of thioether-substituted phthalocyaninatomagnesium (II)–palladium (II) complexes in the toluene/water system. Journal of Materials Chemistry 2005, 15 (44), 4701-4710. 3. Harada, M.; Kamigaito, Y. Nucleation and aggregative growth process of platinum nanoparticles studied by in situ quick XAFS spectroscopy. Langmuir 2012, 28 (5), 2415-28. 4. Perala, S. R. K.; Kumar, S. On the Two-Step Mechanism for Synthesis of Transition-Metal Nanoparticles. Langmuir 2014, 30 (42), 12703-12711. 5. Abécassis, B.; Testard, F.; Kong, Q.; Francois, B.; Spalla, O. Influence of Monomer Feeding on a Fast Gold Nanoparticles Synthesis: Time-Resolved XANES and SAXS Experiments. Langmuir 2010, 26 (17), 13847-13854.

18
6. Perala, S. R. K.; Kumar, S. On the Mechanism of Metal Nanoparticle Synthesis in the Brust–Schiffrin Method. Langmuir 2013, 29 (31), 9863-9873. 7. An, K.; Somorjai, G. A. Size and shape control of metal nanoparticles for reaction selectivity in catalysis. ChemCatChem 2012, 4 (10), 1512-1524. 8. Moschetta, E. G.; Gans, K. M.; Rioux, R. M. Characterization of sites of different thermodynamic affinities on the same metal center via isothermal titration calorimetry. Journal of Catalysis 2013, 302, 1-9. 9. Prasad, V.; Karim, A. M.; Arya, A.; Vlachos, D. G. Assessment of Overall Rate Expressions and Multiscale, Microkinetic Model Uniqueness via Experimental Data Injection: Ammonia Decomposition on Ru/γ-Al2O3 for Hydrogen Production. Ind Eng Chem Res 2009, 48 (11), 5255-5265. 10. Stewart, W. E.; Henson, T. L.; Box, G. E. Model discrimination and criticism with single‐response data. Aiche J 1996, 42 (11), 3055-3062. 11. Watzky, M. A.; Finke, R. G. Transition Metal Nanocluster Formation Kinetic and Mechanistic Studies. A New Mechanism When Hydrogen Is the Reductant: Slow, Continuous Nucleation and Fast Autocatalytic Surface Growth. Journal of the American Chemical Society 1997, 119 (43), 10382-10400. 12. Teranishi, T.; Miyake, M. Size Control of Palladium Nanoparticles and Their Crystal Structures. Chem Mater 1998, 10 (2), 594-600. 13. Cookson, J. The Preparation of Palladium Nanoparticles. Platinum Met. Rev. 2012, 56 (2), 83-98. 14. Hostetler, M. J.; Wingate, J. E.; Zhong, C.-J.; Harris, J. E.; Vachet, R. W.; Clark, M. R.; Londono, J. D.; Green, S. J.; Stokes, J. J.; Wignall, G. D.; Glish, G. L.; Porter, M. D.; Evans, N. D.; Murray, R. W. Alkanethiolate Gold Cluster Molecules with Core Diameters from 1.5 to 5.2 nm: Core and Monolayer Properties as a Function of Core Size. Langmuir 1998, 14 (1), 17-30. 15. Negishi, Y.; Takasugi, Y.; Sato, S.; Yao, H.; Kimura, K.; Tsukuda, T. Kinetic Stabilization of Growing Gold Clusters by Passivation with Thiolates. The Journal of Physical Chemistry B 2006, 110 (25), 12218-12221. 16. Grönbeck, H.; Curioni, A.; Andreoni, W. Thiols and Disulfides on the Au(111) Surface: The Headgroup−Gold Interaction. J Am Chem Soc 2000, 122 (16), 3839-3842. 17. Xue, Y.; Li, X.; Li, H.; Zhang, W. Quantifying thiol–gold interactions towards the efficient strength control. Nature communications 2014, 5. 18. Briñas, R. P.; Hu, M.; Qian, L.; Lymar, E. S.; Hainfeld, J. F. Gold Nanoparticle Size Controlled by Polymeric Au(I) Thiolate Precursor Size. Journal of the American Chemical Society 2008, 130 (3), 975-982. 19. Goulet, P. J. G.; Lennox, R. B. New Insights into Brust−Schiffrin Metal Nanoparticle Synthesis. J Am Chem Soc 2010, 132 (28), 9582-9584.