college students’ psychic income from intercollegiate...
TRANSCRIPT
1
COLLEGE STUDENTS’ PSYCHIC INCOME FROM INTERCOLLEGIATE FOOTBALL AND ITS IMPACT OF COLLEGE SATISFACTION
By
WOOSOON KIM
A DISSERTATION PRESENTED TO THE GRADUATE SCHOOL OF THE UNIVERSITY OF FLORIDA IN PARTIAL FULFILLMENT
OF THE REQUIREMENTS FOR THE DEGREE OF DOCTOR OF PHILOSOPHY
UNIVERSITY OF FLORIDA
2010

2
© 2010 Woosoon Kim

3
To my father, Sun-chi Kim (1942 - 2009)
4
ACKNOWLEDGMENTS
This project could not be completed without the help and support of my advisor,
committee members, family, and all of the individuals who shared their time to improve
the study. My deepest appreciation goes to my advisor, Dr. Michael Sagas, for his
advice, encouragement, patience and endless support. He went above and beyond the
call of duty to help with this study. I also sincerely appreciate all the help from my
amazing committee members: Dr. Mickie Swisher, Dr. James Zhang, Dr. Holland
Stephen, and Dr. Matthew Walker. Through the course of my doctoral program, the
members of my committee shared their wisdom, checked my progress, and inspired me
when things seemed overwhelming. It was the honor of working with all the members of
my committee.
Most importantly, my warmest gratitude must be expressed to my wife, Jeoning,
and my two sons, Donghu and Dongwook. My entire family in Korea should also be
acknowledged. My sincere thanks go to all.
5
TABLE OF CONTENTS page
ACKNOWLEDGMENTS .................................................................................................. 4
LIST OF TABLES ............................................................................................................ 7
LIST OF FIGURES .......................................................................................................... 8
ABSTRACT ..................................................................................................................... 9
CHAPTER
1 INTRODUCTION .................................................................................................... 11
College Satisfaction ................................................................................................ 11 Intercollegiate Sport as an Industry ........................................................................ 12 Overview of the Research Problem ........................................................................ 15 Purpose of the Study .............................................................................................. 17 Delimitations ........................................................................................................... 18
2 REVIEW OF LITERATURE .................................................................................... 20
Overview of College Satisfaction ............................................................................ 20 Psychic Income from a Collegiate Athletic Team .................................................... 27
Pride from Increased Institution Visibility .......................................................... 31 Pride from Being a Big-time Collegiate Sport Institution ................................... 33 Pride in Efforts of Additional Campus Development ......................................... 34 Excitement Quotient from Games .................................................................... 36 Emotional Involvement with a Team ................................................................. 38 Tangible Focus for Social Bonding ................................................................... 40 Enhanced Collective Self-esteem ..................................................................... 41
3 METHODOLOGY ................................................................................................... 48
Item Generation ...................................................................................................... 48 Data Collection ....................................................................................................... 52 Data Analysis .......................................................................................................... 54
4 RESULTS ............................................................................................................... 66
Descriptive Statistics ............................................................................................... 66 Demographic .................................................................................................... 66 Descriptive Statistics of Scales ......................................................................... 66
Confirmatory Factor Analysis .................................................................................. 67 Hierarchical Multiple Regression Analysis .............................................................. 69

6
5 DISCUSSION ......................................................................................................... 76
Review of the Conceptual Framework .................................................................... 76 Discussion of the Results ........................................................................................ 78 Limitations and Future Directions ........................................................................... 80
APPENDIX
A PANEL OF EXPERT ............................................................................................... 83
B FIELD TESTS ......................................................................................................... 91
C MAIN SURVEY – ONLINE SURVEY ...................................................................... 96
LIST OF REFERENCES ............................................................................................. 104
BIOGRAPHICAL SKETCH .......................................................................................... 119
7
LIST OF TABLES
Table page 2-1 Examples of Social Impact Analysis (SIA) Framework ....................................... 44
2-2 A Brief Comparison between Crompton’s (2004) Paradigm and the Conceptual Framework in this Study .................................................................. 45
3-1 Related Items from Other Sport Related Studies ................................................ 58
3-2 Reliability Analysis of Pilot Data ......................................................................... 64
3-3 Items for Overall Quality of Campus Life ............................................................ 65
4-1 Demographic Characteristics of Participants ...................................................... 71
4-2 Descriptive Statistics for Psychic Income Scale Items ........................................ 72
4-3 Model Fit Comparison (n = 663) ......................................................................... 73
4-4 Interfactor Correlations from the Confirmatory Factor Analysis (n = 663) ........... 73
4-5 Final Model’s Factor Loadings, Critical Ratios, Cronbach Alpha, Construct Reliability, Average Variance Extracted (n = 663) .............................................. 74
4-6 Results of Hierarchical Analysis ......................................................................... 75
8
LIST OF FIGURES
Figure page 2-1 Crompton’s (2004) Framework ........................................................................... 46
2-2 College Students’ Psychic Income from Their Intercollegiate Team ................... 47
9
Abstract of Dissertation Presented to the Graduate School of the University of Florida in Partial Fulfillment of the Requirements for the Degree of Doctor of Philosophy
COLLEGE STUDENTS’ PSYCHIC INCOME FROM COLLEGIATE FOOTBALL
AND ITS IMPACT OF COLLEGE SATISFACTION
By
Woosoon Kim
December 2010
Chair: Michael Sagas Major: Health and Human Performance
A great amount of research has been conducted to determine the criteria of
college student satisfaction and to develop measurement instruments to examine the
overall quality of life among college students, but limited research has investigated
specific aspects of college satisfaction. In addition, relatively few studies have
attempted to explain the link between student satisfaction and college sports despite the
enhanced interests in this link. The primary goal of this study was to develop a valid and
reliable scale to measure how college students’ psychic income from the school’s
athletic teams influences their satisfaction with college. Instead of developing a new
framework, Crompton’s (2004) psychic income paradigm was adopted and the
preliminary questionnaire was established by a comprehensive literature review, expert
review, a field test, and a pilot study. Confirmatory factor analysis and reliability tests
were employed with the total number of 663 data for the final purification of the scale of
psychic income (SPI). As a result of a factor analysis, the 7-factor model with 27 ites
was conceptualized: Social Bonding (3 items), Excitement (3 items), Emotional
Involvement (5 items), Collective Self-esteem (3 items), Pride from Being a Major
Collegiate Sport Institution (5 items), Pride from Increased Institution Visibility (4 items),
10
and Pride Due to Additional Campus Development Efforts (4 items). The hierarchical
analysis in multiple regression was employed to identity the best predictors of college
satisfaction and revealed that six independent variables significantly predicted the
outcome and collectively explained approximately 40% of the variance in college
satisfaction. The six variables were gender, Excitement, Emotional Involvement, Pride
from Being a Major Collegiate Sport Institution, Pride from Increased Institution Visibility,
and Pride Due to Additional Campus Development Efforts. This study provided an
important step towards better understanding psychic income, which is one segment of
social impact analysis measurement, and should prove useful for college administrators,
sport practitioners, and marketers. The findings of this study will help explain why
college sport receive increasingly more television air time and also why its business
aspect is getting acceptable to the college administrators and entrepreneurs. In
addition, the findings of this study will fulfill the call for supplementary construct of
college life.
11
CHAPTER 1 INTRODUCTION
College Satisfaction
The Office of Postsecondary Education in the U.S. Department of Education
administers higher education programs and the Higher Education Act of 1965
(reauthorized in 2008), which defines a higher education institution as “a public or
nonprofit private educational institution in any state that awards a degree that is
acceptable for admission to a graduate or professional degree program” (Department of
Education, 2010). In some East Asian countries, the terms “college” and “university” are
frequently translated to “the big or great learning.” Concurrently, higher education
institutions emphasize student satisfaction assessments to identify institutions’ strengths
and challenges; they then use this information to respond to increased competition from
other colleges and universities as well as private providers nationwide and
internationally (Fullan, 2003; Koilias, 2005; Sirgy, Grezeskowiak, & Rahtz, 2007).
According to the United States Department of Education (2009), total undergraduate
enrollment in degree-granting postsecondary institutions rose by 19% from 2000
through 2007. The enrollment in 2000 was 13.2 million, up from 7.4 million in 1970, and
it increased to 15.6 million in 2007 (U.S. Department of Education, 2009). The United
Nations Educational, Scientific, and Cultural Organization (UNESCO) addressed the
implications of globalization for higher education as a critical issue in today’s
competitive educational market (UNESCO, 2009). Facing challenges to sustain their
institutions in the market, colleges and universities recognize that higher education is
now categorized as a service industry.
12
Strengthening students’ satisfaction is an important mission of educators
because college satisfaction has been linked to student academic performance and
attrition (Chow, 2005; Okun & Weir, 1990; Nguyen & LeBlanc, 2001). Institutions with
more satisfied students typically enjoy higher graduation rates, higher alumni giving,
and better academic performance (Cha, 2003; Okyun et al., 1990; Yu & Kim, 2008).
Researchers and organizations have found that a student’s satisfaction with an
institution depends not only on academic factors but also on a number of other benefits
related to student life (Deshieds, Kara, & Kaynak, 2005; Koilias, 2005; Sirgy et al.,
2007). Genetic factors such as demographic and personality variables also influence an
individual’s satisfaction. However, several studies have claimed that demographic
variables may not explain much about an individual’s satisfaction with college and,
alternatively, that self-esteem appears to be one of the strongest predictors of such
satisfaction (Camphell, 1981; Cha, 2003; Diener & Suh, 1999). In sum, college
satisfaction is an important source of competitive advantage for an institution in the
context of globalized higher education markets.
Intercollegiate Sport as an Industry
In the United States, colleges and universities are intellectual agencies, but they
are also social, commercial, and athletic agencies. While higher education institutions
pursue competitive academic performance, intercollegiate athletics have been growing
rapidly and providing a sense of excitement, pride, and involvement to the college and
community (Duderstadt, 2000; Gerdy, 2000). Before the mid-1980s, college sports did
not have significant value in American culture and few regulations governed the
intercollegiate athletics industry (Gerdy, 2000; Smith, 2004). However, college sports
now represent a major portion of the sport industry, and college sports programs are as
13
prosperous as professional sport leagues. In academic fields, researchers have
attempted to examine the value of sport to an institution and its community as an
integral part of society with economic, social, and educational assessments (e.g.,
Austrian & Rosentraub, 2002; Baade & Dye, 1998; Coates & Humphreys, 2000;
Crompton, 2004; Eckstein & Delaney, 2002; Gramling & Freudenburg, 1992;
Rosentraub & Swindell, 2002; Siegfried & Zimbalist, 2000). However, the majority of
value studies essentially have focused on economic assessments (Fredline & Faulkner,
2000; Sherwood, Jago, & Deery, 2005; Swindle & Rosentraub, 1998).
The National Collegiate Athletic Association (NCAA) Division Football Bowl
Championship is worth $2 billion per year (Ozanian, 2008) and the largest revenue-
generating organization earned $118 million in 2008 (NCAA, 2009). CBS Sports
broadcast its 26th consecutive NCAA men’s basketball tournament in 2010, an event for
which the NCAA has an 11-year, $6 billion contract with CBS that extends through 2013
(CBS Sports, 2009). The athletic department at the University of Alabama negotiated an
eight-year, $32 million contract in 2007 with Nick Saban in an attempt to return to
national football prominence (Forbes, 2008). Saban previously was a National Football
League (NFL) coach for the Miami Dolphins, and he led Alabama to the 2009 Bowl
Championship Series (BCS) national championship.
In the intercollegiate sport industry, the NCAA is the most powerful organization,
with more than 1,000 member universities under three divisions: Division I, II, and III
(Dehass, 2009). Counting other sanctioning organizations, such as the National
Association of Intercollegiate Athletics (NAIA) and the National Junior College Athletic
Association (NJCAA), almost every college in the U.S. has an athletic department. Ohio
14
State University had the largest college athletic department budget in the 2007-2008
fiscal year at nearly $110 million (SportsBusiness Daily, 2007). According to the NCAA,
approximately 412,768 student-athletes participated in sports for which the NCAA
conducted championships in 2007-2008 and 57.4% of the total participants were male
student-athletes (NCAA, 2009a). During the same academic year, the number of NCAA
championship sport teams sponsored was 17,682, an increase from 17,491 in 2006-
2007 (NCAA, 2009).
The affirmative description of intercollegiate sport is valid, but not all athletic
programs in the U.S. generate positive financial impacts on their universities. Fulks
(2009) revealed that the average net generated revenues, revenues exceeding
expenses, for financially successful athletic programs in 2007-2008 was $3,367,700, but
the average net deficit for other athletic programs was $9,870,000. The gap between
the financially successful athletic departments and others has continued to broaden in
recent years (Fulks, 2009). From 2004 through 2008, only 15% to 21% of Division I
football bowl subdivision (FBS) programs reported more revenues than expenses
(Fulks, 2009). Even the most popular college sport programs, football and men’s
basketball, reported between 50% and 60% net generated revenues during the last five
years (Fulks, 2009).
Gerdy (2000) suggested a skeptical view toward athletic departments’ financial
statements because measured net profits may not be true figures. The rationale behind
this is that indirect or overhead costs are missing from the financial statements,
including amortization of facilities, student athletics support services, and student
athletics recruiting expenditures (Gerdy, 2000). Splitt (2007) asserted that independent
15
and profit-driven athletic departments, especially big-time (FBS) intercollegiate athletics,
create out-of-control commercialization issues that include inappropriate financial
reports and boosterism. Splitt (2007) indicated that some incomplete financial reports
provide unclear pictures of athletic department key employees’ contingent benefits and
unrelated business income resulting from the excessive sacrifice of taxpayers in the
name of tax benefits. However, it is hard to deny the great value of intercollegiate
athletics in the U.S. because they boost morale, provide entertainment, and supply
ample business opportunities (Duderstadt, 2000; Gerdy, 2000; NIRSA, 2004; Noll,
2004; Shulman & Bowen, 2001; Sperber, 2000; Splitt, 2007).
Overview of the Research Problem
A great amount of research has been conducted to determine the criteria of
college student satisfaction and to develop measurement instruments to examine the
quality of life among college students (e.g., Abdel-Khalek, 2004; Cha, 2003; Chow,
2005; Koilias, 2005; Okun et al., 1990; Sirgy et al., 2006; Yu et al., 2008), but limited
research has investigated specific aspects of college satisfaction. Relatively few
researchers have attempted to explain the link between student satisfaction and college
sports despite the enhanced interest in this link. Considering the overall value of
intercollegiate athletics, some aspects of college satisfaction should be better specified
and measured.
Students’ level of satisfaction with an institution needs to be clarified by exploring
non-academic factors. Early studies focused on academic aspects as a primary
predictor of student satisfaction; however, the environment of colleges or universities
has changed due to improved technology and unpredictable economic situations (Clark
& Trow, 1996; Deshields et al., 2005; Koilias, 2005). Astin (1977), in an early study,
16
discovered that the retention rate of college students is affected by the level and quality
of their interactions with peers, as well as faculty and staff. Tinto (1987) added that
academic difficulty, adjustment problems, and lack of clear academic and career goals
were major factors in student retention. However, academic performance only accounts
for half of the variance in dropout rates (Pantages & Creedon, 1978). In addition, social
aspects of college such as on-campus housing, recreational activities, and collegiate
athletics have become distinct factors that enhance student retention and persistence
(Cha, 2003; Sirgy et al., 2006; Yu et al., 2008). Thus, it was beneficial to determine
unique nonacademic aspects of college satisfaction instead of a limited overall construct
of quality of college life.
Among the variety of relationships between college satisfaction and
nonacademic variables, a better understanding of the link with a college’s athletic teams
needs to be developed. Although many studies have been conducted to find the value
of recreational or intramural activities on college campuses (e.g., Artinger et al., 2006;
Kantas, 2000; NIRSA, 2004; Yoh, Mohr, & Gordon, 2008), they have not included
intercollegiate sport teams. Some studies found a stronger correlation between overall
college satisfaction and student participation in athletic activities than between course
work and college satisfaction (e.g., Artinger et al., 2006; Astin, 1999; McGuinn &
Mosher-Ashley, 2001; Varca, Shaffer, & Sanders, 1984). One of the leading resources
for education and research in collegiate recreational sports, the National Intramural-
Recreational Sports Association (NIRSA), has been providing education and research
to foster high-quality recreational programs since its formation as the National
Intramural Association (NIA) in 1950 (NIRSA, 2009). However, few studies have
17
focused on students’ college satisfaction from their intercollegiate athletic teams even
though a great deal of research has addressed the enhanced interest in this segment.
Thus, whether successful college athletic programs influence college satisfaction,
institutional retention, and graduation rates remains unknown.
The current study focused on the relationship between college satisfaction and a
specific facet of psychological well-being, a positive impression of collegiate athletics.
However, one difficulty was the lack of conceptual frameworks and measurement tools
established to examine these relationships. Existing models of college satisfaction differ
based on specific attributes of the institutions, and they focus on the overview of
strengths and challenges of higher education institutions (Cha, 2003; Koilias, 2005;
Okun et al., 1990; Sirgy et al., 2007). Studies of the impact of intercollegiate athletics
also have included various assessments of college teams in relation to the institution or
the community (Duderstadt, 2000; Mangold, Bean, & Adams, 2003; Shulman et al.,
2001; Sperber, 2000). This study seeks to develop the framework of students’
psychological benefit (i.e., psychic income) from their home athletic teams and to
examine college students’ satisfaction through the development of an appropriate
measurement instrument.
Purpose of the Study
The primary goal of this study was to explore how college students’ psychic
income from a school’s athletic teams influences their satisfaction with college. To
accomplish this goal, the following tasks were conducted: (a) investigate student
psychic income from their college teams to provide a conceptual model, (b) develop a
valid and reliable scale to measure the latent variables, and (c) examine the link
between students’ psychic income generated by their intercollegiate teams and their
18
satisfaction with college. Most importantly, this study emphasized reporting on the
development of an instrument, because a valid measurement tool can be adopted for
use in various contexts of intercollegiate athletics.
Instead of developing a new framework, Crompton’s (2004) psychic income
paradigm was adopted. Crompton (2004) attempted to identify rationales other than
economic impact for the public subsidy of major-league sports facilities. Kim, Ko, and
Zhang (2008) and Kim and Walker (2010) assessed community residents’ psychic
income from sport mega events, the Daytona 500 and the Super Bowl, using
Crompton’s (2004) conceptual framework. Crompton’s (2004) context was based on
professional sport leagues, but this study applied the conceptual framework to
intercollegiate athletics. The framework describes the primary components and
structures of student psychic income. While examining the theoretical paradigm, this
study maintained a focus on the development of enhanced instruments to measure the
relationship between college students’ psychic income and their intercollegiate teams.
To uncover multiple dimensions of this complicated construct, advanced statistical tools
were applied to analyze data and to test the framework. Lastly, the developed construct
and measurement tool was used to answer the following questions: (a) What are the
psychic income factor structures and scale items? (b) Which psychic income constructs
most affect college satisfaction? (c) To what extent does each construct influence
college satisfaction? (d) If and how can we expect increased student college satisfaction
from students’ psychic income structure?
Delimitations
This study was designed as an initial step in a series of studies on sport
spectators’ psychological benefits from their home team, specifically college students’
19
psychic income from their intercollegiate football team. This study was compounded by
a number of factors but the findings are limited to the present sample as well as those
individuals in the sample who are undergraduate students at one southeastern NCAA
Division I university. The selected institution represents a big-time university that is a
large public research university with high-profile football and/or men’s basketball teams
playing at the highest NCAA levels. The selected institution has one of the largest
intercollegiate athletic programs in the U.S. and may be considered a benchmark
program for athletic programs in other higher education institutions. However, the
results may not be generalizable to other higher education institutions or sporting
events, and several factors (e.g., gender, sporting experience, school status) may
influence the differences between or within the groups.
20
CHAPTER 2 REVIEW OF LITERATURE
Higher education is undoubtedly an intellectual endeavor, but in the United
States the fascination with collegiate sports is also undeniable. Intercollegiate sports are
a service industry and many academic institutions provide entertainment through their
athletic teams in addition to their academic services (Duderstadt, 2000; Gerdy, 2000;
Savage, 1929). This phenomenon began with football and was quickly followed by
many other sports taking root in colleges. Sports teams are regarded as an economic
generator and a visibility enhancement tool (Brand, 2006). Football was the tool that
bestowed university students with a sense of identity as early as the 19th century
(Leeds & Allmen, 2008). The importance of college sports requires additional research
to find its influence on college satisfaction. Thus far, few academic efforts have
attempted to find this link; therefore, this chapter provides a review of the literature in
the fields of education, recreation, marketing, and sport regarding the issues. First, an
overview of college satisfaction is discussed to provide a better understanding of the
research questions. Then, a conceptual framework is provided to investigate this
satisfaction’s impact—specifically, the psychic income college students receive from
their athletic teams.
Overview of College Satisfaction
Many colleges and universities have been searching for strategies to improve the
quality of student life and learning. To determine students’ satisfaction with a wide range
of college experiences, institutions conduct surveys under the name of student
satisfaction inventories (e.g., Columbia College Chicago, Eastern Oregon University,
University of Michigan-Flint, Wright State University) or student satisfaction surveys
21
(e.g., Eastern New Mexico University, Florida International University, University of
Illinois at Chicago). Okun et al. (1990) addressed three rationales of studying college
satisfaction: (a) its relationship to grade point average (GPA), (b) its role as a predictor
of turnover, and (c) its important subjective educational outcome itself. A privately
owned company, Noel-Levitz, Inc., is a relatively well-known higher education
consulting firm and has conducted student satisfaction inventories for many institutions.
The majority of colleges listed in this paragraph administer the Noel-Levitz student
satisfaction inventory (SSI) to use for (a) guidance of institutional strategic plans, (b)
student retention management, (c) assisting accreditation requirements, (d) identifying
areas of strength for institution marketing, and (e) managing the progress toward
institutional goals (Noel-Levitz, 2009).
College satisfaction refers to the overall feeling of satisfaction students’
experience in college (Yu et al., 2008). Satisfaction itself refers to a perceived positive
quality of life, and it focuses on how and why people experience their lives in favorable
ways (Cha, 2003; Cummins & Nistico, 2002; Sirgy, 2007). Two different terms for
college satisfaction were used in many studies: quality of college life (QCL) (e.g., Sirgy
et al., 2007; Vaez, Kristenson, & Laflamme, 2004; Yu et al., 2008) and subjective well-
being (SWB) among students (e.g., Balatsky & Diener, 1993; Cha, 2003). All these
studies aimed to find the degree to which individuals judge the overall quality of their
campus life in an affirmative way (Sirgy et al., 2007).
A number of studies have investigated the causes of college satisfaction. For
example, Pilcher (1998) examined how daily events affect and predict life satisfaction
among college students and concluded that feelings of depression, anger, vigor, and
22
confusion, with physical health and frequency of physical illness, significantly correlate
with life satisfaction in college students. Cha (2003) found relationships between college
satisfaction and personality variables such as self-esteem, collective self-esteem, and
optimism. According to Cha (2003), all of these variables significantly correlated with
college satisfaction; however, biosocial variables such as gender and age explain a
small portion of satisfaction, but personality may be one of the strongest influences
(Cha, 2003; Hofer et al., 2008). Vaez et al. (2004) conducted a study showing a positive
correlation between Swedish college students’ perceived satisfaction and self-rated
health. College satisfaction may differ in various cultures but cross-cultural studies in
this endeavor are few; however, Abdel-Khalek found the level of Kuwaiti students’
satisfaction was the 2nd lowest among four different countries, including Bahrain, the
United States, and Cameroon (Abdel-Khalek, 2003).
Most college satisfaction studies focus on developing instruments for measuring
the constructs (e.g., Koilias, 2005; Okun et al., 1990; Sirgy et al., 2007; Yu et al., 2008).
The College Student Satisfaction Questionnaire (CSSQ), which was developed by Betz,
Klingensmith, and Menne (1970) in the late 1960s, is the most widespread scale in use
(Okun et al., 1990). This specific scale assesses five facets of college satisfaction
assuming college satisfaction is analogous to job satisfaction. Okun et al. (1990)
described Betz et al.’s five constructs of college satisfaction in their study as follows:
(a) Compensation – amount of input (studying) vs. output (grades); (b) Social life - opportunities to meet friends and participate in social activities and fulfill other social goals; (c) Working condition – the physical conditions such as study areas and residences; (d) Recognition – attitudes of faculty and students indicating acceptance of other students; and (e) Quality of education – those academic conditions related to the intellectual development of the students (p. 61).
23
In another early study, Spady (1970) developed a conceptual model to illustrate
higher education dropouts with a complex social process basis that included five
independent variables: (a) grade performance, (b) intellectual development, (c)
normative congruence, (d) friendship support, and (e) social integration. Spady (1971)
then conducted a longitudinal study to operationalize the variables of the initial model.
Spady’s (1971) revised model retained the components of the original model, but found
the variable “friendship support” should be revised to “structural relations” and
“friendship support.” Vaez et al. (2004) measured quality of life (QoL) and addressed
four fundamental components of QoL: life satisfaction, self-esteem, health, and
functioning in terms of the relationship between individual health status and the quality
of life assessments of first-year university students. Sirgy et al. (2007) also attempted to
simplify the concept and provided three components explaining quality of college life:
satisfaction with academic aspects, social aspects, and facilities and services. NIRSA
(2004) examined student overall satisfaction and success in college with 21 factors. The
most important factor was course content and range of courses, followed closely by
quality of professors and ability to interact with them (NIRSA, 2004). Interestingly, the
NIRSA study showed that participation in recreational sports and activities ranked 11th,
exactly in the middle of the 21 factors. Watching varsity sports teams and participating
in varsity sports were ranked 19th and 20th, respectively.
Although many researchers have attempted to conceptualize the broader notion
of college satisfaction into a model, there were no standardized constructs for college
satisfaction. However, some conceptual frameworks represent a composite of student
satisfaction and affect balance that students experience during college life (Yu et al.,
24
2008). The first part is the cognitive evaluation of college life, which is the degree of
need satisfaction from college life. Those needs in the cognition aspect are health,
safety, family, self-esteem, self-actualization, knowledge, and aesthetics (Diener, 1994;
Sirgy et al., 2007; Yu et al., 2008). The next is the affective component, which refers to
the frequency of positively affecting experiences during college life (Diener, 1994; Hong,
Han, & Kim, 2008; Roberts & Clifton, 1992; Yu et al., 2008). The current study included
both components, cognitive and affective college satisfaction, but it focused on one
specific stimuli of students’ satisfaction, and that was intercollegiate athletics.
Indirect Impact of Big-time Intercollegiate Athletics
To discuss various college subcultures, Sperber (2000) addressed the four major
student subcultures in his book, Beer and Circus: collegiate, academic, vocational, and
rebel. These college subcultures were suggested by sociologists Burton Clark and
Martin Trow (1966), but their description of the subcultures remains applicable to
undergraduate life in the U.S. (Sperber, 2000). Among the four subcultures, the
collegiate subculture is the most widely recognized stereotype of college life and it
includes the world of football, fraternities and sororities, dates, cars, drinking, and
campus fun (Clark et al., 1966). This subculture started in the 18th century when
financially middle- and upper-class students enjoyed campus life. It has been a
generator of college loyalties and attachments since then (Clark et al., 1966).
Particularly, intercollegiate sports provide pride, excitement, and involvement as well as
discipline, perseverance, and teamwork to athletes and spectators (Duderstadt, 2000;
Gerdy, 2000; NIRSA, 2004; Savage, 1929).
25
Given its tremendous popularity and influence, the attitude of communities and
college administrators regarding the value of intercollegiate sports has changed.
Although there were efforts to control college sports as one component of a college
education, some college athletics have evolved far beyond the control of many
universities (Duderstadt, 2000; Shulman et al., 2001). Big-time football and men’s
basketball programs are examples of this, due to their enormous media coverage
(Duderstadt, 2000; Gerdy, 2000). Advanced technology in transportation and
communication has intensified this trend and enhanced intercollegiate athletics beyond
regional coverage and interests (Gerdy, 2000). College sports transformed into an
important spectator activity for students, faculty, staff, and community members (Gerdy,
2000; NIRSA, 2004). Watching college sports is a predominant form of leisure behavior
in the U.S.
Intercollegiate athletics are generally thought to benefit their institutions. In
addition, college administrators believe athletic success provides substantial indirect
benefits such as raising college profits, increasing donations, attracting higher quality
students, enhancing school spirit and reputation, and providing entertainment to the
school and to the community (Deduerstadt, 2000; Gerdy, 2000; McCormics & Tinsley,
1987; Pope & Pople, 2009; Shulman et al., 2001). For example, empirical studies have
found that football and basketball success increases the number of incoming
applications, and the increase is 2 to 4 times higher in private schools compared to
public schools (McCormics et al., 1987; Pope et al., 2009). Out-of-state students have a
preference for higher division intercollegiate schools (Mixon & Hsing, 1994). Big-time
athletic victories marginally increase average incoming Scholastic Aptitude Test (SAT)
26
scores (McCormick et al., 1987; Mixon, 1995; Tucker & Amato, 2006). As discussed in
the introduction, financial impacts of successful collegiate athletic programs are
enormous and intercollegiate sport is treated as an important business in the U.S.
Despite all these positive impacts of college sports, there have been questions
regarding the true impact. A controversial issue regarding direct financial impact was
discussed earlier in this study and several empirical studies also had conflicting
conclusions on indirect impacts. For example, some researchers found that postseason
play is not a significant determinant of donations to institutions in higher education while
athletics’ overall winning percentage is positively related to alumni contributions (Baade
& Sundberg, 1994; Grimes & Chressanthis, 1994; Meer & Rosen, 2008). Thus, the
relationship between athletic success and alumni giving is in need of further research.
Toma and Cross (1996) revealed that winning an NCAA Division I national
championship in football and men’s basketball increased the number of new
applications, but had no effect on the SAT scores. In another study, Humphreys (2003)
showed that Division I-A football schools receive significantly more state appropriations
than others, so the impact assessment of big-time college sports requires careful review
because of this important external variable.
To determine the indirect economic benefits of intercollegiate athletics, prior
researchers have primarily focused on how big-time college sports have influenced
college applications, graduation rates, the quality of students, and contributions to the
institution. Several researchers have attempted to measure the direct economic impact
of intercollegiate athletics, but the findings are controversial (Baade, Baumann, &
Matheson, 2007; Matheson & Baade, 2003; Zimbalist, 1999). The direct benefits include
27
ticket sales, concession and parking revenues, broadcasting rights, postseason games,
and licensed merchandise sales (Humphreys, 2003), but the true net profit from college
sports is still unclear. The popularity of big-time NCAA championship games may
overemphasize their questionable economic impact to the institution as well as to the
community. Given the lack of consensus regarding the true impact of intercollegiate
athletics, this study specifically examined a different set of effects, which is college
students’ psychic income from their college sport teams.
Psychic Income from a Collegiate Athletic Team
International sport events such as the Olympic Games or the FIFA World Cup
attract a significant amount of worldwide attention. A number of studies have
investigated the various impacts of major sport events. However, impact analyses on
mega sport events have tended to focus on economic activities with little attention given
to non-economic criteria (e.g., Fredline & Faulkner, 2000; Sherwood, Jago, & Deery,
2005). The potential benefits of hosting mega events may go beyond tangible economic
outcomes with even small communities seen celebrating their uniqueness, promoting
themselves, developing local pride, and enhancing economic well-being (cf. Horne &
Manzenreiter, 2006; Ritchie & Smith, 1991). In addition, there was a lack of empirical
consensus regarding the usefulness of economic impact analyses, so it became critical
to incorporate a measure of residents’ perceptions, opinions, and attitudes to maximize
supportive attitudes and minimize any pejorative outcomes at the local level (e.g.,
Gursoy, Jurowski, & Uysal, 2002; Gursoy & Rutherford, 2003; Ko & Stewart, 2002). For
the last few decades, the perceived impact of mega events has been a growing
research area (e.g., Andereck & Vogt, 2000; Choi & Sirakaya, 2005; McCool & Martin,
1994).
28
Ritchie (1984) raised the issue of psychic income in a study assessing impacts of
hallmark events and Burgan and Mules (1992) added psychic income in their economic
assessment study of sport events. Gibson (1998) addressed the importance of this
concept in her review of sport tourism, drawing from Burgan et al.’s study. Kim et al.
(2008) reviewed literature and found that psychic income has been examined in other
disciplines as well. For human resource management (HRM) researchers, psychic
income refers to an intrinsic reward induced in a job, such as emotional satisfaction or a
sense of achievement (Reif, 1975). Many businesses have used psychic income to
satisfy employees’ basic emotional needs beyond just monetary incentives, building on
Maslow’s (1943) hierarchy of needs. Economists (e.g., Johnson, Groothuis, &
Whitehead, 2001; Johnson, Mondello, & Whitehead, 2006; Owen, 2006) have applied
the concept of consumer/buyer surplus to determine psychic income and measured a
host’s psychological benefits by way of the contingent valuation method (CVM), which
places a dollar value on public goods and services traded outside the marketplace
(Walker & Mondello, 2007). The CVM is a survey-based economic technique to
measure how much consumers are willing to pay for environmental features (Johnson &
Whitehead, 2000); however, willingness to pay for a sport team or event does not
provide a complete measure of an individual’s psychic income (cf. Johnson et al., 2001;
Johnson et al., 2006; Owen, 2006).
In the context of sport management, Crompton (2004, p. 181) defined psychic
income as “the emotional and psychological benefit residents perceive they receive,
even though they do not physically attend sport events and are not involved in
organizing them.” Crompton sought to identify a rationale other than economic impact
29
for the public subsidy of major-league sport facilities. Psychic income was one internal
benefit (i.e., residents’ internal perceptions) of sport teams along with four external
benefits (i.e., economic impact, community visibility, community image, and stimulation
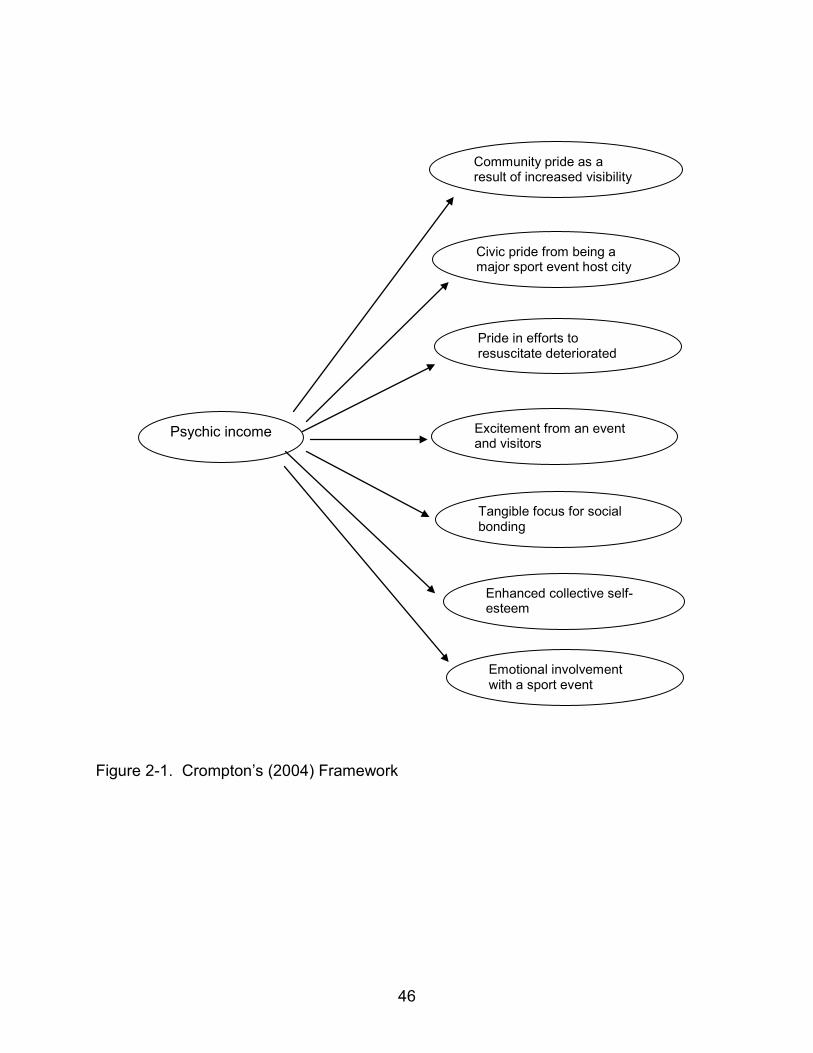
of other development). Crompton (2004) included the following seven factors in the
conceptual framework of psychic income: (a) community pride as a result of increased
community visibility, (b) excitement quotient from visitors, (c) emotional involvement with
a team, (d) tangible focus for social bonding, (e) pride in efforts to resuscitate
deteriorated areas, (f) civic pride from being a major-league city, and (g) enhanced
collective self-esteem.
Adopting Crompton’s (2004) framework, Kim et al. (2008) investigated sport
event host-residents’ psychological benefits as a response to the increased call for a
broader approach to impact analysis. They first distinguished social impacts and
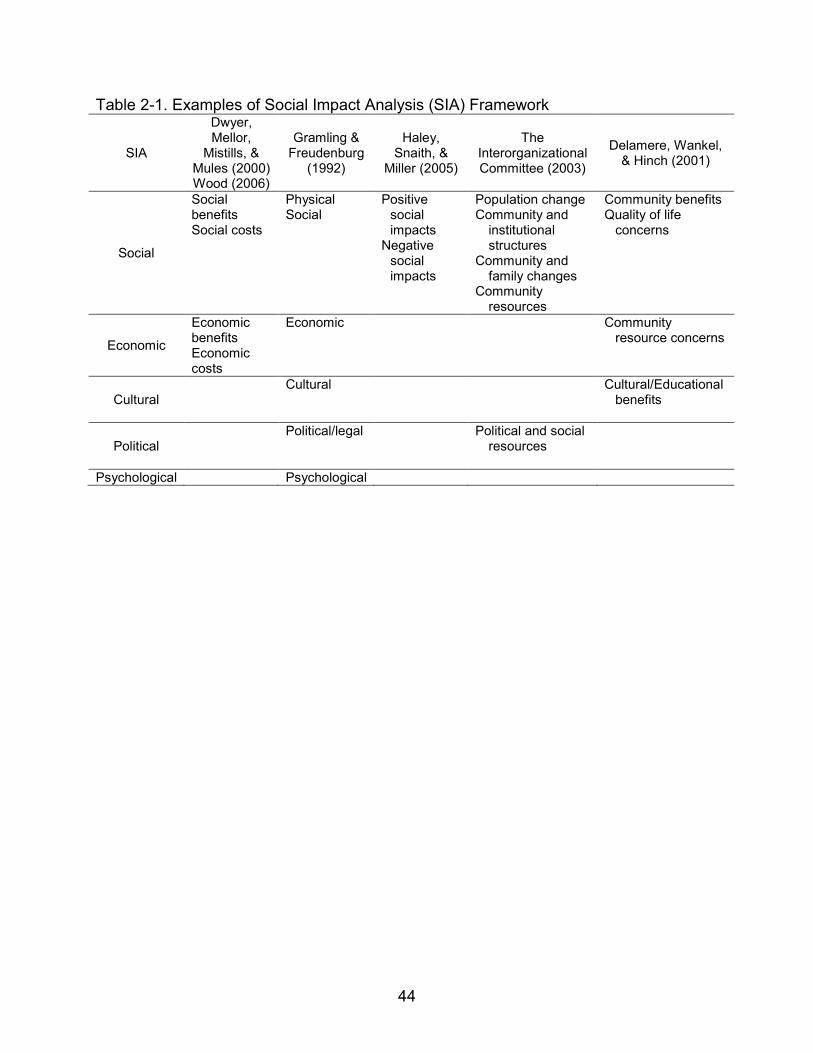
psychic income. Table 2-1 lists several frameworks of social impact studies, but there is
no standardized single taxonomic framework for social impact analysis (SIA). In
addition, it is almost impossible to combine all dimensions of social impacts because
any social changes stimulate unexpected consequences (The Interorganizational
Committee, 2003). One of the most comprehensive frameworks for social assessment
is the suggested model from Gramling and Greudenberg (1992), which illustrates six
distinct systems (i.e., physical, cultural, social, political, economic, and psychological) of
the human environment across three time periods (i.e., before, during, and after
conducting a project).
Among the various perspectives of social impact, it has been argued that host-
residents’ psychological impact should be examined separately (e.g., Burgan & Mules,
30
1992; Crompton, 2004; Gibson, 1988; Ritchie, 1984). Thus, Kim et al. (2008) tested a
scale of psychic income (SPI) with samples of Daytona Beach residents, who host the
Daytona 500 annually. Those items were validated by a principal component analysis
(PCA) using Cronbach’s alpha and factor loadings. The scale comprised four domains:
(a) emotional benefits, (b) positive economic assessment, (c) increased quality of
community life, and (d) enhanced perception of the public utility. Kim (2009) also
attempted to develop a scale of psychic income for sport event host-residents by
surveying Tampa Bay, Florida, residents. The target sport event was the 43rd annual
NFL championship game on February 1, 2009. Crompton’s (2004) psychic income
paradigm was adopted in Kim’ study and it established a total of 22 items under five
psychic income factors: (a) community pride as a result of enhanced image, (b)
enhanced community attachment, (c) event excitement, (d) pride in efforts to improve
community infrastructure, and (e) community excitement. This specific study conducted
two statistical analyses to develop and validate a psychic income scale: a principal
component analysis and a confirmatory factor analysis.
This study adopted Crompton’s (2004) psychic income paradigm, which focused
on major-league sports, and modified the seven dimensions to collegiate settings.
Crompton’s framework is considered to be one of the most comprehensive conceptual
approaches measuring community members’ psychological benefits from teams, but
this paradigm has yet to be empirically tested in a published work. Thus, this present
study is believed to be an early step toward validating event host-residents’ psychic
income. To measure college students’ psychic income from their intercollegiate teams,
a modified 7-factor framework was introduced: (a) pride from increased institution
31
visibility, (b) excitement quotient from games, (c) emotional involvement with a team, (d)
tangible focus for social bonding, (e) pride from being a big-time collegiate sport
institution, (f) pride in efforts of additional campus development, and (g) enhanced
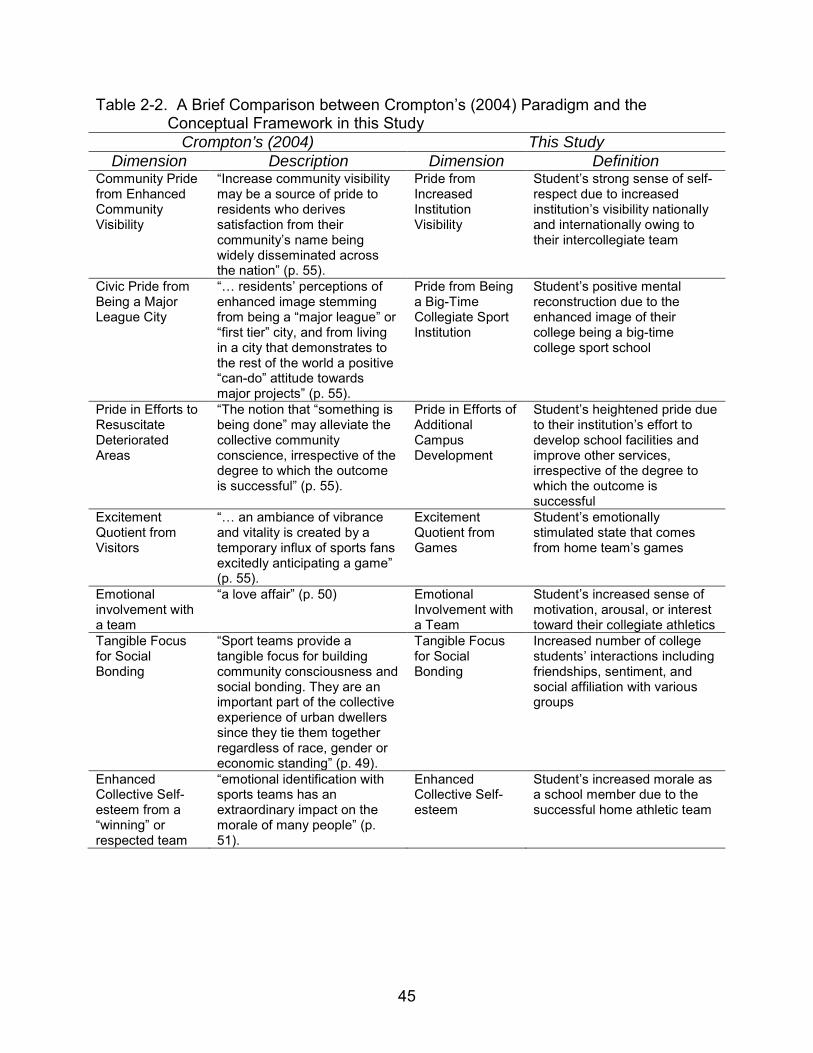
collective self-esteem. Table 2-2 shows a comparison between Crompton’s (2004)
conceptual model and the framework used in this study. In sum, psychic income is the
internally perceived benefit (Crompton, 2004) and the feel-good impact that college
students perceive as a result of their collegiate athletic teams (Hall, 1989).
Pride from Increased Institution Visibility
Given that big-time college sports, especially college football, are among the
most popular spectator sports in the U.S., this dimension of student pride refers to
students’ strong sense of self-respect due to the increased visibility of their institutions
nationally and internationally owing to their intercollegiate athletic teams (Baade et al.,
2007; Crompton, 2004; Gibson, Qi, & Zhang, 2008). When more people watch
collegiate sports, the individual team and its games provide connections between the
school and outsiders. The growth of media coverage is the primary reason for increased
institution visibility. When the NCAA basketball tournament began in 1939, the event
sponsors lost about $2,500, but currently the television broadcast rights for the
tournament alone exceed $550 million each year (Matheson & Baade, 2004). This
lucrative television contract reflects the successful television ratings of big-time college
sports. The NCAA BCS is the second-most watched sport event after the NFL’s Super
Bowl, and its television rating is roughly double the size of the National Basketball
Association (NBA) finals or Major League Baseball (MLB) World Series (Baade et al.,
2007). College sport has become a major form of public entertainment, and newspapers
and television channels are saturated with news about collegiate athletics (Duderstadt,
32
2000). This effect generates a long-term benefit because individual higher education
institutions improve their profile and donation opportunities (Hiller, 1989; Long & Caudill,
1991).
When the media televise college sports, they show not only the game itself, but
often they showcase the school, community, some popular restaurants in town, and
other attributes. As a result, both the colleges and the towns receive national and
perhaps even international attention resulting in increased publicity. An institution’s
enhanced visibility attracts more applicants to the school and the school has more
opportunities to select high-quality students from a larger applicant pool (Smith, 2007;
Pope et al., 2008; McCormick et al., 1987). According to Toma and Cross (1998), 14 of
the 16 schools that won or competed for championships in college football showed
some increase in the freshman application pool following the championship. The
University of Miami and Georgia Institute of Technology are noticeable cases. Miami
showed a 34% increase in admission applications a year after the 1987 championship
and Georgia Tech had a 21% increase after the1990 national championship (Toma et
al., 1998). In the same study, Toma et al. (1998) found that the NCAA men’s basketball
championship was also related to an increase in college admissions but it was not of the
same magnitude as college football. Pope et al. (2008) concluded that it is increasingly
clear that the success of college athletics influences the incoming freshman classes,
and they found that males, African Americans, and high school athletes are more likely
to be influenced by college sports than other applicants. Other researchers claim that
there is no significant relationship between the success of men’s basketball and the
college application increases (Bremmer & Kesselring, 1993; Tucker, 1992; Tucker &
33
Amato, 2006). Even so, extending these results, there is likely also a positive
relationship between college satisfaction and successful intercollegiate athletics
performance. College students likely derive pride and satisfaction from their school
name being known regionally and nationally.
Pride from Being a Big-time Collegiate Sport Institution
College student pride from being at a big-time collegiate sport institution indicates
an individual student’s positive mental reconstruction due to the enhanced image of his
or her college being a big-time college sport school (Johnson & Whitehead, 2000;
Crompton, 2004). Sperber (2000, p. 12) defined a big-time university as “a large public
research university with high-profile football and/or men’s basketball teams playing at
the highest NCAA levels.” The prestige associated with recognizable sport teams and
hosting their games may have tremendous value to students. The intercollegiate team
serves as one way to bring together students, faculty, staff, alumni, and community
members (Duderstadt, 2000; Shulman, 2001). College football games at places like the
University of Michigan, the Ohio State University, and the University of Florida generate
large paid attendance by college football enthusiasts (Baade et al., 2007). In 2008, the
Southeastern Conference (SEC) led college football attendance compared to other
conferences; it attracted more than six million fans and averaged 75,816 at each game
(Kalafa, 2009). College football provides a meaningful connection tool for the local sport
fans who contribute financial support to the athletic department or to the college (Toma,
2003). Although there is conflict with educational values, big-time college sports have
been closely identified with academic institutions and their student campus life
(Duderstadt, 2000).
34
Regardless of its unclear financial outcomes and social value to the institution,
college presidents believe that successful college sports performance promotes their
institution as a major university (Gerdy, 2000). To college presidents and administrators,
big-time college sports are an effective instrument to expand awareness of the school
and to enhance the institution’s positioning (Nguyen & LeBlanc, 2001). Nguyen et al.
(2001) stated that institutional image is “the overall impression made on the public about
an organization,” and it is related to various attributes of the organization. Intercollegiate
athletics certainly serve a functional role, and emotional elements represent the image
of the institution (Belanger, Mount, & Wilson, 2002). College home teams provide
sufficient opportunities to manifest students’ feelings and attitudes toward their
institution. In addition, Gibson, Willming, and Holdnak (2003) discovered that small-
scale events (e.g., college sports) increased community spirit and travelers’ awareness
of the host community. The authors found that students, fans, and residents prided
themselves on being college football fans, but also expressed pride in the university
facilities, the winning record of the team, and the community in which they resided
(Gibson et al., 2003). Based on this, successful athletic teams, specifically football
teams, enhance students’ pride in being from a major college sport school and the
students are likely to perceive the college as attractive. In other words, college students
identify themselves with their athletic team’s image (Bhattachary & Sen, 2003; Tajfel &
Turner, 2004).
Pride in Efforts of Additional Campus Development
Intercollegiate sport is regarded as a service business and big-time college
sports, including football and men’s basketball, raise enough revenue to cover the
expenses of the athletic department (Duderstadt, 2000; Gerdy, 2000; Noll, 2004;
35
Savage, 1929). There is unclear evidence of positive economic impacts of
intercollegiate athletics, however; students likely have heightened pride due to their
institution’s efforts to develop school facilities and improve other services, regardless of
the degree to which the outcome is successful. A collegiate home team has a unique
value to the school and also to the community; thus, its success is difficult to judge with
a basic cost-and-benefit analysis (Gratton, Shibli, & Coleman, 2006; Matheson et al.,
2004). Morgan (1997) posited that sports provide triumphs of the human spirit, social
bonding, and family memories and are about celebrating those things that compose
society, such as competition, victory, and redemption. Thus, active sport participants or
spectators tend to be more aware of indirect sport impacts and ignore the true economic
impacts (Austrain & Rosentraub, 2002).
In addition, most economic or social impact studies in the sport field focus on
mega sport events. These studies show that many believe sport events can revitalize
deteriorated community areas, especially aging downtown areas, and that new or
renovated infrastructure would give a competitive advantage to the community (Chapin,
2004; Hall, 1992; Teye et al., 2002). According to Crompton (2004), a sports facility
stimulates additional development, at least in part as a consequence of increased
visibility and enhanced image. Crompton (2004) specified three types of development
stimulated by hallmark sport events: (a) proximate, (b) complementary, and (c) general.
Proximate development refers to an integrated redevelopment package substantially
close to the facility. Complementary development is the upgrading or beginning of new
businesses responding to the need for those services. The last type of development,
general development, is any attempt to regenerate community image (Crompton, 2004).
36
Several studies have indicated that the rationale for public subsidy of sport
facilities has changed from indirect economic impact to urban redevelopment (Chapin,
2000; Rosentraub, 1997). In the context of college students’ psychic income from their
teams, the addressed rationales are still applicable. Successful intercollegiate
performance enhances students’ expectations of positive economic impact and these
beliefs typically generate students’ pride in the school’s efforts to improve the quality of
college life, including academic services, housing, facilities, recreational activities, clubs,
and the general school environment (Sirgy et al., 2006; Yu et al., 2008; Koilias, 2005).
Although it is still difficult to measure the real monetary impact of intercollegiate
athletics on institutions, previous studies have suggested that at least college students’
sense of school pride becomes greater because of their belief that their school’s
attempts do boost additional campus development and enhance school spirit. This
enhanced sprit increases community members’ pride, as well.
Excitement Quotient from Games
This dimension, excitement quotient from the game and visitors, refers to college
students’ emotionally stimulated states that come from home team games (Chalip,
2006; Green, 2001). Beginning with the first college football match between Rutgers
and Princeton in 1869, the current period is regarded as college football’s greatest era
(Henderson, 2007). The intercollegiate football atmosphere provides excitement to the
students and to fans and community members. It adds to the traditions and history of
the institution and the community (Duderstadt, 2000; Sperber, 2000). The game itself is
a form of art and expression (e.g., Sloan, 1989; Wann, 1995, Miline & McDonald, 1984).
It provides physical activities representing a type of beauty, artistic expression, and
aggression. People cheer at the exciting moments and thereby lower their stress levels.
37
College rivalry games especially increase the perceived excitement level, and this is
quite common in most college towns. Gibson (2002) described the college football
phenomena at one big-time athletic school, the University of Florida (UF). The following
paragraph provides some indication of the excitement of college football:
On the Friday afternoons before the Saturday football games, the excitement is already building in Gainesville. Vehicles on the highways heading towards Gainesville display flags proclaiming their allegiance to the Gators and there is a proliferation of orange and blue clothing (UF colors) worn by administrative staff, students, and fans. Many fans arrive in their recreational vehicles to stake out their spots in the parking lots on and around the university. There are many entrepreneurial students who sell parking spaces in the yards of their houses … The grocery stores close to the university prominently display tailgating supplies at the front of their stores … Every spare space on the UF campus is filled with fans grilling, eating, drinking, and socializing. Some have elaborate tailgate spreads while others have simpler affairs. There are tents, RVs, chairs and tables, coolers, and orange and blue everywhere. About and hour before the game, the fans start closing up their vehicles and begin walking towards the stadium ready to cheer their team … Then all too soon it is Sunday morning and the town is quiet except for the crews cleaning up the trash left by the fans from the day before. Fans who have stayed in town overnight can be seen streaming away from Gainesville, flags will flying on their vehicles, reminiscing about the game the day before. If there is a home game the next weekend, they will repeat the process again. If the game is away, some will travel to follow the Gators on the road, and others will have parties at home to watch the game on television. For Gator football fans everything is scheduled around the football fall season.
Behind the scenes of this ecstasy, there is also the effort of athletic departments
and related organizations. They promote tailgate parties and various activities more
than the event itself to increase the level of excitement, and these activities add an
extraordinary energy to the community (Crompton, 2004; Chalip, 2006). “College
GameDay” is a unique ESPN sports program showing the energy and excitement of the
home team for Saturday’s games. Increased numbers of visitors in a short period of
time may cause noise, traffic, and disruption (Waitt, 2003), but the enhanced excitement
among college students and visitors is inevitable, mutually transferable, and contagious.

38
In the late 1990s, there was public concern about student alcohol consumption; several
schools endeavored to ban alcohol in undergraduate housing units, but student drinking
did not diminish and was regarded as a freedom of choice (Sperber, 2000). Duderstadt
(2001) similarly reported that any controversial issues regarding intercollegiate athletics
were treated as minimal because of the university’s various forms of public service,
including providing medical centers, technology development, concerts, and
recreational opportunities. The impact on students’ excitement levels may depend on a
team’s performance, reputation, tradition, and history; however, college students’
stimulated emotion is classic and they positively respond to the efforts of the athletic
department and game.
Emotional Involvement with a Team
Since students wear apparel indicating their school by colors, logos, and words
on college game days, intercollegiate sports are a medium through which schools
express their status and attributes to other schools and a national audience (Crompton,
2004). Emotional involvement with a home team refers to college students’ increased
sense of motivation, arousal, or interest toward their collegiate athletics. Students who
are involved with their athletic team can be expected to feel better about them and
these students are typically committed to the school. Astin (1984) referred to
involvement as “the investment of physical and psychological energy in various objects.”
In the context of sports, sport involvement can be indicated by self-reference as a fan or
fan participation, spectating, and consumption behaviors (Clopton, 2005).
Involvement itself has been an important theme for marketing researchers
because it influences consumers’ behavior and their decision-making procedures (e.g.,
Assael, 1992; Bloch, Sherrell, & Ridgeway, 1986; Donovan & Jelleh, 1999). A consumer
39
demonstrating high levels of involvement exhibits higher loyalty to certain products, and
the same relationship exists between sport spectators and their teams (McGehee,
Yoon, & Cardnesnas, 2003). McGehee et al. (2003) found that individuals who have
higher levels of involvement with running events exhibited frequent participation in
running events and also increased spending on running-related goods and services. In
the field of the human resource management, several studies have also found a high
correlation between job involvement and job satisfaction (Blau & Boal, 1987; Knoop,
1995).
Individuals’ involvement with a team occurs when they put personal meanings
into the sport events and realize pleasure or interest from the team (Havitz & Dimanch,
1999). Sport teams are a medium to express individuals’ personality and enhance their
status (Crompton, 2004). The relationship between sport teams and their fans can be
referred to as “a love affair,” which is not unlike a marriage (Crompton, 2004). College
students talk about last Saturday’s football game with classmates and they often know
critical games, popular players, and game schedules better than they know some class
materials. They search for detailed information online and plan for the next game.
Intercollegiate athletics provide a sense of involvement within the university, local
community, and sometimes within the state or region (Clopton, 2005). The degree of
individual student involvement differs from one to another, but college sports can be a
method of involving students with the university. Clopton (2005) indicated that higher
education institutions may use intercollegiate athletic teams as a potential “club” or
“activity.” This realized pleasure, emotional involvement with a team, enhances
40
students’ perception of the importance of, interest in, and pleasure from intercollegiate
sports.
Tangible Focus for Social Bonding
Big-time intercollegiate sports provide for an increased number of college
students’ interactions, including friendships, sentiments, and social affiliations with
various groups (Sperber, 2000; Duderstadt, 2001). Social interaction is an important
factor for an individual’s well-being in society and several research projects have
substantiated the proposition that sports can increase an individual’s affiliation with
others (e.g., Funk, Mahony, & Ridinger, 2002; Trail & James, 2001; Wann, 1995).
Sports reflect the human sprit, social bonding, family memories, competition, and victory
(Morgan, 1997). The enhanced social bonding improves college students’ social
relations, generates teamwork, and decreases feelings of social alienation (e.g., Collins,
2004; Crompton, 2004; Frey & Eitzen, 1991; Washington & Karen, 2001). When people
watch and enjoy sport games with family, their family time also increases (Eitzen, 2005:
Funk, Mahony, Nakazawa, & Hirakawa, 2001; Wann, 1995). Collegiate sports provide
additional tangible socializing opportunities that include tailgating, rituals, ancillary
events, and informal social opportunities (e.g., Chaplip, 2006; Coakley, 2001).
According to Maslow’s (1943) needs hierarchy, individuals attempt to fulfill a
sense of belonging in their community when they transition to higher levels. Miline and
McDonald (1999) suggested 12 motivation constructs for sport spectators within
Maslow’s hierarchy and listed two dimensions, affiliation and social facilitation, related to
social bonding. According to Miline et al. (1999), affiliation is “connecting or associating
oneself with the need to interact, socialize with others, and belong.” The authors defined
social facilitation as “the social gratification of being with others who enjoy the same
41
activity” and asserted that sport spectators and participants have more opportunities to
spend time with family members, friends, and business associates. Wann (1995) used
the term “affiliation” in his sport fan motivation study and stated that people desire to
maintain group contacts and avoid feelings of alienation. Social bonding enhances
individuals’ sense of belonging and achievement (Bourne & Ekstrand, 1985). The
described impact of socialization is also applicable to community settings, when local
residents seek interaction and a sense of belonging in social groups to fulfill their needs.
It can be met through fan behavior, such as attending games, watching sport programs,
wearing sport-related apparel, and discussing sports with others (Shank, 2005).
Although the game duration is short, college students have various tangible socializing
opportunities pre- and post-game (Eitzen, 2005). To many individuals, this social
opportunity is important to create, maintain, and strengthen camaraderie, family ties,
and social interactions with others.
Enhanced Collective Self-esteem
In the context of the current research, enhanced collective self-esteem refers to
an individual college student’s increased morale as a school member due to successful
home athletic teams. According to social identity theory (Brown, 2000; Tajfel, 1982;
Tajfel & Turner, 1979), self-concept has two distinct aspects: personal identity and
social identity. Individuals see themselves not only as one single person, but also as a
member of a social group. Later studies differentiated three aspects of identity rather
than two: personal, social, and collective identity (Check, 1989; Hui, 1988; Triandis,
1989; Triandis, Bontempo, Villareal, Asai, & Luccs, 1988). This collective identity is
similar to the social identity in Tajfel and Turner’s early social identity studies (Cheek,
1989), and several terms are used interchangeably, including social identity, collective
42
identity, organizational identity, and group identity (Heere & James, 2007a). This
collective identity contributes to not only an individual’s self-conception but also his or
her self-evaluation (Brewer & Gardner, 2004; Hardy, Lawrence, & Grant, 2005). The
issue of team identity has been an important topic in sport management (Heere &
James, 2007b; Madrigal, 2001; Wann & Pierce, 2003) and individuals have identified
themselves with other members using sport as an instrument (Anderson & Stone,
1981).
An individual student’s collective identity or collective self-esteem derives from
membership in a social group such as home athletic team fans. As Crompton’s (2004,
p. 56) self-esteem dimension refers to “enhanced collective self-esteem from a winning
or respected team,” college students’ collective self-esteem is positive when the value
of their teams is greater than the value of others’ (Luhtanen & Crocker, 1992). Some
researchers explain this behavior with basking in reflected glory (BIRGing) and cutting
off reflected failure (CORFing) (e.g., Kahle, Lynn, & Chris, 2004; Milne & McDonald,
1999; Trail, Anderson, & Fink, 2003). Trail et al. (2003) used the term “self-esteem
maintenance behaviors” to describe this phenomenon and asserted that people build
self-esteem through their association with successful teams but maintain existing self-
esteem levels by distancing themselves from poorly performing teams. The college
sport atmosphere gives students a feeling of accomplishment and achievement when
the team succeeds (Wann, 1995).
Individuals in modern society exhibit limited collective consciences because
societies are highly complex and members are likely to be alienated from each other
(Eckstein & Delaney, 2002). However, sport is a medium through which social groups

43
express their identities and shared beliefs (Branscombe & Wann, 1991; Heere & James,
2007a). Collegiate athletics also enhance community self-esteem, including improved
quality of life, a wider variety of cultural activities, enhanced community identity, and
increased recreational opportunities (Delamere, Wankel, & Hinch, 2001; Haley, Smith, &
Miller, 2005; Ko & Stewart, 2002; William & Lawson, 2001).
44
Table 2-1. Examples of Social Impact Analysis (SIA) Framework
SIA
Dwyer, Mellor,
Mistills, & Mules (2000) Wood (2006)
Gramling & Freudenburg
(1992)
Haley, Snaith, &
Miller (2005)
The Interorganizational Committee (2003)
Delamere, Wankel, & Hinch (2001)
Social
Social benefits Social costs
Physical Social
Positive social impacts
Negative social impacts
Population change Community and
institutional structures
Community and family changes
Community resources
Community benefits Quality of life
concerns
Economic
Economic benefits Economic costs
Economic
Community resource concerns
Cultural Cultural
Cultural/Educational
benefits
Political Political/legal
Political and social
resources
Psychological Psychological
45
Table 2-2. A Brief Comparison between Crompton’s (2004) Paradigm and the Conceptual Framework in this Study
Crompton’s (2004) This Study Dimension Description Dimension Definition
Community Pride from Enhanced Community Visibility
“Increase community visibility may be a source of pride to residents who derives satisfaction from their community’s name being widely disseminated across the nation” (p. 55).
Pride from Increased Institution Visibility
Student’s strong sense of self-respect due to increased institution’s visibility nationally and internationally owing to their intercollegiate team
Civic Pride from Being a Major League City
“… residents’ perceptions of enhanced image stemming from being a “major league” or “first tier” city, and from living in a city that demonstrates to the rest of the world a positive “can-do” attitude towards major projects” (p. 55).
Pride from Being a Big-Time Collegiate Sport Institution
Student’s positive mental reconstruction due to the enhanced image of their college being a big-time college sport school
Pride in Efforts to Resuscitate Deteriorated Areas
“The notion that “something is being done” may alleviate the collective community conscience, irrespective of the degree to which the outcome is successful” (p. 55).
Pride in Efforts of Additional Campus Development
Student’s heightened pride due to their institution’s effort to develop school facilities and improve other services, irrespective of the degree to which the outcome is successful
Excitement Quotient from Visitors
“… an ambiance of vibrance and vitality is created by a temporary influx of sports fans excitedly anticipating a game” (p. 55).
Excitement Quotient from Games
Student’s emotionally stimulated state that comes from home team’s games
Emotional involvement with a team
“a love affair” (p. 50) Emotional Involvement with a Team
Student’s increased sense of motivation, arousal, or interest toward their collegiate athletics
Tangible Focus for Social Bonding
“Sport teams provide a tangible focus for building community consciousness and social bonding. They are an important part of the collective experience of urban dwellers since they tie them together regardless of race, gender or economic standing” (p. 49).
Tangible Focus for Social Bonding
Increased number of college students’ interactions including friendships, sentiment, and social affiliation with various groups
Enhanced Collective Self-esteem from a “winning” or respected team
“emotional identification with sports teams has an extraordinary impact on the morale of many people” (p. 51).
Enhanced Collective Self-esteem
Student’s increased morale as a school member due to the successful home athletic team
46
Figure 2-1. Crompton’s (2004) Framework
Community pride as a result of increased visibility
Civic pride from being a major sport event host city
Enhanced collective self-esteem
Excitement from an event and visitors
Tangible focus for social bonding
Psychic income
Emotional involvement with a sport event
Pride in efforts to resuscitate deteriorated
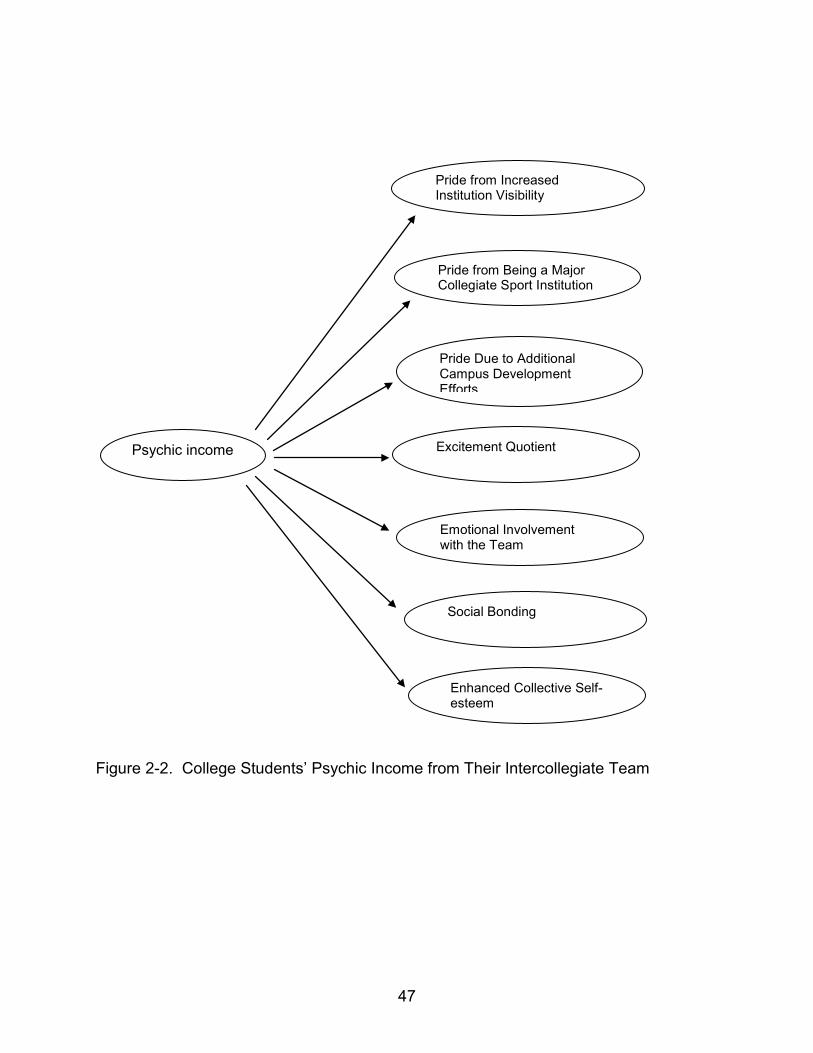
47
Figure 2-2. College Students’ Psychic Income from Their Intercollegiate Team
Pride from Increased Institution Visibility
Pride from Being a Major Collegiate Sport Institution
Social Bonding
Excitement Quotient
Emotional Involvement with the Team
Psychic income
Enhanced Collective Self-esteem
Pride Due to Additional Campus Development Efforts
48
CHAPTER 3 METHODOLOGY
This chapter identified methods used in this study to examine the relationship
between college satisfaction and students’ psychic income from their athletic teams. In
light of limited research measuring residents’ psychological benefits, this study put
relatively high focus on the development of a scale of psychic income as an initial stage
to conduct further psychological benefit analysis studies. To obtain empirical data,
online surveys were conducted. Confirmatory factor analysis (CFA) and multiple
regression analysis were the primary statistical techniques. This section presents the
methods in the following order: (a) item generation, (b) data collection, and (c) data
analyses.
Item Generation
Initially, a list of items was generated for each component of the psychic income
framework through a comprehensive literature review. Table 3-1 includes the tentative
initial item pool for the each dimension. Multiple measures for each construct of psychic
income were developed and modified from existing college satisfaction, social impact,
and attitude studies (e.g., Andereck, Valentine, Knopf, & Vogt, 2005; Burnett, 2001;
Cha, 2003; Choi et al, 2001; Delamere, Wankel, & Hinch, 2001; Dyer, Gursoy, Sharma,
& Carter, 2007; Fredline & Faulkner, 1998; Gursoy & Rutherford, 2004; Gramling &
Freudenburg, 1992; Kim et al., 2009; Ko & Stewart, 2002; Koilias, 2005; Lee & Back,
2003; Okun et al., 1990; Sirgy et al., 2006; Teye, Sönmenz, & Sirakaya, 2002; Yu et al.,
2008). Most of these items have been used previously in the fields of tourism and event
management; thus, wording was appropriately modified for this intercollegiate sport
49
impact study. All items were measured with a Likert-type scale ranging from 1 (strongly
disagree) to 7 (strongly agree).
For refinement of the initial scales, face and content validity were assessed
through a group interview, a panel of experts, and a field test. To establish a definition
of the research framework, five university undergraduate students participated in the
group interview session. The purpose of the group interview was exploratory to pre-test
the suggested seven dimensions. The interview was informally conducted, but each
interviewee was requested to return a package related to content validity. All
participants verified each dimension from the suggested framework and none
determined additional dimensions. The package used for the group interview is
presented in Appendix A.
Following the group interview, 60 preliminary scale items were submitted to an
expert panel composed of six individuals with academic backgrounds in the fields of
sport, tourism, and sociology. Detailed information about the purpose of the study and
specific directions for making judgments on the selection of the initial scale items were
provided. The panelists reviewed the initial items with respect to their face and content
validity to evaluate how well each measure covered the range of meanings within the
concept (Babbie, 1992). The panel members rated each item on a 7-point Likert-type
scale anchored by 1 (not relevant at all) and 7 (very relevant). The members also
ensured the clarity, readability, format, and content of the study instrument and provided
suggestions for rewording items (Churchill, 1979; Likert, 1968). Several items were
deleted or reworded to enhance their clarity. Also, a phrase was added to some items.
For example, one of the items was originally phrased “Gator football increases media
50
coverage of UF.” Based on the feedback from panel members, the item was changed to
“I am proud because Gator football increases media coverage of UF.” The cover letter
and the items for panel review are presented in Appendix B.
After the panel reviews, the remaining 45 scale items were tested and revised to
identify ambiguities, misunderstandings, or other inadequacies of the instrument (Ary,
Jacobs, Rajavieh, & Sorensen, 2005). The revised version of the instrument was
administered to a group of students from the University of Florida, who also represented
the target population. Ten individuals answered the questionnaires and provided
feedback on any difficulties they had with the items. One item, “I am proud because
Gator football provides UF an opportunity to improve their sport facilities,” was deleted
because of its irrelevance and ambiguity. Several comments on reversal items were
addressed by participants but they were intentionally included in this study to avoid
survey breakoff. According to Peytchev (2009), survey respondents fail to complete all
the questionnaires because of unique and common causes such as survey design,
characteristics of questionnaires, respondent factors, and models for data quality. Since
this current study lacks variation in question characteristics, four reversed items were
retained: (a) Gator football games disturb me, (b) being a Gator football fan is difficult
for me, (c) my campus life would be the same without Gator football, and (d) I don’t
think that UF’s visibility is solely dependent upon Gator football.
After the field test, a pilot test was employed to test the appropriateness of the
instrument and to eliminate poorly performing items (Ary et al., 2005). The online
instrument was administered to pilot-test participants to assess whether the study
instrument performed well after the previously described scale refinement steps (Ary et
51
al., 2006). The participants were 42 university students. This pilot test aimed also to
further examine content validity from the perspective of the targeted population by
testing the reliability of each scale dimension. To gauge the reliability of scale items in
each dimension, Cronbach’s alpha coefficients, corrected item-total correlations,
means, standard deviations, and Cronbach’s alphas if item deleted, as suggested by
Hair, Black, Anderson, and Tatham (2006), were assessed. The seven Cronbach’s
alphas from the tested dimensions ranged from .626 to .863 indicating that the scale
items in the specified factors were internally consistent except in one dimension, social
bonding. One item, “I don’t attend Gator football games in person alone,” from this
specific dimension was eliminated to improve its internal consistency to .792.
Eliminating several other items could also have increased reliability of specific factors.
However, they were retained because of their purpose as reversed items to prevent
potential survey breakout. After eliminating the one item, all Cronbach’s alphas for each
dimension were greater than .70 (Hair et al., 2006). Other changes were not identified
as needed and 43 final items were retained after the pilot data analysis. The final scale
included seven factors with five to eight items representing each factor. Table 3-2
provides the results of the pilot data reliability test.
The final survey included items to measure participants’ global college
satisfaction levels. The following three items suggested by Sirgy et al. (2007) were used
in this study because of adequate generalizability. Sirgy et al. used a sample of
students from the campuses of three major universities in the United States. The main
data from this current study also presented a high-reliability coefficient (α= .957). The
suggested items attempt to determine overall feelings of satisfaction with the life at a
52
college: (a) In general, how satisfied are you with the overall quality of life at
(College/University); that is, your academic and social life on campus? (b) How satisfied
are you with the overall quality of life for you personally at (College/University)? (c) How
satisfied, would you say, most of your friends and other classmates are with the overall
quality of life at (College/University)? Table 3-3 summarizes overall college satisfaction
items from several other studies. For the purposes of sample description, demographic
background variables were included in the questionnaire. Participants voluntarily
answered the following questions: gender, race, school classification, school enrollment
status, age, annual household income range, scholarship status, and percentage of
family support for college expenses.
Data Collection
The population for this study was college students who were at least 18 years old
and currently enrolled at the University of Florida (UF). The target intercollegiate athletic
team was the University of Florida’s football team. The university is located in the city of
Gainesville in North Central Florida and is one of the five largest universities in the U.S.
(UF, 2009). The UF football team competes in the SEC of the NCAA. After formation of
UF’s first varsity football team in 1906, the Gators have won eight SEC championships
and three national championships in 1996, 2006, and 2008 (NCAA, 2009). The Gators
are one of the top teams in the country and they typically play seven home and five
away games per season. On average 90,000 fans attend each home game and there
are 60,000 non-student and 21,500 student season-ticket holders (Hickman, 2009).
Almost 80% of the general ticket holders travel for Gator home games (Gibson, 2002).
Research participation for this survey was voluntary and the respondents were
eligible if they were currently enrolled as a student at UF. The study did not require their
53
active participation or involvement with the Gator football team because it examined
individuals’ cognitive evaluation of their team. To reduce data collection bias, this study
used a uni-mode survey design, which was online data collection. The target population,
UF students, had sufficient potential respondents (the total number of students in 2009
was 52,271; UF, 2009) and each participant had relatively easy Internet access
compared to the general public. Therefore, an online survey design was appropriate for
the study (Kraut, Olson, Banaji, Bruckman, Cohen, & Couper, 2004). Online surveys are
probably the most cost-effective tool for data collection if the target population is college
students or employees (Matsuo, McIntyre, Tomazic, & Katz, 2005). Additional
advantages of online surveys are (a) efficient statistical compilation, (b) no time
constraints for participants, (c) low cost in general, (d) higher response rates, and (e)
access to unique populations (Kraut et al., 2004; Wright, 2005).
Respondents were selected by a judgment sampling method. As an extension of
convenience sampling, this sampling method is commonly used when the chosen
sample is representative of the entire population based on the researcher’s knowledge
and judgment about the population and the purpose of the study (Ary, Jacobs,
Razavieh, & Sorensen, 2006; Babbie, 2007). This specific type of sampling method has
relatively low costs and requires less time in the data collection process (Ary et al.,
2006).
Several class instructors at UF were contacted to obtain permission to conduct
the study. Five course instructors allowed the researcher to recruit potential survey
participants via an e-mail invitation, as well as by visiting classes. Students from
suggested courses were diverse in terms of their major and demographic
54
characteristics. The invitation contained a brief explanation of the purpose of the study,
survey instructions, and a link to an online Web site where the survey questionnaire was
posted. The data were collected for two months, beginning with the second week of
April 2010. During this period, two survey reminders were sent out and a thank-you e-
mail was sent at the end of the period. Respondents were assured that the information
they provided would be anonymous and an informed consent form was provided to
each participant on the first page of the online Web site. Participants began the survey
after clicking “NEXT” if they agreed to participate in the research study and agreed to
the terms addressed in the consent form. The survey instrument included three
sections: an informed consent form, scale items of psychic income and college
satisfaction, and participants’ demographic characteristics. The online survey is
presented in Appendix C.
Prior to distributing the survey invitation, the Institutional Review Board (IRB)
approved the research and acknowledged that it observed designated institutional
research protocols (Ary et al., 2006). The instrument required approximately 15 minutes
to complete. To determine the sample size of this study, Kline’s (2005) suggestion of
least 10 respondents for each observed variable was adopted. Considering that the
scale items for the main study had a total of 44 observed variables, the target sample
size was 440.
Data Analysis
This study was designed to develop a valid and reliable scale to measure college
students’ psychic income from their big-time intercollegiate football team and to
examine the link between this psychological benefit and college satisfaction. The
underlying structure for this study was adopted from Crompton’s (2004) conceptual
55
framework of psychic income (PI). Each factor was defined, and the literature supported
the model specifications in this study. Variables of each factor were assigned after three
stages: (a) item generation, (b) item purification through a panel of experts and a field
test, and (c) pretesting of the survey instrument through a pilot test. The main data used
confirmatory factor analysis to finalize the number of factors existing within a set of
variables (Hair et al., 2006; Suhr, 2006).
SPSS 15.0 (George & Mallery, 2006) and LISREL 8.51 (Jöreskog & Sörbom,
1996) were used to describe the demographic information, test reliability coefficients,
and test the hypothesized measurement model. Procedures in SPSS version 15.0
(SPSS, 2006) were carried out to calculate descriptive statistics for sociodemographic
variables, and various SPSS programs determined each variable’s accuracy of data
entry, outliers, and deviation from normality through the examination of histograms and
summary descriptive statistics prior to the main analysis.
A CFA using maximum likelihood (ML) estimation was conducted to confirm
whether observed items loaded on pre-specified latent constructs. The researcher used
five CFA steps suggested by Tabachnick and Fidell (2006): (a) model specification, (b)
identification, (c) model estimation, (d) testing model fit, and (e) model respecification.
To test the overall fit of the CFA model, χ2 goodness-of-fit and the following fit indexes
were used: root mean square error of approximation (RMSEA), standardized means
square residual (SRMR), non-normed fit index (NNFI), and comparative fit index (CFI).
The higher chi-square test statistics (χ2) indicate how well the proposed model fits the
covariance matrix. However, this number is sensitive to sample size so normed chi-
square (NC, χ2/df) was used (Kline, 2005). Values of the normed chi-square, ranging
56
from 2.0 to 3.0 and as high as 5.0, have been recommended as an indicator of
reasonable fit (Bollen, 1989). Because of the sample size limitations with the chi-square
test, the other fit indexes were required to examine model fit.
For the RMSEA, Browne et al. (1992) suggested that values of less than .05
indicate a close fit to the model. Values in the range of .05 to .08 indicate a reasonable
error or approximation, and values greater than .10 indicate poor fits. According to
MacCallum, Browne, and Sugawara (1996), the value between .08 and .10 indicates
mediocre fit. Standardized means square residual is based on the differences between
the observed covariance matrix and the predicted covariance measuring the mean
absolute value of the covariance. Therefore, lower values of SRMR are desired for the
expected model fit. When the SRMR value is less than .10, it indicates a good model fit
(Kline, 2005). CFI is one of the incremental or comparative fit indexes (Kline, 2005). A
rule of thumb for the CFI is that values greater than .90 may well represent a
reasonable approximation of the data (Hu et al. 1999). NNFI, also known as the Tucker-
Lewis index (TLI), has a good fit if it is close to 1.00. Hair et al. (2006) suggested .90 as
the cutoff point when the sample size is greater than 250 and the number of observed
variables is more than 30. Since RMSEA does not account for sample size, RMSEA
does not provide useful information with complex models when the sample size is small.
To interpret parameter estimates, to determine distinct constructs and the
reliability of the scale, the following values were calculated: Cronbach’s coefficient alpha
(α), construct reliability (CR), and the average variance extracted (AVE). The
convergent validity was assessed by its indicator loadings and its t values to test how
well each indicator loads on each specified latent construct (Netemeyer, Johnson, &
57
Burton, 1990). Item loadings should be equal to or greater than .5, but (preferably) .7
would be considered acceptable (Hair et al., 2006). Discriminant validity was also
examined to determine how distinct the constructs are from one another. This specific
validity was established by examining whether the AVE for each construct is greater
than the squared correlation of the two referent factors (Fornell & Larcker, 1981). Kline
(2005) added that discriminant validity can be established when inter-factor correlation
is below .85. The recommended cutoff point of .70 was adopted for the internal
consistency (α) and CR (Nunnally & Bernstein, 1994). The reference point for AVE was
.50 or higher, as suggested by Hair et al. (2006).
Lastly, hierarchical multiple regression analysis was employed to identify the
predictors. This method is preferable for the investigator to control the order of entry of
predictors based on theoretical considerations (Berger, 2004). To find the degree to
which multiple predictors are related to the dependent variable, the square of the
correlation coefficient R (R2) was measured (George et al., 2007) and the overall
tolerance and variance inflation factor (VIF) were calculated to examine the possibility of
over-fitting because of potential multicollinearity. According to Hair et al. (2008), a
tolerance of greater than .10 and a VIF of less than 10 indicate a lack of
multicollinearity.
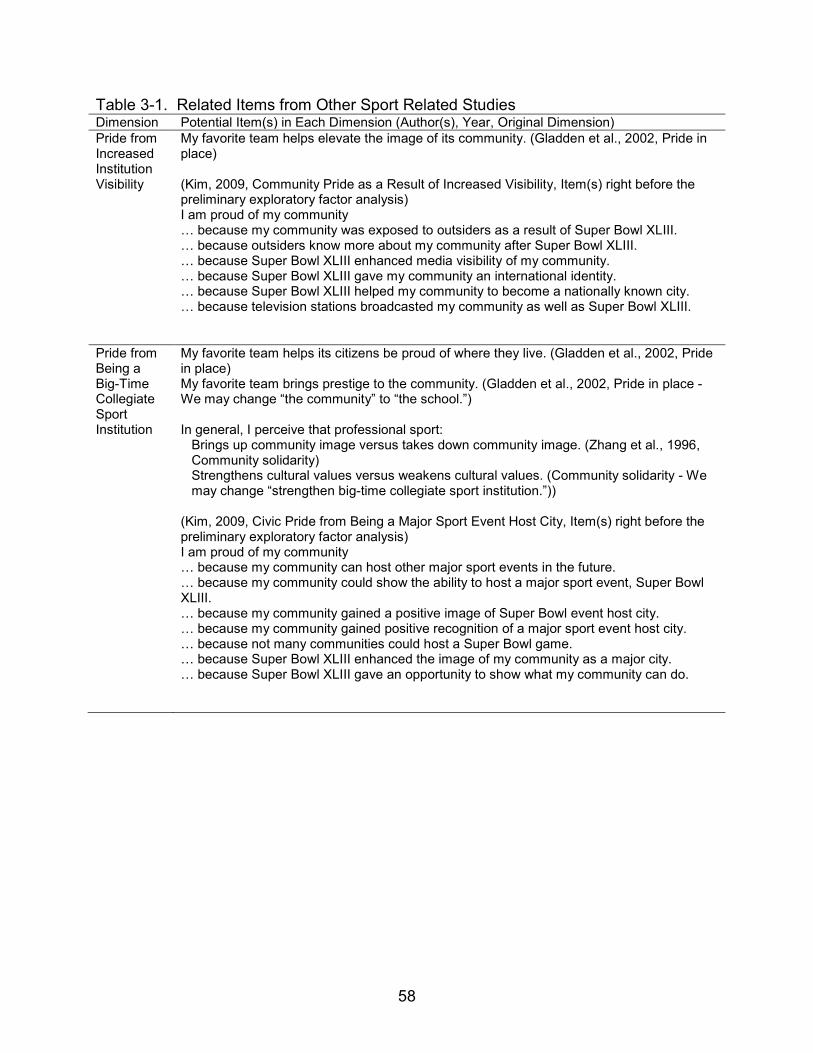
58
Table 3-1. Related Items from Other Sport Related Studies Dimension Potential Item(s) in Each Dimension (Author(s), Year, Original Dimension) Pride from Increased Institution Visibility
My favorite team helps elevate the image of its community. (Gladden et al., 2002, Pride in place) (Kim, 2009, Community Pride as a Result of Increased Visibility, Item(s) right before the preliminary exploratory factor analysis) I am proud of my community … because my community was exposed to outsiders as a result of Super Bowl XLIII. … because outsiders know more about my community after Super Bowl XLIII. … because Super Bowl XLIII enhanced media visibility of my community. … because Super Bowl XLIII gave my community an international identity. … because Super Bowl XLIII helped my community to become a nationally known city. … because television stations broadcasted my community as well as Super Bowl XLIII.
Pride from Being a Big-Time Collegiate Sport Institution
My favorite team helps its citizens be proud of where they live. (Gladden et al., 2002, Pride in place) My favorite team brings prestige to the community. (Gladden et al., 2002, Pride in place - We may change “the community” to “the school.”) In general, I perceive that professional sport:
Brings up community image versus takes down community image. (Zhang et al., 1996, Community solidarity) Strengthens cultural values versus weakens cultural values. (Community solidarity - We may change “strengthen big-time collegiate sport institution.”))
(Kim, 2009, Civic Pride from Being a Major Sport Event Host City, Item(s) right before the preliminary exploratory factor analysis) I am proud of my community … because my community can host other major sport events in the future. … because my community could show the ability to host a major sport event, Super Bowl XLIII. … because my community gained a positive image of Super Bowl event host city. … because my community gained positive recognition of a major sport event host city. … because not many communities could host a Super Bowl game. … because Super Bowl XLIII enhanced the image of my community as a major city. … because Super Bowl XLIII gave an opportunity to show what my community can do.
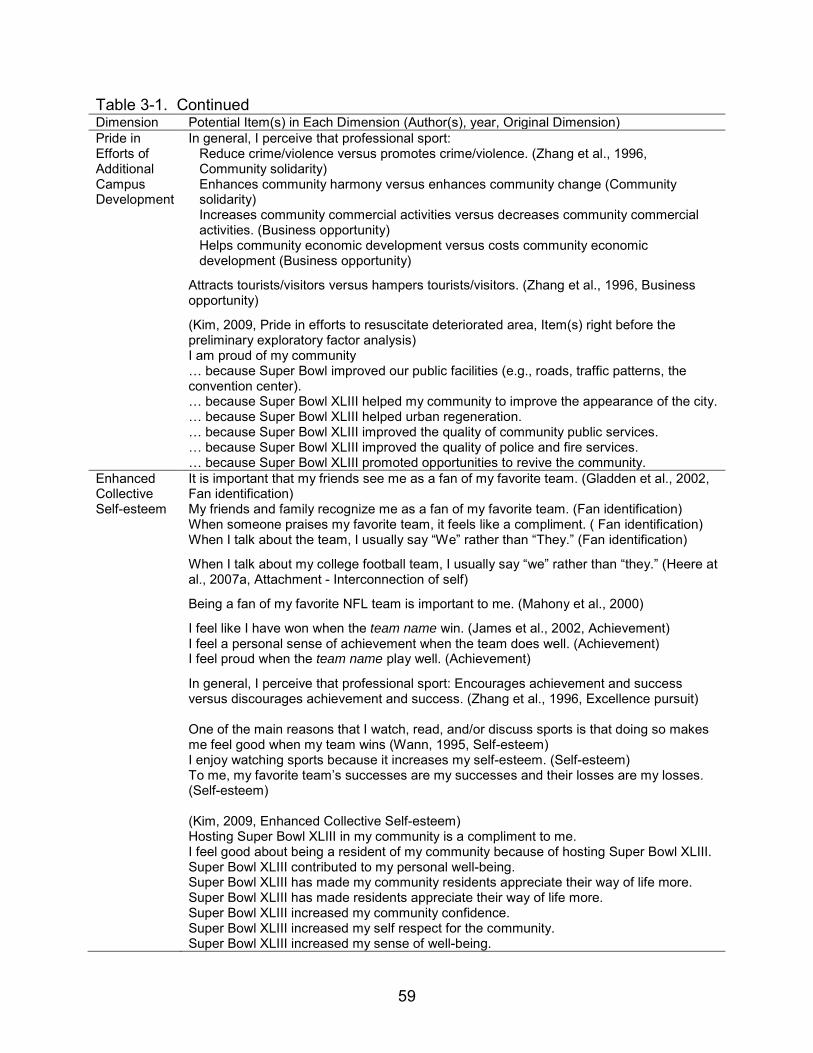
59
Table 3-1. Continued Dimension Potential Item(s) in Each Dimension (Author(s), year, Original Dimension) Pride in Efforts of Additional Campus Development
In general, I perceive that professional sport: Reduce crime/violence versus promotes crime/violence. (Zhang et al., 1996, Community solidarity) Enhances community harmony versus enhances community change (Community solidarity) Increases community commercial activities versus decreases community commercial activities. (Business opportunity) Helps community economic development versus costs community economic development (Business opportunity)
Attracts tourists/visitors versus hampers tourists/visitors. (Zhang et al., 1996, Business opportunity)
(Kim, 2009, Pride in efforts to resuscitate deteriorated area, Item(s) right before the preliminary exploratory factor analysis) I am proud of my community … because Super Bowl improved our public facilities (e.g., roads, traffic patterns, the convention center). … because Super Bowl XLIII helped my community to improve the appearance of the city. … because Super Bowl XLIII helped urban regeneration. … because Super Bowl XLIII improved the quality of community public services. … because Super Bowl XLIII improved the quality of police and fire services. … because Super Bowl XLIII promoted opportunities to revive the community.
Enhanced Collective Self-esteem
It is important that my friends see me as a fan of my favorite team. (Gladden et al., 2002, Fan identification) My friends and family recognize me as a fan of my favorite team. (Fan identification) When someone praises my favorite team, it feels like a compliment. ( Fan identification) When I talk about the team, I usually say “We” rather than “They.” (Fan identification)
When I talk about my college football team, I usually say “we” rather than “they.” (Heere at al., 2007a, Attachment - Interconnection of self)
Being a fan of my favorite NFL team is important to me. (Mahony et al., 2000)
I feel like I have won when the team name win. (James et al., 2002, Achievement) I feel a personal sense of achievement when the team does well. (Achievement) I feel proud when the team name play well. (Achievement)
In general, I perceive that professional sport: Encourages achievement and success versus discourages achievement and success. (Zhang et al., 1996, Excellence pursuit) One of the main reasons that I watch, read, and/or discuss sports is that doing so makes me feel good when my team wins (Wann, 1995, Self-esteem) I enjoy watching sports because it increases my self-esteem. (Self-esteem) To me, my favorite team’s successes are my successes and their losses are my losses. (Self-esteem) (Kim, 2009, Enhanced Collective Self-esteem) Hosting Super Bowl XLIII in my community is a compliment to me. I feel good about being a resident of my community because of hosting Super Bowl XLIII. Super Bowl XLIII contributed to my personal well-being. Super Bowl XLIII has made my community residents appreciate their way of life more. Super Bowl XLIII has made residents appreciate their way of life more. Super Bowl XLIII increased my community confidence. Super Bowl XLIII increased my self respect for the community. Super Bowl XLIII increased my sense of well-being.
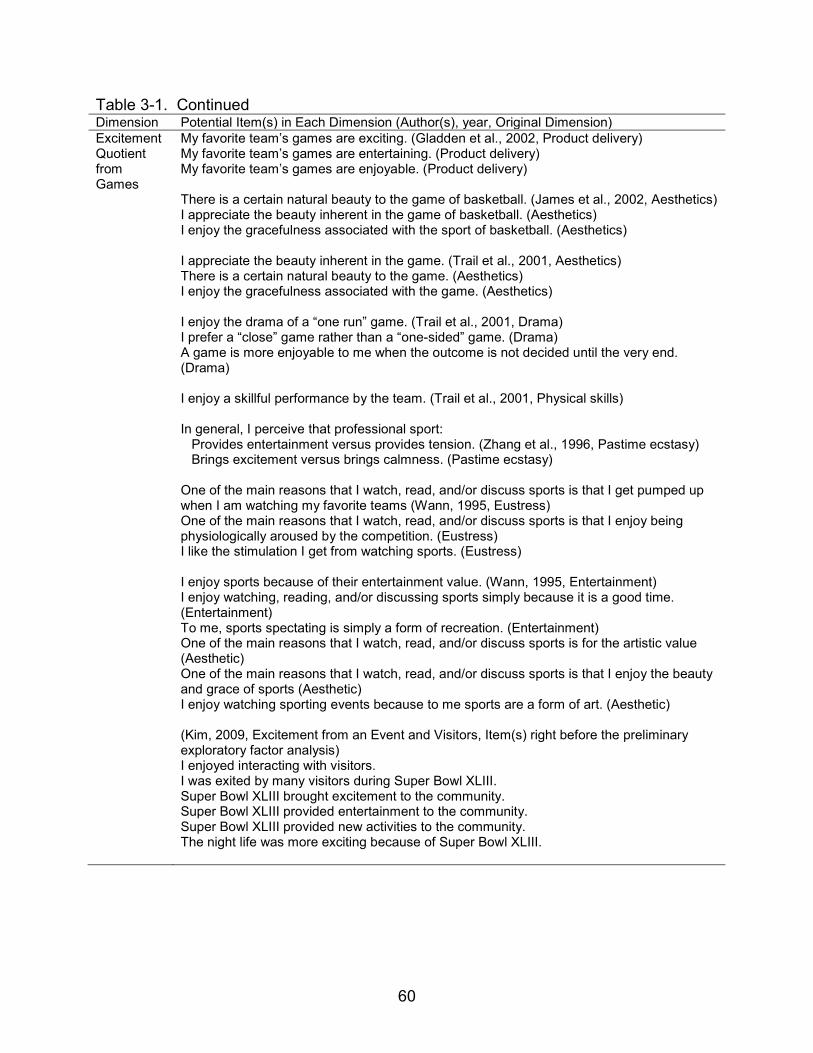
60
Table 3-1. Continued Dimension Potential Item(s) in Each Dimension (Author(s), year, Original Dimension) Excitement Quotient from Games
My favorite team’s games are exciting. (Gladden et al., 2002, Product delivery) My favorite team’s games are entertaining. (Product delivery) My favorite team’s games are enjoyable. (Product delivery) There is a certain natural beauty to the game of basketball. (James et al., 2002, Aesthetics) I appreciate the beauty inherent in the game of basketball. (Aesthetics) I enjoy the gracefulness associated with the sport of basketball. (Aesthetics) I appreciate the beauty inherent in the game. (Trail et al., 2001, Aesthetics) There is a certain natural beauty to the game. (Aesthetics) I enjoy the gracefulness associated with the game. (Aesthetics) I enjoy the drama of a “one run” game. (Trail et al., 2001, Drama) I prefer a “close” game rather than a “one-sided” game. (Drama) A game is more enjoyable to me when the outcome is not decided until the very end. (Drama) I enjoy a skillful performance by the team. (Trail et al., 2001, Physical skills) In general, I perceive that professional sport:
Provides entertainment versus provides tension. (Zhang et al., 1996, Pastime ecstasy) Brings excitement versus brings calmness. (Pastime ecstasy)
One of the main reasons that I watch, read, and/or discuss sports is that I get pumped up when I am watching my favorite teams (Wann, 1995, Eustress) One of the main reasons that I watch, read, and/or discuss sports is that I enjoy being physiologically aroused by the competition. (Eustress) I like the stimulation I get from watching sports. (Eustress) I enjoy sports because of their entertainment value. (Wann, 1995, Entertainment) I enjoy watching, reading, and/or discussing sports simply because it is a good time. (Entertainment) To me, sports spectating is simply a form of recreation. (Entertainment) One of the main reasons that I watch, read, and/or discuss sports is for the artistic value (Aesthetic) One of the main reasons that I watch, read, and/or discuss sports is that I enjoy the beauty and grace of sports (Aesthetic) I enjoy watching sporting events because to me sports are a form of art. (Aesthetic) (Kim, 2009, Excitement from an Event and Visitors, Item(s) right before the preliminary exploratory factor analysis) I enjoyed interacting with visitors. I was exited by many visitors during Super Bowl XLIII. Super Bowl XLIII brought excitement to the community. Super Bowl XLIII provided entertainment to the community. Super Bowl XLIII provided new activities to the community. The night life was more exciting because of Super Bowl XLIII.
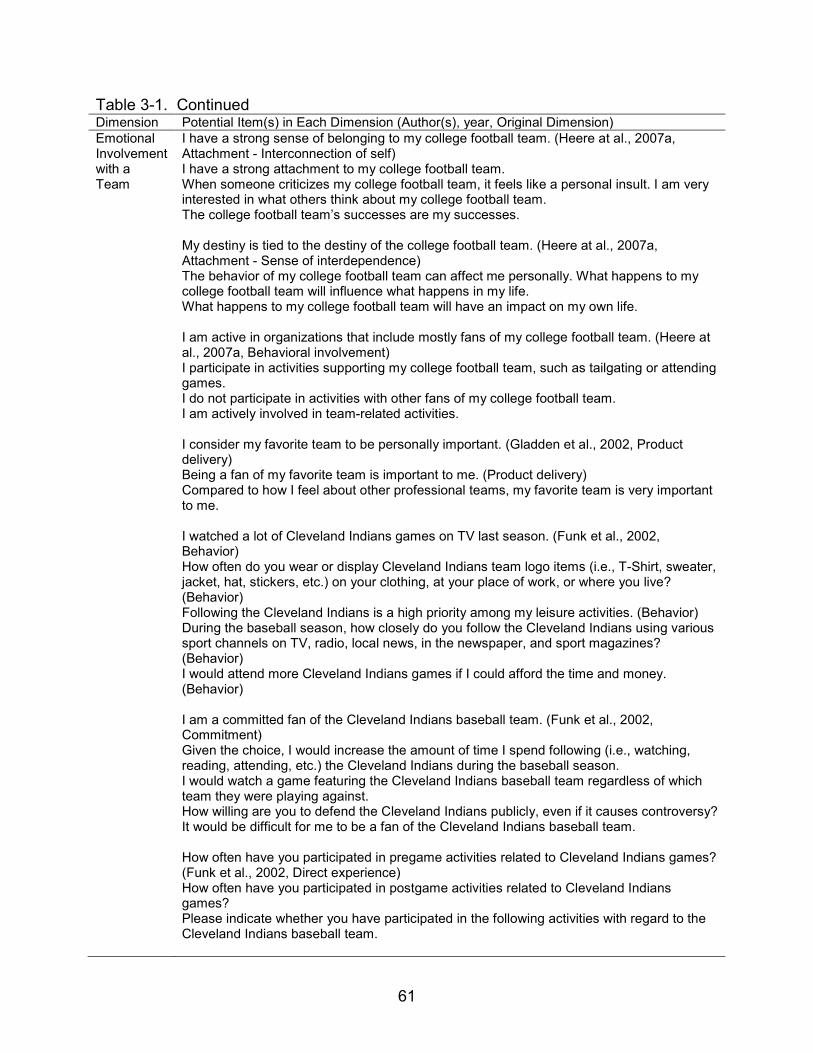
61
Table 3-1. Continued Dimension Potential Item(s) in Each Dimension (Author(s), year, Original Dimension) Emotional Involvement with a Team
I have a strong sense of belonging to my college football team. (Heere at al., 2007a, Attachment - Interconnection of self) I have a strong attachment to my college football team. When someone criticizes my college football team, it feels like a personal insult. I am very interested in what others think about my college football team. The college football team’s successes are my successes. My destiny is tied to the destiny of the college football team. (Heere at al., 2007a, Attachment - Sense of interdependence) The behavior of my college football team can affect me personally. What happens to my college football team will influence what happens in my life. What happens to my college football team will have an impact on my own life. I am active in organizations that include mostly fans of my college football team. (Heere at al., 2007a, Behavioral involvement) I participate in activities supporting my college football team, such as tailgating or attending games. I do not participate in activities with other fans of my college football team. I am actively involved in team-related activities. I consider my favorite team to be personally important. (Gladden et al., 2002, Product delivery) Being a fan of my favorite team is important to me. (Product delivery) Compared to how I feel about other professional teams, my favorite team is very important to me. I watched a lot of Cleveland Indians games on TV last season. (Funk et al., 2002, Behavior) How often do you wear or display Cleveland Indians team logo items (i.e., T-Shirt, sweater, jacket, hat, stickers, etc.) on your clothing, at your place of work, or where you live? (Behavior) Following the Cleveland Indians is a high priority among my leisure activities. (Behavior) During the baseball season, how closely do you follow the Cleveland Indians using various sport channels on TV, radio, local news, in the newspaper, and sport magazines? (Behavior) I would attend more Cleveland Indians games if I could afford the time and money. (Behavior) I am a committed fan of the Cleveland Indians baseball team. (Funk et al., 2002, Commitment) Given the choice, I would increase the amount of time I spend following (i.e., watching, reading, attending, etc.) the Cleveland Indians during the baseball season. I would watch a game featuring the Cleveland Indians baseball team regardless of which team they were playing against. How willing are you to defend the Cleveland Indians publicly, even if it causes controversy? It would be difficult for me to be a fan of the Cleveland Indians baseball team. How often have you participated in pregame activities related to Cleveland Indians games? (Funk et al., 2002, Direct experience) How often have you participated in postgame activities related to Cleveland Indians games? Please indicate whether you have participated in the following activities with regard to the Cleveland Indians baseball team.
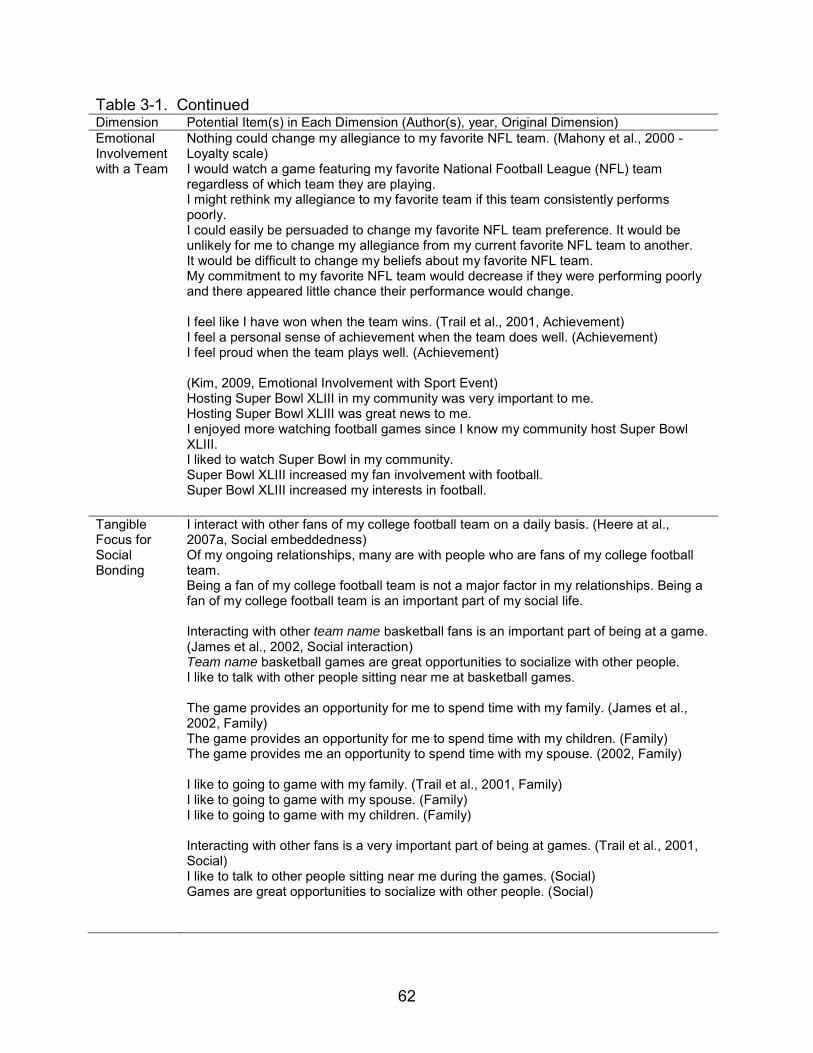
62
Table 3-1. Continued Dimension Potential Item(s) in Each Dimension (Author(s), year, Original Dimension) Emotional Involvement with a Team
Nothing could change my allegiance to my favorite NFL team. (Mahony et al., 2000 - Loyalty scale) I would watch a game featuring my favorite National Football League (NFL) team regardless of which team they are playing. I might rethink my allegiance to my favorite team if this team consistently performs poorly. I could easily be persuaded to change my favorite NFL team preference. It would be unlikely for me to change my allegiance from my current favorite NFL team to another. It would be difficult to change my beliefs about my favorite NFL team. My commitment to my favorite NFL team would decrease if they were performing poorly and there appeared little chance their performance would change. I feel like I have won when the team wins. (Trail et al., 2001, Achievement) I feel a personal sense of achievement when the team does well. (Achievement) I feel proud when the team plays well. (Achievement) (Kim, 2009, Emotional Involvement with Sport Event) Hosting Super Bowl XLIII in my community was very important to me. Hosting Super Bowl XLIII was great news to me. I enjoyed more watching football games since I know my community host Super Bowl XLIII. I liked to watch Super Bowl in my community. Super Bowl XLIII increased my fan involvement with football. Super Bowl XLIII increased my interests in football.
Tangible Focus for Social Bonding
I interact with other fans of my college football team on a daily basis. (Heere at al., 2007a, Social embeddedness) Of my ongoing relationships, many are with people who are fans of my college football team. Being a fan of my college football team is not a major factor in my relationships. Being a fan of my college football team is an important part of my social life. Interacting with other team name basketball fans is an important part of being at a game. (James et al., 2002, Social interaction) Team name basketball games are great opportunities to socialize with other people. I like to talk with other people sitting near me at basketball games. The game provides an opportunity for me to spend time with my family. (James et al., 2002, Family) The game provides an opportunity for me to spend time with my children. (Family) The game provides me an opportunity to spend time with my spouse. (2002, Family) I like to going to game with my family. (Trail et al., 2001, Family) I like to going to game with my spouse. (Family) I like to going to game with my children. (Family) Interacting with other fans is a very important part of being at games. (Trail et al., 2001, Social) I like to talk to other people sitting near me during the games. (Social) Games are great opportunities to socialize with other people. (Social)
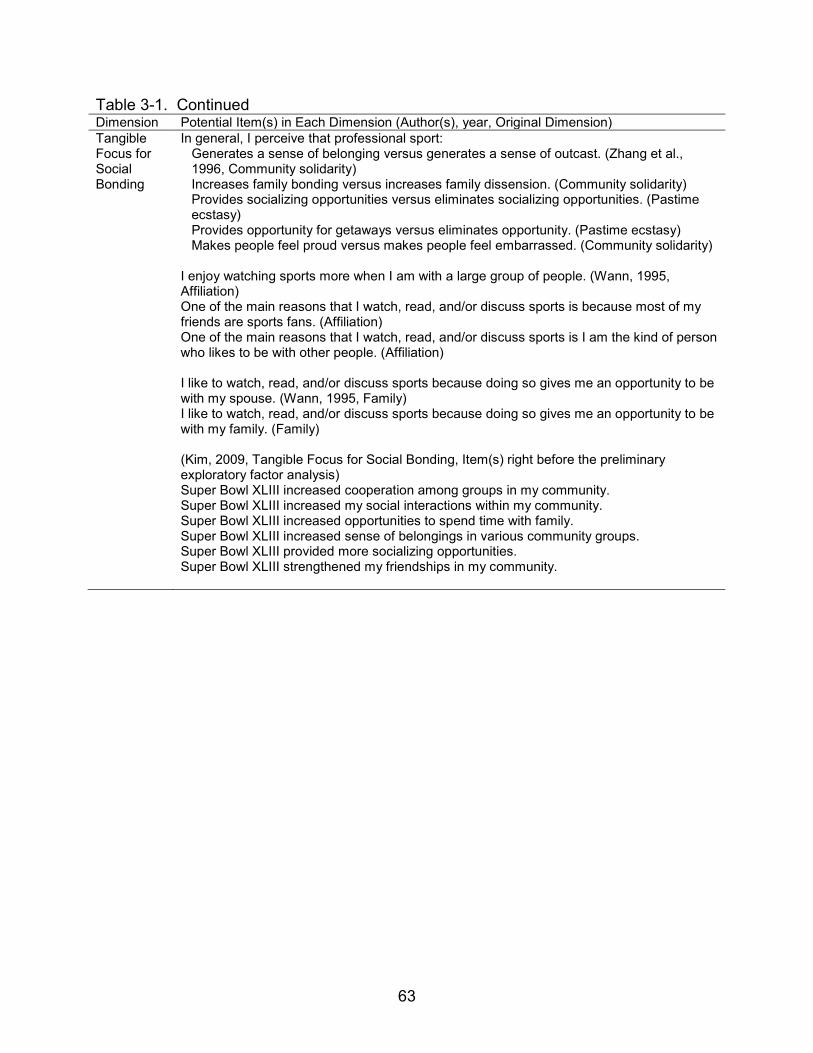
63
Table 3-1. Continued Dimension Potential Item(s) in Each Dimension (Author(s), year, Original Dimension) Tangible Focus for Social Bonding
In general, I perceive that professional sport: Generates a sense of belonging versus generates a sense of outcast. (Zhang et al., 1996, Community solidarity) Increases family bonding versus increases family dissension. (Community solidarity) Provides socializing opportunities versus eliminates socializing opportunities. (Pastime ecstasy) Provides opportunity for getaways versus eliminates opportunity. (Pastime ecstasy) Makes people feel proud versus makes people feel embarrassed. (Community solidarity)
I enjoy watching sports more when I am with a large group of people. (Wann, 1995, Affiliation) One of the main reasons that I watch, read, and/or discuss sports is because most of my friends are sports fans. (Affiliation) One of the main reasons that I watch, read, and/or discuss sports is I am the kind of person who likes to be with other people. (Affiliation) I like to watch, read, and/or discuss sports because doing so gives me an opportunity to be with my spouse. (Wann, 1995, Family) I like to watch, read, and/or discuss sports because doing so gives me an opportunity to be with my family. (Family) (Kim, 2009, Tangible Focus for Social Bonding, Item(s) right before the preliminary exploratory factor analysis) Super Bowl XLIII increased cooperation among groups in my community. Super Bowl XLIII increased my social interactions within my community. Super Bowl XLIII increased opportunities to spend time with family. Super Bowl XLIII increased sense of belongings in various community groups. Super Bowl XLIII provided more socializing opportunities. Super Bowl XLIII strengthened my friendships in my community.
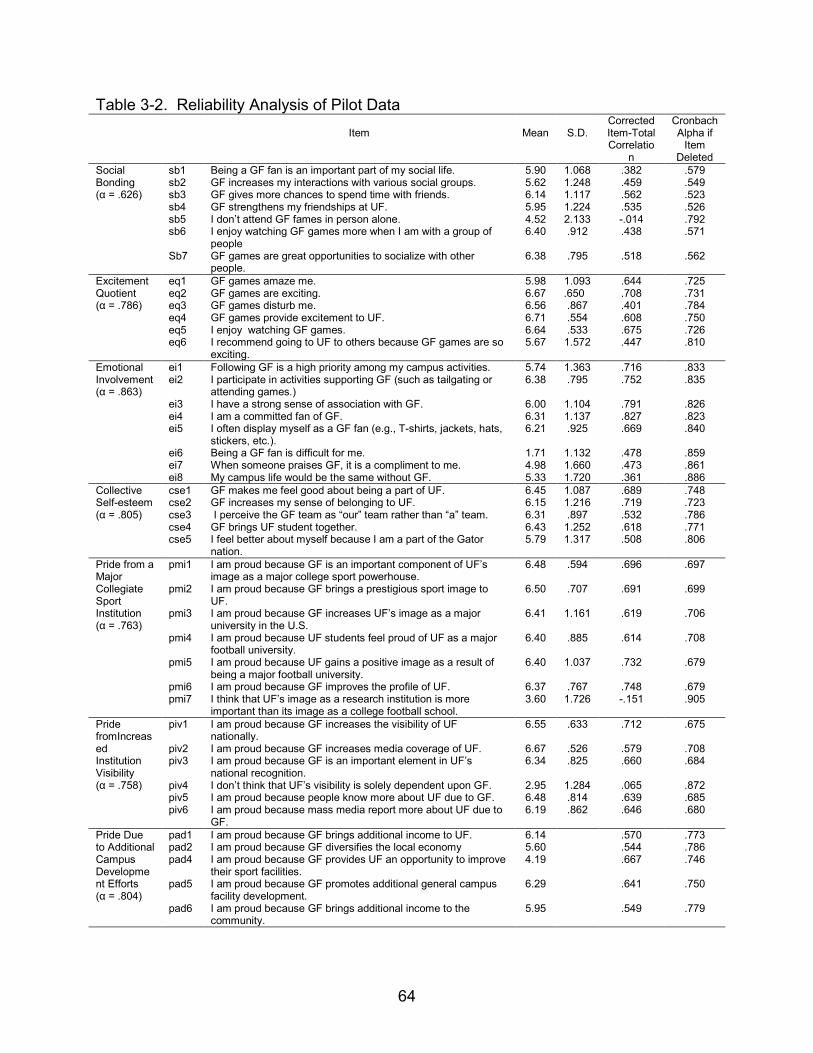
64
Table 3-2. Reliability Analysis of Pilot Data
Item
Mean
S.D. Corrected Item-Total Correlatio
n
Cronbach Alpha if
Item Deleted
Social Bonding (α = .626)
sb1 Being a GF fan is an important part of my social life. 5.90 1.068 .382 .579 sb2 GF increases my interactions with various social groups. 5.62 1.248 .459 .549 sb3 GF gives more chances to spend time with friends. 6.14 1.117 .562 .523 sb4 GF strengthens my friendships at UF. 5.95 1.224 .535 .526 sb5 I don’t attend GF fames in person alone. 4.52 2.133 -.014 .792 sb6 I enjoy watching GF games more when I am with a group of
people 6.40 .912 .438 .571
Sb7 GF games are great opportunities to socialize with other people.
6.38 .795 .518 .562
Excitement Quotient (α = .786)
eq1 GF games amaze me. 5.98 1.093 .644 .725 eq2 GF games are exciting. 6.67 .650 .708 .731 eq3 GF games disturb me. 6.56 .867 .401 .784 eq4 GF games provide excitement to UF. 6.71 .554 .608 .750 eq5 I enjoy watching GF games. 6.64 .533 .675 .726 eq6 I recommend going to UF to others because GF games are so
exciting. 5.67 1.572 .447 .810
Emotional Involvement (α = .863)
ei1 Following GF is a high priority among my campus activities. 5.74 1.363 .716 .833 ei2 I participate in activities supporting GF (such as tailgating or
attending games.) 6.38 .795 .752 .835
ei3 I have a strong sense of association with GF. 6.00 1.104 .791 .826 ei4 I am a committed fan of GF. 6.31 1.137 .827 .823 ei5 I often display myself as a GF fan (e.g., T-shirts, jackets, hats,
stickers, etc.). 6.21 .925 .669 .840
ei6 Being a GF fan is difficult for me. 1.71 1.132 .478 .859 ei7 When someone praises GF, it is a compliment to me. 4.98 1.660 .473 .861 ei8 My campus life would be the same without GF. 5.33 1.720 .361 .886
Collective Self-esteem (α = .805)
cse1 GF makes me feel good about being a part of UF. 6.45 1.087 .689 .748 cse2 GF increases my sense of belonging to UF. 6.15 1.216 .719 .723 cse3 I perceive the GF team as “our” team rather than “a” team. 6.31 .897 .532 .786 cse4 GF brings UF student together. 6.43 1.252 .618 .771 cse5 I feel better about myself because I am a part of the Gator
nation. 5.79 1.317 .508 .806
Pride from a Major Collegiate Sport Institution (α = .763)
pmi1 I am proud because GF is an important component of UF’s image as a major college sport powerhouse.
6.48 .594 .696 .697
pmi2 I am proud because GF brings a prestigious sport image to UF.
6.50 .707 .691 .699
pmi3 I am proud because GF increases UF’s image as a major university in the U.S.
6.41 1.161 .619 .706
pmi4 I am proud because UF students feel proud of UF as a major football university.
6.40 .885 .614 .708
pmi5 I am proud because UF gains a positive image as a result of being a major football university.
6.40 1.037 .732 .679
pmi6 I am proud because GF improves the profile of UF. 6.37 .767 .748 .679 pmi7 I think that UF’s image as a research institution is more
important than its image as a college football school. 3.60 1.726 -.151 .905
Pride fromIncreased Institution Visibility (α = .758)
piv1 I am proud because GF increases the visibility of UF nationally.
6.55 .633 .712 .675
piv2 I am proud because GF increases media coverage of UF. 6.67 .526 .579 .708 piv3 I am proud because GF is an important element in UF’s
national recognition. 6.34 .825 .660 .684
piv4 I don’t think that UF’s visibility is solely dependent upon GF. 2.95 1.284 .065 .872 piv5 I am proud because people know more about UF due to GF. 6.48 .814 .639 .685 piv6 I am proud because mass media report more about UF due to
GF. 6.19 .862 .646 .680
Pride Due to Additional Campus Development Efforts (α = .804)
pad1 I am proud because GF brings additional income to UF. 6.14 .570 .773 pad2 I am proud because GF diversifies the local economy 5.60 .544 .786 pad4 I am proud because GF provides UF an opportunity to improve
their sport facilities. 4.19 .667 .746
pad5 I am proud because GF promotes additional general campus facility development.
6.29 .641 .750
pad6 I am proud because GF brings additional income to the community.
5.95 .549 .779
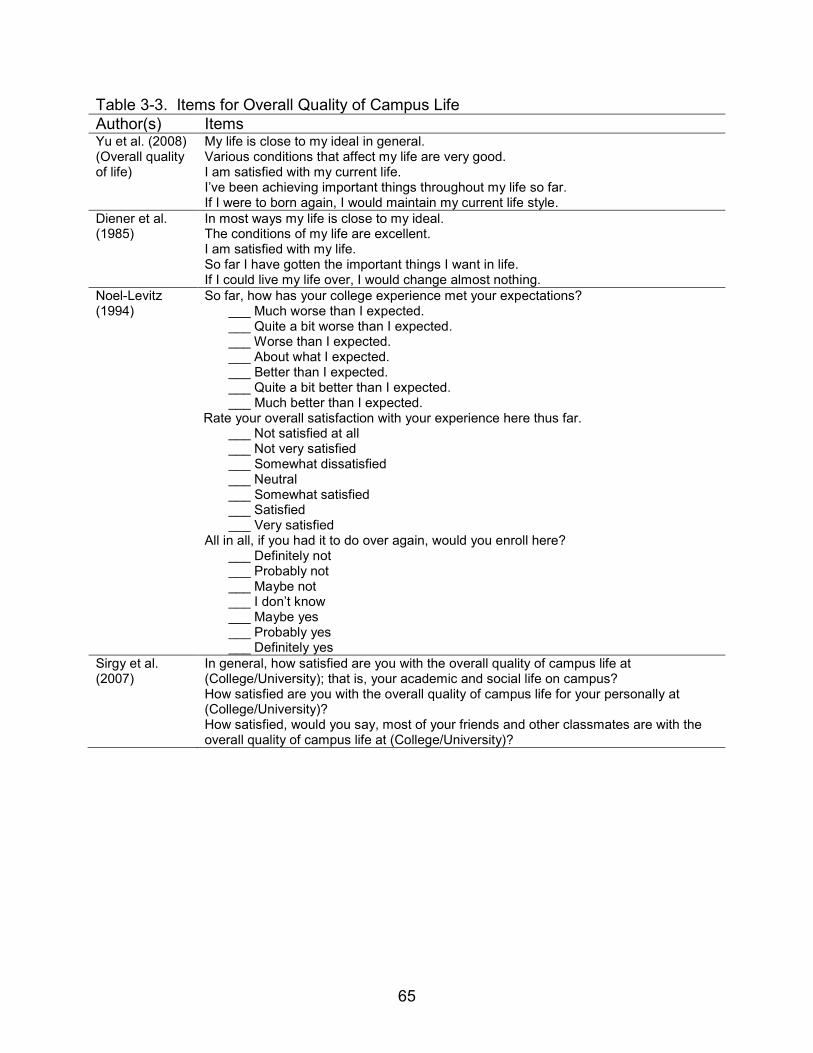
65
Table 3-3. Items for Overall Quality of Campus Life Author(s) Items Yu et al. (2008) (Overall quality of life)
My life is close to my ideal in general. Various conditions that affect my life are very good. I am satisfied with my current life. I’ve been achieving important things throughout my life so far. If I were to born again, I would maintain my current life style.
Diener et al. (1985)
In most ways my life is close to my ideal. The conditions of my life are excellent. I am satisfied with my life. So far I have gotten the important things I want in life. If I could live my life over, I would change almost nothing.
Noel-Levitz (1994)
So far, how has your college experience met your expectations? ___ Much worse than I expected. ___ Quite a bit worse than I expected. ___ Worse than I expected. ___ About what I expected. ___ Better than I expected. ___ Quite a bit better than I expected. ___ Much better than I expected.
Rate your overall satisfaction with your experience here thus far. ___ Not satisfied at all ___ Not very satisfied ___ Somewhat dissatisfied ___ Neutral ___ Somewhat satisfied ___ Satisfied ___ Very satisfied
All in all, if you had it to do over again, would you enroll here? ___ Definitely not ___ Probably not ___ Maybe not ___ I don’t know ___ Maybe yes ___ Probably yes ___ Definitely yes
Sirgy et al. (2007)
In general, how satisfied are you with the overall quality of campus life at (College/University); that is, your academic and social life on campus? How satisfied are you with the overall quality of campus life for your personally at (College/University)? How satisfied, would you say, most of your friends and other classmates are with the overall quality of campus life at (College/University)?
66
CHAPTER 4 RESULTS
This chapter contains the results of the study in the following sections: (a)
descriptive statistics, (b) confirmatory factor analysis, and (c) hierarchical multiple
regression analysis. Seven hundred thirty-three college students were contacted to
provide the data. Among the 673 returned cases, 3 were incomplete and 7 participants
were graduate students. Thus, 663 usable cases were included in the data analysis. In
this stage, missing data were treated and they were replaced by the median of all
nearby points.
Descriptive Statistics
Demographic
Characteristics of respondents are presented in Table 4-1. The proportion of
female participants (58.5%) was higher than that of male participants (41.5%). The
group of senior students was the largest portion of participants (45.2%), followed by
juniors (31.1%), sophomores (16%), and freshmen (7.7%). The ethnic majority of the
participants was white/Caucasian (61.7%).
Descriptive Statistics of Scales
Descriptive statistics including mean and standard deviation from the psychic
income variables are presented in Table 4-2. All 43 items had a mean score greater
than 4.0 (i.e., midpoint on 7-point Likert-type scale). Overall, the impact of big-time
intercollegiate football on students was considered positive. Of all the variables, “My
campus life would be the same without Gator football,” had the lowest mean score (M =
4.65, SD = 2.04) and “Gator football brings UF students together” had the highest mean
score (M = 6.65, SD = .76). Additionally, skewness and kurtosis for the items were
67
examined. Distributions for 4 of the 43 observed variables were significantly skewed at
p<.01. Moreover, 24 of the total items had greater than a 3.0 cutoff point (Chou &
Bentler, 1995). To deal with non-normal data, items were transformed to continuous
variables (Algina, 2008).
Confirmatory Factor Analysis
A preliminary CFA was conducted to test the initial measurement model, seven
factors and 43 items. Chi-square was significant (χ2 = 5059.04, df = 946, p < .01),
indicating that the hypothesized model and the observed model were statistically
significant. Because chi-square values are known to be sensitive to sample size,
alternative fit indexes were further examined, including normed chi-square, RMSEA,
SRMR, and NNFI (Algina, 2008). Although Bollen (1989) noted that values of normed
chi-square as high as 5.0 could be recommended as indicating a reasonable fit, the
normed chi-square (χ2/df = 5.35) was above the suggested cutoff value (i.e., < 3.0;
Bollen, 1989). The value of SRMR (.073) was within the range of acceptable fit (≤ .10;
Kline, 2005). However, other goodness-of-fit indexes of this initial model were not in the
range of acceptable fit. The RMSEA value indicated the initial model showed a poor fit
(RMSEA = .091, 90% CI = .088 to .093; Hu & Bentler, 1999). The values of CFI and
NNFI were lower than the recommended cutoff ratio (> .90; Hu et al., 1999).
The overall lack of fit to the data and modification indexes (MI), as well as poor
indicator loadings (lambda, λ), supported model respecification. All four items that were
reverse-coded variables showed poor performance in factor loading (< .5) and were
removed from the model. To achieve convergent validity, seven additional items were
removed during the stage of model respecification (Anderson & Gerbing, 1988). Several
modification indexes revealed high residual and correlations with other items. All of the
68
modification indexes (delta, δ) greater than .5 were reviewed to evaluate and modify the
model (Jöreskog et al., 1996). The item, “I enjoy watching Gator football games more
when I am with a group of people,” had the highest residual value (δ) and a poor
modification index with the other items. Five items were removed after careful
consideration of both statistical and theoretical justifications.
As a result of the model respecification, 16 items were removed and the seven-
factor model with 27 items was conceptualized: social bonding (3 items), excitement (3
items), emotional involvement (5 items), collective self-esteem (3 items), pride from
being a major collegiate sport institution (5 items), pride from increased institution
visibility (4 items), and pride due to additional campus development efforts (4 items).
Consequently, the modified seven-factor model with 27 items showed a better fit to the
data, with χ2= 1223.66 (df = 303, p < .01), the normed chi-square (χ2/df = 4.03), RMSEA
= .071 (90% CI = .067 to .071), SRMR = .045, NNFI = .92, and CFI = .93. (See Table 4-
3.)
To ensure the evidence of convergent validity, factor loadings and t-values were
examined. According to Hair et al. (2006), all factor loadings were above the cutoff (.50)
and ranged from .60 to .91. The t-values for all variables ranged from 11.05 to 16.68 (p
< .05). The results suggested that each item significantly contributed to its underlying
construct and the phi coefficients (Ф), measuring inter-factor correlations among the
latent variables. The lowest phi coefficient was .44 (between social bonding and pride
from increased institution visibility). The phi between pride from being a major collegiate
sport institution and pride from increased institution visibility had a high inter-factor
correlation (Ф = .88). As a result of this high factor correlation, a six-factor nested model
69
with these two latent variables was assessed. However, the six-factor model did not
improve the model fit, thereby leading to the decision to retain the previously discussed
seven-factor model. Table 4-4 shows inter-factor correlations from this confirmatory
factor analysis
The reliability measures of the preliminary model had already demonstrated high
internal consistency of the factors and respective items. The final confirmed fit model
had higher Cronbach’s alpha (α), construct reliability (CR), and average variance
extracted (AVE). Alpha reliability coefficients and CR coefficients were well above the
.70 criterion (Hair et al., 2006; Numnally et al., 1994). The pride due to additional
campus development efforts factor had the lowest Cronbach’s alpha and CR (α = .78,
CR = .79). The other factor, emotional involvement, had the highest Cronbach’s α and
CR (α = .91, CR = .91). The AVE values ranged from .49 (pride due to additional
campus development efforts) to .69 (social bonding); see Table 4-5.
Hierarchical Multiple Regression Analysis
The hierarchical analysis in multiple regression was employed to identify the best
predictors of college satisfaction. To refine the data for the next analysis, data
transformation was attempted, including log-transformation and square-root
transformation. Two blocks of independent variables were entered in the regression
model. The first block contained four controlled demographic and social variables,
including gender, home game attendance, recreational activity participation, and game-
day activity participation, based on the review of literature. The second block contained
the seven psychic income variables. The measures of each psychic income factor were
an average of scale items in each factor: MeanE (excitement), MeanEI (emotional
involvement), MeanSB (social bonding), MeanCSE (collective self-esteem), MeanPMI
70
(pride from being a major institution), MeanPIV (pride from increased visibility), and
MeanPAD (pride from additional development).
In the final model, five significant independent variables (gender, game-day
activity participation, MeanE, MeanEI, and MeanPAD) were noted, collectively
explaining approximately 38% of the variance in college satisfaction (R2 = .37.7; see
Table 11). The psychic income factors increased approximately 26% (∆R2= .257, p <
.001) of the variability in the outcome accounted for by the predictors. Among the
remaining three psychic income measures, MeanE showed the largest impact in the
model (β = .250, t (631) = 5.223, p < .001). The rest of the standardized beta values (β)
were 0.217 (MeanEI, t (631) = 4.448, p < .001), and 0.124 (MeanEI, t (631) = 2.510, p <
.05)
The overall tolerance and variance inflation factor were used to examine the
possibility of multicollinearity. All tolerance and VIF of independent variables showed no
significant combined effects of two or more variables. MeanE had the smallest tolerance
and the largest VIF, which is the inverse of the tolerance value (Tolerance = .430 and
VIF = 2.326). The tolerance levels of other independent variables were greater than .10
and their reverse values (VIF) were less than 10 (Hair et al., 2008; O’Brien, 2007).
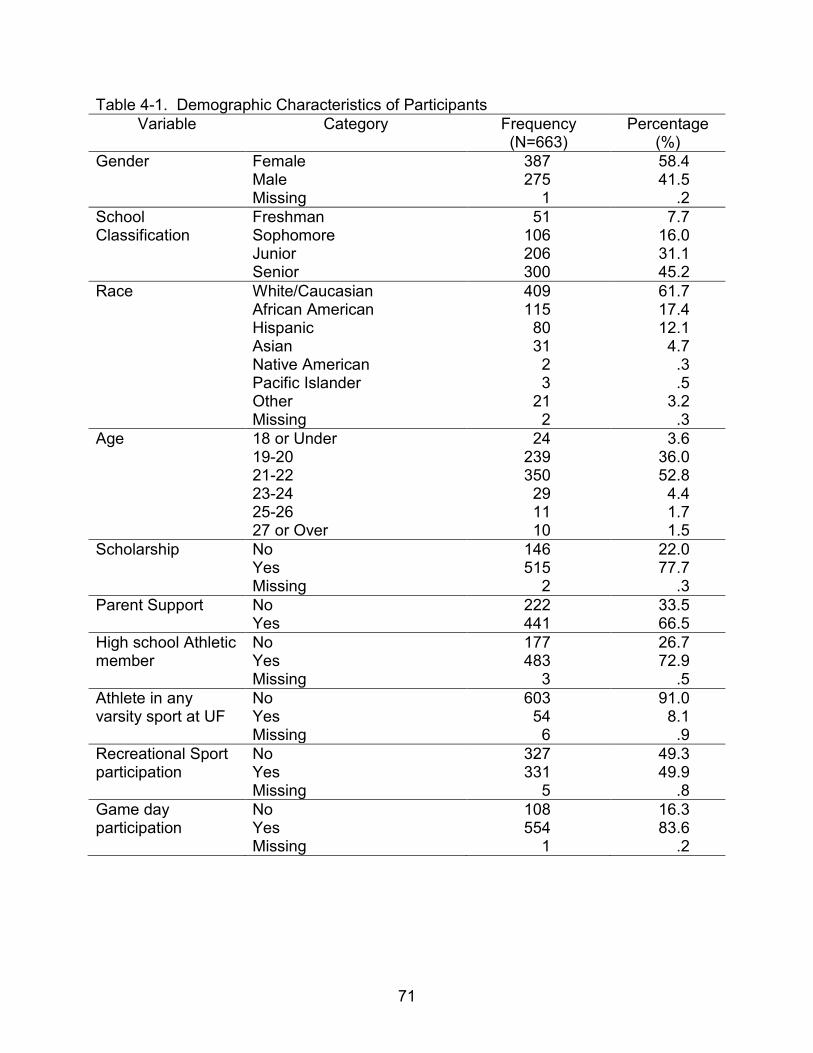
71
Table 4-1. Demographic Characteristics of Participants Variable Category Frequency
(N=663) Percentage
(%) Gender Female
Male Missing
387 275
1
58.4 41.5
.2 School Classification
Freshman Sophomore Junior Senior
51 106 206 300
7.7 16.0 31.1 45.2
Race White/Caucasian African American Hispanic Asian Native American Pacific Islander Other Missing
409 115
80 31 2 3
21 2
61.7 17.4 12.1
4.7 .3 .5
3.2 .3
Age 18 or Under 19-20 21-22 23-24 25-26 27 or Over
24 239 350
29 11 10
3.6 36.0 52.8
4.4 1.7 1.5
Scholarship No Yes Missing
146 515
2
22.0 77.7
.3 Parent Support No
Yes 222 441
33.5 66.5
High school Athletic member
No Yes Missing
177 483
3
26.7 72.9
.5 Athlete in any varsity sport at UF
No Yes Missing
603 54 6
91.0 8.1
.9 Recreational Sport participation
No Yes Missing
327 331
5
49.3 49.9
.8 Game day participation
No Yes Missing
108 554
1
16.3 83.6
.2
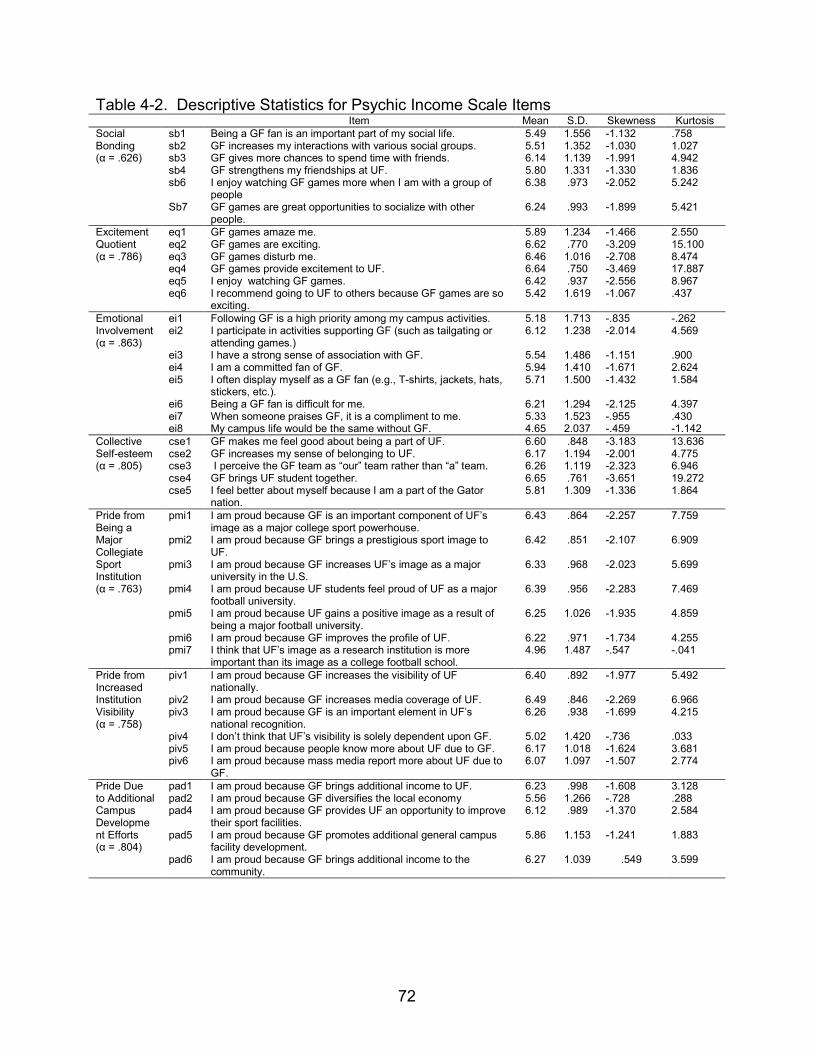
72
Table 4-2. Descriptive Statistics for Psychic Income Scale Items Item Mean S.D. Skewness Kurtosis
Social Bonding (α = .626)
sb1 Being a GF fan is an important part of my social life. 5.49 1.556 -1.132 .758 sb2 GF increases my interactions with various social groups. 5.51 1.352 -1.030 1.027 sb3 GF gives more chances to spend time with friends. 6.14 1.139 -1.991 4.942 sb4 GF strengthens my friendships at UF. 5.80 1.331 -1.330 1.836 sb6 I enjoy watching GF games more when I am with a group of
people 6.38 .973 -2.052 5.242
Sb7 GF games are great opportunities to socialize with other people.
6.24 .993 -1.899 5.421
Excitement Quotient (α = .786)
eq1 GF games amaze me. 5.89 1.234 -1.466 2.550 eq2 GF games are exciting. 6.62 .770 -3.209 15.100 eq3 GF games disturb me. 6.46 1.016 -2.708 8.474 eq4 GF games provide excitement to UF. 6.64 .750 -3.469 17.887 eq5 I enjoy watching GF games. 6.42 .937 -2.556 8.967 eq6 I recommend going to UF to others because GF games are so
exciting. 5.42 1.619 -1.067 .437
Emotional Involvement (α = .863)
ei1 Following GF is a high priority among my campus activities. 5.18 1.713 -.835 -.262 ei2 I participate in activities supporting GF (such as tailgating or
attending games.) 6.12 1.238 -2.014 4.569
ei3 I have a strong sense of association with GF. 5.54 1.486 -1.151 .900 ei4 I am a committed fan of GF. 5.94 1.410 -1.671 2.624 ei5 I often display myself as a GF fan (e.g., T-shirts, jackets, hats,
stickers, etc.). 5.71 1.500 -1.432 1.584
ei6 Being a GF fan is difficult for me. 6.21 1.294 -2.125 4.397 ei7 When someone praises GF, it is a compliment to me. 5.33 1.523 -.955 .430 ei8 My campus life would be the same without GF. 4.65 2.037 -.459 -1.142
Collective Self-esteem (α = .805)
cse1 GF makes me feel good about being a part of UF. 6.60 .848 -3.183 13.636 cse2 GF increases my sense of belonging to UF. 6.17 1.194 -2.001 4.775 cse3 I perceive the GF team as “our” team rather than “a” team. 6.26 1.119 -2.323 6.946 cse4 GF brings UF student together. 6.65 .761 -3.651 19.272 cse5 I feel better about myself because I am a part of the Gator
nation. 5.81 1.309 -1.336 1.864
Pride from Being a Major Collegiate Sport Institution (α = .763)
pmi1 I am proud because GF is an important component of UF’s image as a major college sport powerhouse.
6.43 .864 -2.257 7.759
pmi2 I am proud because GF brings a prestigious sport image to UF.
6.42 .851 -2.107 6.909
pmi3 I am proud because GF increases UF’s image as a major university in the U.S.
6.33 .968 -2.023 5.699
pmi4 I am proud because UF students feel proud of UF as a major football university.
6.39 .956 -2.283 7.469
pmi5 I am proud because UF gains a positive image as a result of being a major football university.
6.25 1.026 -1.935 4.859
pmi6 I am proud because GF improves the profile of UF. 6.22 .971 -1.734 4.255 pmi7 I think that UF’s image as a research institution is more
important than its image as a college football school. 4.96 1.487 -.547 -.041
Pride from Increased Institution Visibility (α = .758)
piv1 I am proud because GF increases the visibility of UF nationally.
6.40 .892 -1.977 5.492
piv2 I am proud because GF increases media coverage of UF. 6.49 .846 -2.269 6.966 piv3 I am proud because GF is an important element in UF’s
national recognition. 6.26 .938 -1.699 4.215
piv4 I don’t think that UF’s visibility is solely dependent upon GF. 5.02 1.420 -.736 .033 piv5 I am proud because people know more about UF due to GF. 6.17 1.018 -1.624 3.681 piv6 I am proud because mass media report more about UF due to
GF. 6.07 1.097 -1.507 2.774
Pride Due to Additional Campus Development Efforts (α = .804)
pad1 I am proud because GF brings additional income to UF. 6.23 .998 -1.608 3.128 pad2 I am proud because GF diversifies the local economy 5.56 1.266 -.728 .288 pad4 I am proud because GF provides UF an opportunity to improve
their sport facilities. 6.12 .989 -1.370 2.584
pad5 I am proud because GF promotes additional general campus facility development.
5.86 1.153 -1.241 1.883
pad6 I am proud because GF brings additional income to the community.
6.27 1.039 .549 3.599
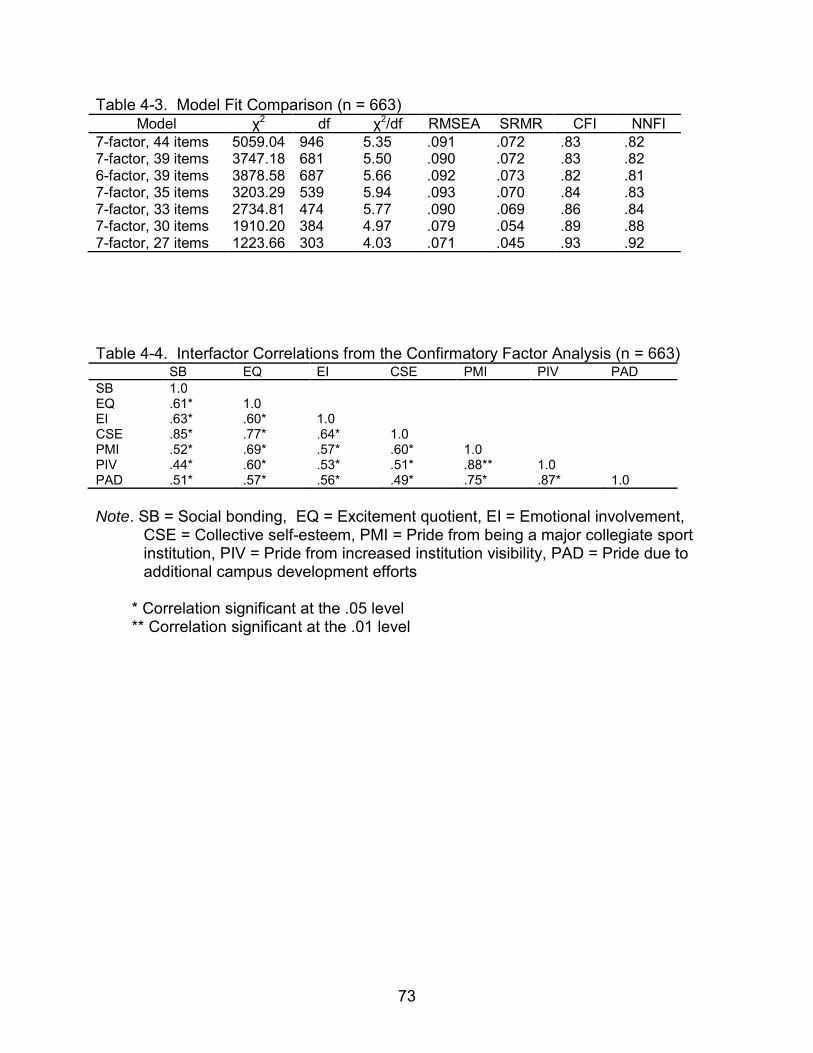
73
Table 4-3. Model Fit Comparison (n = 663) Model χ2 df χ2/df RMSEA SRMR CFI NNFI
7-factor, 44 items 7-factor, 39 items
5059.04 3747.18
946 681
5.35 5.50
.091
.090 .072 .072
.83
.83 .82 .82
6-factor, 39 items 3878.58 687 5.66 .092 .073 .82 .81 7-factor, 35 items 3203.29 539 5.94 .093 .070 .84 .83 7-factor, 33 items 2734.81 474 5.77 .090 .069 .86 .84 7-factor, 30 items 1910.20 384 4.97 .079 .054 .89 .88 7-factor, 27 items 1223.66 303 4.03 .071 .045 .93 .92
Table 4-4. Interfactor Correlations from the Confirmatory Factor Analysis (n = 663) SB EQ EI CSE PMI PIV PAD SB 1.0 EQ .61* 1.0 EI .63* .60* 1.0 CSE .85* .77* .64* 1.0 PMI .52* .69* .57* .60* 1.0 PIV .44* .60* .53* .51* .88** 1.0 PAD .51* .57* .56* .49* .75* .87* 1.0 Note. SB = Social bonding, EQ = Excitement quotient, EI = Emotional involvement,
CSE = Collective self-esteem, PMI = Pride from being a major collegiate sport institution, PIV = Pride from increased institution visibility, PAD = Pride due to additional campus development efforts
* Correlation significant at the .05 level ** Correlation significant at the .01 level
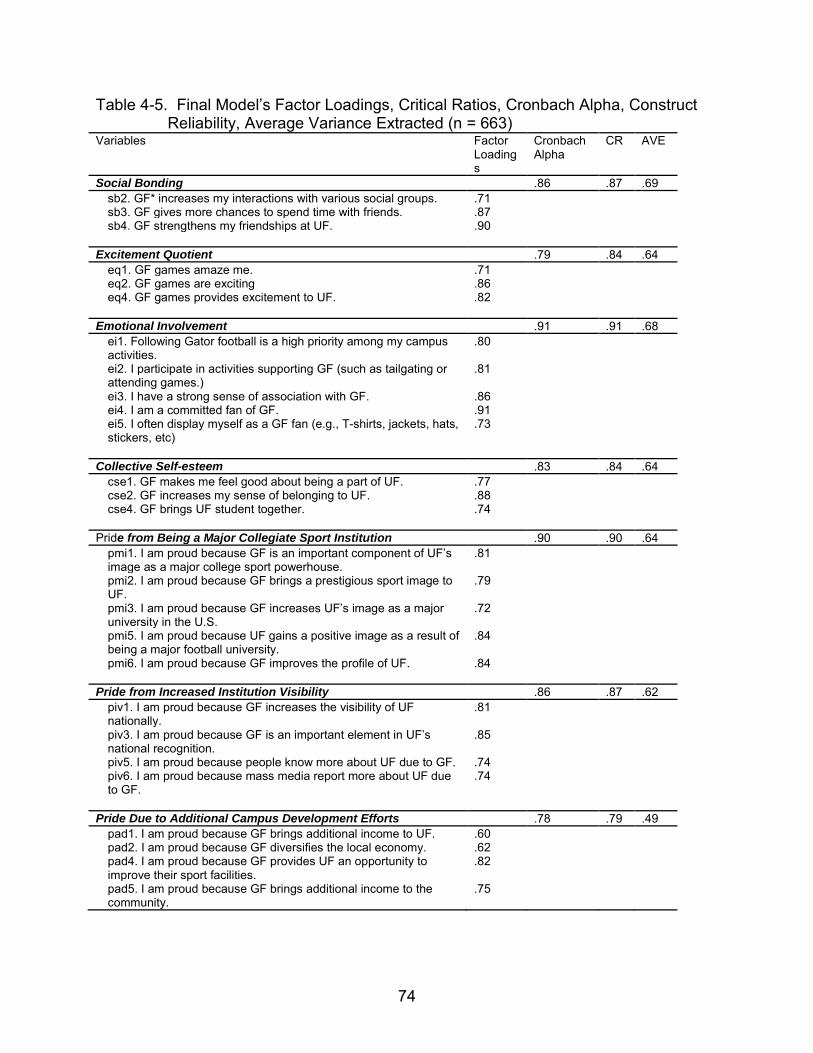
74
Table 4-5. Final Model’s Factor Loadings, Critical Ratios, Cronbach Alpha, Construct Reliability, Average Variance Extracted (n = 663)
Variables Factor Loadings
Cronbach Alpha
CR AVE
Social Bonding .86 .87 .69 sb2. GF* increases my interactions with various social groups. .71 sb3. GF gives more chances to spend time with friends. .87 sb4. GF strengthens my friendships at UF. .90
Excitement Quotient .79 .84 .64
eq1. GF games amaze me. .71 eq2. GF games are exciting .86 eq4. GF games provides excitement to UF. .82
Emotional Involvement .91 .91 .68
ei1. Following Gator football is a high priority among my campus activities.
.80
ei2. I participate in activities supporting GF (such as tailgating or attending games.)
.81
ei3. I have a strong sense of association with GF. .86 ei4. I am a committed fan of GF. .91 ei5. I often display myself as a GF fan (e.g., T-shirts, jackets, hats, stickers, etc)
.73
Collective Self-esteem .83 .84 .64
cse1. GF makes me feel good about being a part of UF. .77 cse2. GF increases my sense of belonging to UF. .88 cse4. GF brings UF student together. .74
Pride from Being a Major Collegiate Sport Institution .90 .90 .64
pmi1. I am proud because GF is an important component of UF’s image as a major college sport powerhouse.
.81
pmi2. I am proud because GF brings a prestigious sport image to UF.
.79
pmi3. I am proud because GF increases UF’s image as a major university in the U.S.
.72
pmi5. I am proud because UF gains a positive image as a result of being a major football university.
.84
pmi6. I am proud because GF improves the profile of UF. .84 Pride from Increased Institution Visibility .86 .87 .62
piv1. I am proud because GF increases the visibility of UF nationally.
.81
piv3. I am proud because GF is an important element in UF’s national recognition.
.85
piv5. I am proud because people know more about UF due to GF. .74 piv6. I am proud because mass media report more about UF due to GF.
.74
Pride Due to Additional Campus Development Efforts .78 .79 .49
pad1. I am proud because GF brings additional income to UF. .60 pad2. I am proud because GF diversifies the local economy. .62 pad4. I am proud because GF provides UF an opportunity to improve their sport facilities.
.82
pad5. I am proud because GF brings additional income to the community.
.75
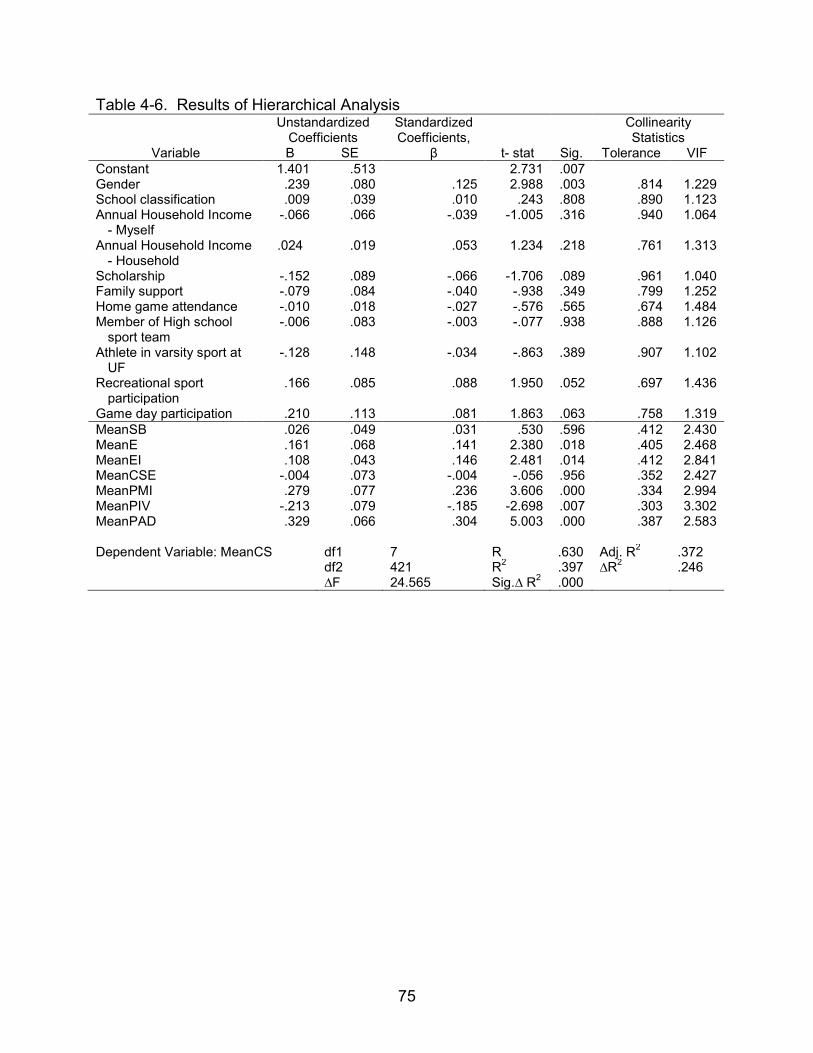
75
Table 4-6. Results of Hierarchical Analysis
Variable
Unstandardized Coefficients
Standardized Coefficients,
β
t- stat
Sig.
Collinearity Statistics
B SE Tolerance VIF Constant 1.401 .513 2.731 .007 Gender .239 .080 .125 2.988 .003 .814 1.229 School classification .009 .039 .010 .243 .808 .890 1.123 Annual Household Income
- Myself -.066 .066 -.039 -1.005 .316 .940 1.064
Annual Household Income - Household
.024 .019 .053 1.234 .218 .761 1.313
Scholarship -.152 .089 -.066 -1.706 .089 .961 1.040 Family support -.079 .084 -.040 -.938 .349 .799 1.252 Home game attendance -.010 .018 -.027 -.576 .565 .674 1.484 Member of High school
sport team -.006 .083 -.003 -.077 .938 .888 1.126
Athlete in varsity sport at UF
-.128 .148 -.034 -.863 .389 .907 1.102
Recreational sport participation
.166 .085 .088 1.950 .052 .697 1.436
Game day participation .210 .113 .081 1.863 .063 .758 1.319 MeanSB .026 .049 .031 .530 .596 .412 2.430 MeanE .161 .068 .141 2.380 .018 .405 2.468 MeanEI .108 .043 .146 2.481 .014 .412 2.841 MeanCSE -.004 .073 -.004 -.056 .956 .352 2.427 MeanPMI .279 .077 .236 3.606 .000 .334 2.994 MeanPIV -.213 .079 -.185 -2.698 .007 .303 3.302 MeanPAD .329 .066 .304 5.003 .000 .387 2.583 Dependent Variable: MeanCS df1 7 R .630 Adj. R2 .372 df2 421 R2 .397 ∆R2 .246 ∆F 24.565 Sig.∆ R2 .000
76
CHAPTER 5 DISCUSSION
The primary purpose of this study was to explore how intercollegiate athletic
teams influence college students’ psychic income and their college satisfaction. A great
amount of research has attempted to examine college students’ perceptions of their
overall college life (e.g., Cha, 2003; Koilias, 2005; Sirgy et al., 2006). However, not
much focus has been given to explaining the relationship between college sports and
student college satisfaction despite the notion that collegiate athletics are a major
segment of campus life for most big-time sport universities. In addition, the study of
sport’s effects on individuals’ affect and cognition has long been particularly interesting
to scholars who study impact analysis (e.g., Crompton, 2004; Horne et al., 2006;
Gursoy et al., 2002; Ritchie et al., 1991; Ritchie, 1993; Teye et al., 2005). Therefore, the
current study was designed to investigate student psychic income from their
intercollegiate athletics to provide a conceptual model, to develop a valid and reliable
scale to measure the latent variable, and to examine the relationship between students’
psychic income and their satisfaction with college life.
This chapter provides a discussion of the results as described in Chapter 4. The
discussion begins with a review of the conceptual model. Then, the results from the
various analyses throughout the study are explained and summarized. Lastly, possible
study limitations and future directions are discussed.
Review of the Conceptual Framework
College sport did not have significant value in American culture prior to the mid-
1980s; however, it became an important segment of the sport industry (Gerdy, 2000;
Masteralexis, Barr, & Hums, 2005; Smith, 2004). Its business aspects attract more
77
attention from communities, college administrators, and business entities due to the
substantial increase of media coverage of intercollegiate athletics (Masteralexis et al.,
2005; Leeds et al., 2008). In addition, college sport has served as an important catalyst
to generate students’ pride, excitement, attachment, and support for future campus
development (Duderstadt, 2000; NIRSA, 2004; Noll, 2004; Shulman et al., 2001;
Sperber, 2000). Based on its tremendous popularity and influence, most college
satisfaction studies did not pay attention to the collegiate sport itself. However, the non-
tangible impact analysis derived from sport teams and events is potentially of interest as
an addition to a growing body of scholarship in this area (e.g., Andereck et al., 2000;
Choi et al., 2005; Horne et al., 2006; Kim et al., 2006; Kim et al., 2010; Gursoy et al.,
2002).
Currently, there is no generally accepted model to measure individuals’
psychological benefits from sport teams or events (Kim et al., 2010). Crompton (2004)
suggested a seven-dimension psychic income conceptual paradigm, explaining how
residents feel with reference to the professional teams that are housed in publicly
funded facilities. Adopting Crompton’s framework, Kim et al. (2008) investigated sport
mega event host-residents’ psychological benefits from the annual Daytona 500.
Crompton’s paradigm was also implanted in Kim and Walker’s study (2010) to measure
community members’ perception toward one-time sport mega events, such as the
Super Bowl. As a sequential study of psychic income, the current study empirically
tested college students’ psychic income from their collegiate sports, specifically a
football team. Unlike the previous two studies (Kim et al., 2008; Kim et al., 2010), the
78
suggested framework in this study reflected a psychological context similar to
Crompton’s proposal because the impact of team was tested.
Discussion of the Results
The intangible value of big-time intercollegiate football to students goes beyond
the monetary impact; thus, this study sought to develop an SPI construct which is
independent of economic criteria. To formulate the preliminary questionnaire, content
validity was established by a comprehensive literature review, an expert review, a field
test, and a pilot study. Confirmatory factor analysis and reliability tests were employed
for the final purification of the SPI. The reliability coefficients were greater than a widely
accepted cutoff criterion throughout the scale in both the pilot study and the main study.
CFAs validated the psychometric properties of the SPI and provided evidence of
adequate construct validity. Chi-square values and the goodness-of-fit indexes indicated
the final seven-factor model with 27 items fit to their latent variable. There were
relatively high correlations between some of the constructs, between pride from being a
major collegiate sport institution and pride from increased institution visibility; however,
tests of pairs of constructs suggested insignificant discriminant validity issues.
Throughout the study, the tests of the measurement model established the
validity and reliability of the items of the SPI. The study provided further evidence of the
usability of the SPI and Crompton’s (2004) conceptual framework by empirically testing
within a collegiate sport setting. The validated seven factors were applicable to college
sport and confirmed students’ perception of the impact of their football team. The lowest
mean value of dimension was 5.70 (emotional involvement, SD = 1.27) and the highest
was 6.47 (collective self-esteem, SD = .82). The recent success of University of Florida
football may enhance students’ perceptions of their home team. Unsurprisingly,
79
successful intercollegiate teams increase the opportunities for media coverage,
institution image enhancement, excitement to the students, and students’ pride (e.g.,
Duderstadt, 2001; Gibson, 2002; Heere et al., 2007b; Madrigal, 2001; Sperber, 2000;
Wann et al., 2003)
Despite any potential arguments regarding the true impact of college sports,
intercollegiate athletics are generally treated in a positive manner by administrators,
students, and community members (Brand, 2006; Gerdy, 2000; McCormics et al., 1987;
Pope et al., 2009; Shulman et al., 2001). As one social aspect of a college campus,
intercollegiate sports elaborate on the quality of college life (Sirgy et al., 2006; Yu et al.,
2008). This study explained 40% of overall college satisfaction through a number of
demographic variables and seven psychic income factors. Significant predictors
included gender, excitement, emotional involvement, pride from being a major collegiate
sport institution, pride from increased institution visibility, and pride due to additional
campus development efforts. Interestingly, pride from increased visibility reduced
overall college satisfaction. College students may appreciate their institution’s
prestigious image, but not mere visibility. Additionally, the other two pride factors
explained more than 50% of college satisfaction; thus, they might influence the last
pride factor, pride from increased visibility.
Several studies claimed that biosocial variables such as gender and age may not
be strong influences on individuals’ subjective well-being (Camphell, 1981; Cha, 2003;
Diener et., 1999). However, this study revealed that male college students have
relatively positive college satisfaction. Past studies have shown a strong relationship
between college satisfaction and student participation in athletic activities (NIRSA,
80
2009; McGuinn et al., 2001; Varca et al., 1984); this study also confirmed that
recreational activity participation and game-day participation enhanced overall college
satisfaction. Half of the survey participants were involved in recreational sport in the
University of Florida, and they had a positive relationship with their college satisfaction.
Some studies indicated that collective self-esteem is a relatively influential predictor of
life satisfaction (Camphell, 1981; Cha, 2003; Chow, 2005; Diener et al., 1999). In
contrast, this study found that collective self-esteem was not one of the variables
explaining quality of college life. Instead, excitement and emotional involvement were
the primary psychic income factors enhancing college satisfaction.
Limitations and Future Directions
The study attempted to develop a valid and reliable instrument capable of
measuring college students’ psychic income from their intercollegiate teams. However,
some limitations should be considered. First, the proposed construct should be
generalized to different settings in colleges in terms of the size of the athletic
department budget and the collegiate sports culture. The judgment sampling method in
this study also restricted the study’s generalizability because the sample comprised only
undergraduate students from one region in the country. Future studies should use a
more representative sampling method and data. Second, the participants in this study
recently experienced great success in intercollegiate sports, two national football and
two men’s basketball championships in the last four years. The selected athletic
program also had star power, such as quarterback Tim Tebow and Coach Urban Meyer.
Therefore, the generalizability of the study findings may be limited. Third, to develop a
more in-depth understanding of the psychic income construct, further research is
necessary because potential PI dimensions might be omitted from Crompton’s (2004)

81
suggested paradigm. In addition, the suggested constructs might be merged together
due to similarity. For example, two constructs in this study, pride from being a major
collegiate sport institution and pride due to additional campus development efforts, had
relatively high correlations. Although the six-factor model did not show improved model
fit, individuals’ perception of those pride resources may have close meanings. Fourth,
future research might examine college satisfaction with additional variables in the
personality domain (Cha, 2003; Hofer et al., 2008). According to Hofer et al. (2008),
perception of satisfaction can be emotional or cognitive in nature; thus, the suggested
independent variables, or psychic income paradigm, require clarification in these two
categories.
Despite the listed limitations, the current study provided an important step toward
a better understanding of psychic income, which is one segment of social impact
analysis measurement. This empirical study validated Crompton’s (2004) conceptual
framework and will prove useful for sport practitioners, marketers, and college
administrators. Practitioners can modify the suggested model and items to measure
college students’ psychological benefits from intercollegiate sport to rationalize funding
to college sport. Marketers can implement specific strategies using intercollegiate sport
to communicate with potential consumers. They can use the seven constructs to specify
the details. Since the integral and visible role of intercollegiate sport is important,
college administrators can use the suggested scales to assess the level of students’
psychic income from the school team as well as their ongoing college satisfaction.
Today, intercollegiate sport is popular on both regional and national scales and is
a marketing tool. The findings of this study will help explain why college sports receive

82
increasingly more television air time and their business aspects are becoming
acceptable to college administrators and entrepreneurs. In addition, the findings of this
study will fulfill the call for supplementary constructs of college life.
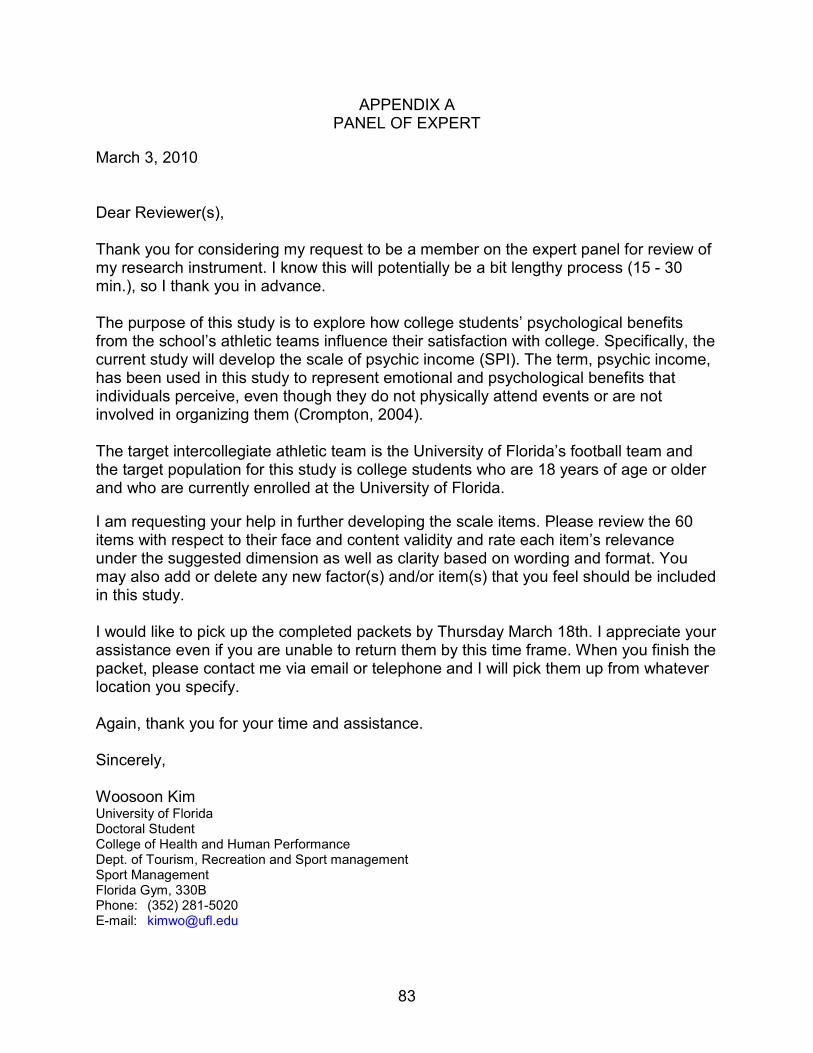
83
APPENDIX A PANEL OF EXPERT
March 3, 2010 Dear Reviewer(s), Thank you for considering my request to be a member on the expert panel for review of my research instrument. I know this will potentially be a bit lengthy process (15 - 30 min.), so I thank you in advance. The purpose of this study is to explore how college students’ psychological benefits from the school’s athletic teams influence their satisfaction with college. Specifically, the current study will develop the scale of psychic income (SPI). The term, psychic income, has been used in this study to represent emotional and psychological benefits that individuals perceive, even though they do not physically attend events or are not involved in organizing them (Crompton, 2004). The target intercollegiate athletic team is the University of Florida’s football team and the target population for this study is college students who are 18 years of age or older and who are currently enrolled at the University of Florida. I am requesting your help in further developing the scale items. Please review the 60 items with respect to their face and content validity and rate each item’s relevance under the suggested dimension as well as clarity based on wording and format. You may also add or delete any new factor(s) and/or item(s) that you feel should be included in this study. I would like to pick up the completed packets by Thursday March 18th. I appreciate your assistance even if you are unable to return them by this time frame. When you finish the packet, please contact me via email or telephone and I will pick them up from whatever location you specify. Again, thank you for your time and assistance. Sincerely, Woosoon Kim University of Florida Doctoral Student College of Health and Human Performance Dept. of Tourism, Recreation and Sport management Sport Management Florida Gym, 330B Phone: (352) 281-5020 E-mail: [email protected]
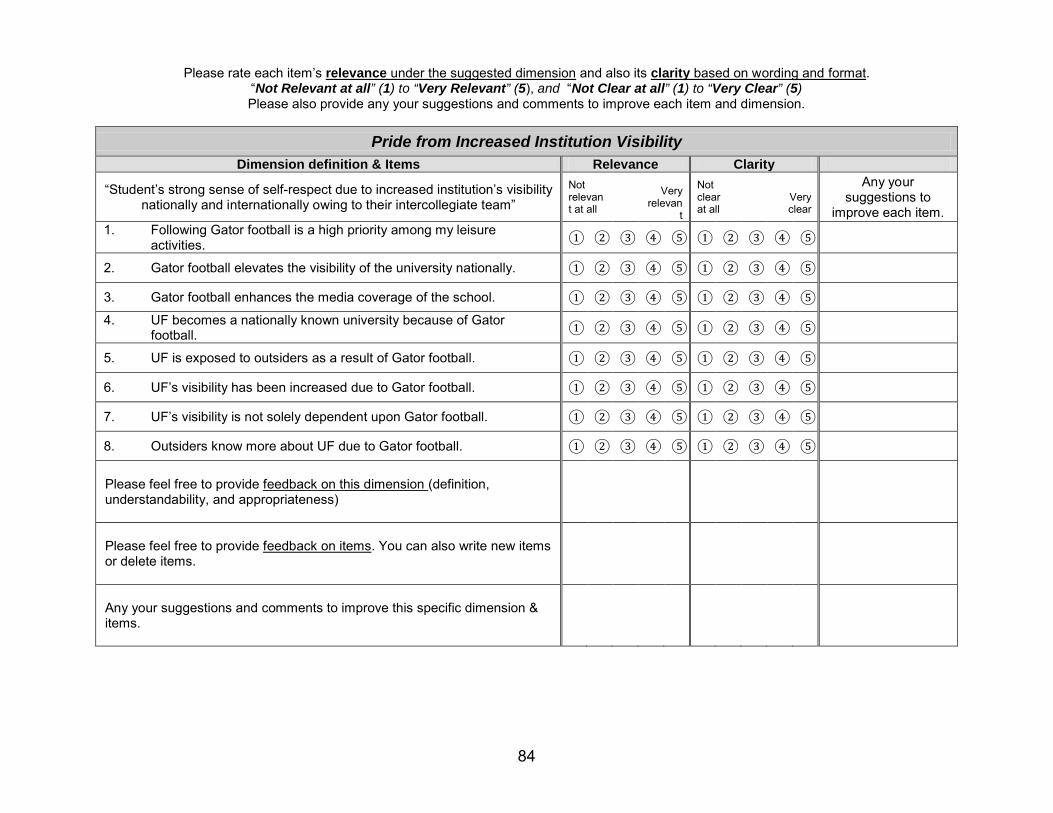
84
Please rate each item’s relevance under the suggested dimension and also its clarity based on wording and format. “Not Relevant at all” (1) to “Very Relevant” (5), and “Not Clear at all” (1) to “Very Clear” (5) Please also provide any your suggestions and comments to improve each item and dimension.
Pride from Increased Institution Visibility Dimension definition & Items Relevance Clarity
“Student’s strong sense of self-respect due to increased institution’s visibility nationally and internationally owing to their intercollegiate team”
Not relevant at all
Very relevan
t
Not clear at all
Very clear
Any your suggestions to
improve each item. 1. Following Gator football is a high priority among my leisure
activities. ① ② ③ ④ ⑤ ① ② ③ ④ ⑤
2. Gator football elevates the visibility of the university nationally. ① ② ③ ④ ⑤ ① ② ③ ④ ⑤
3. Gator football enhances the media coverage of the school. ① ② ③ ④ ⑤ ① ② ③ ④ ⑤ 4. UF becomes a nationally known university because of Gator
football. ① ② ③ ④ ⑤ ① ② ③ ④ ⑤
5. UF is exposed to outsiders as a result of Gator football. ① ② ③ ④ ⑤ ① ② ③ ④ ⑤
6. UF’s visibility has been increased due to Gator football. ① ② ③ ④ ⑤ ① ② ③ ④ ⑤
7. UF’s visibility is not solely dependent upon Gator football. ① ② ③ ④ ⑤ ① ② ③ ④ ⑤
8. Outsiders know more about UF due to Gator football. ① ② ③ ④ ⑤ ① ② ③ ④ ⑤ Please feel free to provide feedback on this dimension (definition, understandability, and appropriateness)
Please feel free to provide feedback on items. You can also write new items or delete items.
Any your suggestions and comments to improve this specific dimension & items.
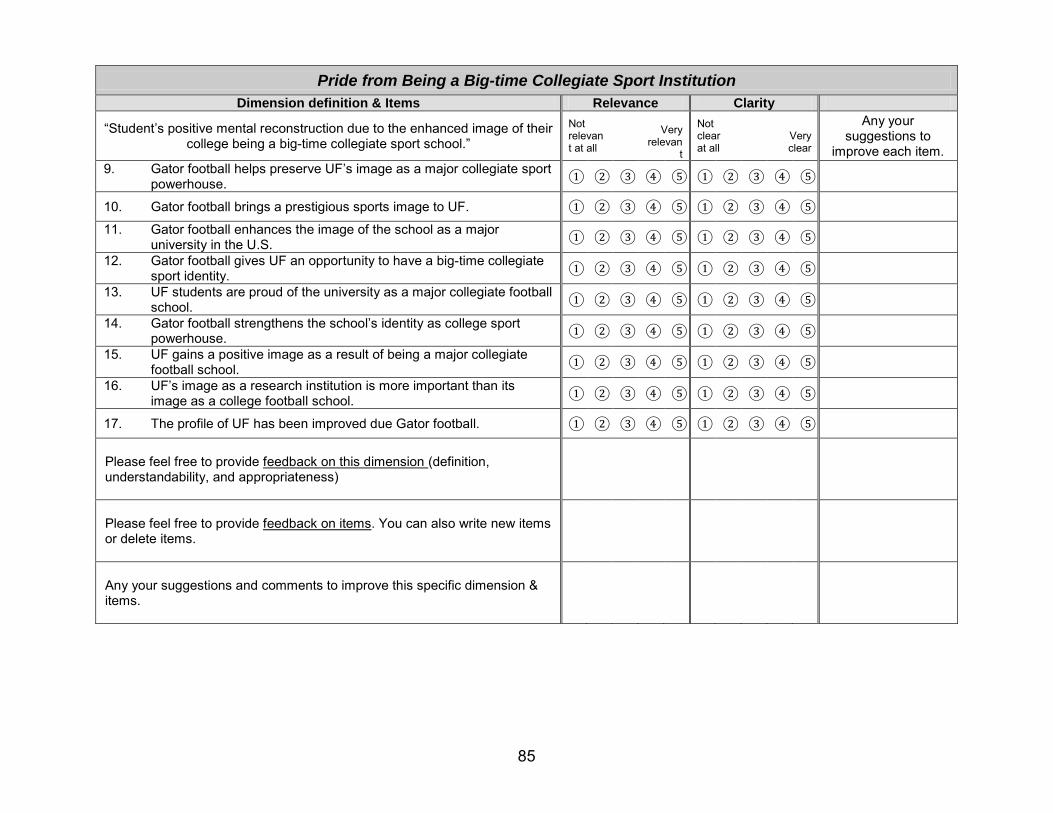
85
Pride from Being a Big-time Collegiate Sport Institution Dimension definition & Items Relevance Clarity
“Student’s positive mental reconstruction due to the enhanced image of their college being a big-time collegiate sport school.”
Not relevant at all
Very relevan
t
Not clear at all
Very clear
Any your suggestions to
improve each item. 9. Gator football helps preserve UF’s image as a major collegiate sport
powerhouse. ① ② ③ ④ ⑤ ① ② ③ ④ ⑤
10. Gator football brings a prestigious sports image to UF. ① ② ③ ④ ⑤ ① ② ③ ④ ⑤ 11. Gator football enhances the image of the school as a major
university in the U.S. ① ② ③ ④ ⑤ ① ② ③ ④ ⑤ 12. Gator football gives UF an opportunity to have a big-time collegiate
sport identity. ① ② ③ ④ ⑤ ① ② ③ ④ ⑤ 13. UF students are proud of the university as a major collegiate football
school. ① ② ③ ④ ⑤ ① ② ③ ④ ⑤ 14. Gator football strengthens the school’s identity as college sport
powerhouse. ① ② ③ ④ ⑤ ① ② ③ ④ ⑤ 15. UF gains a positive image as a result of being a major collegiate
football school. ① ② ③ ④ ⑤ ① ② ③ ④ ⑤ 16. UF’s image as a research institution is more important than its
image as a college football school. ① ② ③ ④ ⑤ ① ② ③ ④ ⑤
17. The profile of UF has been improved due Gator football. ① ② ③ ④ ⑤ ① ② ③ ④ ⑤ Please feel free to provide feedback on this dimension (definition, understandability, and appropriateness)
Please feel free to provide feedback on items. You can also write new items or delete items.
Any your suggestions and comments to improve this specific dimension & items.
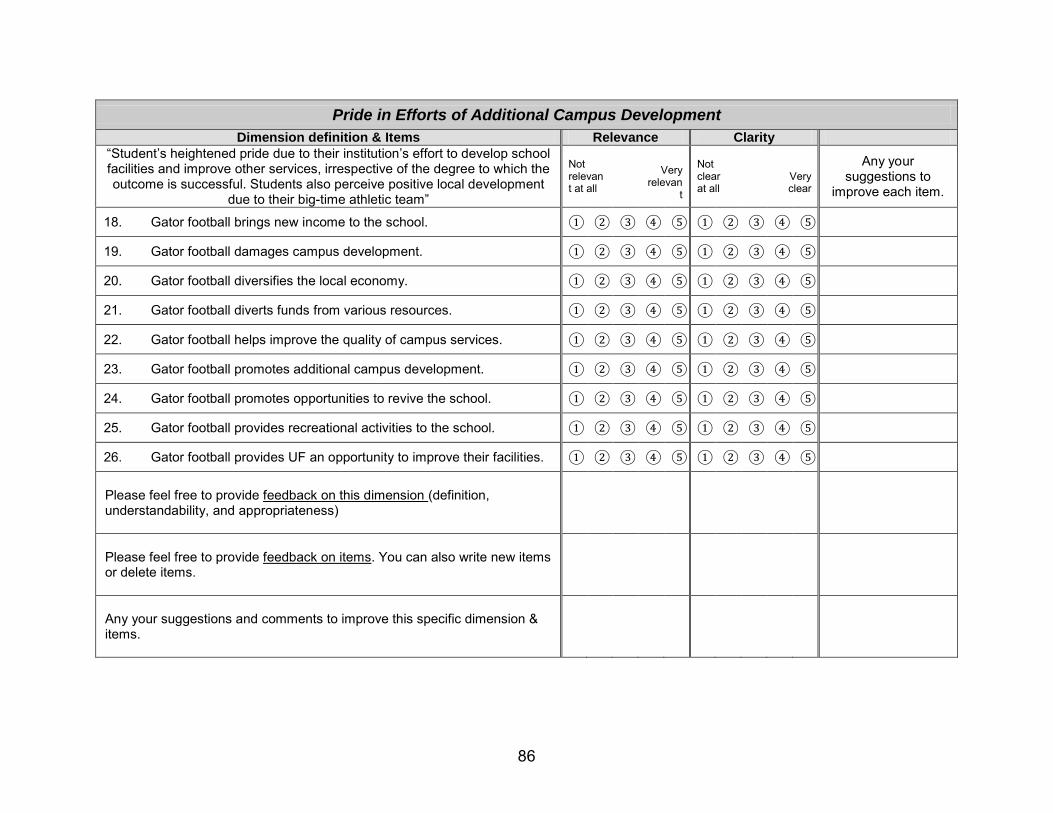
86
Pride in Efforts of Additional Campus Development Dimension definition & Items Relevance Clarity
“Student’s heightened pride due to their institution’s effort to develop school facilities and improve other services, irrespective of the degree to which the outcome is successful. Students also perceive positive local development
due to their big-time athletic team”
Not relevant at all
Very relevan
t
Not clear at all
Very clear
Any your suggestions to
improve each item.
18. Gator football brings new income to the school. ① ② ③ ④ ⑤ ① ② ③ ④ ⑤
19. Gator football damages campus development. ① ② ③ ④ ⑤ ① ② ③ ④ ⑤
20. Gator football diversifies the local economy. ① ② ③ ④ ⑤ ① ② ③ ④ ⑤
21. Gator football diverts funds from various resources. ① ② ③ ④ ⑤ ① ② ③ ④ ⑤
22. Gator football helps improve the quality of campus services. ① ② ③ ④ ⑤ ① ② ③ ④ ⑤
23. Gator football promotes additional campus development. ① ② ③ ④ ⑤ ① ② ③ ④ ⑤
24. Gator football promotes opportunities to revive the school. ① ② ③ ④ ⑤ ① ② ③ ④ ⑤
25. Gator football provides recreational activities to the school. ① ② ③ ④ ⑤ ① ② ③ ④ ⑤
26. Gator football provides UF an opportunity to improve their facilities. ① ② ③ ④ ⑤ ① ② ③ ④ ⑤ Please feel free to provide feedback on this dimension (definition, understandability, and appropriateness)
Please feel free to provide feedback on items. You can also write new items or delete items.
Any your suggestions and comments to improve this specific dimension & items.

87
Excitement Quotient from Visitors Dimension definition & Items Relevance Clarity
“Student’s emotionally stimulated state that comes from home team’s games”
Not relevant at all
Very relevan
t
Not clear at all
Very clear
Any your suggestions to
improve each item.
27. I enjoy watching Gator football games. ① ② ③ ④ ⑤ ① ② ③ ④ ⑤
28. Gator football games are enjoyable. ① ② ③ ④ ⑤ ① ② ③ ④ ⑤
29. Gator football games are exciting. ① ② ③ ④ ⑤ ① ② ③ ④ ⑤
30. Gator football games do not pump me up. ① ② ③ ④ ⑤ ① ② ③ ④ ⑤
31. Gator football games bring excitement to UF. ① ② ③ ④ ⑤ ① ② ③ ④ ⑤
32. Gator football tailgating is enjoyable. ① ② ③ ④ ⑤ ① ② ③ ④ ⑤
33. Gator football games provide entertainment to UF. ① ② ③ ④ ⑤ ① ② ③ ④ ⑤
34. Gator football games stimulate me. ① ② ③ ④ ⑤ ① ② ③ ④ ⑤ Please feel free to provide feedback on this dimension (definition, understandability, and appropriateness)
Please feel free to provide feedback on items. You can also write new items or delete items.
Any your suggestions and comments to improve this specific dimension & items.
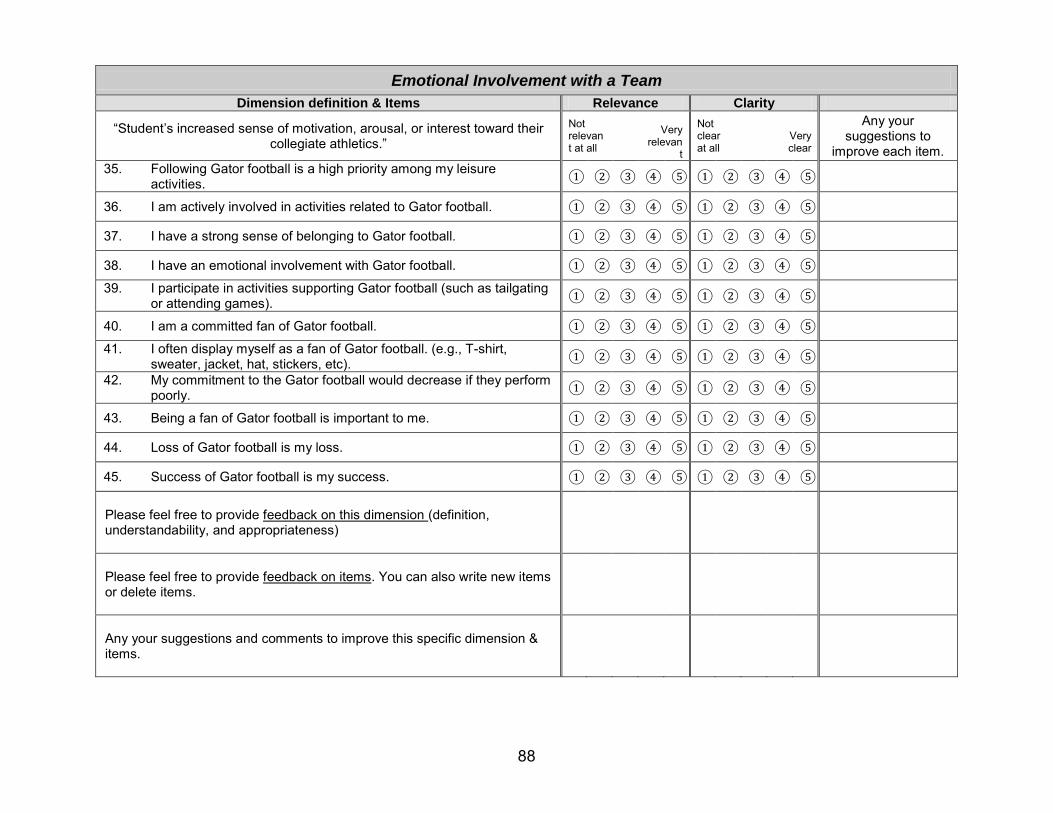
88
Emotional Involvement with a Team Dimension definition & Items Relevance Clarity
“Student’s increased sense of motivation, arousal, or interest toward their collegiate athletics.”
Not relevant at all
Very relevan
t
Not clear at all
Very clear
Any your suggestions to
improve each item. 35. Following Gator football is a high priority among my leisure
activities. ① ② ③ ④ ⑤ ① ② ③ ④ ⑤
36. I am actively involved in activities related to Gator football. ① ② ③ ④ ⑤ ① ② ③ ④ ⑤
37. I have a strong sense of belonging to Gator football. ① ② ③ ④ ⑤ ① ② ③ ④ ⑤
38. I have an emotional involvement with Gator football. ① ② ③ ④ ⑤ ① ② ③ ④ ⑤ 39. I participate in activities supporting Gator football (such as tailgating
or attending games). ① ② ③ ④ ⑤ ① ② ③ ④ ⑤
40. I am a committed fan of Gator football. ① ② ③ ④ ⑤ ① ② ③ ④ ⑤ 41. I often display myself as a fan of Gator football. (e.g., T-shirt,
sweater, jacket, hat, stickers, etc). ① ② ③ ④ ⑤ ① ② ③ ④ ⑤ 42. My commitment to the Gator football would decrease if they perform
poorly. ① ② ③ ④ ⑤ ① ② ③ ④ ⑤
43. Being a fan of Gator football is important to me. ① ② ③ ④ ⑤ ① ② ③ ④ ⑤
44. Loss of Gator football is my loss. ① ② ③ ④ ⑤ ① ② ③ ④ ⑤
45. Success of Gator football is my success. ① ② ③ ④ ⑤ ① ② ③ ④ ⑤ Please feel free to provide feedback on this dimension (definition, understandability, and appropriateness)
Please feel free to provide feedback on items. You can also write new items or delete items.
Any your suggestions and comments to improve this specific dimension & items.
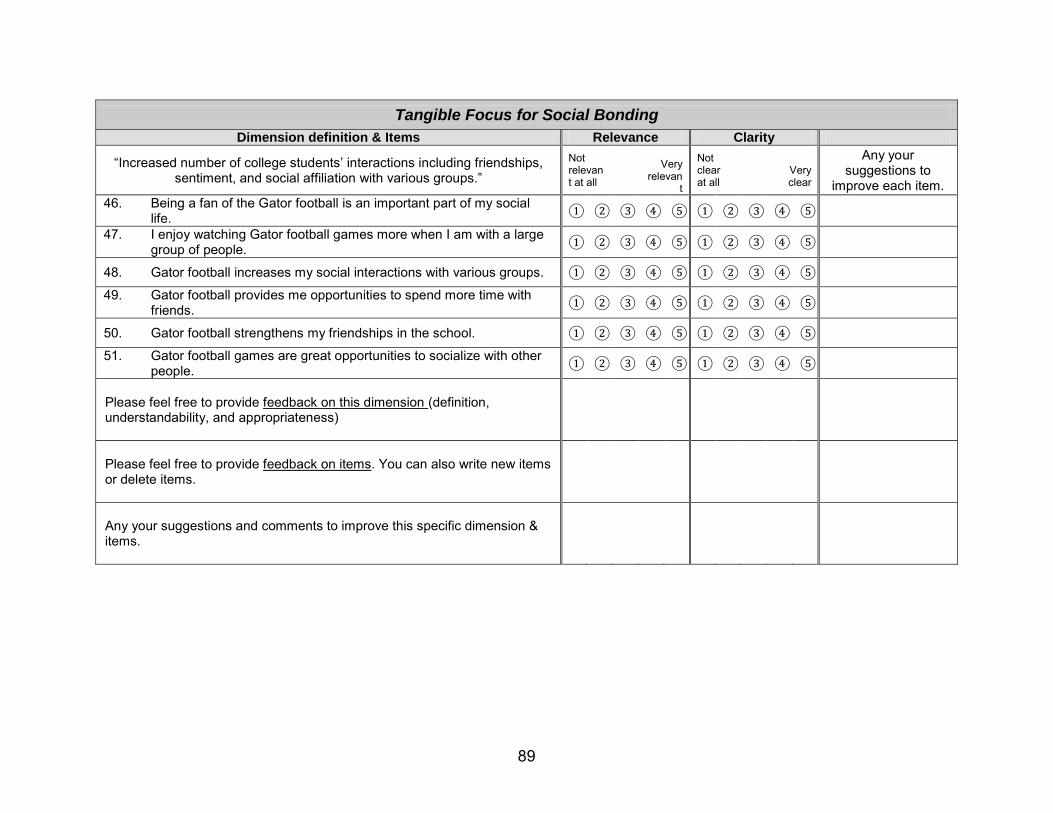
89
Tangible Focus for Social Bonding Dimension definition & Items Relevance Clarity
“Increased number of college students’ interactions including friendships, sentiment, and social affiliation with various groups.”
Not relevant at all
Very relevan
t
Not clear at all
Very clear
Any your suggestions to
improve each item. 46. Being a fan of the Gator football is an important part of my social
life. ① ② ③ ④ ⑤ ① ② ③ ④ ⑤ 47. I enjoy watching Gator football games more when I am with a large
group of people. ① ② ③ ④ ⑤ ① ② ③ ④ ⑤
48. Gator football increases my social interactions with various groups. ① ② ③ ④ ⑤ ① ② ③ ④ ⑤ 49. Gator football provides me opportunities to spend more time with
friends. ① ② ③ ④ ⑤ ① ② ③ ④ ⑤
50. Gator football strengthens my friendships in the school. ① ② ③ ④ ⑤ ① ② ③ ④ ⑤ 51. Gator football games are great opportunities to socialize with other
people. ① ② ③ ④ ⑤ ① ② ③ ④ ⑤ Please feel free to provide feedback on this dimension (definition, understandability, and appropriateness)
Please feel free to provide feedback on items. You can also write new items or delete items.
Any your suggestions and comments to improve this specific dimension & items.
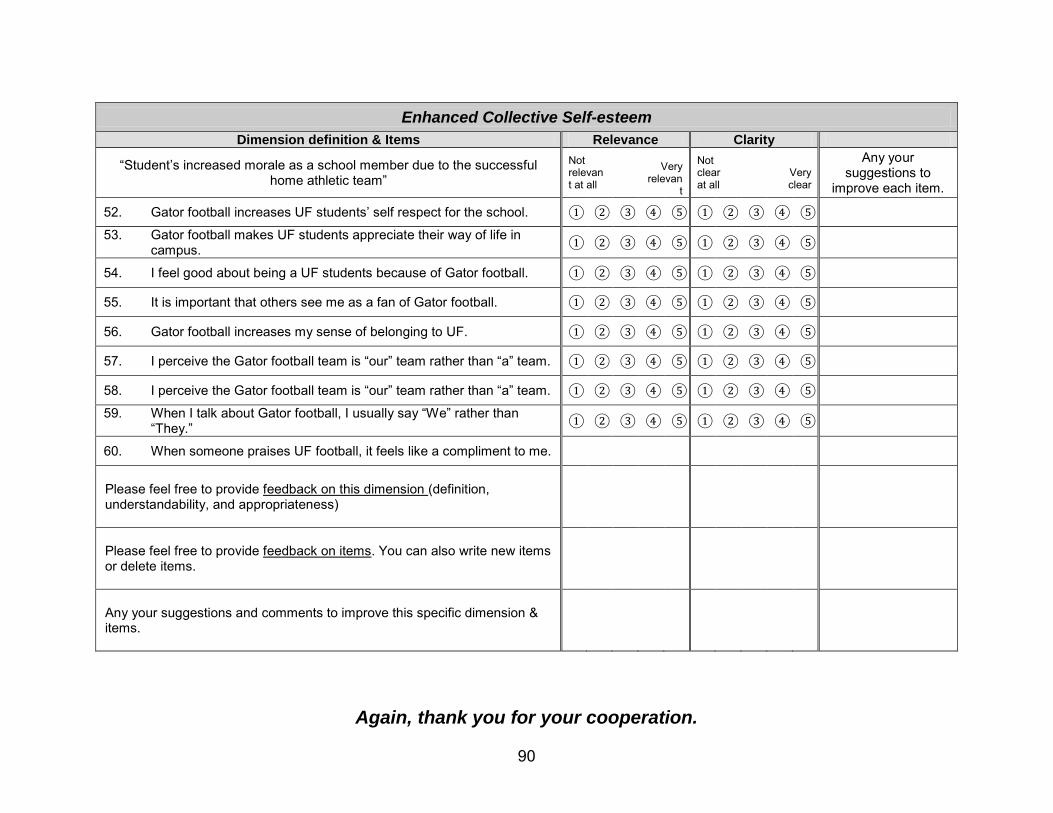
90
Enhanced Collective Self-esteem Dimension definition & Items Relevance Clarity
“Student’s increased morale as a school member due to the successful home athletic team”
Not relevant at all
Very relevan
t
Not clear at all
Very clear
Any your suggestions to
improve each item.
52. Gator football increases UF students’ self respect for the school. ① ② ③ ④ ⑤ ① ② ③ ④ ⑤ 53. Gator football makes UF students appreciate their way of life in
campus. ① ② ③ ④ ⑤ ① ② ③ ④ ⑤
54. I feel good about being a UF students because of Gator football. ① ② ③ ④ ⑤ ① ② ③ ④ ⑤
55. It is important that others see me as a fan of Gator football. ① ② ③ ④ ⑤ ① ② ③ ④ ⑤
56. Gator football increases my sense of belonging to UF. ① ② ③ ④ ⑤ ① ② ③ ④ ⑤
57. I perceive the Gator football team is “our” team rather than “a” team. ① ② ③ ④ ⑤ ① ② ③ ④ ⑤
58. I perceive the Gator football team is “our” team rather than “a” team. ① ② ③ ④ ⑤ ① ② ③ ④ ⑤ 59. When I talk about Gator football, I usually say “We” rather than
“They.” ① ② ③ ④ ⑤ ① ② ③ ④ ⑤
60. When someone praises UF football, it feels like a compliment to me. Please feel free to provide feedback on this dimension (definition, understandability, and appropriateness)
Please feel free to provide feedback on items. You can also write new items or delete items.
Any your suggestions and comments to improve this specific dimension & items.
Again, thank you for your cooperation.
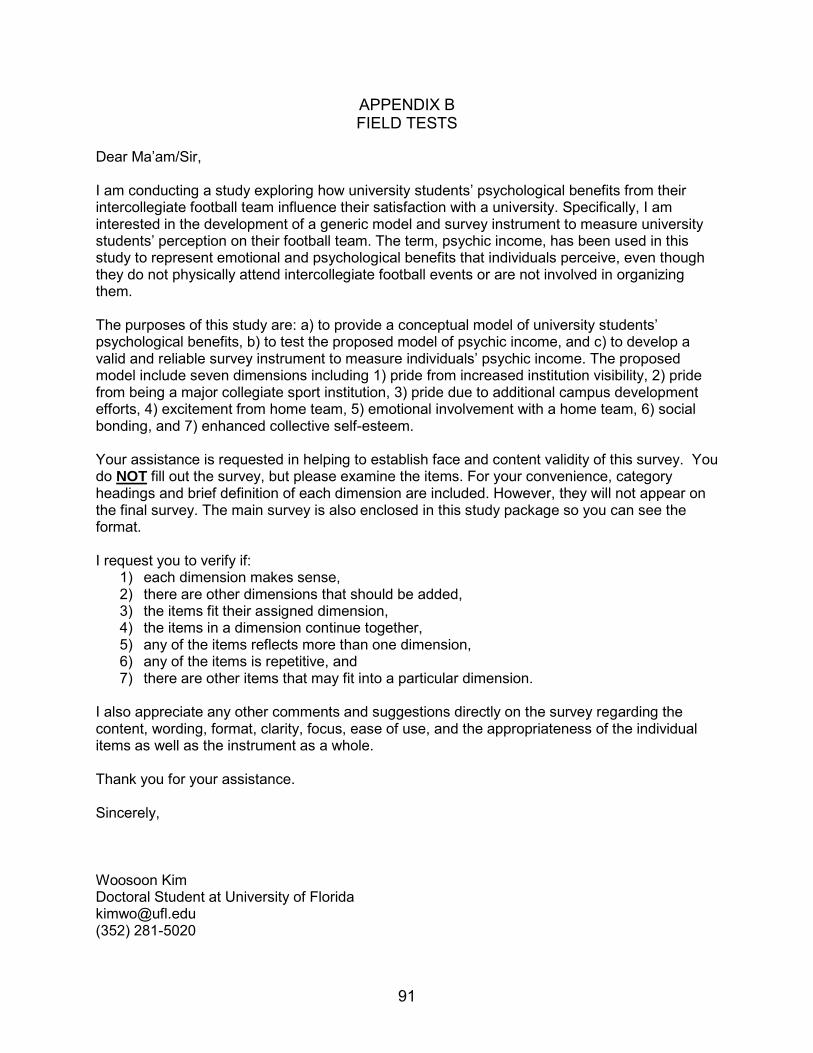
91
APPENDIX B FIELD TESTS
Dear Ma’am/Sir,
I am conducting a study exploring how university students’ psychological benefits from their intercollegiate football team influence their satisfaction with a university. Specifically, I am interested in the development of a generic model and survey instrument to measure university students’ perception on their football team. The term, psychic income, has been used in this study to represent emotional and psychological benefits that individuals perceive, even though they do not physically attend intercollegiate football events or are not involved in organizing them. The purposes of this study are: a) to provide a conceptual model of university students’ psychological benefits, b) to test the proposed model of psychic income, and c) to develop a valid and reliable survey instrument to measure individuals’ psychic income. The proposed model include seven dimensions including 1) pride from increased institution visibility, 2) pride from being a major collegiate sport institution, 3) pride due to additional campus development efforts, 4) excitement from home team, 5) emotional involvement with a home team, 6) social bonding, and 7) enhanced collective self-esteem. Your assistance is requested in helping to establish face and content validity of this survey. You do NOT fill out the survey, but please examine the items. For your convenience, category headings and brief definition of each dimension are included. However, they will not appear on the final survey. The main survey is also enclosed in this study package so you can see the format. I request you to verify if:
1) each dimension makes sense, 2) there are other dimensions that should be added, 3) the items fit their assigned dimension, 4) the items in a dimension continue together, 5) any of the items reflects more than one dimension, 6) any of the items is repetitive, and 7) there are other items that may fit into a particular dimension.
I also appreciate any other comments and suggestions directly on the survey regarding the content, wording, format, clarity, focus, ease of use, and the appropriateness of the individual items as well as the instrument as a whole. Thank you for your assistance. Sincerely, Woosoon Kim Doctoral Student at University of Florida [email protected] (352) 281-5020
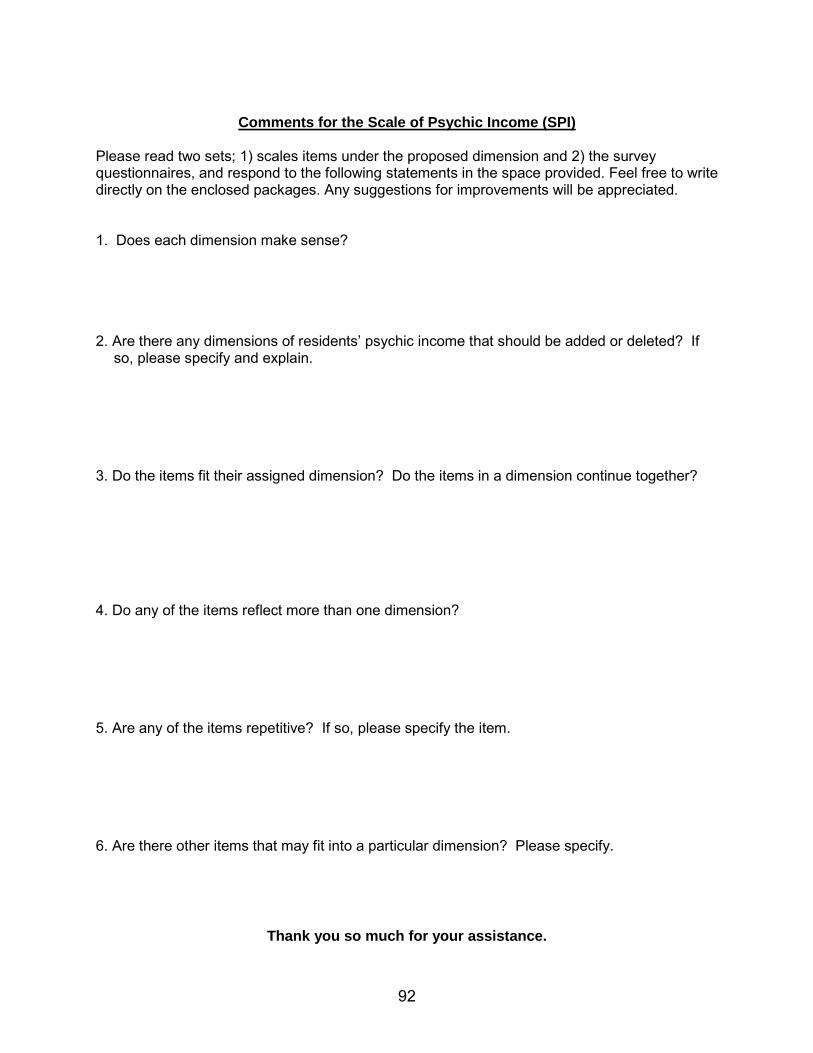
92
Comments for the Scale of Psychic Income (SPI)
Please read two sets; 1) scales items under the proposed dimension and 2) the survey questionnaires, and respond to the following statements in the space provided. Feel free to write directly on the enclosed packages. Any suggestions for improvements will be appreciated. 1. Does each dimension make sense? 2. Are there any dimensions of residents’ psychic income that should be added or deleted? If
so, please specify and explain. 3. Do the items fit their assigned dimension? Do the items in a dimension continue together? 4. Do any of the items reflect more than one dimension? 5. Are any of the items repetitive? If so, please specify the item. 6. Are there other items that may fit into a particular dimension? Please specify.
Thank you so much for your assistance.
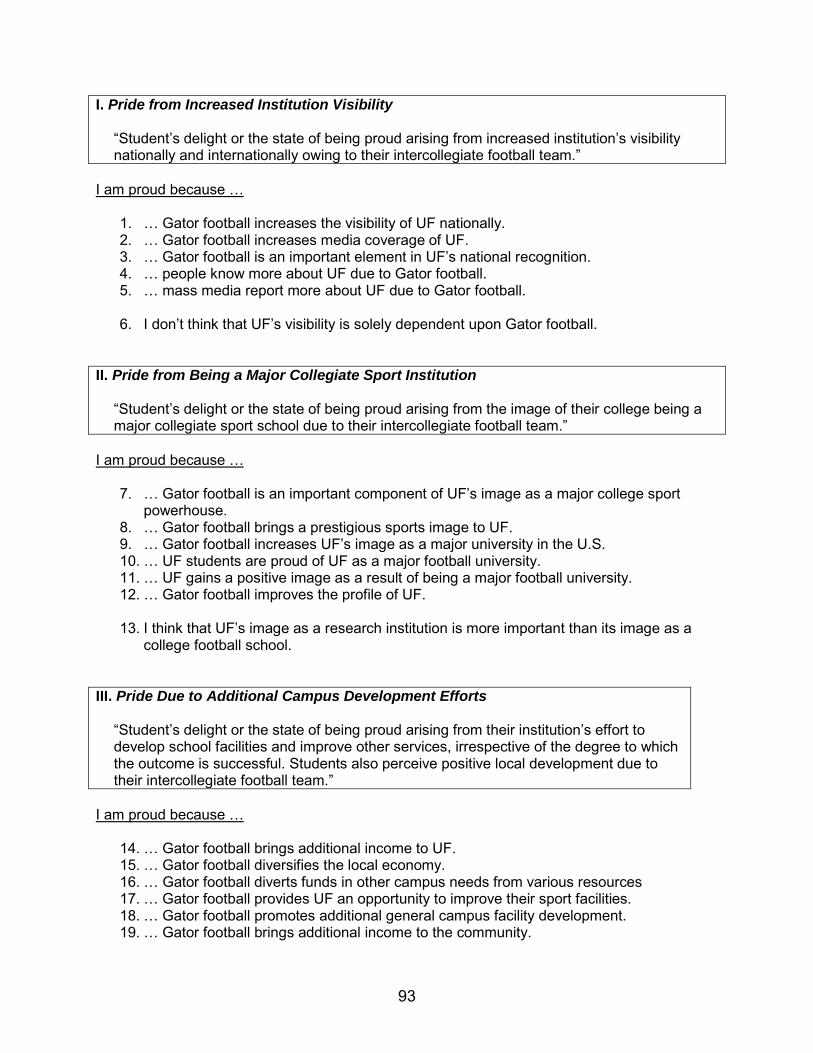
93
I. Pride from Increased Institution Visibility
“Student’s delight or the state of being proud arising from increased institution’s visibility nationally and internationally owing to their intercollegiate football team.”
I am proud because …
1. … Gator football increases the visibility of UF nationally. 2. … Gator football increases media coverage of UF. 3. … Gator football is an important element in UF’s national recognition. 4. … people know more about UF due to Gator football. 5. … mass media report more about UF due to Gator football.
6. I don’t think that UF’s visibility is solely dependent upon Gator football.
II. Pride from Being a Major Collegiate Sport Institution
“Student’s delight or the state of being proud arising from the image of their college being a major collegiate sport school due to their intercollegiate football team.”
I am proud because …
7. … Gator football is an important component of UF’s image as a major college sport powerhouse.
8. … Gator football brings a prestigious sports image to UF. 9. … Gator football increases UF’s image as a major university in the U.S. 10. … UF students are proud of UF as a major football university. 11. … UF gains a positive image as a result of being a major football university. 12. … Gator football improves the profile of UF. 13. I think that UF’s image as a research institution is more important than its image as a
college football school. III. Pride Due to Additional Campus Development Efforts
“Student’s delight or the state of being proud arising from their institution’s effort to develop school facilities and improve other services, irrespective of the degree to which the outcome is successful. Students also perceive positive local development due to their intercollegiate football team.”
I am proud because …
14. … Gator football brings additional income to UF. 15. … Gator football diversifies the local economy. 16. … Gator football diverts funds in other campus needs from various resources 17. … Gator football provides UF an opportunity to improve their sport facilities. 18. … Gator football promotes additional general campus facility development. 19. … Gator football brings additional income to the community.
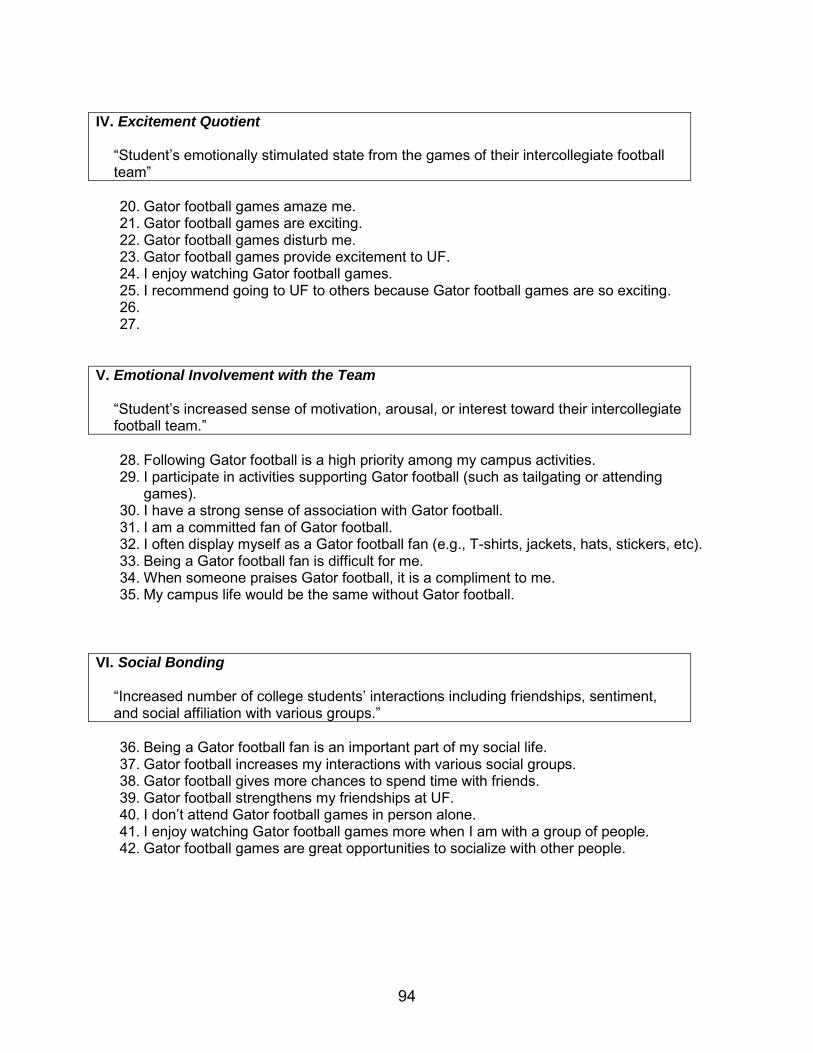
94
IV. Excitement Quotient
“Student’s emotionally stimulated state from the games of their intercollegiate football team”
20. Gator football games amaze me. 21. Gator football games are exciting. 22. Gator football games disturb me. 23. Gator football games provide excitement to UF. 24. I enjoy watching Gator football games. 25. I recommend going to UF to others because Gator football games are so exciting. 26. 27.
V. Emotional Involvement with the Team
“Student’s increased sense of motivation, arousal, or interest toward their intercollegiate football team.”
28. Following Gator football is a high priority among my campus activities. 29. I participate in activities supporting Gator football (such as tailgating or attending
games). 30. I have a strong sense of association with Gator football. 31. I am a committed fan of Gator football. 32. I often display myself as a Gator football fan (e.g., T-shirts, jackets, hats, stickers, etc). 33. Being a Gator football fan is difficult for me. 34. When someone praises Gator football, it is a compliment to me. 35. My campus life would be the same without Gator football.
VI. Social Bonding
“Increased number of college students’ interactions including friendships, sentiment, and social affiliation with various groups.”
36. Being a Gator football fan is an important part of my social life. 37. Gator football increases my interactions with various social groups. 38. Gator football gives more chances to spend time with friends. 39. Gator football strengthens my friendships at UF. 40. I don’t attend Gator football games in person alone. 41. I enjoy watching Gator football games more when I am with a group of people. 42. Gator football games are great opportunities to socialize with other people.
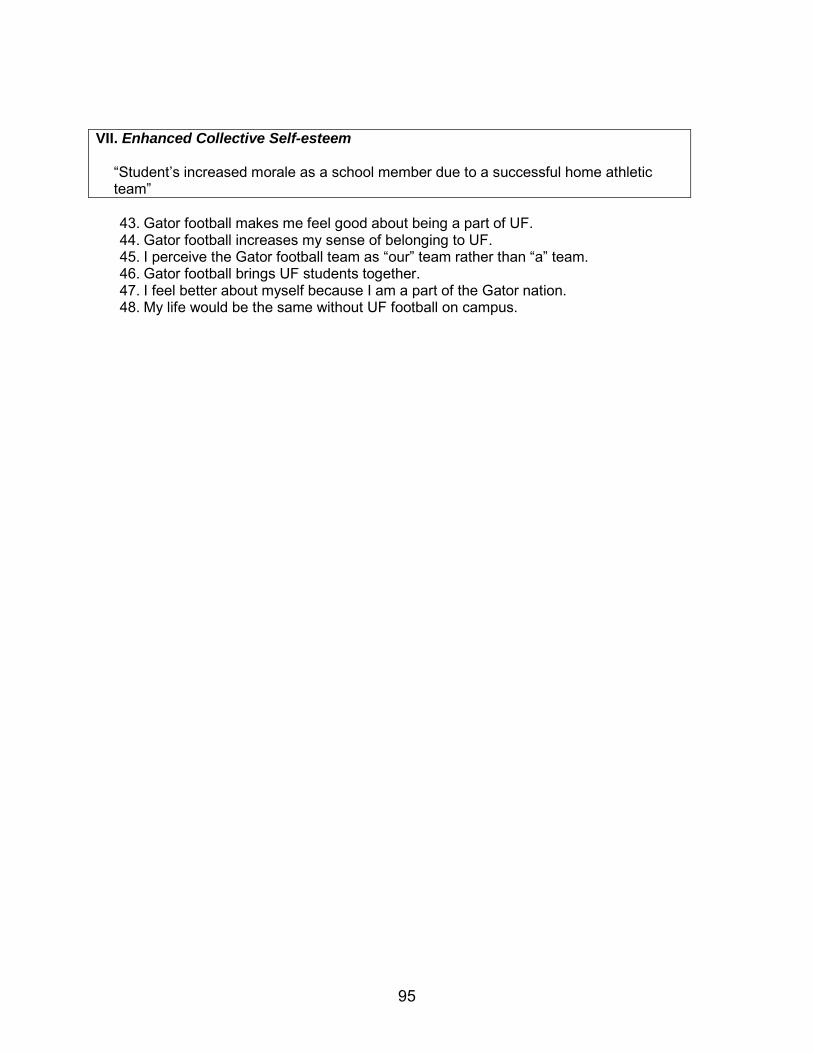
95
VII. Enhanced Collective Self-esteem
“Student’s increased morale as a school member due to a successful home athletic team”
43. Gator football makes me feel good about being a part of UF. 44. Gator football increases my sense of belonging to UF. 45. I perceive the Gator football team as “our” team rather than “a” team. 46. Gator football brings UF students together. 47. I feel better about myself because I am a part of the Gator nation. 48. My life would be the same without UF football on campus.
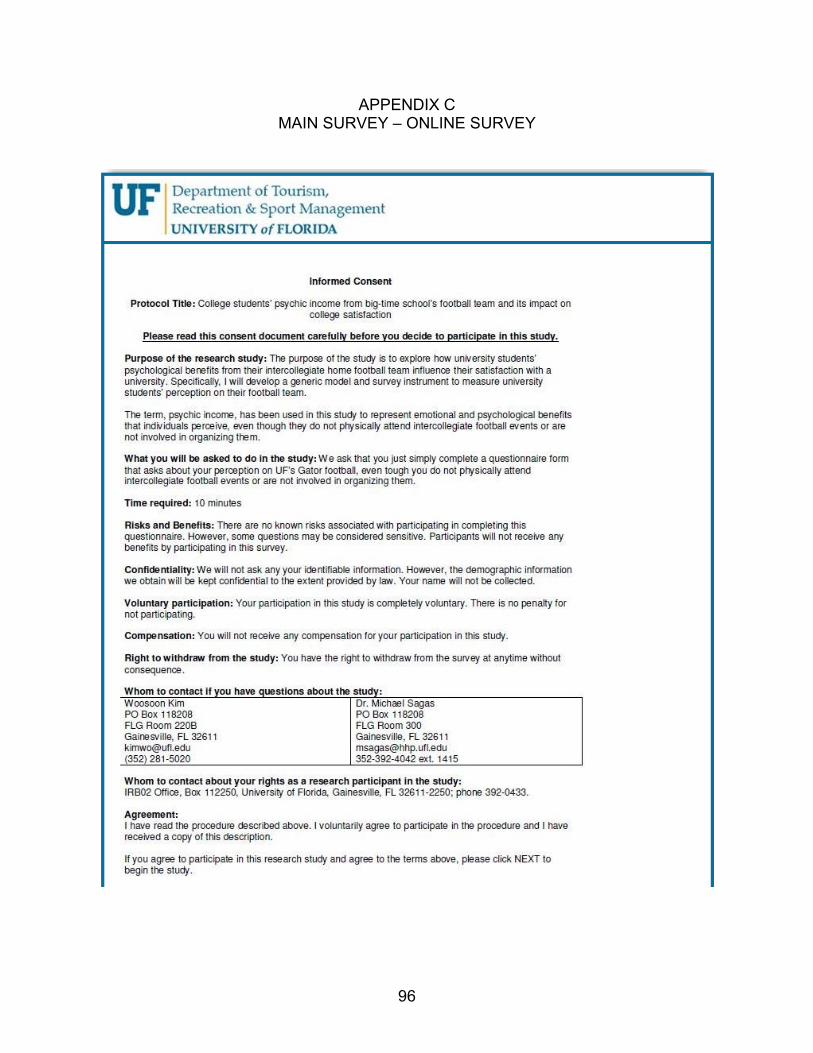
96
APPENDIX C MAIN SURVEY – ONLINE SURVEY
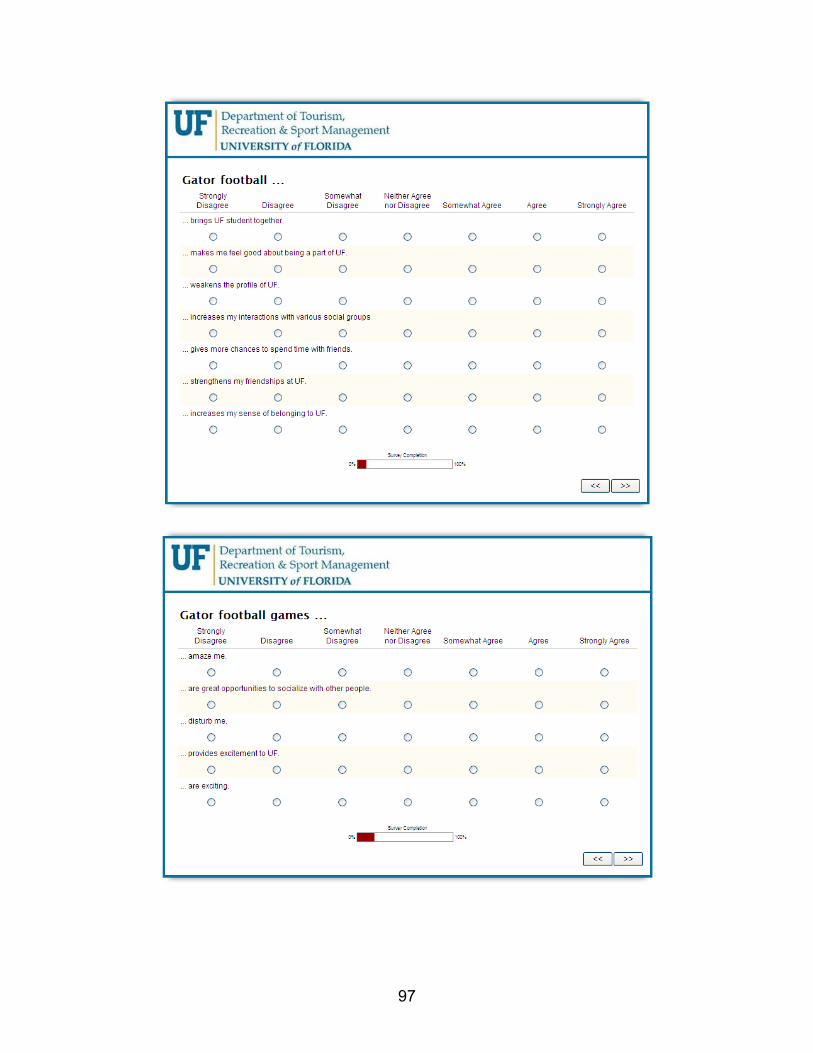
97
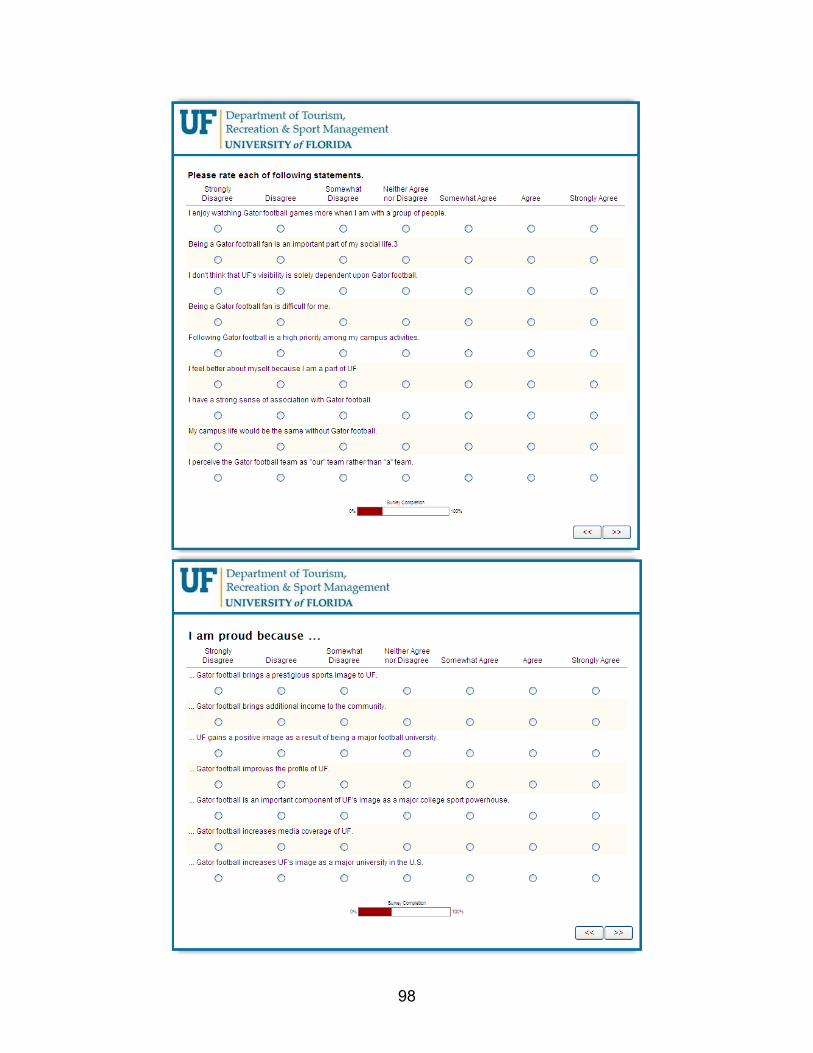
98
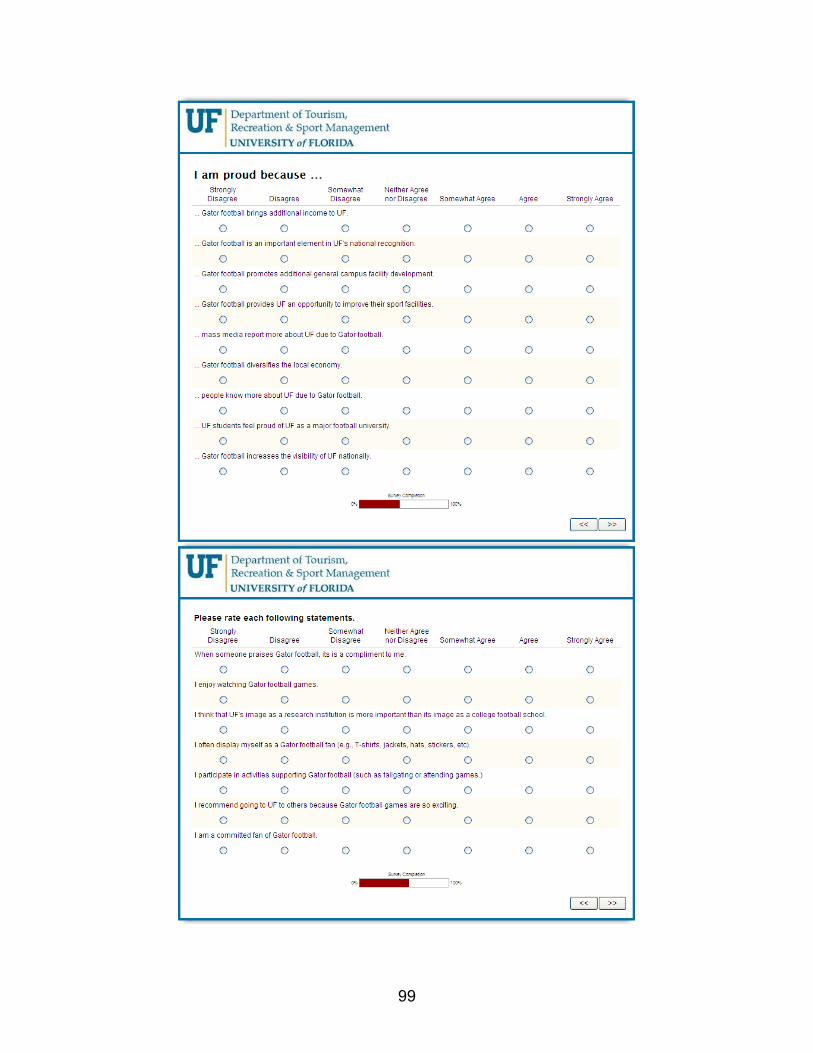
99
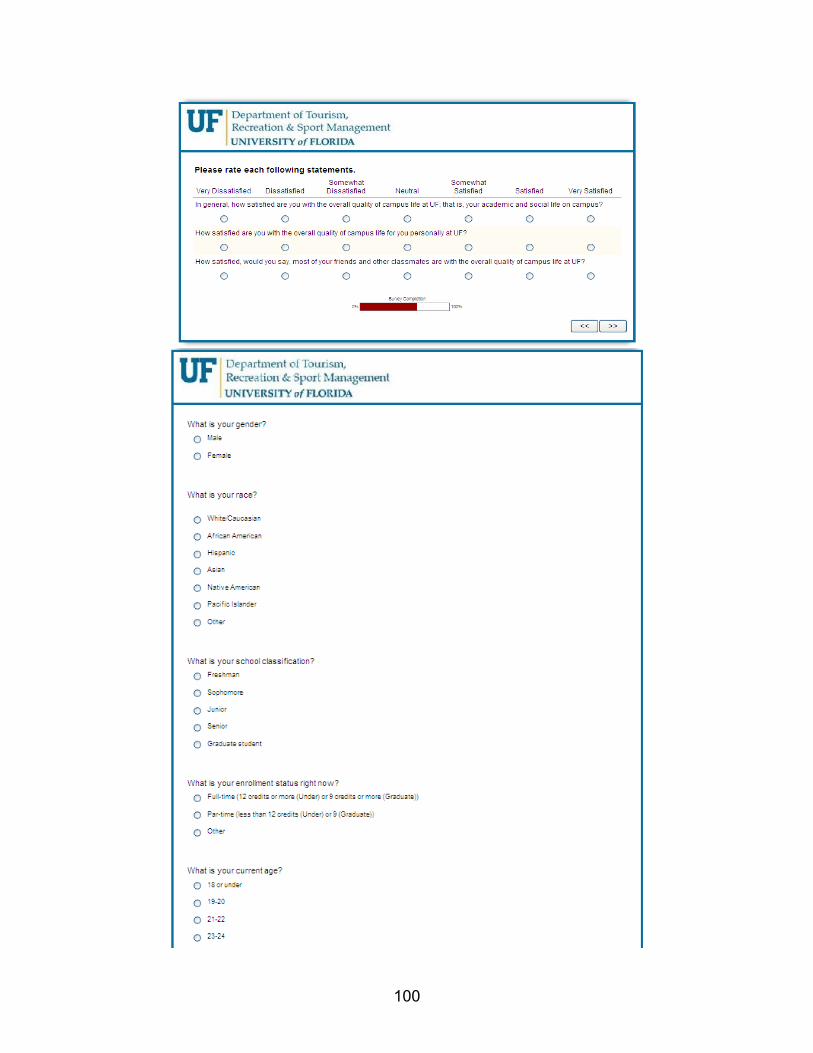
100
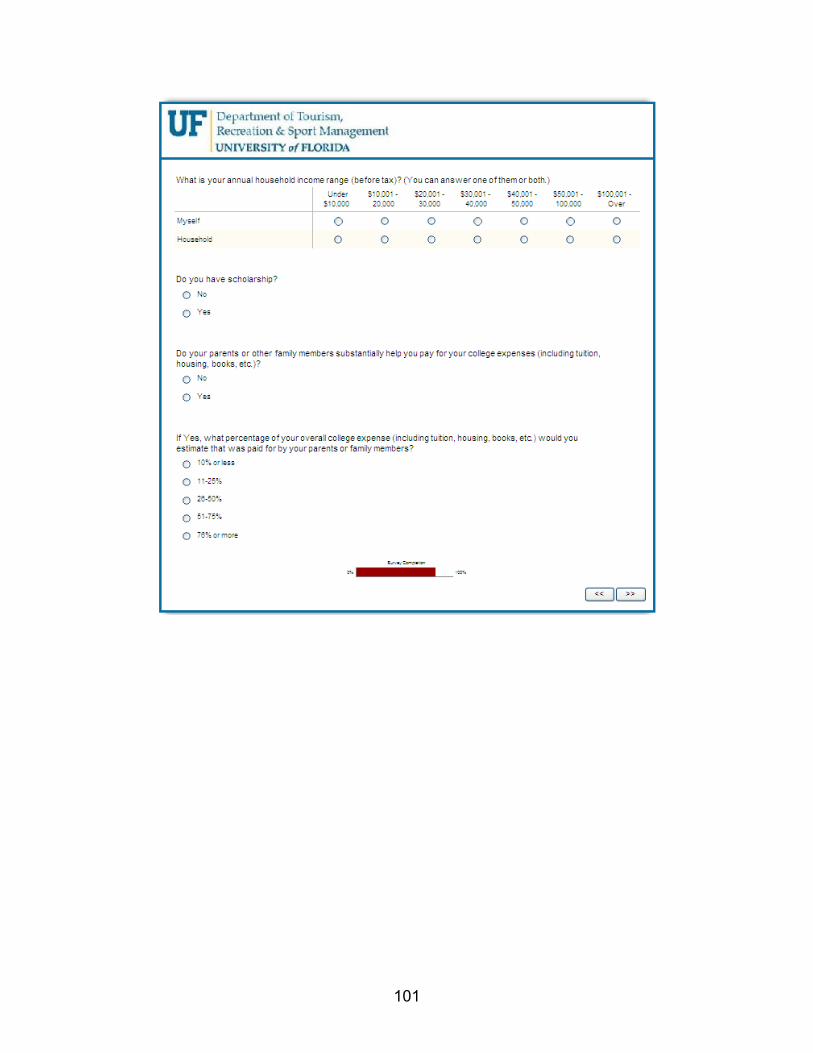
101
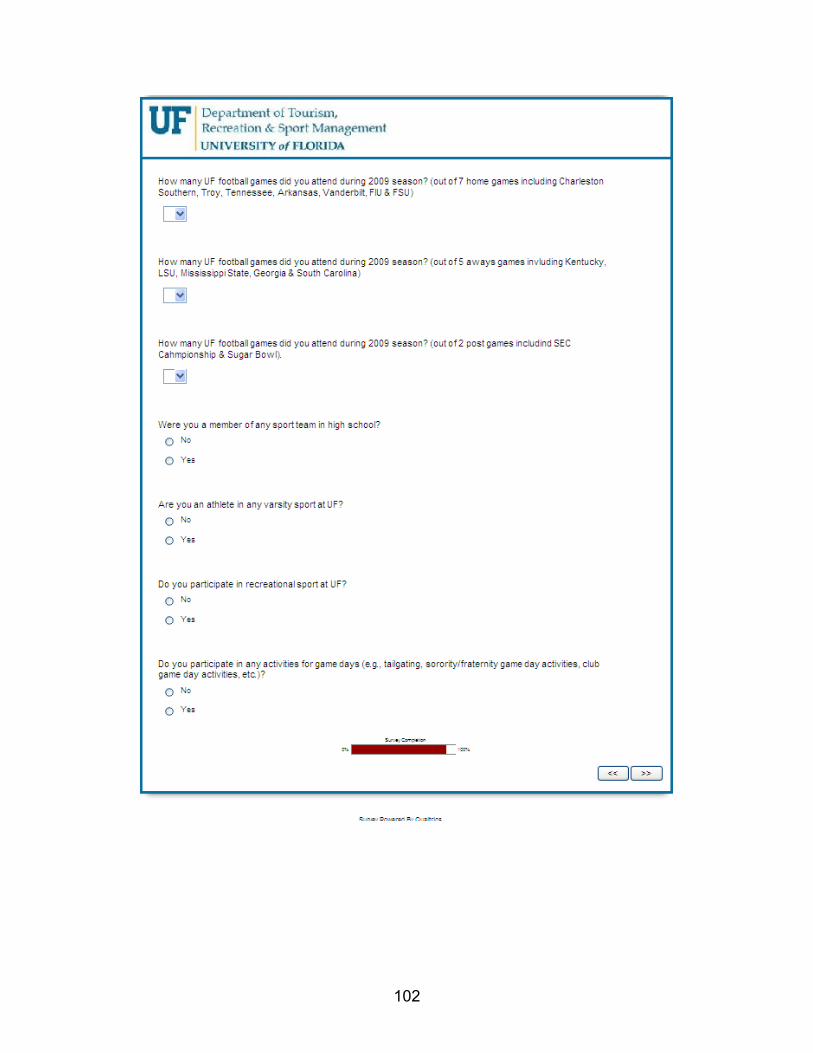
102
103
104
LIST OF REFERENCES
Abdel-Khalek, A.M. (2003). Happiness among Kuwaiti college students. Journal of Happiness Studies, 5, 93-97.
Algina, J. (2008, Spring semester). Structural Equation Modeling, EDF 7412. Class
Lecture. University of Florida. Andereck, K.L., Valentine, K.M., Knopf, R.C., & Vogt, C.A. (2005). Residents’
perceptions of community tourism impacts. Annals of Tourism Research, 32(4), 1056-1076.
Andereck, K., & Vogt, C. (2000). The relationship between residents’ attitude toward
tourism and tourism development options. Journal of Travel Research, 39(Aug), 27-36.
Anderson, D.R., Gerbing, D.W. (1998). Structural equation modeling practice: A review
and recommended two-step approach. Psychological Bulletin, 103, 411-423. Artinger, L., Clapham, L., Hunt, C., Meigs, M., Milord, N., Sampson, B., et al. (2006).
The social benefits of intramural sports. Journal of Student Affairs Research and Practice, 43(1), 69-86.
Ary, D., Jocobs, L.C., Razavieh, A., & Corensen, C. (2006). Introduction to research in
education. Belmont, CA: Thomson Higher Education. Astin, A.W. (1977). What matters most in college: four critical years. San Francisco:
Jossey-Bass. Astin, A.W. (1999). Student involvement: A development theory for higher education.
Journal of College Student Personnel,40(5), 518-529. Austrian, Z., & Rosentraub, M. S. (2002). Cities, sports, and economic change: a
retrospective assessment. Journal of Urban Affairs, 24(5), 549-563. Baade, R.A., & Sundberg, J. (1994). Fourth down and gold to go? Assessing the link
between athletics and alumni giving. Social Science Quarterly, 77(4), 789-803. Baade, R.A., Baumann, R., & Matheson, V.A. (2007). Down, set, hike: The economic
impact of college football games on local economies. Working Paper Series, Paper No. 01-01. International Association of Sports Economists.
Babbie, E. (1992). The practice of social research (6th ed.). Belmont, CA: Thomson
Wadsworth. Balatsky, G., & Diener, E. (1993). Subjective well-being among Russian students.
Humanities, Social Sciences and Law, 28(3), 225-243.
105
Barich, H. & Kotler, P. (1991). A framework for marketing image management. Sloan
Management Review, 32(2), 94-104. Berger, D.E. (2004). Using regression analysis. In Wholey, J.S., Hatry, H.P., &
Newcomer, K.E. (Eds.), Handbook of practical program evaluation (pp. 479-505). San Francisco; Wiley.
Belanger, C., Mount, J., & Wilson, M. (2002). Institutional image and retention. Tertiary
Education and Management, 8(3), 217-230. Betz, E.L., Klingensmith, J.E., & Menne, J.W. (1970). The measurement and analysis
college student satisfaction. Measurement and Evaluation in Guidance, 4, 99-106. Bhattacharya, C.B., & Sen, S. (2003). Consumer-company identification: A framework
for understanding customer’s relationships with companies. Journal of Marketing, 67(April), 76-88.
Blumenthal, K.J. (2009). Collegiate recreational sports: pivotal players in student
success. Planning for Higher Education, 37(2), 52-62. Bollen, K.A. (1989). Structural equations with latent variables. New York: Wiely. Borne, L.E. & Ekstrand,B.R. (1985). Psychology: It’s principals and meanings. (5th ed.)
New York: Holt, Reinhart and Winston. Brand, M. (2006). The role and value of intercollegiate athletics in universities. Journal
of the Philosophy of Sport, 33, 9-20. Branscombe, N.R., & Wann, D.L. (1991). The positive social and self concept
consequences of sports team identification. Journal of Sport and Social Issues, 15(2), 115-127.
Bremmer, D.S., & Kesslring, R.G. (1993). The advertising effect of university athletic
success: A reappraisal of the evidence. Quarterly Review of Economics and Finance, 33(4), 409-421
. Brewer, M.B., & Gardner, W. (2004). Who is this “we”? levels of collective identity and
self representations. In M.J. Hatch & M. Schultz (Eds.), Organizational identity: a reader. (pp. 66-80). New York, NY: Oxford University Press.
Brown, M.W., & Cudeck, R. (1993). Alternative ways of assessing model fit. In Bollen,
K.A., & Lang, J.S. (Eds.), Testing structural models. Newbury Park, CA: Sage Publications.
106
Burgan, B., & Mules, T. (1992). Economic impact of sporting events. Annals of Tourism Research, 19, 700-710.
Burnett, C. (2001). Social impact assessment and sport development. International
Review for the Sociology of Sport, 36(1), 41-57. Burns, J., & Mules, T. (1986). A framework for the analysis of major special events. In J.
Burns, H. J. Hatch, & T. Mules (Eds), The Adelaide Grand Pix: The impact of a special event (p. 5-38). Adelaide: The Center for South Australian Studies.
Campbell, A. (1981). The sense of well-being in America: recent patterns and trends.
New York: McGraw Hill. Cattell, R. B. (1966). The scree test for the number of factors. Multivariate Behavioral
Research, 1, 245-276. CBS Sports (2009). CBS sports to broadcast 26th consecutive NCAA men's basketball
tournament. Retrieved on October 27, 2009 from http://www.cbssports.com. Cha, K. (2003). Subjective well-being among college students. Social Indicators
Research, 62, 63(1-3), 457-477. Chalip. L. (2006). Towards social leverage of sport events. Journal of Sport & Tourism,
11(2), 109-127. Chapin, T.S. (2000). The political economy of sports facility location: an end-of-the-
century review and assessment. Marquette Sports Law Journal, 10(2), 361-382. Chapin, T.S. (2004). Sports facilities as urban redevelopment catalysts. Journal of the
American Planning Association, 70(2), 193-209. Cheek, J.M. (1989). Identity orientations and self-interpretation. In D.M. Buss & N.
Cantor (Eds.), Personality Psychology: Recent Trends and Emerging Directions (pp. 275-285). New York; Springer-Verlag.
Chow, H.P. (2005). Life satisfaction among university students in a Canadian prairie
city: a multivariate analysis. Social Indicators Research, 70, 139-150. Choi, H.S. & Sirakaya, E. (2005). Developing Sustainable Tourism Indicators for
Community Tourism Management. Tourism Management (In Press). Chou, C.P., & Bentler, P.M. (1995). Estimates and tests in structural equation modeling.
In R. H. Hoyle (Ed.), Structural equation modeling: Concepts, issues and applications (pp. 37-55). Thousand Oaks, CA: Sage.
107
Churchill, G. (1979). A paradigm for developing better measures of marketing constructs. Journal of Marketing Research, 17(4). 64-73.
Clark, B.R., & Trow, M. (1966). The organizational context. In T.M. Newcomb & E.K.
Wilson (Eds), College peer group (pp. 17-70). Chicago, IL: Aldine. Clopton, A.W. (2005). Sport and community: Exploring the relationship between fan
identification and sense of community on selected NCAA Division IA campuses (Doctoral dissertation). University of Kansas, Lawrence, KS.
Coates, D., & Humphreys, B.R. (2000). The stadium gambit and local economic
development. Regulation, 23(2), 15-20. Collins, M. (2004). Sport, physical activity and social exclusion. Journal of Sports
Science, 22(8), 727-740. Columbia College Chicago. (2009). Student satisfaction inventory. Retrieved on
November 7, 2009 from http://www.colum.edu. Crompton, J.L. (2004). Beyond economic impact: An alternative rationale for the public
subsidy of major league sports facilities. Journal of Sport Management, 18, 40-58. Cronbach, L.J. (1951). Coefficient alpha and the internal structure of test.
Psychometrika, 16, 297-334. Cummins, R.A., & Nistico, H. (2002). Maintaining life satisfaction: The role of positive
cognitive bias. Journal of Happiness Studies, 3(1), 37-69. Dehass, D.M. (2009). NCAA participation: 1981-82 - 2007-08 NCAA sports sponsorship
and participation rates report. Indianapolis, IN: National Collegiate Athletic Association.
Delamere, T.A., Wankel, L.M., & Hinch, T.D. (2001). Development of a scale to
measure resident attitudes toward the social impacts of community festivals, Part I: Item generation and purification of the measure. Event Management, 7, 11-24.
Deshieds, O.S., Kara, J., & Kaynak, E. (2005). Determinants of business student
satisfaction and retention in higher education: applying Herzberg’s two-factor theory. International Journal of Educational Management, 19(2), 128-139.
Diener, E., & Suh, E.M. (1999). National differences in subjective well-being. In
E.Kahneman, E. Eiener, & N. Schwarz (Eds.), Well-being: The foundations of hedonic psychology (pp. 434-450). New York: Russell Sage Foundation.
Diener, E.R., Emmons, L., & Griffin, S. (1985). The satisfaction with life scale. Journal of
Personality Assessment, 49, 71-75.

108
Downs, P.E. (2003). Values of recreational sports on college campuses. Recreational
Sports Journal, 27(1), Retrieved on November 15, 2009 from http://studentaffairsresearch.fsu.edu/Documents/RecreationalSportsExecsummary.pdf
Duderstadt, J. (2000). Intercollegiate athletics and the American university: a university
president’s perspective. Ann Arbor, MI: The University of Michigan Press. Dyer, P., Gursoy, D., Sharma, B., & Carter, J. (2007). Structural modeling of resident
perceptions of tourism and associated development on the Sunshine Coast, Australia. Tourism Management, 28, 409-422.
Eastern New Mexico University. (2009). Student satisfaction survey. Retrieved on
November 7, 2009 from http://www.enmu.edu. Eastern Oregon University. (2009). An assessment of the campus environment.
Retrieved on November 7, 2009 from http://www.eou.edusaffairs/ssi/index.html. Eckstein, R., & Delaney, K. (2002). New sports stadiums, community self-esteem, and
community collective conscience. Journal of Sport and Social Issues, 26(3), 235-247.
Eitzen, S. (2005). Sport in contemporary society: an anthology. Boulder, CO: Pradigm
Publishers. Elkins, D.J., Beggs, B.A., & Choutka, E. (2007). The contribution of constraint
negotiation to the leisure satisfaction of college students in campus recreation sports. Recreational Sports Journal, 31(2),
Florida International University. (2009). Florida international university student
satisfaction survey. Retrieved on November 7, 2009 from http://w3.fiu.edu. Forbes (2007). Ohio State's athletic budget nearly $110M for '07-08 school year.
Retrieved on October 27, 2009 from http://www.sportsbusinessdaily.com Forbes (2008). The most powerful coach in sports. Retrieved on October 27, 2009 from
http://www.forbes.com. Fornell, C., & Larcker, D.F. (1981). Evaluating structural equation models with
unobservable variables and measurement error. Journal of Marketing Research, 18(1), 39-50.
Fredline E., & Faulkner, B. (1998). Resident reaction to major tourist events: The Gold
Coast Indy Car Race. Festival Management and Event Tourism, 5(4), 131-138.
109
Frey, J.H. & Eitzen, D.S. (1991). Sport and society. Annual Reviews of Sociology, 17, 503-522.
Fulks, D.L. (2009). NCAA revenues/expenses: 2004-2008 NCAA revenues and
expenses of division I intercollegiate athletic programs report. Indianapolis, IN: National Collegiate Athletic Association.
Fullan, M. (2003). Effective change management in higher education. EDUCAUSE
Review, 6(38), 64-80. Funk, D.C., Mahony, D.F., Nakazawa, M., & Hirakawa, S. (2001). Development of the
sport interest inventory (SII): Implications for measuring unique consumer motives at sporting events. International Journal of Sports Marketing & Sponsorship, 3(3), 291-316.
Funk, D.C., & Pastor, D.L. (2002). Equating attitudes to allegiance: The usefulness of
selected attitudinal information in segmenting loyalty to professional sports teams. Sport Marketing Quarterly, 9(4), 175-184.
Hickman, C.M. (2009, November 18). Assistant Manager, University Athletic
Association at the University of Florida. Interview. Garcia-Aracil, A. (2009). European graduates’ level of satisfaction with higher
education. Higher Education, 57, 1-21. George, D., & Mallery, P. (2007). SPSS for windows: Step by step. Boston, MA:
Pearson Education Inc. Gerdy, J.R. (2000). Sports in school: the future of institution. New York: Teachers
College Press. Gibson, H. (2002). “We’re gators … not just gator fans”: Serious leisure and University
of Florida football. Journal of Leisure Research, 34(4), 397-425. Gibson, H.J. (1998). Sport tourism: A critical analysis of research. Sport Management
Review, 1(1), 45-76. Gibson, H.J., Qi, C.X., & Zhang, J.J. (2008). Destination image and intent to visit China
and the 2008 Beijing Olympic Games. Journal of Sport Management, 22(4), 427-450.
Gladden, J.M., & Funk, D.C. (2002). Developing an understanding of brand associations
in team sport: Empirical evidence from consumers of professional sports. Journal of Sport Management, 16, 54-81.
110
Gramling, R., & Freudenburg, W.R. (1992). Opportunity, threat, development, and adaptation: Toward a comprehensive framework for social impact assessment. Rural Sociology, 57(2), 216-234.
Gratton, C., Shibli, S., & Coleman, R. (2006). The economic impact of major sports
events: A review of ten events in the UK. The Sociological Review, 54(S2), 41-58. Green, B.C. (2001). Leveraging subculture and identity to promote sport events. Sport
Management Review, 4(1), 1-19. Grimes, P.W., & Chressanthis, G.A. (1994). Alumni contributions to academics: The role
of intercollegiate sports and NCAA sanctions. American Journal of Economics and Sociology, 53(1), 27-40.
Gursoy, D., & Rutherford, D.G. (2004). Host attitudes toward tourism: An improved
structural model. Annals of Tourism Research, 31(3), 495-516. Gursoy, D., Jurowski, C., & Uysal, M. (2002). Residents attitudes: A structural modeling
approach. Annual of Tourism Research, 29(1), 79-105. Hair, J. F., Black. W. C., Babin, B. J., Anderson, R. E., & Tatham, R. L. (2006).
Multivariate Data Analysis. New Jersey: Prentice Hall. Haley, A.J., Snaith, T., & Miller, G. (2005). The social impacts of tourism: A case study
of Bath, UK. Annals of Tourism Research, 32(3), 647-668. Hall, C.M. (1989). Hallmark tourist events: Analysis, definitions, methodology and
review. In G.J. Syme, B. Shaw, M. Fenton & W. Muller (Eds), Planning and evaluation of hallmark events (pp. 3-9). Aldershot: Avery
Hardy, C., Lawrence, T.B., & Grant, D. (2005). Discourse and collaboration: the role of
conversations and collective identity. Academy of Management Review, 30(1), 58-77.
Havitz, M.E. & Dimanch, F. (1999). Leisure involvement revisited: Drive properties and
paradoxes. Journal of Leisure Research, 31, 122-140. Heere, B., & Dickson, G. (2008). Measuring attitudinal loyalty: Separating the terms of
affective commitment and attitudinal loyalty. Journal of Sport Management, 22, 227-239.
Heere, B., & James, J.D. (2007a). Stepping outside the lines: Developing a multi-
dimensional team identity scale based on social identity theory. Sport Management Review, 10, 65-91.
111
Heere, B., & James, J.D. (2007b). Sports teams and their communities: Examining the influence of external group identities on team identity. Journal of Sport Management, 21(3), 319-337.
Henderson, J. (2007). College game has never been more popular. Retrieved on
November 22, 2009 from http://www.denverpost.com/colleges/ci_6794633. Hiller, H. H. (1989). Impact and image: the convergence of urban factors in preparing fro
the 1988 Calgary Winter Olympics in G. Syme et al. (Eds). The Planning and Evaluation of Hallmark Events, Aldershot: Averbury.
Hong, S.W., Han, S.H., & Kim. K. (2008). Optimal balancing of multiple affective
satisfaction dimensions: A case study on mobile phones. International Journal of Industrial Ergonomics, 38, 272-279.
Horne, J.D., & Mnzenreiter, W. (2004). Accounting for mega-events: forecasts and
actual impacts of the 2002 Football World Cup Finals on the host counties Japan and Korea. International Review for the Sociology of Sport, 39(2), 187-203.
Hu, L., & Bentler, P. M. (1995). Evaluating model fit. In R. H. Hoyle (Ed), Structural
equation modeling: Concepts, issues, and applications (pp. 76-99). Thousand Oaks, CA: Sage.
Humphreys, B.R. (2003). The relationship between big-time college football and state
appropriations to higher education. UMBC Economics Department Working Papers 03-102m UMBC Department of Economics.
James, J.D., & Ridinger, L.L. (2002). Female and male sport fans: A comparison of
sport consumption motives. Journal of Sport Behavior, 25(3), 260-278. Johnson, B.K., Groothuis, P.A., & Whitehead, J.C. (2001). The value of public goods
generated by a major league sports team: The CVM approach. Journal of Sports Economics, 2(1), 6-21.
Johnson, B. K., Mondello, M. J., & Whitehead, J. C. (2006). Contingent valuation of
sport: Temporal embedding and ordering effect. Journal of Sport Economics, 7(3), 267-288.
Johnson, B.K. & Whitehead, J.C. (2000). Value of public goods from sports stadiums:
The CVM approach. Contemporary Economic Policy, 18(1), 48-59. Kaiser, H.F. (1974). An index of factorial simplicity. Psychometrika, 39, 31-36. Kalafa, J. (2009). SEC had best college football attendance in 2008. Retrieved on
November 17, 2009 from http://bleacherreport.com/articles/135113-sec-led-ncaafb-attendance-again-in-2008big-ten-2nd
112
Kim, W. (2009, October). Community residents’ psychic income from hosting sport
events. Conference conducted at the 5th Annual Conference of the Florida Society of the Social Science, Gainesville, FL.
Kim, W., Ko, Y.J., & Zhang, J.J. (2008, November). Assessment of community
residents’ psychological benefits from a sport event: The case of Daytona Beach residents’ perceptions of Daytona 500. Conference conducted at the Sport Entertainment & Venues Tomorrow, Columbia, SC.
Kim, W., & Walker, M. (under review, 2010). Community resident’s psychic income from
hosting a mega event: scale development and validation. Sport Management Review.
Ko, D., & Stewart, W.P. (2002). A structural equation model of residents’ attitudes for
tourism development. Tourism Management, 23, 521-530. Koilias, C. (2005). Evaluating students’ satisfaction: the case of informatics department
of TEI Athens. Operational Research. An International Journal, 5(2), 363-381. Kraut, R., Olson, J., Banaji, M., Bruckman, A., Cohen, J., & Couper, M. (2004).
Psychological research online: Report of board of scientific affairs' advisory group on the conduct of research on the internet. American Psychologist, 59, 105-117.
Krueger, R.A., & Casey, M.A. (2009). Focus groups: A practical guide for applied
research. Thousand Oaks, CA: SAGE Publication. Lee, C., & Back, K. (2003). Pre- and post-casino impact of residents’ perception. Annals
of Tourism Research, 30(4), 868-885. Leeds, M.A., & Allmen, P.V. (2008). The economics of sports. Boston, MA: Addison-
Wesley. Long, J.E., & Caudill, S.B. (1991). The impact of participation in intercollegiate athletics
on income and graduation. The Review of Economics and Statistics, 73(3), 525-531.
Luhtanen, R., & Crocker, J. (1992). A collective self-esteem scale: Self-evaluation of
one’s social identity. Personality and Social Psychology Bulletin, 18(3), 302-318. MacCallum, R.C., Browne, M.W., & Sugawara, H.M. (1996). Power analysis and
determination of sample size for covariance structure modeling. Psychological Methods, 1, 130-140.
Madrigal, R. (2001). Social identity effects in a belief-attitude-intentions hierarchy:
Implications for corporate sponsorship. Psychology and Marketing, 18, 145-165.
113
Mahony, D.F., Madrigal, R., & Howard, D. (2000). Using the psychological commitment
to team (PCT) scale to segment sport consumers based on loyalty. Sport Marketing Quarterly, 9, 15-25.
Mangold, W.D., Bean, L., & Adams, D. (2007). The impact of intercollegiate athletics on
graduation rates among major NCAA division-I universities: Implications for college persistence theory and practice. The Journal of Higher Education, 74(5), 54-562.
Mardia, K.V. (1985). Mardia’s test of multinormality. In S. Kotz & N.L. Johnson (Eds.),
Encyclopedia of statistical sciences (Vol. 5, pp. 217-221). New York: Wiley. Maslow, A.H. (1943). A theory of human motivation. Psychological Review, 50, 370-
396. Masteralexis, L.P., Barr, C.A., & Hums, M.A. (2005). Principles and Practice of Sport
Management. Sudbury, MA: Jones and Bartlett. Matheson, V.A., & Baade, R.A. (2004). An economic slam dunk or March madness?
Assessing the economic impact of the NCAA basketball tournament. In J. Fizel & R. Fort (Eds). The economics of college sports. Westport, CT: Praeger.
Matsuo, H., McIntyre, K.P., Tomazic, T., & Katz, B. (2005). The online survey: Its
contributions and potential problems. Proceedings of the Joint Statistical Meetings of the American Statistical Association.
McCool, S.F., & Martin, S.R. (1994). Community attachment and attitudes toward
tourism development. Journal of Travel Research, 32(3), 29-34. McCormick, R.E., & Tinsley, M. (1987). Athletics versus academics? Evidence from
SAT scores. The Journal of Political Economy, 95(5), 1103-1116. McGehee, N.G., Yoon, Y., & Cárdnenas, D. (2003). Involvement and travel for
recreational runners in North Carolina. Journal of Sport Management, 17, 305-324. McGuinn, K.K., & Mosher-Ashley, P.M. (2001). Participation in recreational activities
and its effect on perception of life satisfaction in residential settings. Activities, Adaptation & Aging, 25(1), 77-86.
Meer, J., & Rosen, H.S. (2008). The impact of athletic performance on alumni giving: An
analysis of micro data. Working Paper No. 13937, National Bureau of Economic Research.
Milne, G.R., & McDonald, M.A. (1999). Sport marketing: Managing the exchange
process. Sudbury, MA: Jones and Bartlett Publishers.
114
Mixon, F. (1995). Athletics versus academics? Rejoining the evidence from SAT scores. Education Economics, 3, 277-283.
Mixon, F., & Hsing, Y. (1994). The determinants of out-of-state enrollments in higher
education: A Tobit analysis. Economics of Education Review, 13, 329-335. Morgan, J. (1997). Glory for sale. Baltimore; Bancroft Press. National Intramural-Recreational Sports Association (2009). Mission statement.
Retrieved on November 4, 2009 from http://www.nirsa.org. National Intramural-Recreational Sports Association, (2004). The value of recreational
sports in higher education: impact on student enrollment, success, and buying power. Champaign, IL: Human Kinetics.
Netemeyer, R.G., Johnson, M.W., & Burton, S. (1990). Analysis of role conflict and role
ambiguity in a structural equations framework. Journal of Applied Psychology, 75, 148-157.
Nguyen, N., & LeBlanc, G. (2001). Image and reputation of higher education institutions
in students’ retention decision. International Journal of Educational Management, 15(6), 303-311.
Noel-Levitz. (2009). Student satisfaction inventory. Retrieved on November 8, 2009
from http://www.noellevitz.com. Noll, R.C. (2004). The business of college sports and the high cost of winning. In S.R.
Rosner & K.L. Shropshire (Eds), The business of sports (pp. 477-491). Sudbury, MA: Jones and Bartlett Publishers.
Nunnally, J.C., & Bernstein, I.H. (1994). Psychometric Theory (3rd ed.). New York, NY:
McGraw-Hill. O'Brien, M.R. (2007). A caution regarding rules of thumb for variance inflation factors, Quality
and Quantity, 41(5), 673-690. Okun, M.A., & Weir, R.M. (1990). Toward a judgment model of college satisfaction.
Educational Psychology Review, 2(1), 59-76. Owen, J.G. (2006). The intangible benefits of sports teams. Public Finance and
Management, 6(3), 321-345. Ozanian, M. (2008). The business of college football. Retrieved on October 27, 2009
from http://www.forbes.com Pantages, T.J. & Creedon, C.F. (1978). Studies of college attrition: 1950-1975. Review
of Educational Research, 48(1), 49-101.
115
Pilcher, J.J. (1998). Affective and daily events predictors of life satisfaction in college students’. Social Indicators Research, 43(3), 291-306.
Peytchev, A. (2009). Survey breakoff. Public Opinion Quarterly, 73(1), 74-97. Pope, D.G., & Pope, J.C. (2009). The impact of college sports success on the quantity
and quality of student applications. Southern Economic Journal, Southern Economic Association, 75(3), 750-780.
Reif, W.E. (1975). Intrinsic versus extrinsic rewards: Resolving the controversy. Human
Resource Management, 14(2), 2-11. Ritchie, J. R. (1984). Assessing the impact of hallmark events; Conceptual and research
issues. Journal of Travel Research, 23, 2-11. Ritchie, J.R. & Smith, B.H. (1991). The impact of a mega-event on host region
awareness: A longitudinal study. Journal of Travel Research, 30(1), 3-10. Roberts, L., & Clifton, R. (1992). Measuring the affective quality of life of university
students: The validation of an instrument. Social Indicators Research, 27, 113-137. Savage, H.J. (1929). American College Athletics. New York: Carnegie Foundation for
the Advancement of Teaching. Schimmel, K.S. (2001). Sport matters: urban regime theory and urban regeneration in
the late-capitalist era. In C. Gratton and I.P. Henry (Eds.), Sport in the city, (pp. 259-277). New York: Routledge.
Shank, M.D. (2005). Sports Marketing. Upper Saddle River, New Jersey: Prentice Hall. Siegfried, J., & Zimbalist, A. (2000). The economic of sports facilities and their
communities. Journal of Economic Perspectives, 14(3), 95-114. Sherwood, P., Jago, L., & Deery, M. (2005). Triple bottom line evaluation of special
events: Does the rhetoric reflect reporting? The Council for Australian University Tourism and Hospitality Education 2005 Conference.
Shulman, J.L., & Bowen, W.G. (2001). The game of life: college sports and educational
values. Princeton, NJ: Princeton University Press. Sirgy, M.J., Grzeskowiak, S., & Rahtz, D. (2007). Quality of college life (QCL) of
students: developing and validating a measure of well-being. Social Indicators Research, 80, 343-360.
116
Sloan, L.R. (1989). The motives of sports fans. In J.H. Goldstein (Ed.), Sports, games, and play: Social and psychological viewpoints (pp. 175-240). Hillsdale, NJ: Lawrence Erlbaum.
Smith, D.R. (2007). Big-time college basketball and the advertising effect: Does success
really matter? Journal of Sports Economics, 9(4), 387-406. Smith, R.K. (2004). A brief history of the national collegiate athletic association’s role in
regulating intercollegiate athletics. In S.R. Rosner, & K.L. Shropshire (Eds.), The business of sports (pp. 423-445). Sudbury, MA: Jones and Bartlett Publishers.
Spady, W.G. (1970). Dropouts from higher education: An interdisciplinary review and
synthesis. Interchange, 1, 64-85. Spady, W.G. (1971). Dropouts from higher education: Toward an empirical model.
Interchange, 2, 38-62. Sperber, M. (2000). Beer and circus: How big-time college sports is crippling
undergraduate education. New York: Henry Holt and Company. Splitt, F.G. (2007). Reclaiming academic primacy in higher education: the revised IRS
form 990 can accelerate the process. The INTERFACE, 3, 9-13. Suhr, D.D. (2006). Exploratory or confirmatory factor analysis? Proceedings from the
SAS User Group International. Swindell, D., & Rosentraub, M.S. (1998). Who benefits from the presence of
professional sports teams? The implications for public funding of stadiums and arenas. Public Administration Review, 58(1), 11-20.
Tajfel, H. & Turner, J. (2004). An integrative theory of intergroup conflict. In M.J. Hatch,
& M. Schultz. (Eds), Organizational identity: A reader (pp. 56-65). New York: Oxford University Press.
Tabachnick, B.G., & Fidell, L.S. (1989). Using multivariate statistics. New York: Harper
& Row. Teye, V., Sönmenz, S. F., & Sirakaya, E. (2002). Residents’ attitudes toward tourism
development. Annals of Tourism Research, 29(3), 668-688. The Interorganizational Committee (2003). Principles and guidelines for social impact
assessment in the USA. Impact Assessment Project Appraisal, 21(3), 231-250. Tinto, V. (1987). Increasing student retention. San Francisco: Jossey Bass.

117
Toma, J.D. (2003). Football U.: Spectator sports in the life of the American. Ann Arbor, MI: The University of Michigan Press.
Toma, J.D., & Cross, M.E. (1998). Intercollegiate athletics and student college choice:
Exploring the impact of championship seasons on undergraduate applications. Research in Higher Education, 39(6), 633-661.
Trail, G.T. & James, J.D. (2001). The motivation scale for sport consumption:
assessment of the scale’s psychometric properties. Journal of Sport Behavior, 24, 109-127.
Trail, G.T., Fink, J.S., & Anderson, D.F. (2003). Sport spectator consumption behavior.
Sport Marketing Quarterly, 12(1), 8-17. Tucker, I.B., & Amato, L.T. (2006). A reinvestigation of the relationship between big-time
basketball success and average SAT scores. Journal of Sports Economics, 7, 428-440.
U.S. Department of Education. (2009). Undergraduate enrollment. Derived October, 25,
2009 from http://nces.ed.gov/programs/coe/2009/pdf/10_2009.pdf UNESCO (2009). Higher education in a globalized society. Retrieved on October, 25,
2009 from http://unesdoc.unesco.org/images/0013/001362/136247e.pdf University of Florida. (2009). About UF. Retrieved on November 23, 2009 from
http://www.ufl.edu/aboutUF/ University of Illinois at Chicago. (2009). Student satisfaction survey. Retrieved on
November 7, 2009 from http://www.uic.edu. University of Michigan-Flint. (2009). Report on the University of Michigan-Flint student
satisfaction inventory results. Retrieved on November 7, 2009 from http://www.umflint.edu.
U.S. Department of Education (2010). Higher education opportunity act. Retrieved on
January 21, 2010. from http://www.ed.gov/policy/highered/leg/hea08/index.html Vaez, M., Kristenson, M., & Laflamme, L. (2004). Perceived quality of life and self-rated
health among first-year university students. Social Indicators Research, 68(2), 221-234.
Varca, P.E., & Shaffer, G.S. (1984). A longitudinal investigation of sport participation
and life satisfaction. Journal of Sport Psychology, 6, 440-447. Waitt, G. (2003). Social impacts of the Sydney Olympics. Annals of Tourism Research,
30(1), 194-215.
118
Walker, M. & Mondello, M.J. (2007). Moving beyond economic impact: a closer look at
the contingent valuation method. International Journal of Sport Finance, 2(3), 149-161.
Wann, D. L. (1995). Preliminary validation of the sport fan motivation scale. Journal of
Sport & Social Issues, 19(4), 377-396. Wann, D.L., & Pierce, S. (2003). Measuring sports team identification and commitment:
An empirical comparison of the sport spectator identification scale and the psychological commitment to team scale. North American Journal of Psychology, 5, 365-372.
Washington, R.E., & Karen, D. (2001). Sport and society. Annual Review of Sociology,
27, 187-212. Wikipedia. (2009). Florida gators football. Retrieved on November 24, 2009 from
http://en.wikipedia.org Williams, J. & Lawson, R. (2001). Community issues and resident opinions of tourism.
Annals of Tourism Research, 28(2), 269-290. Wright State University. (2009). Student satisfaction inventory. Retrieved on November
7, 2009 from http://www.wright.edu. Wright, K.B. (2005). Researching internet-based populations: Advantages and
disadvantages of online survey research, online questionnaire authoring software packages, and web survey services. Journal of Computer-Mediated Communication, 10(3), article 11. Retrieved on November 28, 2009 from http://jcmc.indiana.edu/vol10/issue3/wright.html
Yoh, T., Mohr, M., & Gordon, B. (2008). Assessing satisfaction with campus recreation
facilities among college students with physical disabilities. Recreational Sports Journal, 32(2) 106-113.
Yu, G.B., & Kim, J. (2008). Testing the mediating effect of the quality of college life in
the student satisfaction and student loyalty relationship. Applied Research Quality, 3(1), 1-21.
Zhang, J.J., Pease, D.G., & Hui, S.C. (1996). Value dimensions of professional sport as
viewed by spectators. Journal of Sport & Social Issues, 21(February), 78-94. Zimbalist, A. (1999). Unpaid professionals. Princeton, NJ; Princeton University Press.
119
BIOGRAPHICAL SKETCH
Woosoon Kim was born and raised in South Korea. He obtained his Master of
Business Administration (specialized in Finance) from Washington State University in
May 2005. Currently, he is serving as an instructor of Sport Management at the
University of South Dakota.