college of southern nevada student data - csn.edu€¦ · college of southern nevada student data...
TRANSCRIPT

College of Southern NevadaStudent Data and Trends 2004-2009
Student Affairs Planning SummitJune 25, 2009 (last revised July 28, 2009)

Topics
Students and EnrollmentStudent Demographics
Changes in Race/Ethnicity DataFinancial Aid and Millennium ScholarshipsStudent Success:
Persistence, Course Retention and Course SuccessOnline Education
Student Outcomes: Graduation and Transfer
Top Fifteen Degrees/CertificatesClasses and Sections OfferedIR Report Library onlineExcept as noted, all data comes from the final end-of-term census date.

Headcount: 2004-2008
2004 2005 2006 2007 2008
Students 35,399 36,242 36,843 39,316 41,766
% Annual Growth 2.4% 1.7% 6.7% 6.2%
0
5,000
10,000
15,000
20,000
25,000
30,000
35,000
40,000
45,000
Hea
dcou
nt (
undu
plic
ated
)CSN Fall Enrollment - Headcount
Growth from 2004‐2008 is 18%.

FTE Enrollment: 2004-2008
2004 2005 2006 2007 2008
Students 17,676.0 18,234.0 18,354.4 19,787.9 21,063.8
% Annual Growth 3.2% 0.7% 7.8% 6.4%
0.0
5,000.0
10,000.0
15,000.0
20,000.0
25,000.0
FTE
(Fu
ll-T
ime
Equ
ival
ent)
CSN Fall Enrollment - FTE (Full-Time Equivalent)
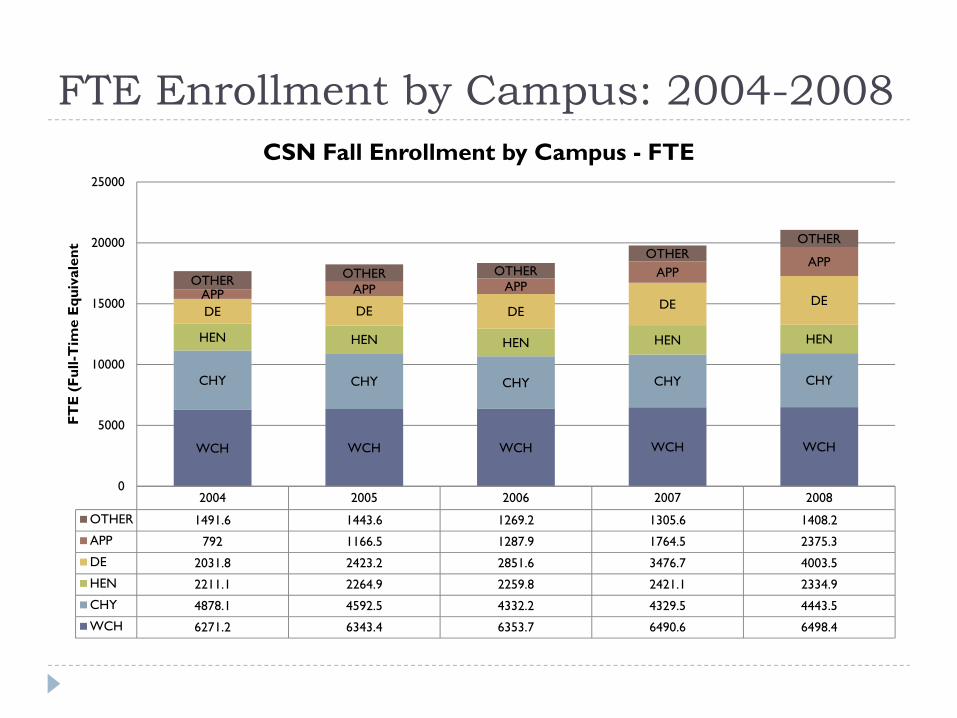
FTE Enrollment by Campus: 2004-2008
2004 2005 2006 2007 2008
OTHER 1491.6 1443.6 1269.2 1305.6 1408.2
APP 792 1166.5 1287.9 1764.5 2375.3
DE 2031.8 2423.2 2851.6 3476.7 4003.5
HEN 2211.1 2264.9 2259.8 2421.1 2334.9
CHY 4878.1 4592.5 4332.2 4329.5 4443.5
WCH 6271.2 6343.4 6353.7 6490.6 6498.4
WCH WCH WCH WCH WCH
CHY CHY CHY CHY CHY
HEN HEN HEN HEN HEN
DE DE DE DE DEAPP APP APPAPP
APPOTHER OTHER OTHER
OTHEROTHER
0
5000
10000
15000
20000
25000
FTE
(Fu
ll-T
ime
Equ
ival
ent
CSN Fall Enrollment by Campus - FTE

FTE Enrollment by Campus: 2004-2008
2004 2005 2006 2007 2008
WCH 6271.2 6343.4 6353.7 6490.6 6498.4
CHY 4878.1 4592.5 4332.2 4329.5 4443.5
HEN 2211.1 2264.9 2259.8 2421.1 2334.9
DE 2031.8 2423.2 2851.6 3476.7 4003.5
APP 792 1166.5 1287.9 1764.5 2375.3
OTHER 1491.6 1443.6 1269.2 1305.6 1408.2
0
1000
2000
3000
4000
5000
6000
7000
FTE
(Fu
ll-T
ime
Equ
ival
ent)
CSN Fall Enrollment by Campus - FTE

Facts in Brief (online)

Student Profile (Headcount):
Fall 2008 (online)

Student Profile (FTE): Fall 2008 (online)
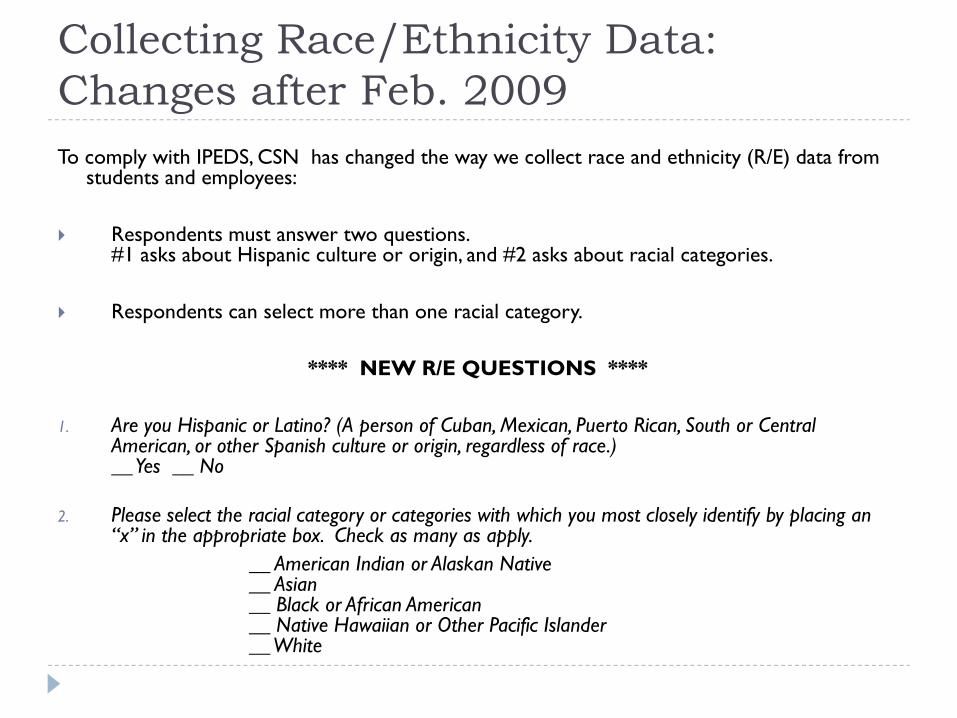
Collecting Race/Ethnicity Data: Changes after Feb. 2009To comply with IPEDS, CSN has changed the way we collect race and ethnicity (R/E) data from
students and employees:
Respondents must answer two questions. #1 asks about Hispanic culture or origin, and #2 asks about racial categories.
Respondents can select more than one racial category.
**** NEW R/E QUESTIONS ****
1. Are you Hispanic or Latino? (A person of Cuban, Mexican, Puerto Rican, South or Central American, or other Spanish culture or origin, regardless of race.) __ Yes __ No
2. Please select the racial category or categories with which you most closely identify by placing an “x” in the appropriate box. Check as many as apply.
__ American Indian or Alaskan Native__ Asian__ Black or African American__ Native Hawaiian or Other Pacific Islander__ White
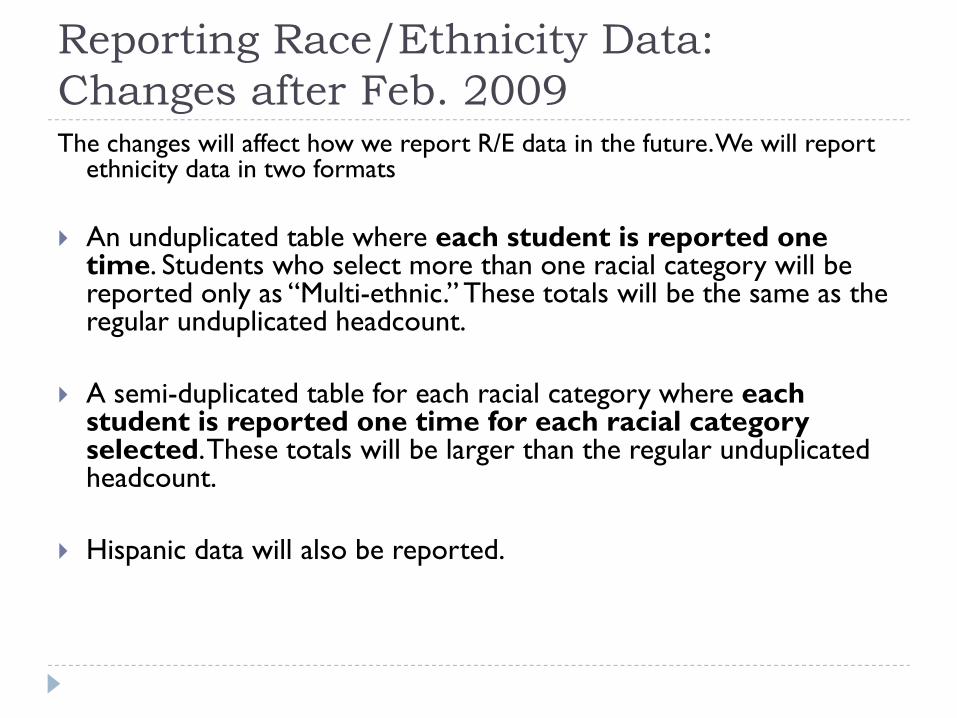
Reporting Race/Ethnicity Data: Changes after Feb. 2009The changes will affect how we report R/E data in the future. We will report
ethnicity data in two formats
An unduplicated table where each student is reported one time. Students who select more than one racial category will be reported only as “Multi-ethnic.” These totals will be the same as the regular unduplicated headcount.
A semi-duplicated table for each racial category where each student is reported one time for each racial category selected. These totals will be larger than the regular unduplicated headcount.
Hispanic data will also be reported.

Old and New R/E Report Formats
Headcount by Ethnicity
Ethnic Category Count % of TotalAfrican American 4252 10.2%American Indian 410 1.0%Asian 4511 10.8%Caucasian 18325 43.9%Hawaiian/Pac Isl 964 2.3%Hispanic 9358 22.4%Nonresident Alien 3 0.0%Unknown 3943 9.4%
TOTAL 41766
Headcount by Ethnicity (unduplicated)
Ethnic Category Count % of TotalAfrican American 4252 10.2%American Indian 410 1.0%Asian 4511 10.8%Hawaiian/Pacific Isl. 964 2.3%White 18325 43.9%Multi-ethnic 9358 22.4%Unknown 3946 9.4%
TOTAL 41766
Ethnicity Category Totals (duplicated)
Ethnic Category CountAfrican American 6,002American Indian 410Asian 4511Caucasian 18325Hawaiian/Pac Isl 1,054Unknown 3943
Hispanic 11,553
Old Report Format Possible New Report Format
These numbers are provided as an example only. Do not use this data for reporting.

Student Demographics: Ethnicity
African Amer.10%
Asian Amer.11%
Caucasian44%
Hawaii/Pacific Isl.2%
Hispanic22%
Native Amer.1% Unknown
10%
Fall 2008 Students

Student Demographics: Ethnicity
0
5000
10000
15000
20000
25000
30000
35000
40000
45000
African American
Asian/Pacific Isl.
Caucasian Hispanic Native American
Unknown Total
CSN Student Demographics Fall 2006-Fall 2008
Fall 2006
Spring 2007
Fall 2007
Spring 2008
Fall 2008

Student Demographics: Age
310 505
3961
14086
8066
4645
33624231
1920
680
Unknown Under 18 18 to 19 20 to 24 25 to 29 30 to 34 35 to 39 40 to 49 50 to 61 62 & Over
Fall 2008: Students by Age (Headcount)
Headcount by Age

Student Demographics: Age
94.3 280.1
2537.5
8442.8
3883.1
2024.91382.2 1581.2
647.2190.6
Unknown Under 18 18 to 19 20 to 24 25 to 29 30 to 34 35 to 39 40 to 49 50 to 61 62 & Over
Fall 2008: Students by Age (FTE)
FTE by Age

Financial Aid StudentsAY 08-09 (to date)
Total Financial Aid Recipients 11,229
Total Dollars Disbursed $39,047,811.91
Pell Recipients 5,939
Pell Dollars Disbursed $13,628,095.24
Workstudy Students:
Federal Workstudy Students 172
Federal Workstudy Dollars $374,288.93 *
State Workstudy Students 143
State Workstudy Dollars $406,619.41 *
*NOTE: Workstudy state and federal dollars were as of 6/1/2009, amounts according to payroll.Source: Tina Holcomb, CSN Student Financial Services

Millennium Students
Fall 2004 Fall 2005 Fall2006 Fall 2007 Fall 2008
Millennium Students 3368 3288 3015 2971 2909
2600
2700
2800
2900
3000
3100
3200
3300
3400
3500
Num
ber
of S
tude
nts
Millennium StudentsStudents Receiving Millennium Funds
Drop-off can be attributed to:- Existing Millennium students are using up their benefit- Current high school students face tougher requirements to qualify for the scholarship- Existing Millennium students must adhere to stricter requirements to maintain scholarship
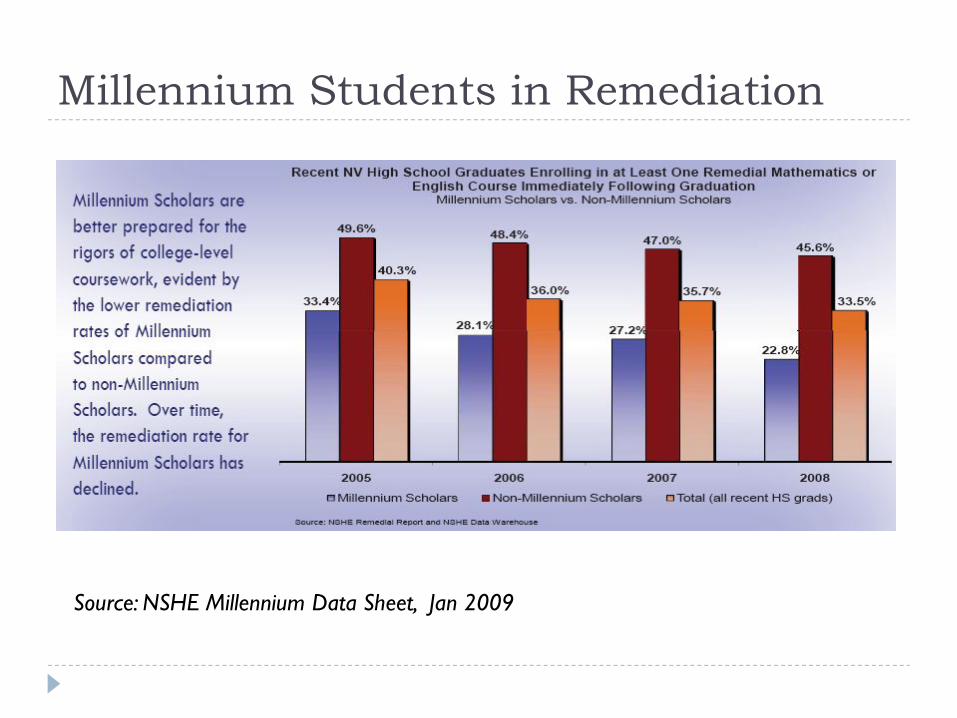
Millennium Students in Remediation
Source: NSHE Millennium Data Sheet, Jan 2009
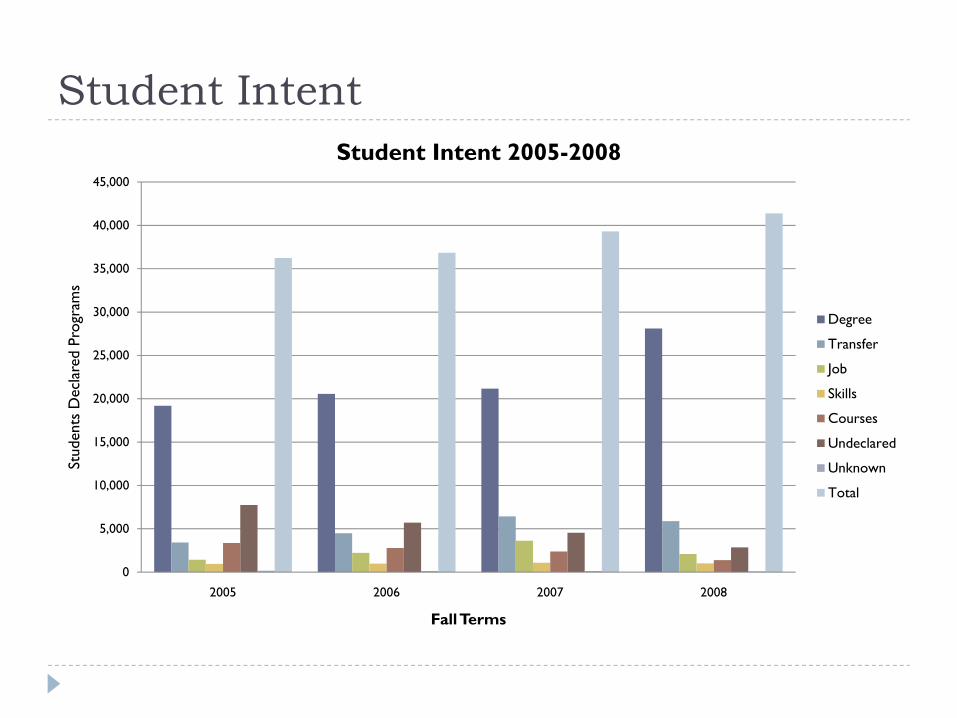
Student Intent
0
5,000
10,000
15,000
20,000
25,000
30,000
35,000
40,000
45,000
2005 2006 2007 2008
Stud
ents
Dec
lare
d Pr
ogra
ms
Fall Terms
Student Intent 2005-2008
Degree
Transfer
Job
Skills
Courses
Undeclared
Unknown
Total

Student Success: Next Term Persistence
F04-S05 F05-S06 F06-S07 F07-S08 F08-S09
Enrolling Next Term (Spring) 62.3% 62.2% 62.3% 64.2% 64.5%
0.0%
10.0%
20.0%
30.0%
40.0%
50.0%
60.0%
70.0%
80.0%
90.0%
100.0%
Fall-
Spri
ng R
ate
Student Persistance Rate - Fall to Spring

Student Success: Next Term Persistence by Ethnicity
African Amer. Asian Amer. Caucasian Hawaii/Pacifi
c Isl. Hispanic Native Amer. Unknown
Enrolling Next Term (Spring) 64.2% 68.0% 65.2% 66.1% 61.9% 61.4% 63.3%
0.0%
10.0%
20.0%
30.0%
40.0%
50.0%
60.0%
70.0%
80.0%
90.0%
100.0%
Fall-
Spri
ng R
ate
Student Persistance Rate by Ethnicity Fall 08-Spring 09

Student Success: Next Term Persistence by Gender
Female Male
Enrolling Next Term (Spring) 65.2% 63.7%
0.0%
10.0%
20.0%
30.0%
40.0%
50.0%
60.0%
70.0%
80.0%
90.0%
100.0%
Fall-
Spri
ng R
ate
Student Persistence Rate by GenderFall 08-Spring 09

Student Success: Next Year Persistence
F04-F05 F05-F06 F06-F07 F07-F08
Enrolling Next Year (Fall) 44.8% 44.8% 46.6% 46.6%
0.0%
10.0%
20.0%
30.0%
40.0%
50.0%
60.0%
70.0%
80.0%
90.0%
100.0%
Fall-
Fall
Rat
e
Student Persistance Rate - Fall to Fall

Student Success: Next Year Persistence by Ethnicity
African Amer.
Asian Amer.
Caucasian
Hawaii/Pacific
Isl.
Hispanic
Native Amer.
Unknown
Enrolling Next Year (Fall) 41.5% 50.0% 45.9% 49.4% 48.3% 49.7% 47.3%
0.0%10.0%20.0%30.0%40.0%50.0%60.0%70.0%80.0%90.0%
100.0%
Fall-
Fall
Rat
e
Student Persistance Rate by Ethnicity Fall 07-Fall 08

Student Success: Next Year Persistence by Gender
Female Male
Enrolling Next Year (Fall) 46.1% 47.2%
0.0%
10.0%
20.0%
30.0%
40.0%
50.0%
60.0%
70.0%
80.0%
90.0%
100.0%
Fall-
Fall
Rat
e
Student Persistence Rate by GenderFall 07-Fall 08

Grade Distribution Reports (online)

Student Course Retention by Ethnicity
African Amer.
Asian Amer.
Caucasian
Hawaii/Pacific Isl. Hispanic Native
Amer.Unknow
n
Enrolled Entire Term 76% 82% 80% 78% 80% 80% 78%
0%
10%
20%
30%
40%
50%
60%
70%
80%
90%
100%
Cou
rse
Ret
enti
on R
ate
(Gra
des A
-F,P
)Course Retention Rate by Ethnicity - Fall 08

Student Course Retention by Gender
Female Male
Enrolled Entire Term 80% 79%
0%
10%
20%
30%
40%
50%
60%
70%
80%
90%
100%
Cou
rse
Ret
enti
on R
ate
(Gra
des A
-F,P
)
Course Retention Rate by Gender - Fall 08

Student Course Success by Ethnicity
African Amer.
Asian Amer.
Caucasian
Hawaii/Pacific
Isl.
Hispanic
Native Amer.
Unknown
Enrolled Entire Term 60% 71% 71% 62% 66% 69% 68%
0%10%20%30%40%50%60%70%80%90%
100%
Cou
rse
Succ
ess
Rat
e(G
rade
s A-C
,P)
Course Success Rate by Ethnicity - Fall 08

Student Course Success by Gender
Female Male
Enrolled Entire Term 68% 68%
0%
10%
20%
30%
40%
50%
60%
70%
80%
90%
100%
Cou
rse
Succ
ess
Rat
e(G
rade
s A-C
,P)
Course Success Rate by Gender - Fall 08

Student Course Success: Online and Traditional Sections
F05 F06 F07 F08
Online sections 58% 57% 55% 61%
Traditional sections 65% 65% 67% 70%
0%
10%
20%
30%
40%
50%
60%
70%
80%
Cou
rse
Succ
ess
Rat
e(G
rade
s A-C
,P)
Course Success Rates - Online and Traditional Sections
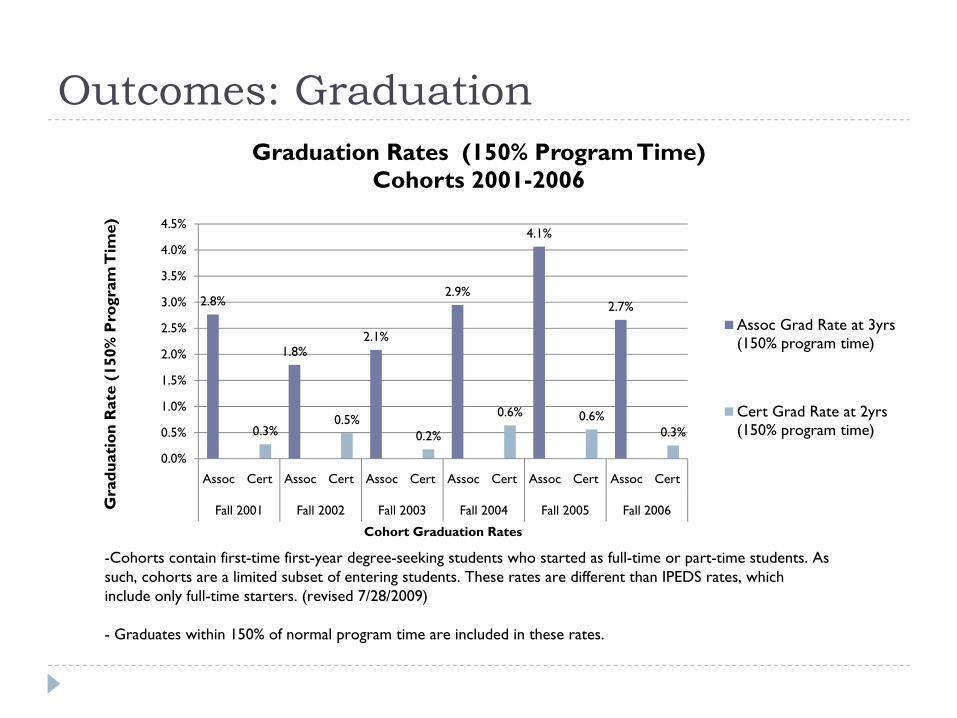
Outcomes: Graduation
2.8%
1.8%2.1%
2.9%
4.1%
2.7%
0.3%0.5%
0.2%
0.6% 0.6%0.3%
0.0%
0.5%
1.0%
1.5%
2.0%
2.5%
3.0%
3.5%
4.0%
4.5%
Assoc Cert Assoc Cert Assoc Cert Assoc Cert Assoc Cert Assoc Cert
Fall 2001 Fall 2002 Fall 2003 Fall 2004 Fall 2005 Fall 2006Gra
duat
ion
Rat
e (1
50%
Pro
gram
Tim
e)
Cohort Graduation Rates
Graduation Rates (150% Program Time) Cohorts 2001-2006
Assoc Grad Rate at 3yrs (150% program time)
Cert Grad Rate at 2yrs (150% program time)
-Cohorts contain first-time first-year degree-seeking students who started as full-time or part-time students. As such, cohorts are a limited subset of entering students. These rates are different than IPEDS rates, which include only full-time starters. (revised 7/28/2009)
- Graduates within 150% of normal program time are included in these rates.

Outcomes: Transfer
Full-time Part-Time Total
Transfer 22% 16% 18%
0%
5%
10%
15%
20%
25%
Tra
nsfe
r R
ates
Transfer Rates - Fall 2006 IPEDS Entering Students*
-* IPEDS cohorts contain first-time first-year degree-seeking students. As such, cohorts are a limited subset of entering students.
- Transfer rates are calculated manually from data reported by the Student Clearinghouse. A transfer-out is anyone who is not a CSN graduate who enrolled in another school after the first semester at CSN.

Outcomes: Top 15 Degrees/Certificates
Degree Code Prog. Code Program Long Name Degrees/CertsAA AA A02 ASSOCIATE OF ARTS 220AB BUSA01 ASSOCIATE OF BUSINESS 198AAS NURA05 NURSING 186AGS AGSA02 ASSOCIATE OF GENERAL STUDIES 170AS AS A02 ASSOCIATE OF SCIENCE 93AA ECEA05 ELEMENTARY EDUCATION 53AA PSYA01 PSYCHOLOGY 47AA CRJA20 CRIMINAL JUSTICE 35AA HMDA02 HOSPITALITY MANAGEMENT 33
AAS CITA27 COMPUTING AND INFORMATION TECHNOLOGY 32AA ECEA06 SECONDARY EDUCATION 29CA PN C01 PRACTICAL NURSING 25AS DH A03 DENTAL HYGIENE 16CA DA C04 DENTAL ASSISTING - CLINICAL 16AAS ACCA02 ACCOUNTING 16* Grad Year 2008-09 includes Aug. 2008, Dec. 2008, and May 2009
Graduation Year 2008-09

Classes and Sections Offered: 2005-2009
F05 S06 F06 S07 F07 S08 F08 S09
HC 36,242 35,116 36,843 36,236 39,316 39,094 41,766 40,968
FTE 18,234 17,485 18,354 17,956 19,788 19,370 21,064 20,959
# SECTIONS 4,633 4,692 4,637 4,623 4,792 4,896 4,701 4,777
-
5,000
10,000
15,000
20,000
25,000
30,000
35,000
40,000
45,000
CSN Enrollment Fall 2005 - Spring 2009
Updated 7/20/2009
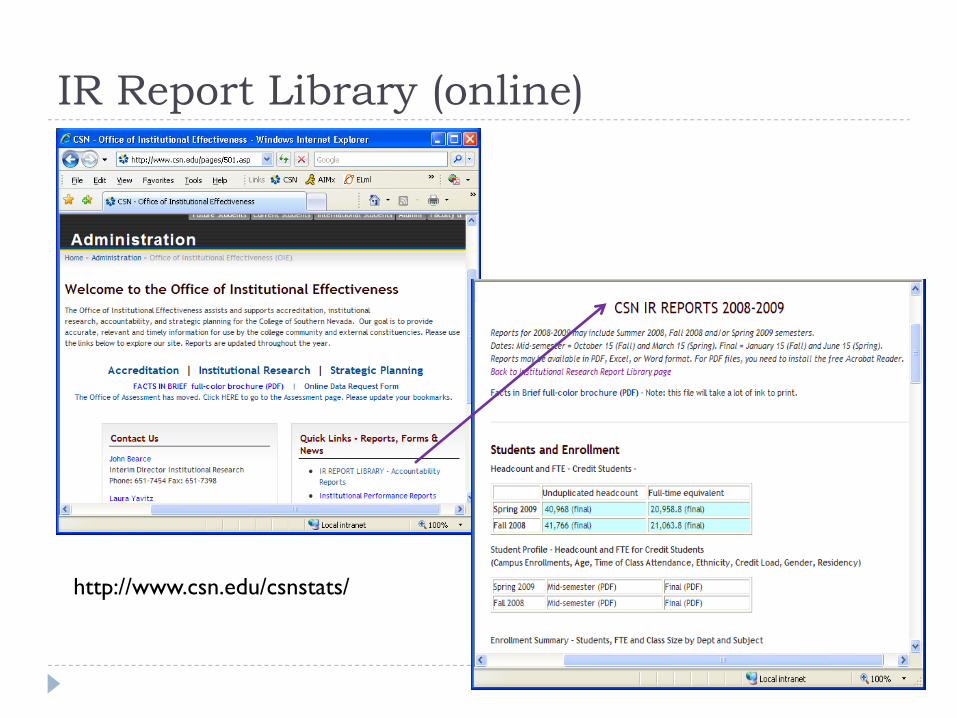
IR Report Library (online)
http://www.csn.edu/csnstats/

Contact InformationInstitutional Research
John [email protected] [email protected]
IR Report Library (online)http://www.csn.edu/csnstats/