college of charleston - osa.sc.govosa.sc.gov/wp-content/uploads/2018/03/h1505.pdf · prepared by...
TRANSCRIPT

COLLEGE OF CHARLESTON CHARLESTON, SOUTH CAROLINA
COMPREHENSIVE ANNUAL FINANCIAL REPORT Included in the Higher Education Fund, an Enterprise Fund of the State of South Carolina
FOR THE YEAR ENDED JUNE 30, 2005
PREPARED BY THE OFFICE OF THE CONTROLLER
COLLEGE OF CHARLESTON

COLLEGE OF CHARLESTON
CHARLESTON, SOUTH CAROLINA
COMPREHENSIVE ANNUAL REPORT Included in the Higher Education Funds of the State of South Carolina
FOR THE YEAR ENDED JUNE 30, 2005
PREPARED BY THE OFFICE OF THE CONTROLLER

PREPARED BY THE OFFICE OF THE CONTROLLER
COLLEGE OF CHARLESTON COMPREHENSIVE FINANCIAL REPORT
FISCAL YEAR ENDED JUNE 30, 2005
INTRODUCTORY SECTION INDEX President’s Letter 5 - 6 Letter of Transmittal 7 - 11 Board of Trustees – College of Charleston 12 Organizational Chart 13 Business and Finance Officers 14 Certificate of Achievement for Excellence in Financial Reporting – GFOA 2004 15 FINANCIAL SECTION State Auditor’s Letter 17 Independent Auditor’s Report 18 - 19 Management Discussion & Analysis 20 - 27 Basic Financial Statements: Statement of Net Assets 28 Statement of Revenues, Expenses, and Changes in Net Assets 29 Statement of Cash Flows 30
College of Charleston Foundation Statement of Financial Position 31 College of Charleston Foundation Statement of Activities 32 College of Charleston Cougar Club Statement of Financial Position 33 College of Charleston Cougar Club Statement of Activities 34
Notes to Financial Statements 35 - 54 STATISTICAL SECTION Schedule of Revenues by Source/ Schedule of Expenses by Function 56 Schedule of Expenses by Use/ Pie Chart 57 Schedule of Bond Coverage 58 Student Head Count for the Last Ten Years 59 Student Full Time Equivalent for the Last Ten Years 60 Fall Residence Hall Occupancy for the Last Ten Years 61 Average Combined SAT Score for the Last Ten Years 62 Fall Roster Faculty Rank, Tenure, and Terminal Degrees for the Last Ten Years 63 Student and Faculty Full Time Equivalents Fall 2004 64 Academic Subject Areas and Degrees Offered Fall 2004 65

COLLEGE OF CHARLESTON
COMPREHENSIVE ANNUAL FINANCIAL REPORT
INTRODUCTORY SECTION

November 8, 2005
Office of the President
Dear College of Charleston Family and Friends,
One of the College’s greatest strengths continues to be the dedication of our faculty, staff, and
community to the education and well-being of our students. This dedication manifests itself in
many ways, but it is most obvious when we overcome our challenges and continue to exceed our
goals as a preeminent institution of higher education.
2005 has been no exception, and we have accomplished a number of improvements in services,
facilities, and programs. In the spring we officially opened the new Marlene and Nathan
Addlestone Library to an overwhelmingly positive response, and our consolidation of student
services in the newly-renovated Lightsey Center was successfully completed. The College also
opened the new Beatty Center for the School of Business and Economics, and in August we
formally reopened the Stern Student Center, which has undergone extensive upgrades,
remodeling, and renovations during the past year. And after much anticipation, the
groundbreaking for our new School of Education facilities -- with an innovative Curriculum Lab,
state-of-the-art classrooms, meeting spaces, and seminar rooms -- took place in October.
This year the College was again ranked as one of the nation’s best institutions for undergraduate
education by the Princeton Review, the Fiske Guide to Colleges 2005, and the U.S. News &
World Report’s 2005 Edition of America’s Best Colleges. We have also been invited to be a
sponsor for the National Merit Scholarship Program, an invitation extended to only those schools
that have a three-year history of being chosen by at least four National Merit finalists. This
prestigious invitation makes us one of approximately 200 institutions of higher education in the
country to qualify for this honor. And as we expand and improve our academic and co-curricular
offerings, the caliber of students and faculty continues to increase, along with our nationwide
reputation for excellence.
5

In the year ahead, our major challenge will continue to be attracting the resources necessary to
maintain and advance our vision in the future. So far we have been very successful in our efforts
to increase fundraising, and we will continue to explore all available avenues of philanthropy and
private giving. And as we pursue these new opportunities, our operations will remain streamlined
and our programs focused, and the outstanding quality of our student experience will remain
uncompromised.
As part of a dedicated team, I remain deeply honored to serve the College of Charleston
community, and I look forward to even more progress and opportunities in the future – both for
our students and our state.
With best wishes,
Leo I. Higdon, Jr.
6

LETTER OF TRANSMITTAL
November 8, 2005
To President Higdon, Members of the Board of Trustees, and Citizens of South Carolina We take pleasure in presenting to you the Comprehensive Annual Financial Report for the College of Charleston for the year ended June 30, 2005. The audit report appears in the Financial Section and expresses an unqualified opinion on the College’s financial statements. INTRODUCTION Management Responsibility This Comprehensive Annual Financial Report contains the financial statements for the year ended June 30, 2005, as well as other information useful to those we serve and to whom we are accountable. Responsibility for both the accuracy of the data and the completeness and fairness of the presentation, including all disclosures, is assumed by the College of Charleston. We believe that, to the best of our knowledge, the data contained herein is accurate in all material respects and is reported in a manner designed to present fairly the College’s financial position as well as revenues, expenses, changes in net assets, and cash flows. The financial statements reflect reporting standards issued by the Governmental Accounting Standards Board. This Annual Report includes all disclosures necessary for the reader to gain an understanding of the College’s financial operations for the year ended June 30, 2005. Explanation of Sections The Introductory Section includes a message from the President, this transmittal letter, a listing of the members of the Board of Trustees, the Business and Finance Officers, and an organizational chart of the institution. In addition, the College has received the Certificate of Achievement for Excellence in Financial Reporting awarded by the Government Finance Officers Association (GFOA) of the United States and Canada for fiscal year ended June 30, 2004. This introduction will acquaint the reader with the organization, structure and scope of the College’s operations. The Financial Section presents management’s discussion and analysis which, when read in conjunction with the financial statements and the notes to the financial statements, will provide a more complete picture of the financial health of the institution. The financial statements may be used to make reasonable comparisons of the College’s financial position as it relates to other public higher educational institutions. In addition to the financial statements and accompanying notes, this section includes the report of the independent auditors. The Statistical Section includes selected financial, statistical and demographic information. This information provides a broad overview of trends in the financial affairs of the College. Profile of Government Founded in 1770, and chartered in 1785, the College is the oldest institution of higher education in South Carolina and the thirteenth oldest in the United States. Today this thriving academic institution offers a world-class liberal arts education for nearly 10,000 undergraduate and graduate students.
7

The College of Charleston and its graduate school are considered to be part of the State of South Carolina primary entity. The funds of the College of Charleston are included in the Comprehensive Annual Financial Report of the State of South Carolina. The College of Charleston is a state-supported, coeducational institution of higher education. The Board of Trustees is the governing body for the College and is responsible for the administration and management of the College. The College of Charleston is committed to attracting the most promising students both from South Carolina and other states. The average combined SAT scores of entering freshmen for Fall 2004 was 1208, far exceeding the state and national averages, with no other state institution having a higher average. Out-of-state and international students comprise 35% of the student enrollment with 52 states and US possessions and 75 foreign countries represented. ECONOMIC CONDITION AND OUTLOOK South Carolina has worked to strengthen its financial management as evidenced by the State’s surplus of the $300 million plus for the fiscal year ended June 30, 2005 and full restoration of its “Rainy Day” fund. The State has a long-term budgeting perspective and conservative approach to debt management and it has built up its ending total balances. In addition, the State’s job growth and strong bond ratings are other indicators of its financial soundness. The State affirmed its commitment to education through the appropriation of approximately 22 percent of the $143 million of surplus dollars set aside for expenditures. Higher education received $14.4 million of the surplus dollars while the technical colleges along with the Department of Education received $17.1 million. Approximately $144.3 million was carried forward to fund a portion of the fiscal year 2006 base budget and $13.1 million will allow for supplemental appropriations of the 2007 fiscal year. During 2004, South Carolina’s economy generated jobs, but not enough for the expanding work force. The State’s nonagricultural job count advanced 0.8 percent to 1.82 million in 2004, adding 14,600 jobs. Of the State’s eight Metropolitan Statistical Areas (MSAs), six experienced job growth over the year. The Charleston MSA expanded by 9,000 jobs, led by growth in Professional and Business Services and Natural Resources and Construction. Furthermore, South Carolina’s unemployment rate for 2004 was 6.8 percent ranking it 47th among unemployment rates for states. Charleston County ended the year at 4.5 percent. South Carolina’s state employee and teachers pension fund is 86 percent funded. Its police officers retirement fund is 91 percent funded and its judicial retirement system is 63.5 percent funded. The State has received strong bond ratings. It has had Moody’s AAA rating since 1971. However, Moody’s issued a negative outlook in June 2004 regarding issuance of General Obligation State Institution bonds. South Carolina’s net tax supported debt as a percentage of personal income has increased in the last decade from 1.6 in 1994 to 2.4 in 2004. MAJOR INITIATIVES The College of Charleston has completed its Fourth Century Initiative with resounding success. Consistent with the goals of the Fourth Century Initiative, the College has increased its average SAT scores by forty-five (45) points to an average of 1208; it has reduced its average class size to 20; it has reduced its student-faculty ratio to 14:1; and it has added fifty new faculty. In addition, the institution has increased both merit and need-based financial aid for students, has introduced wireless technology onto 90% of the campus and has renovated and refurbished classrooms, laboratories, and student center facilities. To maintain its reputation of educational excellence and to continue the momentum generated by the Fourth Century Initiative, the College has embarked upon its next phase of focused strategic planning and implementation. This second phase focuses on the following critically important quality enhancements to include:
8

1) Identify, create, and support academic programs of distinctiveness and distinction for the
students (e.g., in Business with an emphasis in Small Business & Entrepreneurship and in Science/Mathematics through new programs in BioInformatics and Marine Genomics);
2) Establish and support co-curricular programs for students to enhance their learning outside the classroom;
3) Continue to improve retention and graduation rates; and 4) Increase diversity of the students, faculty and staff, with particular emphasis upon
students. FINANCIAL INFORMATION Internal Control The management of the College is responsible for the establishment and maintenance of internal control policies and procedures designed to safeguard College assets. As part of this responsibility, the management ensures that its financial statements are prepared in conformity with generally accepted accounting principles, and that reasonable controls are in place to ensure the following:
1) That access to College assets is granted only with appropriate management authorization.
2) That transactions are executed in accordance with the general or specific authorization of management.
3) That transactions are recorded on a timely basis.
4) That transactions are recorded based on criteria applicable to state guidelines, generally
accepted accounting principles and criteria as designated by the National Association of College and University Business Officers.
The College of Charleston’s Office of Internal Audit periodically reviews procedures and issues reports with recommended improvements to the system. This office reports directly to the President of the College. Annual audits are conducted under the authority of the S.C. State Auditor with testing to ensure the adequacy of internal controls and the College’s compliance with applicable laws and regulations. Budgetary Control The College prepares on an annual basis a budget that provides reasonable estimates of revenues and expenditures. The budgetary process encompasses all operating budgets of the College to include educational and general activities, the operations of auxiliary enterprises, all sponsored program activities, and all capital projects. Its preparation is based on programmatic planning by the College through its executive management, academic offices and department heads. The budgets are then presented to the Board of Trustees for approval. Additionally, the Board receives quarterly updates of year-to-date actual revenue and expenditures and a comparison to budget. Any adjustments, and/or revisions to the budget, are approved by the Board on a quarterly basis. After approval, the College ensures budgetary control through the application of account classifications that reflect the various functions of the College with detailed itemization of cost activity by function. Using this approach and the necessary reporting of the data, the responsibility for budgetary control rests at the departmental chairperson level with appropriate oversight provided by the executive management of the College. A centralized review system by accounting personnel ensures proper classification of costs. A computerized system of encumbrance reporting ensures an on-line, real-time processing environment that budgets are not exceeded and that budget variances are approved through executive management. In addition to this Comprehensive Annual Financial Report, the College prepares annual reports of financial and operational data which are available to the General Assembly of South Carolina and the
9

public for review. These reports provide information that demonstrates the ability of the College to accomplish its mission in a manner that ensures prudent management of public funds. Debt Administration The College has developed a comprehensive debt management strategy to provide guidelines relative to acceptable levels of debt and to formulate a mechanism for calculating and monitoring debt while being cognizant of the effect of long-term borrowing on the College’s credit rating. The College will manage debt on a portfolio basis. The College’s continuing objective to achieve the lowest cost of capital will be balanced with the goal of limiting exposure to market shifts. The College will manage its credit to maintain the highest acceptable credit which will permit the College to issue debt and finance capital projects at favorable interest rates while meeting its strategic objectives. The College will limit its overall debt to a level that will maintain an acceptable credit score with the bond rating agencies. Cash Management As a state agency, the investment of funds is vested with the State Treasurer of South Carolina. Other than certain approved petty cash funds and two loan funds, all cash is held in a cash management pool administered by the State Treasurer. By law, the College is allowed to earn interest income on revenues derived from the operations of its Residence Halls, Parking, and Food Service. Certain debt service funds also managed by the State Treasurer allow interest earnings to the credit of the College. All other interest earned from the investment of College and related fees are retained by the State Treasurer and credited to the State General Fund. Risk Management The College participates in a statewide risk management program in which the state assumes substantially all risks for unemployment and workers’ compensation benefits and claims of covered employees for health, dental, and group life insurance benefits. In addition, the College pays premiums to the South Carolina Insurance Reserve Fund to cover the risk of loss related to the following assets and activities:
1) Building and property (including contents), 2) General tort liability, 3) Automobile liability, and 4) Automobile physical damage (comprehensive and collision)
The largest claim the College submitted was after Hurricane Hugo in September 1989. The buildings were fully insured for replacement claim costs and the College received more than $2,000,000 from the Insurance Reserve Fund for damaged properties. The College also obtains employee fidelity bond insurance coverage from a commercial insurer. OTHER INFORMATION Independent Audit The College of Charleston, as a state agency, receives audit services through the S.C. State Auditor’s Office. In recent years the State Auditor has contracted audit services to various independent audit firms. Audits are conducted on an annual basis with the S.C. State Auditor assuming authority and oversight of the audit. The auditor’s opinion is unqualified. For the fiscal year 2005 the audit was conducted by Cherry, Bekaert and Holland, L.L.P. The College was also audited by Cherry, Bekaert & Holland, L.L.P. to ensure compliance with the requirements of the Single Audit Act of 1984 as provided under Federal Circular A-133 for federal grants and contracts. The most recent audit (Fiscal Year 2005) detected no institutional liabilities related to the College’s federal programs. Furthermore, the College is audited on a periodic basis by the S. C. Budget and Control Board - Division of General Services to ensure compliance with the provisions of the South Carolina Procurement Code.
10

Certificate of Achievement for Excellence in Accounting Reporting The GFOA awarded a Certificate of Achievement for Excellence in Financial Reporting to the College of Charleston for its Comprehensive Annual Financial Report for the fiscal year ended June 30, 2004. In order to be awarded a Certificate of Achievement, an entity must publish an easily readable and efficiently organized report. This report must satisfy both generally accepted accounting principles and applicable legal requirements. A Certificate of Achievement is valid for a period of one year only. We believe that our current report continues to meet the Certificate of Achievement program requirements and we are submitting it to the GFOA to determine its eligibility for another certificate. Acknowledgments We wish to thank the Board of Trustees and the President of the College for their continued commitment to the fiscal management of the College. Likewise, we wish to thank the members of the College community whose cooperation made the successful close of the fiscal year possible. Gary. M. McCombs Senior Vice President for Business Affairs Priscilla D. Burbage Vice President for Fiscal Services Ruby Flateau Controller Kenneth “Rick” Mims, C. P. A. Accounting Fiscal Manager ________________________________________ Stephen K. Stullenbarger, C. P. A. Accountant
11

COLLEGE OF CHARLESTON BOARD OF TRUSTEES
2004 - 2005
Robert W. Marlowe, Chairman William D. Johnson Member-At-Large Fifth District Marie M. Land, Vice Chairman F. Creighton McMaster Sixth District Fifth District J. Philip Bell, Secretary G. Lee Mikell Third District Second District Donald H. Belk Lawrence R. Miller Member-At-Large Fourth District Dr. Charlotte L. Berry Annaliza Oehmig Moorhead Second District Third District Demetria Noisette Clemons Y. W. Scarborough, III Sixth District Governor’s Appointee Dr. L. Cherry Daniel Robert S. Small, Jr. First District Fourth District James F. Hightower Dr. Sam Stafford, III Member-At-Large Governor’s Designee Joseph F. Thompson, Jr. First District
12

Board of Trustees(17 members)
Leo I. HigdonPresident
Elise B. JorgensProvost and Sr. Vice President
Academic Affairs
College of CharlestonPresident's Office
Organizational Structure
Sue Sommer-KresseSr. Vice President
InstitutionalAdvancement
Andrew L. AbramsSr. VP Strategic
Planning and Administration
Victor K. WilsonSr. Vice President
Student Affairs
Fred W. Daniels, IIISr. VP Exexcutive
Administration andInstitutional Resources
Virginia T. FriedmanVice President for
Diversity
Daniel S. Dukes, IVSr. Vice President
Governmental Affairs
Gary M. McCombsSr. Vice PresidentBusiness Affairs
Martha E. AttisanoWriter
Jerry I. BakerExecutive Athletic Director
Monica R. ScottVice President
Facilities Planning
Eric J. ForsbergInternal Auditor
Denise A. MitchellExecutive Assistant
Sarah F. WootenAdministrative Assistant
13

COLLEGE OF CHARLESTON BUSINESS AND FINANCE OFFICERS
2004-2005
Gary M. McCombs Senior Vice President for Business Affairs
Priscilla Burbage Vice President for Fiscal Services
Ruby Flateau Controller
Kenneth “Rick” Mims, C.P.A. Accounting Fiscal Manager
Stephen K. Stullenbarger, C. P. A. Accountant
Samuel B. Jones Director of Budgeting and Payroll Services
14

15

COLLEGE OF CHARLESTON COMPREHENSIVE ANNUAL FINANCIAL REPORT
FINANCIAL SECTION

17

18

19

COLLEGE OF CHARLESTON
MANAGEMENT’S DISCUSSION AND ANALYSIS JUNE 30, 2005
Introduction The College of Charleston’s Management Discussion and Analysis (MD&A) presents an overview of its financial condition and guides the reader toward significant financial matters for the year ended June 30, 2005. Management has prepared the discussion and recommends reading it in conjunction with the accompanying financial statements and footnotes. The responsibility for the financial statements, footnotes and this discussion rests with management. Financial and Other Highlights
• State appropriations in 2005 increased by $1.5 million or 5.6% from the prior year appropriations.
• Tuition and fees increased by $5.6 million, approximately 8.7%. • Net assets increased by $6.0 million or 5.1% from June 30, 2004. Approximately $5.5
million of the increase or 91.7% of the total was due to an increase in the college facilities and other assets, net of depreciation and associated debt.
• A $33.4 million new library was completed and opened during February of 2005. • Scholarship awards increased approximately $1.9 million as represented in the increase
of discount and allowances. • Total operating expenses in 2005 represent an increase of 8.0% from 2004.
Using the Annual Financial Report: The annual financial report includes three financial statements: the Statement of Net Assets, the Statement of Revenues, Expenses and Changes in Net Assets and the Statement of Cash Flows. These financial statements are prepared according to the Governmental Accounting Standards Board (GASB), Statement No. 35, Basic Financial Statements – and Management’s Discussion and Analysis – For Public Colleges and Universities. They focus on the financial condition of the College, the results of operations and its cash flows as a whole. The three financial statements, similar to those of the private sector, should assist the reader of the annual report in assessing whether the College’s overall financial condition (the Statement of Net Assets) has improved or deteriorated as a result of current year’s financial activities (the Statement of Revenues, Expenses and Changes in Net Assets). In addition, the financial statements will help the reader ascertain whether the College can meet its financial obligations. The Statement of Cash Flows displays information related to both inflows and outflows of cash and further classifies activities by operating, non-capital financing, capital and related financing, and investing. Moreover, it answers the questions as to whether the institution is generating any extra cash that can be used to repay debt or to invest in new services and the institution is generating enough cash to purchase the additional assets required for growth. The elimination of internal service fund transactions ensures that only transactions external to the College are shown in the statements. The following discussion elaborates further on the components and relationships of the three statements. First, the Statement of Net Assets (the balance sheet) is separated into current and non-current assets and liabilities. Current assets convert to cash within one year and for the College consist mainly of cash and receivables. Current liabilities will settle within one year and consist primarily of payables and accrued compensation. This data provides information on assets available to continue the operations; amounts due to vendors, investors, lending institutions; and the net assets available for expenditure by the College. All capital assets are reported as well as depreciation expense – the cost of “using up” capital assets. The College does not report any infrastructure assets as a separate line item.
20

In addition, the Statement of Net Assets presents three major categories of net assets. The first category, invested in capital assets, net of related debt, illustrates the College’s equity in property, plant, and equipment. The next category displays the restricted net assets subdivided into expendable and nonexpendable. The amount of nonexpendable restricted resources is available solely for investment purposes. Expendable restricted net assets are available for expenditure but must be spent for purposes as determined by donors and/or external entities based on the defined restrictions. The final category is unrestricted net assets which may be expended for any lawful purpose of the institution. Secondly, the Statement of Revenues, Expenses and Changes in Net Assets presents the sources of revenue, types of expenses, gains or losses, and changes in net assets. Revenues and expenses are categorized as either operating or non-operating. Significant recurring sources of the College’s revenues, including state appropriations, gifts, and investment income (loss) are considered non-operating, as defined by GASB Statement No. 35. The dependence of public educational institutions on state funding, therefore, will normally result in operating deficits. The utilization of long-lived assets, referred to as capital assets, is reflected in the financial statements as depreciation, which amortizes the cost of an asset over its expected useful life. Generally speaking, operating revenues are received for providing goods and services to the various customers and constituencies of the College. Operating revenues are classified in five major areas: student tuition and fees; federal, state, and local grants and contracts; auxiliary enterprises; student organization revenues; and other sources. Scholarships and fellowships applied to student accounts are shown as a reduction of student fee revenues, while stipends and other payments made directly to students continue to be presented as scholarship and fellowship expenses. Operating expenses are those expenses paid to acquire or produce the goods and services provided in return for the operating revenues and to carry out the mission of the College. Operating expenses are mainly attributable to salaries and benefits for the faculty and staff of the College. Other elements included in operating expenses are supplies and materials, utilities, scholarships and fellowships, and depreciation. Non-operating revenues are monies received for which goods and services are not provided. State capital appropriations, capital grants and gifts, as well as any loss or gain on disposal of equipment are considered neither operating or non-operating revenues and are reported as “Income before other revenues, expenses, gains, or losses.” Lastly, the Statement of Cash Flows presents detailed information about the cash activity of the College during the year and is divided into five sections. The operating section shows the net cash used by the operating activities of the College. The second section presents cash flows from non-capital financing activities and reflects the cash received and spent for non-capital financing purposes. Cash used for the acquisition and construction of capital and related items is detailed in the cash from capital and related financing activities section. The section on cash flows from investing activities shows the purchases, proceeds, and interest received from investing activities. The fifth section reconciles the net cash used to the operating income or loss reflected on the Statement of Revenues, Expenses, and Changes in Net Assets. This reconciliation is detailed in the financial statements of the College and is not included in this analysis. As required by GASB, the Statement of Cash Flows was produced using the direct method. Under the direct method, net cash is determined by adjusting each item in the income statement from the accrual basis to cash. Statement of Net Assets The Statement of Net Assets, which reports all assets and liabilities of the College, indicates the financial position of the College at the end of the fiscal year. Net assets illustrate the difference between total assets and total liabilities. The change in net assets during the fiscal year is an indicator of the change in the overall financial condition of the College during the year. A synopsis of the College’s assets, liabilities, and net assets as of June 30, 2005 and 2004 follows.
21

Condensed Statement of Net Assets
Assets 2005 2004Increase/
(Decrease) Percent Change
Current Assets 36,199,607$ 32,543,671$ 3,655,936$ 11.23%Capital Assets, Net of Depreciation 166,404,292 149,862,658 16,541,634 11.04%Other Non-Current Assets 51,570,598 34,826,250 16,744,348 48.08%Total Assets 254,174,497 217,232,579 36,941,918 17.01%
LiabilitiesCurrent Liabilities 29,877,218 27,851,094 2,026,124 7.27%Non-Current Liabilities 100,452,544 71,559,098 28,893,446 40.38%Total Liabilities 130,329,762 99,410,192 30,919,570 31.10%
Net AssetsInvestments in Capital Assets, Net of Debt 101,221,675 80,911,812 20,309,863 25.10%Restricted -- Nonexpendable 1,103,151 100,000 1,003,151 1003.15%Restricted -- Expendable 11,304,177 26,391,860 (15,087,683) -57.17%Unrestricted 10,215,732 10,418,715 (202,983) -1.95%Total Net Assets 123,844,735$ 117,822,387$ 6,022,348$ 5.11%
A review of the summary reveals a relatively strong financial position as of June 30, 2005. This is the result of the College’s increase in student tuition and fees and capital assets along with prudent spending practices. Total assets have increased by $36.9 million, the majority of the increase a result of an additional $33.3 million in non-current assets. Restricted cash and cash equivalents increased by $15.3 million or 50.0% and capital assets increased by $16.5 million or 11.0%. Current assets are comprised mainly of cash and cash equivalents, grants and contract receivables, student account receivables, and auxiliary services. The increase in current assets in 2005 of $3.7 million or 11.2% is due primarily to an increase in accounts receivable. During 2004 accounts receivable were $3.2 million in comparison to 2005 of $6 million, a difference of $2.8 million. Current liabilities are comprised largely of accounts payable and accrued expenses, deferred and unearned student revenues and accrued payroll and related liabilities. Current liabilities grew from $27.9 million in 2004 to $29.9 million in 2005, an increase of 7.3% or $2 million. Deferred and unearned student revenues, bonds payable, and accrued interest payable principally effected this change. In addition, accounts payable and accrued expenses declined by 6.7% ($0.5 million). Total net assets, which convey what remains after deducting the liabilities as of June 30, 2005, were $123.8 million, $6.0 million or 5.1% more than in 2004. Invested in capital assets, net of related debt of $101.2 million shows the College’s capital assets after subtracting accumulated depreciation and the principal amount of outstanding debt attributable to the acquisition, construction or improvement of those assets. The College’s capital assets include land and property in an area of approximately 11 city blocks in the center of downtown Charleston. During 2005, investments in capital assets increased by 25.1%. Restricted nonexpendable net assets represent the College’s permanent endowments. The College is the recipient of two permanent endowments totaling $1.1 million from the South Carolina Commission on Higher Education. Restricted expendable refers to funds that are externally limited for specific purposes and consists of scholarships and fellowships, sponsored research, student loans, capital projects and debt service. As of June 30, 2005, capital projects comprised $10.3 million, or 91.1% of the restricted expendable net assets.
22

Unrestricted net assets provide a source of discretionary funds for whatever lawful purposes the College determines appropriate. Although these funds are not subject to external restrictions, the College has designated these funds internally for various academic, research, student assistance and capital purposes. At June 30, 2005, unrestricted net assets total $10.2 million, a slight decrease of 1.9% when contrasted to 2004. Over time, the trend in net assets will provide an important indicator of the financial health of the College but should be considered in conjunction with other non-financial factors. Non-financial factors include the quality of applicants, student retention rates, building conditions, and campus safety. Statement of Revenues, Expenses, and Changes in Net Assets The Statement of Revenues, Expenses and Changes in Net Assets signify the results of the operations of the College. The College’s aggregate revenue totals $157.4 million which includes operating and non-operating sources. It reported operating expenses of $147.5 million excluding interest charges. (The charts following the end of this section depict the revenues by source and expenses by function.) A synopsis of the College’s revenues, expenses and changes in net assets for the years ended June 30, 2005 and 2004 follows.
Condensed Statement of Revenues, Expenses, and Changes in Net Assets
2005 2004Increase/
(Decrease) Percent Change
Operating RevenuesTuition and Fees* 70,209,451$ 64,584,627$ 5,624,824$ 8.71%Federal, State, and Local Grants and Contracts 24,772,856 24,502,496 270,360 1.10%Auxiliary Services* 24,411,644 20,205,940 4,205,704 20.81%Other 2,586,830 2,893,536 (306,706) -10.60%
Total Operating Revenues 121,980,781 112,186,599 9,794,182 8.73%
Less:Operating Expenses
Personnel Cost 69,447,503 65,262,799 4,184,704 6.41%Benefits 16,399,267 15,269,895 1,129,372 7.40%Services, Supplies and Others 42,169,650 37,192,335 4,977,315 13.38%Utilities 4,648,445 4,105,113 543,332 13.24%Scholarship and Fellowship 8,767,485 9,916,390 (1,148,905) -11.59%Depreciation and Amortization 6,020,110 4,727,162 1,292,948 27.35%
Total Operating Expenses 147,452,460 136,473,694 10,978,766 8.04%
Operating Income (Loss) (25,471,679) (24,287,095) (1,184,584) 4.88%
Non-Operating Revenues (Expenses)State Appropriations 28,895,608 27,353,840 1,541,768 5.64%Net Non-Operating Revenues (71,258) 55,993 (127,251) -227.26%
Total Non-Operating Revenues (Expenses) 28,824,350 27,409,833 1,414,517 5.16%
Income Before Capital Contributions and Expenses, Gain (Loss) 3,352,671 3,122,738 229,933 7.36%
Total Other Revenues, Expenses, Gains (Losses) 2,669,677 5,633,757 (2,964,080) -52.61%
Change in Net Assets 6,022,348 8,756,495 (2,734,147) -31.22%
Net Assets, Beginning of Year 117,822,387 109,065,892 8,756,495 8.03%
Net Assets, End of Year 123,844,735$ 117,822,387$ 6,022,348$ 5.11%
*Net of scholarship discounts and allowances
23

The Statement of Revenues, Expenses, and Changes in Net Assets reflect an increase in the net assets for the year of $6.0 million or 5.1%. Tuition and related fees of $70.2 million make up the largest part of total operating revenues of $122 million and total revenues of $157.4 million. The growth rate of 8.71% primarily resulted from the increase in fees during the academic year of 2004-2005. Tuition and fees accounted for 43.6% of the total revenue in 2004 and 44.6% in 2005. Federal, state, local, and non-governmental grant revenue increased in the aggregate during 2005 by $0.3 million (1.1%). The majority of the change is due to a $0.68 million increase in State grants and contracts and a $0.44 million decrease in Federal grants and contracts. Sales and services of auxiliary enterprises are comprised of athletics, health services, book sales, rental, student housing, food services and parking. Revenues of $24.4 million from these sources make up 15.5% of the total revenue of $157.4 million and show an increase of $4.2 million, up by 20.8% in contrast to 2004. Auxiliary services generated 13.6% of total revenue during 2004. While net student tuition and fees accounted for the majority of the total revenue at 44.6%, 2005 state appropriations followed at 18.4%. The state appropriation of $28.9 million in 2005 reflects an increase of $1.5 million or 5.64% when weighed against 2004. Net non-operating revenue increased by $1.4 million or 5.2%. Personnel costs and benefits comprise most of the operating expenses of the College. Approximately $85.8 million or 58.2% of the total operating expenses covered employee compensation and benefits for the year ended 2005. The net increase in this category was 6.6% or $5.3 million. Utilities, services and supplies, and depreciation also reflect substantial increases at 13.2%, 13.4%, and 27.4% respectively while scholarships and fellowships decreased by 11.6%. The increase in total operating expenses is 8%.
Revenues By SourceFiscal Year 2005
Local Grants and Contracts, 0.01%
Student Tuition and Fees (net of
scholarship allowance), 44.60%
Federal Grants and Contracts, 5.94%
Sales and Services of Educational and Other
Activities, 0.63%
Sales and Services of Auxiliary Enterprises (net of scholarship allowance), 15.51%
State Grants and Contracts, 9.78%
Nongovernmental Grants and Contracts,
0.22%
Other Operating Revenue, 0.80%
Other Non Operating Revenues, 2.07%
Interest Income, 0.96%
Gifts, 1.12%State Appropriations,
18.36%
24

Expenses By FunctionFiscal Year 2005
Depreciation, 3.98%Interest on Capital
Debt, 2.60%
Auxiliary Enterprises, 15.92%
Scholarships and Fellowships, 3.69%
Operation and Maintenance of Plant,
16.08%Institutional Support,
7.55%Student Services,
4.70%
Research, 3.07%
Academic Support, 7.94%
Public Services, 0.63%
Instruction, 33.84%
Statement of Cash Flows The Statement of Cash Flows also provides information about the College’s financial health by reporting the cash receipts and cash payments of the College during the year ended June 30, 2005. A synopsis of the Statement of Cash Flows follows.
Increase/ Percent2005 2004 (Decrease) Charge
(18,470,448)$ (18,383,414)$ (87,034)$ 0.47%
Activities 31,121,956 30,528,864 593,092 1.94%
1,584,828 (9,408,774) 10,993,602 -116.84%1,173,938 58,903 1,115,035 1893.00%
15,410,274 2,795,579 12,614,695 451.24%
51,336,176 48,540,597 2,795,579 5.76%
66,746,450$ 51,336,176$ 15,410,274$ 30.02%
Cash Provided (Used) by Operating ActivitiesCash Provided (Used) by Non-Capital Financing
Cash Provided (Used) by Capital Debt and Related Financing ActivitiesCash Provided (Used) by Investing Activities Net Increase (Decrease) in Cash Cash, Beginning of Year
Condensed Statement of Cash Flows
Cash, End of Year Cash and cash equivalents showed significant growth of $15.4 million or 30.0% during 2005 primarily as a result of proceeds received from the issuance of bonds. Additionally, cash inflows from tuition and fee revenue increased by $5.9 million or 9.13% while cash inflows from sales and services of auxiliary enterprises increased by $3.8 million or 18.3%. Cash outflows for personnel costs and benefits and payments to suppliers and for utilities grew moderately in 2005 at 7.2%,
25

4.4% and 13.2% respectively, especially when balanced against the growth in the number of new faculty and program expansion. Cash provided by non-capital financing activities increased by $0.6 million from $30.5 million to $31.1 million. The increase of the State appropriations in 2005 of $1.5 million principally effected this change. State appropriations accounted for $27.4 million cash inflow in 2004 and $28.9 million in 2005. The decrease of gifts and grants accounts for the remainder of the $0.6 million change. Gifts and grants were $2.2 million in 2005 as opposed to $3.2 million in 2004. Cash provided by investing activities increased by $1.1 million in 2005 when contrasted to 2004. The College earned more interest on investments in comparison to 2004. The net increase in cash for 2005 was $15.4 million, up $12.6 million from 2004. As of fiscal year end 2005, cash and cash equivalents made up 26.3% of the total asset base of the College. Capital Asset and Debt Activity A critical factor in continuing the quality of the College’s academic and research programs and residential life experience is the acquisition, construction, and improvement of its capital assets. The College continues to implement its long-range plan to modernize its complement of older teaching and research facilities, balanced with new construction. The College had approximately $166.4 million invested in capital assets, net of accumulated depreciation of $69.3 million at the end of June 30, 2005. Total capital assets in 2005 increased by $16.5 million or 11.0% in comparison to 2004. Accumulated depreciation for the year ended June 2005 was $69.3 million compared to $63.8 million in 2004. A synopsis of the net capital assets for the years ended 2005 and 2004 explains significant changes.
2005 2004Increase/
(Decrease)Percent Change
Land 21,943,639$ 24,108,639$ (2,165,000)$ -8.98%Land Improvements 3,930,238 3,930,238 - Buildings 163,016,332 110,080,715 52,935,617 48.09%Building Improvements 29,330,207 29,330,207 - Equipment 7,711,129 7,029,969 681,160 9.69%Computer Software 343,732 343,732 - Accumulated Depreciation and Amortization (69,348,919) (63,761,297) (5,587,622) 8.76%Construction in Progress 9,477,934 38,800,455 (29,322,521) -75.57%Total Capital Assets - Net 166,404,292$ 149,862,658$ 16,541,634$ 11.04%
Capital Assets
Several of the College’s capital projects were completed this fiscal year such as the Addlestone Library, an outdoor athletic center, a new tennis complex, and the new construction of the School of Business. As a result, there is a reduction in the Construction in Progress account of $29.3 million and an increase in the Buildings fixed asset account of $52.9 million. Debt The College issued new Higher Education and Academic and Administrative Facilities Revenue Bonds in the amount of $32.4 million to fund various projects during 2005. Outstanding long-term debt as of June 30, 2005 was $95.8 million, $28.6 million or 42.5% more than in 2004. This debt is comprised of several bond issues that financed the construction of McAlister Hall, the School of Business, and the Addlestone Library, as well as the purchase of Kelly House, and the Berry Residence Hall renovation.
26

See notes 5, 10, and 11 for additional information on capital assets and long-term debt. Economic Outlook As a state-supported higher education institution, the economic position of the College is closely related to the State of South Carolina. The State closed fiscal year 2005 with a $300 million surplus. Contributing to the surplus were increases in sales taxes, individual income taxes, and corporate income taxes of 5.3%, 12.2% and 24.8% respectively. State revenues from all sources were up $475 million or 9.3% from fiscal year 2004. Higher education throughout the State will benefit from the surplus with an additional $14.4 million. Management believes that a strengthening state economy and a continued focus on identifying alternative funding sources such as grants and private gifts will build the solid financial structure necessary to limit tuition increases in the future. In fact, the tuition increase for in-state students for the 2004-2005 school year were 3% below the national average of 10.5% and 4.8% below the state average of 12.3%. However, because the College must compete with many organizations throughout the state for a limited amount of resources, a major challenge will be securing the necessary funds to maintain these results on a yearly basis. The College remains committed to that challenge and to its overall mission of providing quality education, research, and service.
27

Assets
20,244,573$ 6,030,299 (227,000)
8,145,414 428,597 208,715
1,209,530 159,479
36,199,607$
46,501,877$ Related parties receivable 1,000,000
2,266,346 436,541
Land 21,943,639 3,930,238
Buildings 163,016,332 29,330,207 7,711,129
343,732 (69,348,919)
9,477,934 1,365,834
217,974,890$
254,174,497$
7,431,283$ 4,330,527 1,077,391
10,568,143 772,795
1,005,858 304,882
1,077,824 3,308,515
29,877,218$
2,146,839$ 95,825,561 2,480,144
100,452,544$
130,329,762$
101,221,675$
103,151 Endowment other 1,000,000
136,610 239,810 118,716
10,301,046 507,995
10,215,732 123,844,735$
See Accompanying Notes to Financial Statements
COLLEGE OF CHARLESTONSTATEMENT OF NET ASSETSJune 30, 2005
Current AssetsCash and cash equivalentsAccounts receivable
Allowances for bad debtsGrants and contracts receivablePrivate gifts receivable Interest income receivablePrepaid itemsInventoriesTotal Current Assets
Non-Current AssetsRestricted cash and cash equivalents
Student loans receivablePrepaid items
Land improvements
Building improvementsEquipmentComputer softwareAccumulated depreciation Construction in progressBond issue costs (net)Total Non-Current Assets
Total Assets
Liabilities And Net AssetsCurrent LiabilitiesAccounts payable and accrued expensesAccrued payroll and related liabilitiesRetainage payableDeferred and unearned student revenuesStudent depositsCompensated absences payableDeposits held for othersAccrued interest payableBonds payableTotal Current Liabilities
Non-Current LiabilitiesCompensated absences payableBonds payableFederal capital contributionTotal Non-Current Liabilities
Total Liabilities
Net AssetsInvested in capital assets, net of related debtRestricted for:
NonexpendableEndowed professorship
ExpendableScholarships and fellowshipsResearch
Total Net Assets
LoansCapital projectsDebt service
Unrestricted
28

Tuition and related fees ($3,612,164 pledged for debt service; net of 70,209,451$ scholarship allowance of $15,840,991)Federal grants and contracts 9,351,476 State grants and contracts 15,397,894 Local grants and contracts 23,486 Non governmental grants and contracts-restricted 341,140 Educational activities revenues 371,084 Student organizations generated revenues 619,975 Sales and Services of Auxiliary Enterprises Revenues not pledged for debt service
Athletics (net of scholarship allowance of $1,148,083) 4,822,652 Health services (net of scholarship allowance of $190,059) 735,666 Bookstore 395,563 Rental, vending, and debit card 194,582 Revenues pledged for debt service Housing (net of scholarship allowance of $2,813,839) 11,403,245 Food service (net of scholarship allowance of $726,852) 4,651,276 Parking 2,208,660 Other sources 1,254,631
121,980,781$
Personnel cost 69,447,503$ Benefits 16,399,267 Services, supplies and others 42,169,650 Utilities 4,648,445 Scholarships and fellowships 8,767,485 Depreciation and amortization 6,020,110
147,452,460$
Operating Income (Loss) (25,471,679)$
State appropriations 28,895,608$ Gifts 1,768,037 Auxiliary enterprises interest income 164,817 Interest/investment income 1,337,912 Interest on capital assets and related debt (3,929,234) Federal grants and contracts 6,731 State grants and contracts 450,234 Non governmental grants and contracts 124,335 Local grants and contracts 5,910
28,824,350$
3,352,671$
Capital improvement bond proceeds 1,669,677$ Additions to permanent endowments - gifts 1,000,000
2,669,677$
6,022,348$ 117,822,387 123,844,735$
COLLEGE OF CHARLESTONSTATEMENT OF REVENUES, EXPENSES, AND CHANGES IN NET ASSETSFOR THE YEAR ENDED JUNE 30, 2005
Operating Revenues
Total Operating Revenues
Operating Expenses
Total Operating Expenses
Non-Operating Revenues (Expenses)
Total Net Non-Operating Revenues (Expenses)
Income Before Other Revenues, Expenses, Gains (Losses)
Other Revenues, Expenses, Gains, and Losses
Total Other Revenue, Expenses, Gains (Losses)
Increase In Net AssetsNet Assets, Beginning Of YearNet Assets, End Of Year
See Accompanying Notes to Financial Statements
29

COLLEGE OF CHARLESTONSTATEMENT OF CASH FLOWSFOR THE YEAR ENDED JUNE 30, 2005
Cash Flow From Operating Activities Tuition and fees 69,984,775$ Grants and contracts 25,022,326 Sales and services of education and other activities 991,809 Sales and services of auxiliary enterprises 24,255,001 Other operating revenues 718,613 Payments to employees for salaries and benefits (85,447,051) Payments to suppliers (40,522,447) Payments for utilities (4,648,445) Payments to students for scholarships and fellowships (8,767,485) Loans issued to students (408,657) Collection of loans to students 223,359 Funds held for others 117,408 Student direct lending receipts 38,175,599 Student direct lending disbursements (38,165,253) Net Cash Provided (Used) By Operating Activities (18,470,448)$
State appropriations 28,895,608$ Gifts and grants for other than capital purpose 2,226,348 Net Cash Provided (Used) by Non-Capital Financing Activities 31,121,956$
Proceeds from capital improvement bonds 1,419,677$ Proceeds from the sale of capital assets 20,770 Purchases of capital assets (25,200,292) Proceeds from the issuance of bonds 32,455,000 Principal paid on capital debt (3,060,924) Interest paid on capital related debt (4,049,403)
$ 1,584,828
Cash Flows From Investing Activities Interest on investments 1,173,938 Net Cash Provided (Used) by Investing Activities 1,173,938$
Net Change In Cash 15,410,274$ Cash and cash equivalents - Beginning of the Year 51,336,176 Cash and Cash Equivalents - End of the Year 66,746,450$
Operating income (loss) (25,471,679)$ Adjustments to reconciile net operating income (loss) to net cash provided (used) by
Depreciation expense 6,020,110 Funds held for others 78,539 Changes in assets and liabilities: Account receivable,net (3,337,628) Inventories 11,532 Student loan receivable 30,130 Prepaid expenses (667,924) Accounts payable and accrued expenses 3,338,594 Accrued compensated absences and related liabilities (560,657) Deferred revenue 2,053,594 Student and other deposits 34,941 Net Cash Provided (Used) by Operating Activities (18,470,448)$
Non-Cash Transactions Increase in fair value of investments 18,414$
Reconciliation of Cash and Cash Equivalent Balances: Current Assets: Cash and cash equivalents $ 20,244,573 Noncurrent assets:
46,501,877 66,746,450$
Cash Flows From Non-Capital Financing Activities
Cash Flows From Capital And Related Financing Activities
Net Cash Provided (Used) by Capital Debt And Related Financing Activities
Total Cash and Cash Equivalents
See Accompanying Notes to Financial Statements
Restricted cash and equivalents
Reconciliation of net operating revenue (expenses) to net cash provided (used) by operating activities
operating activities
30

AssetsCash and cash equivalents 5,924,582$ Accounts receivable 1,922 Accrued interest receivable 149,984 Prepaid expenses 16,104 Inventories 16,927 Unconditional promises to give, net 3,922,873 Investments 37,064,189 Contributions receivable from remainder trusts 313,957 Cash value of life insurance 59,521 Property and equipment, net 9,943,954 Total Assets 57,414,013$
Liabilities and Net Assets
Liabilities Accounts payable and accrued expenses 865,762$ Annuities payable 379,261 Deferred revenue 26,844 Total Liabilities 1,271,867$
Net Assets Unrestricted: Undesignated 11,712,551$ Temporarily restricted: Restricted for:
Program expenses 16,459,852 Investment in property 986,228
Permanently restricted: Permanent endowments 26,983,515 Total Net Assets 56,142,146$
Total Liabilities and Net Assets 57,414,013$
See Accompanying Notes to Financial Statements
COLLEGE OF CHARLESTON FOUNDATIONCOMPONENT UNITSTATEMENT OF FINANCIAL POSITIONDECEMBER 31, 2004
31

Temporarily PermanentlyUnrestricted Restricted Restricted Total
Revenue, gains and other support: Contributions 1,132,669$ 3,081,738$ 2,741,645$ 6,956,052$ Net interest and dividend income 145,150 719,458 - 864,608 Rental income 768,534 - - 768,534 Net realized and unrealized gains (losses) on
long-term investments 158,119 1,934,751 - 2,092,870 Other income 6,953 390,235 255 397,443 Gain (loss) on sale of equipment 2,500 - - 2,500 Changes in value of split interest agreements - 57,884 - 57,884 Subtotal 2,213,925 6,184,066 2,741,900 11,139,891
Net assets released from restrictions: Program restrictions satisfied 6,221,383 (6,221,383) - - Payment of administrative surcharges 304,743 (304,743) - - Transfer of funds (6,685) (2,035,431) 2,042,116 -
Total revenue, gains (losses), and other support 8,733,366 (2,377,491) 4,784,016 11,139,891
Program: Student aid and recognition 1,362,749 - - 1,362,749 Faculty/ community enrichment 5,665,521 - - 5,665,521 Total program expenses 7,028,270 - - 7,028,270
Supporting Services: General and administrative 471,249 - - 471,249 Fundraising 523,710 - - 523,710 Total supporting services 994,959 - - 994,959
Change in allowance for uncollectiblepromises to give 21,619 20,359 33,045 75,023
Total Expenses 8,044,848 20,359 33,045 8,098,252
Change in net assets 688,518 (2,397,850) 4,750,971 3,041,639
Net Assets, Beginning of Year 11,024,033 19,843,930 22,232,544 53,100,507
Net Assets, End of Year 11,712,551$ 17,446,080$ 26,983,515$ 56,142,146$
See Accompanying Notes to Financial Statements
Expenses:
COLLEGE OF CHARLESTON FOUNDATIONCOMPONENT UNITSTATEMENT OF ACTIVITIESFOR THE YEAR ENDED DECEMBER 31, 2004
32
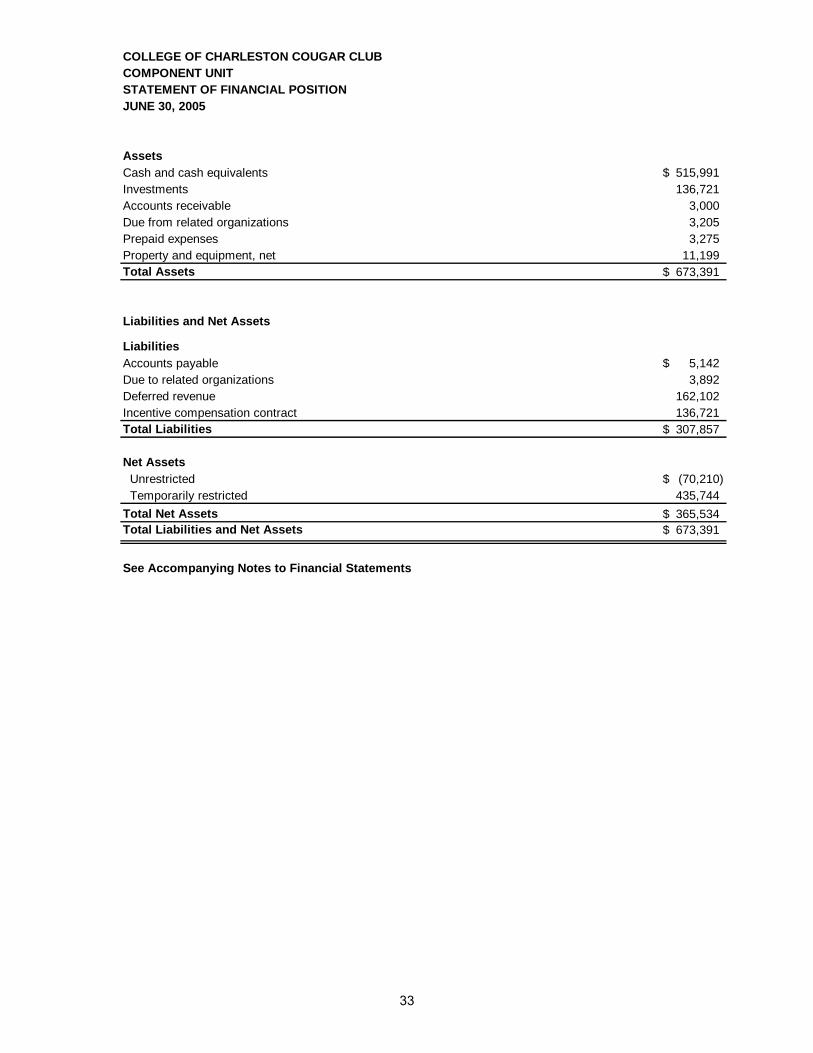
AssetsCash and cash equivalents 515,991$ Investments 136,721 Accounts receivable 3,000 Due from related organizations 3,205 Prepaid expenses 3,275 Property and equipment, net 11,199 Total Assets 673,391$
Liabilities and Net Assets
Liabilities Accounts payable 5,142$ Due to related organizations 3,892 Deferred revenue 162,102 Incentive compensation contract 136,721 Total Liabilities 307,857$
Net Assets Unrestricted (70,210)$ Temporarily restricted 435,744 Total Net Assets 365,534$ Total Liabilities and Net Assets 673,391$
See Accompanying Notes to Financial Statements
COLLEGE OF CHARLESTON COUGAR CLUBCOMPONENT UNITSTATEMENT OF FINANCIAL POSITION JUNE 30, 2005
33
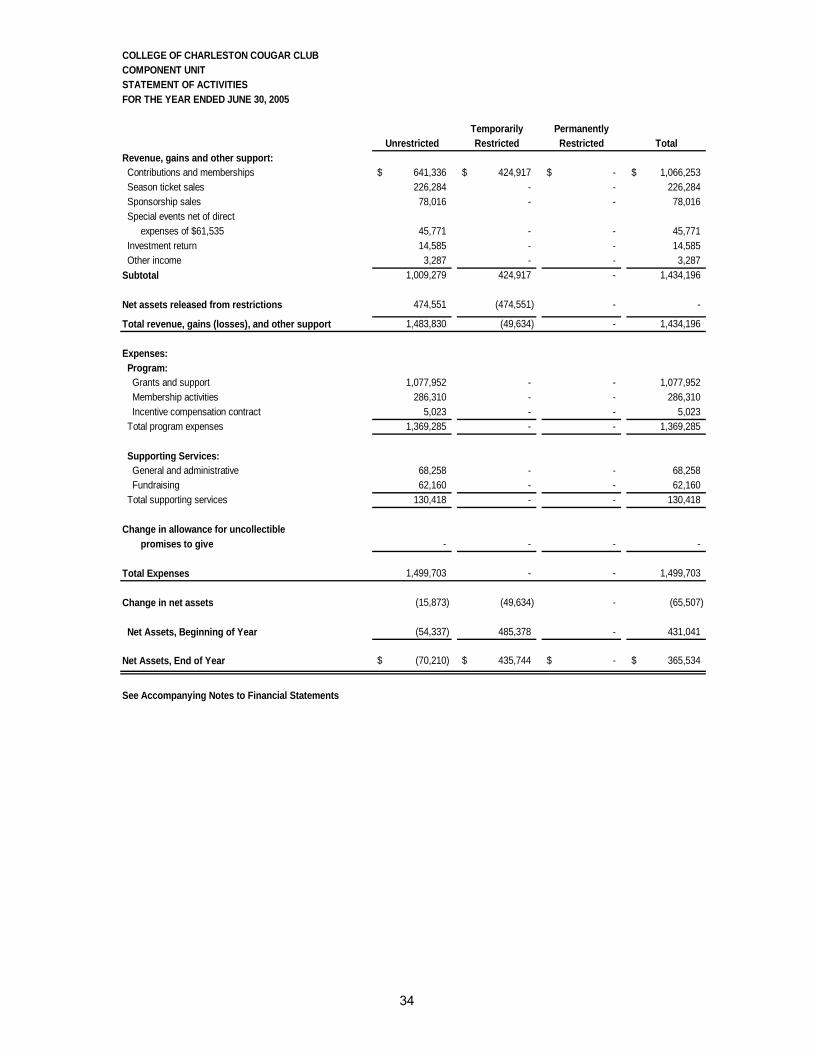
Temporarily PermanentlyUnrestricted Restricted Restricted Total
Revenue, gains and other support: Contributions and memberships 641,336$ 424,917$ -$ 1,066,253$ Season ticket sales 226,284 - - 226,284 Sponsorship sales 78,016 - - 78,016 Special events net of direct
expenses of $61,535 45,771 - - 45,771 Investment return 14,585 - - 14,585 Other income 3,287 - - 3,287 Subtotal 1,009,279 424,917 - 1,434,196
Net assets released from restrictions 474,551 (474,551) - -
Total revenue, gains (losses), and other support 1,483,830 (49,634) - 1,434,196
Expenses: Program: Grants and support 1,077,952 - - 1,077,952 Membership activities 286,310 - - 286,310 Incentive compensation contract 5,023 - - 5,023 Total program expenses 1,369,285 - - 1,369,285
Supporting Services: General and administrative 68,258 - - 68,258 Fundraising 62,160 - - 62,160 Total supporting services 130,418 - - 130,418
Change in allowance for uncollectiblepromises to give - - - -
Total Expenses 1,499,703 - - 1,499,703
Change in net assets (15,873) (49,634) - (65,507)
Net Assets, Beginning of Year (54,337) 485,378 - 431,041
Net Assets, End of Year (70,210)$ 435,744$ -$ 365,534$
See Accompanying Notes to Financial Statements
FOR THE YEAR ENDED JUNE 30, 2005
COLLEGE OF CHARLESTON COUGAR CLUBCOMPONENT UNITSTATEMENT OF ACTIVITIES
34

THE COLLEGE OF CHARLESTON NOTES TO THE FINANCIAL STATEMENTS
JUNE 30, 2005
NOTE 1 – SUMMARY OF SIGNIFICANT ACCOUNTING POLICIES Financial Reporting Entity The College of Charleston is a state-supported institution of higher education. The College’s main purpose is to provide a world-class liberal arts education to undergraduate and graduate students. It is committed to attracting the most promising students from South Carolina, other states in the nation, and from around the world. The accompanying basic financial statements present the statement of net assets, statement of revenue, expenses and changes in net assets, and the statement of cash flows of the College of Charleston. The financial statements include individual schools and departments. The College includes all funds and account groups, and all entities over which the College exercises or has the ability to exercise oversight authority for financial reporting purposes. As defined by generally accepted accounting principles established by the Governmental Accounting Standards Board (GASB), the financial reporting entity consists of the primary government and its component units. Component units are legally separate organizations for which the primary government is financially accountable and other organizations for which the nature and significance of their relationships with the primary government are such that exclusion would cause the financial statements to be misleading or incomplete. Accordingly, the financial statements include the accounts of the College, as the primary government, and the accounts of its component units, the College of Charleston Foundation and the Cougar Club. The College is part of the primary government of the State of South Carolina. The College of Charleston Foundation is a separately chartered corporation formed primarily to provide financial assistance and scholarships to the College. The Foundation reports under the Financial Accounting Standards Board (FASB) and operates on a calendar year basis. The Cougar Club is a separately chartered corporation organized exclusively to solicit and provide funds to the Athletic Department. The Cougar Club reports under the Financial Accounting Standards Board (FASB). Financial Statement Presentation The financial statement presentation for the College meets the requirements of Governmental Accounting Standards Board (GASB) Statement No. 34, Basic Financial Statements and Management’s Discussion and Analysis for State and Local Governments, and GASB Statement No. 35, Basic Financial Statements and Management’s Discussion and Analysis for Public Colleges and Universities. The financial statement presentation provides a comprehensive, entity-wide perspective of the College’s net assets, revenues, expenses and changes in net assets and cash flows. In addition and as per GASB Statement No. 39, its component units are discretely presented in the report. Basis of Accounting For financial reporting purposes, the College is considered a special-purpose government engaged only in business-type activities. Accordingly, the College’s financial statements have been presented using the economic resources measurement focus and the accrual basis of accounting. Under the accrual basis, revenues are recognized when earned, and expenses are recorded when an obligation has been incurred. Student tuition and fees and auxiliary enterprise fees are presented net of scholarship discounts and allowances applied to student accounts, while stipends and other payments made directly are presented as scholarship and fellowship expenses. All significant intra-agency transactions have been eliminated. The College has elected not to apply Financial Accounting Standards Board (FASB) pronouncements issued after November 30, 1989.
35

Cash and Cash Equivalents The amounts shown in the financial statements in the College funds as “cash and cash equivalents” represent petty cash, cash on deposits in banks, cash on deposit with the State Treasurer, cash invested in various instruments by the State Treasurer as part of the State’s internal cash management pool as well as cash invested in various short-term investments by the State Treasurer and held in separate agency accounts. Most State agencies including the College participate in the State’s internal cash management pool. Because the cash management pool operates as a demand deposit account, amounts invested in the pool are classified as cash and cash equivalents. The State Treasurer administers the cash management pool. The pool includes some long-term investments such as obligations of the United States and certain agencies of the United States, obligations of the State of South Carolina and certain of its political subdivisions, certificates of deposit and certain corporate bonds. The State’s internal cash management pool consists of a general deposit account and several special deposit accounts. The State records each fund’s equity interest in the general deposit account; however, all earnings on the account are credited to the General Fund of the State. The College records it deposits in the general deposit account at cost. It records and reports its special deposit account at fair value. For purposes of the Statement of Cash Flows, the College considers all highly liquid investments with an original maturity of three months or less to be cash equivalents. Funds invested through the State of South Carolina State Treasurer’s Office are considered cash equivalents. Investments The College accounts for its investments at fair market value in accordance with GASB Statement No. 31, Accounting and Financial Reporting for Certain Investments and for External Investment Pools. Changes in unrealized gain (loss) on the carrying value of investments are reported as a component of investment income in the Statement of Revenues, Expenses and Changes in Net Assets. Accounts Receivable Accounts receivable consist of tuition and fee charges to students, gift receivables, and auxiliary enterprise services provided to students and other outside entities. Accounts receivable also include amounts due from the federal government, state and local governments, or private sources, in connection with reimbursement of allowable expenditures made pursuant to the College’s grants and contracts. Accounts receivable are recorded net of estimated uncollectible amounts. Student loans receivable consist of amounts due from the Federal Perkins Loan Program. Inventories Inventories are carried at cost on a moving weighted average basis. Items accounted for as the College inventories include maintenance, janitorial, housing and office supplies. Capital Assets Capital assets are recorded at cost at the date of acquisition or fair market value at the date of donation in the case of gifts. The College follows capitalization guidelines established by the State of South Carolina. All land is capitalized, regardless of cost. Qualifying improvements that rest in or on the land itself are recorded as depreciable land improvements. Major additions and renovations and other improvements that add to the usable space, prepare existing buildings for new uses, or extend the useful life of an existing building are capitalized. The College capitalizes moveable personal property with a unit value in excess of $5,000 and a useful life in excess of one year, and depreciable land improvements, buildings and improvements, and intangible assets costing in excess of $100,000. Routine repairs and maintenance and library materials, except individual items costing in excess of $5,000, are charged to operating expenses in the year in which the expense was incurred. Depreciation is computed using the straight-line method over the estimated useful life of the asset, generally 15 to 50 years for buildings and improvements and land improvements, and 3 to
36
25 years for machinery, equipment, and vehicles. A full year of depreciation is taken during the year the asset is placed in service and no depreciation is taken in the year of disposition. Deferred Revenues and Deposits Deferred revenues include amounts received for tuition and fees and certain auxiliary activities prior to the end of the fiscal year but related to the subsequent accounting period. Deferred revenues also include amounts received from grant and contract sponsors that have not yet been earned. Deposits include dormitory room deposits, advance tuition payments, and other miscellaneous deposits. Student deposits are recognized as revenue during the semester for which the fee to which the deposit relates is applicable, and earned when the deposit is nonrefundable to the student under the forfeit terms of the agreement. Compensated Absences Generally, all permanent full-time State employees and certain part-time employees scheduled to work at least one half of the agency’s workweek are entitled to accrue and carry forward at calendar year-end maximums of 180 days sick leave and of 45 day annual vacation leave. Upon termination of State employment, employees are entitled to be paid for accumulated unused annual vacation leave up to the maximum, but are not entitled to any payment for unused sick leave. The compensated absences liability includes accrued annual leave. The College calculates the compensated absences liability based on recorded balances of unused leave for which the employer expects to compensate employees through cash payments at termination. That liability is inventoried at fiscal year-end current salary costs and the cost of the salary-related benefit payments. The net change in the liability is recorded in the current year in the applicable functional expenditure categories. The liability and expense incurred are recorded at year-end as compensated absences payable in the Statement of Net Assets, and as a component of compensation and benefit expense in the Statement of Revenues, Expenses, and Changes in Net Assets. Perkins Loans Receivable and Related Liability The loans receivable on the balance sheet is due to the College under the Perkins Loan Program. This program is funded primarily by the federal government with the College providing a required match. The amount reported as Perkins liability is the amount of cumulative federal contributions and a pro rata share of net earnings on the loans under this program which would require repayment to the federal government if the College ceases to participate in the program. The College recognizes as revenue and expenses only the portion attributable to its matching contribution. Net Assets The College’s net assets are classified as follows: Invested in capital assets, net of related debt: This represents the College’s total investment in capital assets, net of outstanding debt obligations related to those capital assets. To the extent debt has been incurred but not yet expended for capital assets, such amounts are not included as a component of invested in capital assets, net of related debt. Restricted net assets – expendable: Restricted expendable net assets include resources which the College is legally or contractually obligated to spend in accordance with restrictions imposed by external third parties. Restricted net assets – nonexpendable: Nonexpendable restricted net assets consist of endowment and similar type funds which donors or other outside sources have stipulated, as a condition of the gift instrument, that the principal is to be maintained inviolate and in perpetuity, and invested for the purpose of producing present and future income, which may either be expended or added to principal. Unrestricted net assets: Unrestricted net assets represent resources derived from student tuition and fees, appropriations, and sales and services of educational departments. These resources
37

also include auxiliary enterprises, which are substantially self-supporting activities that provide services to students, faculty and staff. The College policy is to first apply restricted resources when an expense is incurred for purposes for which both restricted and unrestricted net assets are available. Income Taxes The College, as a political subdivision of the State of South Carolina, is excluded from federal income taxes under Section 115 (1) of the Internal Revenue Code, as amended. Classification of Revenue and Expenses The College has classified its revenues and expenses as either operating or non-operating according to the following criteria: Operating revenues and expenses: Operating revenues include activities that have the characteristics of exchange transactions, such as (1) student tuition and fees, net of scholarship discounts and allowances, (2) sales and services of auxiliary enterprises, net of scholarship discounts and allowances, (3) federal, state and local grants and contracts for services that finance programs the College would not otherwise undertake, (4) receipts for scholarships where the provider has identified the student recipients, and (5) fees received from organizations and individuals in exchange for miscellaneous goods and services provided by the College. Operating expenses include all expense transactions incurred other than those related to investing, capital or non-capital financing activities. Non-operating revenues and expenses: Non-operating revenues include activities that have the characteristics of non-exchange transactions. These revenues include gifts and contributions, appropriations, investment income, and any grants and contracts that are not classified as operating revenue or restricted by the grantor to be used exclusively for capital purposes. Non-operating expenses include interest paid on capital asset related debt, losses on the disposal of capital assets, and refunds to grantors. Scholarship Discounts and Allowances Student tuition and fee revenues, and certain other revenues from students, are reported net of scholarship discounts and allowances in the Statement of Revenues, Expenses, and Changes in Net Assets. Scholarship discounts and allowances are the difference between the stated charge for goods and services provided by the College and the amount that is paid by students and/or third parties making payments on the students’ behalf. Certain governmental grants, such as Pell grants, and other federal, state or non-governmental programs, are recorded as either operating or non-operating revenues in the College’s financial statements. To the extent that revenues from such programs are used to satisfy tuition and fees and other student charges, the College has recorded a scholarship discount and allowance. Sales and Services of Educational and Other Activities Revenues from sales and services of educational and other activities generally consist of amounts received from instructional, laboratory, research, and public service activities that incidentally create goods and services which may be sold to students, faculty, staff, and the general public. The College receives such revenues primarily from the general public. Auxiliary Enterprises and Internal Service Activities Auxiliary enterprise revenues primarily represent revenues generated by intercollegiate athletics, parking, bookstore, food services, housing, health services, debit card, and vending. Revenues of internal auxiliary enterprise activities and the related expenditures of college departments have been eliminated. Use of Estimates in Accounting The College has used estimates in certain situations to enable it to prepare properly the financial statements. Estimates are used to determine the useful life of long-lived assets such as buildings, improvements, and equipment. The College has used estimates as provided by the South Carolina Comptroller General’s Office in developing the estimates of useful lives. In addition, the College has estimated the percentage of accounts receivable that may not be collected, typically
38

known as the allowance for bad debts. The College uses an aging analysis to estimate this allowance. Actual results could vary from these estimates. NOTE 2 – CASH AND CASH EQUIVALENTS, OTHER DEPOSITS, AND INVESTMENTS All deposits and investments of the College are under the control of the State Treasurer, who, by law, has sole authority for investing State funds. Information pertaining to the reported amounts, fair values and credit risk of the State Treasurer’s investments is disclosed in the Comprehensive Annual Financial Report of the State of South Carolina. The following schedule reconciles deposits and investments with the footnotes to the Statement of Net Assets amounts:
Schedule of Deposits and Investments
Current assets20,244,573$
Noncurrent assetsRestricted assets:Cash and Cash Equivalents 46,501,877
66,746,450$
10,325$ 61,638,556
Wachovia Operating Checking Account 4,993,819 Bank of America Payroll Checking Account 2,253
101,497 66,746,450$
Cash on hand
Wachovia Perkins Loan Accounts
Disclosure, Deposits, and Investments
Deposits held by State Treasurer
Statement of Net Assets
Cash and Cash Equivalents
Deposits Held by State Treasurer Custodial Credit Risk Custodial credit risk for deposits is the risk that, in the event of a bank failure, the deposits of the College of Charleston may not be returned to the College. For deposits held by the State Treasurer, State law requires full collateralization of all State Treasurer bank balances. The State Treasurer must correct any deficiencies in collateral within seven days. At June 30, 2005, all State Treasurer bank balances were fully insured or collateralized with securities held by the State or by its agents in the State’s name. With respect to investments in the State’s internal cash management pool, all of the State Treasurer’s investments are insured or registered or are investments for which the securities are held by the State or its agents in the State’s name. Information pertaining to the reported amounts, fair values, and credit risk of the State Treasurer’s investments is disclosed in the Comprehensive Annual Financial Report of the State of South Carolina. With respect to the College’s other deposits at year-end, all of these deposits are either insured or collateralized with securities held by the entity or by its agent in the entity’s name, or collateralized with securities held by the pledging financial institution’s trust department or agent in the entity’s name. In addition, restricted cash deposits include a restricted endowment fund of $103,151; $332,594 for Perkins Loan Fund; $189,983 held for others; and $45,876,149 for capital projects.
39

Other Deposits The College owns approximately $5,097,569 of the total other deposits which are held in checking accounts used to pay payroll and operating expenses and to handle Perkins Loans collections. Federal Depository Insurance Corporation (FDIC) covers the deposits of the College’s checking and Perkins Loans accounts up to the FDIC limit of $100,000 and the balance is collateralized by government securities. Investments The College of Charleston Foundation, a component unit of the College, has investments consisting of marketable debt and equity securities, which are carried at fair value based on quoted market prices determined at the date of the Statement of Financial Position. Investments donated to the Foundation are initially recorded at market value on the date of gift. Unrealized gains and losses are included in the change in net assets in the Statement of Activities. The Foundation maintains master investment accounts for its donor-restricted and board-designated endowments. Investment income and expenses, including unrealized gains and losses from securities in the master investment accounts, are allocated semi-annually to the individual endowments based on the relationship of the market value of each endowment to the total market value of the master investment accounts, as adjusted for additions to or deductions from those accounts. The Foundation maintains its cash accounts in four different commercial banks and two investment firms located in South Carolina. Accounts held at each bank are insured up to $100,000 by the Federal Deposit Insurance Corporation (FDIC) as provided by law. The majority of investments other than bank accounts are held by one local investment firm. This investment firm provides up to $500,000 protection, including $100,000 for cash, through Securities Investor Protection Corporation (SIPC). In addition, the firm purchases excess SIPC protection to apply to losses above SIPC protection level, up to net equity value. Cash held at the other investment company has zero to minimum credit risk. The Foundation is also subject to concentration of credit risk related to its unconditional promises to give–receivables. Contributions and unconditional promises to give consist of gift amounts from individuals and businesses predominantly located in the State of South Carolina. At December 31, 2004, pledges from one donor represented 32% of the total promises to give balance. Investment – Non-Governmental Discretely Presented Component Units The College of Charleston Foundation investments as of December 31, 2004 are as follows:
Investment Carried at Fair Value
Cost (in thousands)
Fair Value (in thousands)
Cash 1$ 1$ Money funds 893 893 Debt securities 6,391 6,558 Equity securities 7,533 8,862 Mutual funds 12,308 15,202 U. S. Government securities 5,405 5,548
32,531$ 37,064$
40

NOTE 3 – ACCOUNTS RECEIVABLE Accounts receivable as of June 30, 2005, are summarized as follows:
Accounts ReceivableAs of June 30, 2005
2,266,346$ 4,784,093 (227,000)
7,710,484 86,761
167,100 1,122,909
208,715 Private Gifts 428,598
182,044 1,122,321
17,852,371$
OtherAuxiliary EnterpriseNet Accounts Receivable
State Grants and ContractsNongovernmental Grants and ContractsRelated PartiesInterest Income
Perkins Loan ReceivableStudent Accounts Less Allowance for Doubtful AccountsFederal Grants and Contracts
Allowances for losses on student accounts receivable are established based upon actual losses expended in prior years and/or evaluations of the current account portfolio. At June 30, 2005, the allowance for uncollectible student accounts is valued at $227,000. NOTE 4 – LOANS RECEIVABLE Student loans made through the federal Perkins Loan Program comprise substantially all of the loans receivable as of June 30, 2005. The Perkins Loan Program provides various repayment options. Students have the right to repay the loans over periods up to 10 years depending on the amount of the loan and loan cancellation privileges the student may exercise. These loans are classified as non-current receivables. As the College determines that loans are uncollectible, the loans are written off and assigned to the U.S. Department of Education.
41

NOTE 5 – CAPITAL ASSETS
Beginning EndingBalance Balance7/1/2004 Increases Decreases 6/30/2005
24,108,639$ 360,000$ 2,525,000$ 21,943,639$ 38,800,455 7,885,951 37,208,472 9,477,934
62,909,094$ 8,245,951$ 39,733,472$ 31,421,573$
3,930,238$ -$ -$ 3,930,238$ 110,080,715 52,935,617 - 163,016,332 29,330,207 - - 29,330,207 6,169,145 1,034,003 401,770 6,801,378
343,732 - - 343,732 860,824 136,690 87,763 909,751
150,714,861$ 54,106,310$ 489,533$ 204,331,638$
2,952,754$ 65,166$ -$ 3,017,920$ 40,448,031 4,112,850 - 44,560,881 15,843,542 1,059,914 - 16,903,456 3,662,568 614,610 300,047 3,977,131
307,537 36,195 - 343,732 546,865 82,021 83,087 545,799
63,761,297$ 5,970,756$ 383,134$ 69,348,919$
86,953,564$ 48,135,554$ 106,399$ 134,982,719$
149,862,658$ 56,381,505$ 39,839,871$ 166,404,292$
Buildings Building improvements Machinery, equipment, and other
Capital assets not being depreciated:
Less accumulated depreciatiof for: Land improvements
Computer software Motor vehicle
Total other capital assets at historical cost
Buildings Buildings improvements Machinery, equipment, and other Computer software Motor vehicle
Total accumulated depreciation
Other capital assets, net
Capital assets, net
Land Construction in progress
Total capital assets not being depreciated
Other capital assets: Land improvements
NOTE 6 – PENSION PLAN (S) The Retirement Division of the State Budget and Control Board maintains four independent defined benefit plans and issues its own publicly available Comprehensive Annual Financial Report (CAFR), which includes financial statements and required supplementary information. A copy of the separately issued CAFR may be obtained by writing to the Retirement Division, 202 Arbor Lake Drive, Columbia, South Carolina, 29223. Furthermore, the Division and the four pension plans are included in the CAFR of the State of South Carolina. Article X, Section 16, of the South Carolina Constitution requires that all state operated retirement systems be funded on a sound actuarial basis. Title 9 of the South Carolina Code of Laws of 1976, as amended, prescribes requirements relating to membership, benefits, and employee/ employer contributions for each pension plan. Employee and employer contribution rates for the South Carolina Retirement System and the Police Officers Retirement System are actuarially determined. Annual benefits, payable monthly for life, are based on length of service and average final compensation.
42

South Carolina Retirement System The majority of employees of the College are covered by a retirement plan through the South Carolina Retirement System (SCRS), a cost-sharing multiple-employer defined benefit pension plan administered by the Retirement Division, a public employee retirement system. Generally, all State employees are required to participate in and contribute to the SCRS as a condition of employment unless exempted by law as provided in Section 9-1-480 of the South Carolina Code of Laws. This plan provides retirement annuity benefits as well as disability, cost of living adjustments, death, and group life insurance benefits to eligible employees and retirees. Since July 1, 1988, employees participating in the SCRS have been required to contribute 6.0 percent of all compensation. Effective July 1, 2004, the employer contribution rate became 10.80 percent, which includes a 3.25 percent surcharge to fund retiree health and dental insurance coverage. The College’s actual contributions to the SCRS for the three most recent fiscal years ended June 30, 2005, 2004, and 2003, were $2,829,226, $2,691,038, and $2,701,735, respectively, and equaled the required contributions of 7.55 percent (excluding the surcharge) for each year. Also, the College paid employer group life insurance contributions of $56,210 in the current fiscal year at the rate of .15 percent of compensation. Police Officers Retirement System The South Carolina Police Officers Retirement System (PORS) is a cost-sharing multiple-employer defined benefit public employee retirement plan administered by the Retirement Division. Generally, all full-time employees whose principal duties are the preservation of public order or the protection or prevention and control of property destruction by fire are required to participate in and contribute to the system as a condition of employment. This plan provides annuity benefits as well as disability and group life insurance benefits to eligible employees and retirees. In addition, participating employers in the PORS contribute to the accidental benefits to beneficiaries of police officers and firemen killed in the actual performance of their duties. These benefits are independent of any other retirement benefits available to the beneficiary. Since July 1, 1988, employees participating in the PORS have been required to contribute 6.5 percent of all compensation. Effective July 1, 2004, the employer contribution rate became 13.55 percent, which, as for the SCRS, includes the 3.25 percent surcharge. The College’s actual contributions to the PORS for the years ended June 30, 2005, 2004, and 2003, were $180,705, $179,147, and $167,950 respectively, and equaled the required contribution of 10.3 percent (excluding the surcharge) for each year. Also, the College paid employer group life insurance contributions of $3,292 and accidental death insurance contributions of $3,292 in the current fiscal year for PORS participants. The rate for each of these insurance benefits is .20 percent of compensation. Optional Retirement Program Certain state employees may elect to participate in the Optional Retirement Program (ORP), a defined contribution plan. The ORP was established in 1987 under Title 9, Chapter 17, of the South Carolina Code of Laws. The ORP provides retirement and death benefits through the purchase of individual fixed or variable annuity contracts, which are issued to, and become the property of, the participants. The State assumes no liability for this plan other than for payment of contributions to designated insurance companies. ORP participation is limited to faculty and administrative staff of the State’s higher education institutions who meet all eligibility requirements for membership in the SCRS. To elect participation in the ORP, eligible employees must irrevocably waive SCRS membership within their first ninety days of employment. Under State law, contributions to the ORP are required at the same rate as for the SCRS, 7.55 percent plus the retiree surcharge of 3.30 percent from the employer in fiscal year 2005. Certain College employees have elected to be covered under optional retirement plans. For the fiscal year, total contribution requirements to the ORP were $1,565,711 (excluding the surcharge) from the College as employer and $1,246,889 from its employees as plan members. In addition, the College paid $27,059 for group life insurance coverage for these employees. All amounts were remitted to the Retirement Division of the State Budget and Control Board for distribution to
43

the respective annuity policy providers. The obligation for payment of benefits resides with the insurance companies. Deferred Compensation Plans Several optional deferred compensation plans are available to State employees and employers of its political subdivisions. Certain employees of the College have elected to participate. The multiple employer plans, created under Internal Revenue Code Sections 457, and 401 (k), are administered by third parties and are not included in the Comprehensive Annual Financial Report of the State of South Carolina. Compensation deferred under the plans is placed in trust for the contributing employee. The State has no liability for losses under the plans. Employees may withdraw the current value of their contributions when they terminate State employment. Employees may also withdraw contributions prior to termination if they meet requirements specified by the applicable plan. Teacher and Employee Retention Incentive Effective January 1, 2001, Section 9-1-2210 of the South Carolina Code of Laws allows employees eligible for service retirement to participate in the Teacher and Employee Retention Incentive (TERI) Program. TERI participants may retire and begin accumulating retirement benefits on a deferred basis without terminating employment for up to five years. Upon termination of employment or at the end of the TERI period, whichever is earlier, participants will begin receiving monthly service retirement benefits which will include any cost-of-living adjustments granted during the TERI period. TERI participants are ineligible to receive group life insurance benefits or disability retirement benefits. For pay earned before July 1, 2005, TERI participants were not required to make SCRS contributions. Legislative Act 153, which became law effective July 1, 2005, requires TERI participants to pay employee contributions to SCRS for pay earned after June 30, 2005. NOTE 7 – POSTEMPLOYMENT AND OTHER EMPLOYEE BENEFITS In accordance with the South Carolina Code of Laws and the annual Appropriation Act, the State of South Carolina provides certain health care, dental, and life insurance benefits to certain active and retired State employees and certain surviving dependents of retirees. All permanent full-time and certain permanent part-time employees of the College are eligible to receive these benefits. The State provides post employment health and dental benefits to employees who retire from State service or who terminate with at least 20 years of State service who meet one or more of the eligibility requirements, such as age, length of service, and hire date. Generally, those who retire must have at least 10 years of retirement service credit to qualify for these State funded benefits. Benefits are effective at the date of retirement when the employee is eligible for retirement benefits. These benefits are provided through annual appropriations by the General Assembly to the College for its active employees and to the State Budget and Control Board for all participating State retirees except the portions funded through the pension surcharge and provided from other applicable fund sources of the College for its active employees who are not funded by State General Fund appropriations. The State finances health and dental plan benefits on a pay-as-you-go basis. Currently, approximately 21,400 State retirees meet these eligibility requirements. The College recorded compensation and benefit expenses for these insurance benefits for active employees in the amount of $4,509,480 for the year ended June 30, 2005. As discussed in Note 6, the College paid $1,891,260 applicable to the 3.25 percent surcharge included with the employer contributions for retirement benefits. These amounts were remitted to the South Carolina Retirement Systems for distribution to the Office of Insurance Services for retiree health and dental insurance benefits. Information regarding the cost of insurance benefits applicable to College retirees is not available. By State law, the College has no liability for retirement benefits. Accordingly, the cost of providing these benefits for retirees is not included in the accompanying financial statements. In addition, the State General Assembly periodically directs the Retirement System to pay supplemental (cost of living) increases to retirees. Such increases are primarily funded from
44

Systems’ earnings; however, a portion of the required amount is appropriated from the State General Fund for the SCRS and PORS benefits. NOTE 8 – CONTINGENCIES, LITIGATION, AND PROJECT COMMITMENTS The College is party to various lawsuits arising out of the normal conduct of its operations. In the opinion of College management, there are no material claims or lawsuits against the College that are not covered by insurance or whose settlement would materially affect the College’s financial position. However, there are three cases pending for which the College is disclosing detailed information for purposes of this financial reporting requirement. The first case involves litigation with HITT Construction regarding the construction of the new library. This is a breach of contract lawsuit involving claims made by Enwright, an architecture firm, and the College along with HITT Construction concerning conduct in their role as architects on the College’s Library Project. The matter involves many subcontractors to which certain agencies have settled with the College and HITT, but other subcontractor issues are still pending. The second case pertains to a real estate transaction of the new dormitory and parking facility while the third pertains to the cancellation of leases for the two parking lots. The College does not expect to incur any material expenses associated with any of these cases. The College participates in certain federal grant programs. These programs are subject to financial and compliance audits by the grantor or its representative. Such audits could lead to requests for reimbursement to the grantor agency for expenditures disallowed under terms of the grant. Management believes disallowances, if any, will not be material. The College had outstanding commitments under construction contracts of approximately $13,821,542 at June 30, 2005. Of this total, $10,732,383 is attributable to capital projects and the balance of $3,089,159 is for non-capital repairs and maintenance. The College anticipates funding these projects out of current resources, current and future bond issues, private gifts, student fees, and State Capital Improvement Bond proceeds. The State has issued Capital Improvement Bonds to fund improvements and expansion of state facilities. The College is not obligated to repay these funds to the state. Authorized funds can be requested as needed once State authorities have given approval to begin specific projects and project expenditures have been incurred. The College has $4,294,323 of authorized State Capital Improvement Bond proceeds available to draw at June 30, 2005.
45

NOTE 9 – LEASE OBLIGATIONS Future commitments for operating leases having remaining non-cancelable terms in excess of one year as of June 30, 2005 are as follows:
Equipment External Parties Other State Agencies
101,675$ 2,604,278$ 127,821$ 74,111 2,519,282 127,821 40,165 2,377,221 127,821
- 2,169,920 127,821 - 1,853,937 127,821 - 3,000,000 639,105 - - 639,105 - - 639,105 - - 639,105 - - 639,105 - - 639,105 - - 639,105 - - 639,105 - - 639,105
2056-60 - - 639,105 - - 127,821
215,951$ 14,524,638$ 7,157,976$
Year Ending June 30,
Operating LeasesReal Property
2021-252026-302031-352036-40
2016-202011-1520102009
2006
20082007
Total minimum lease payments
2041-452046-502051-55
2061-65
Operating Leases The College’s non-cancelable operating leases having remaining terms of more than one year expire in various fiscal years from 2006 through 2065. Certain operating leases provide for renewal options for periods of one to three years at their fair rental value at the time of renewal. In the normal course of business, operating leases are generally renewed or replaced by other leases. Operating leases are generally payable on a monthly basis. In addition, the College has copier leases on a per copy basis. In 2004, the College renewed real property operating leases with the College of Charleston Foundation, a component unit, for twenty different locations for offices, dormitories, and parking, with annual rentals of $713,330. The agreements contain renewal options. Under these agreements, the College paid the Foundation $730,721 in the current year. These leases provide that the College assume responsibility for the maintenance of the property. There are no escalation clauses in the leases nor is the College liable for property taxes. During the subsequent fiscal year, the College renewed all existing leases with the Foundation. The terms of the lease agreements are subject to annual changes. In the case of operating leases for real property from commercial vendors, there exist several leases with escalation clauses limited to the cost of living. The leased properties consist of classrooms, parking lots, and a warehouse. Additionally, the College pays the commercial vendor property taxes. The College performs routine maintenance on these properties. These costs are not included in the schedule of lease commitments. In August 2004, the College entered into a nine-year lease for Warren Place, residential apartments and parking spaces, with Brumley, Meyer and Kapp. Additionally, the College leases a sports complex field from Patriots Point Development Authority, a state agency, with annual rents of $10,000 per month, April 1, 2002 through March 31, 2062, with annual increases equal to the Consumer Price Index beginning April 1, 2003. A one-time
46

payment of $500,000 was paid in fiscal year 1998 with a corresponding charge to prepaid expenditures. It is being amortized ratably over the 65-year lease term utilizing the straight-line method of calculation. The lease agreements make no provisions beyond the 65 year period. The unamortized balance at June 30, 2005 is $436,541. Amortization of the prepaid rent balance for fiscal year 2005 was $7,692 and is reported in operating expenses. The College provides maintenance to the tax-exempt property. The College paid the Patriots Point Development Authority $125,470 in rent in fiscal year 2005. Total operating lease expenditures for fiscal year 2005 were $3,583,483, of which $374,937 is for the per copy charge on the copy machines. The College reports all of these operating lease costs in operating expenses. NOTE 10 – BONDS PAYABLE Bonds payable consisted of the following at June 30, 2005:
Interest Maturity Debt RetiredRates Dates Balance FY 2005
Bond, Series 2002 C-McAlister 3.0-5.0% 2032 20,700,000$ 420,000$
Bond, Series 2002 A-Kelly 3.0-5.25% 2032 10,065,000 190,000
Bond, Series 2003 D Parking Garage 2.0-4.5% 2033 12,090,000 260,000 Dorm Renovation 2.0-4.5% 2033 6,810,000 440,000
Refunding Bond, Series 2002B 4.0-5.0% 2012 10,685,000 1,100,000 Higher Education Facilities Revenue
Bond, Series 2004A 3.0-5.0% 2019 5,000,000 190,000 Higher Education Facilities Revenue
Bond, Series 2004B 3.0-5.375% 2034 27,050,000 215,000
92,400,000$ 2,815,000$
Series 2003 A - School of Business 3.0-5.0% 2023 6,755,000$ 225,000$
99,155,000$ 3,040,000$ 20,924
99,134,076$ Total Bonds Payable
Sub-total Bonds PayableLess: Unamortized Bond Discount
Total Revenue Bonds State Institution Bonds
Higher Education Facilities Revenue
Higher Education Facilities Revenue
Higher Education Facilities Revenue
Revenue BondsHigher Education Facilities Revenue
Bonds issued by the College include certain restrictive covenants. Auxiliary Revenue Bonds are payable solely from and secured by a pledge of revenues of the College’s residence halls, food service, and parking, as well as from additional funds from the plant improvement fee imposed by the Board of Trustees. State Institution Bonds are general obligation bonds of the State backed by the full faith, credit, and taxing power of the State of South Carolina. Tuition revenue is pledged up to the annual debt requirements for the payment of principal and interest on State Institution Bonds. S.C. Code of
47

Laws Section 59-107-90 states that the maximum amount of annual debt service on State Institution Bonds for each institution shall not exceed ninety percent of the sums received from tuition fees for the preceding fiscal year. Tuition fees for the year ended June 30, 2004 were $4,214,080 which results in a legal debt margin at June 30, 2005, of $3,792,672. Bond discounts/premiums and other bond issuance costs are capitalized and amortized throughout the life of the bonds. The amount amortized was $49,354 in fiscal year 2005 and $28,485 in fiscal year 2004. The College of Charleston capitalizes as a component of construction in progress interest costs in excess of earnings on debt associated with capital projects; therefore, asset values in capital assets include such interest costs. Capitalized interest for fiscal year 2005 was $529,831. The College purchased a bond insurance policy payable to the bond trustee for the individual revenue bonds outstanding. The insurance guarantees payment of principal and interest until all debt has been retired. All of the bonds are payable in semi-annual installments plus interest. Amounts including interest required to complete payment of the Auxiliary Revenue Bonds as of June 30, 2005 are as follows: Revenue Bonds
Principal Interest Total
Year Ending June 30,
2006 3,070,000$ 4,112,879$ 7,182,879$ 2007 3,180,000 4,007,979 7,187,979 2008 3,285,000 3,903,328 7,188,328 2009 3,390,000 3,788,629 7,178,629 2010-14 17,440,000 16,835,641 34,275,641 2015-19 13,415,000 13,791,525 27,206,525 2020-24 13,775,000 10,768,720 24,543,720 2025-29 17,505,000 7,044,039 24,549,039 2030-34 17,340,000 2,323,519 19,663,519 Total Revenue Bonds 92,400,000$ 66,576,259$ 158,976,259$
Amounts including interest required to complete payment of the State Institution Bonds as of June 30, 2005 are as follows:
State Institution Bonds
Principal Interest Total
Year Ending June 30,
2006 240,000$ 242,350$ 482,350$ 2007 255,000 230,350 485,350 2008 265,000 222,700 487,700 2009 275,000 214,750 489,750 2010-14 1,615,000 940,250 2,555,250 2015-19 2,055,000 643,987 2,698,987 2020-24 2,050,000 212,751 2,262,751 Total State Institutional Bonds 6,755,000$ 2,707,138$ 9,462,138$
48

In prior years the College defeased certain bonds by placing the proceeds of new bonds in an irrevocable trust to provide for all future debt service payments on the old bonds. Accordingly, the trust account assets and the liability for these defeased bonds are not included in the College’s financial statements. At June 30, 2005, $2,264,000 of bonds outstanding is considered defeased. The College was in compliance with all applicable bond covenants as of June 30, 2005. On April 22, 2004, the College’s Board of Trustees authorized the issuance of up to $35,000,000 in Higher Education and Academic and Administrative Facilities Revenue Bonds to fund various campus projects. The Series 2004 Bonds were issued July 15, 2004, in two Series: Series A in the amount of $27,265,000, with a 15-year amortization term, and Series B in the amount of $5,190,000, with a 30-year amortization term, with interest rates between 3 percent and 5 percent, and bond issuance costs of $276,075 amortized over the life of the bonds. Proceeds from Series 2004 A Bonds will provide for major renovation of all interior spaces and the replacement/enhancement of fire and life safety systems for McConnell Residence Hall, and the Craig Residence Hall, and address other deferred maintenance needs, such as roofs, HVAC systems, and exterior repairs on other residence hall facilities. Proceeds from Series 2004 B Bonds will be used to expand and renovate the School of the Arts Building, an existing building, and to add approximately 25,000 square feet of new construction for the School of Education, to renovate portions of the Stern Student Center, and to construct a new School of Business. NOTE 11 – LONG-TERM LIABILITIES Long-term liability activity for the year ended June 30, 2005 was as follows:
Due Within
July 1, 2004 Additions Reductions June 30, 2005 One Year
6,980,000$ -$ 225,000$ 6,755,000$ 240,000$
Discounts 2,686 (6,265) 2,094 (1,485) (1,485) 6,982,686$ (6,265)$ 222,906$ 6,753,515$ 238,515$
62,760,000$ 32,455,000$ 2,815,000$ 92,400,000$ 3,070,000$
135,940 (154,770) 609 (19,439) -
62,895,940$ 32,300,230$ 2,815,609$ 92,380,561$ 3,070,000$
69,878,626$ 32,293,965$ 3,038,515$ 99,134,076$ 3,308,515$
2,923,957$ 1,112,823$ 884,083$ 3,152,697$ 1,005,858$ 2,923,957$ 1,112,823$ 884,083$ 3,152,697$ 1,005,858$
72,802,583$ 33,406,788$ 3,922,598$ 102,286,773$ 4,314,373$ Total Long-Term Liabilities
Accrued Compensated AbsencesTotal Other Liabilities
Other Liabilities
Revenue Bonds Unamortized Premiums/ DiscountsTotal Revenue Bonds
Unamortized Premiums/
Total State Institution Bonds
Total Bonds Payable
Long-Term Liabilities
Bonds Payable State Institution Bonds
49

NOTE 12 – DONOR RESTRICTED ENDOWMENTS The College is the recipient of two restricted endowments from the Commission of Higher Education. One is an endowed professorship in the amount of $100,000 with a stipulation that only earnings can be used to fund endowed chairs at the College. At June 30, 2005, net appreciation of $4,745 was available to be spent, of which $4,745 is restricted to specific purposes. The other endowment funded through the South Carolina Research Centers of Economic Excellence Act of 2002 in the amount of $1,000,000 was received this fiscal year through a Memorandum of Understanding between the College and the Medical University of South Carolina (MUSC). The College has joined with MUSC to raise non-state matching funds of $2,000,000 for collaborative research, the Research Center in Applied Marine Genomics. The College has loaned the funds to the College of Charleston Foundation for the specific purpose of maximizing the College’s investment yield. NOTE 13 – COMPONENT UNITS Certain separately chartered legal entities whose activities are related to those of the College exist primarily to provide financial assistance and other support to the College and its educational programs. They include the College of Charleston Foundation and the Cougar Club. Independent auditors retained by the organizations audit the financial statements of these entities. The financial report of the College of Charleston Foundation may be obtained by writing to the Financial Services Office of the College of Charleston Foundation, Wilson-Sottile House, Charleston, South Carolina, 29424. The financial report of the College of Charleston Cougar Club can be obtained by writing to the Finance Director, Cougar Club, 66 George Street, Charleston, South Carolina, 29424. Effective fiscal year June 30, 2004 and as a result of the GASB 39 implementation guidelines, the College began recognizing the College of Charleston Foundation and the Cougar Club as component units and displaying a discrete presentation format of their financial statements. Both entities report under guidelines established by the Financial Accounting Standards Board (FASB). The College of Charleston Foundation is a separately chartered entity, which exists exclusively to benefit the College. Transactions between the College and the Foundation during the year ended June 30, 2005 were as follows:
Foundation for the rental of certain real property (excludes approximately $2,000 forpremiums for insurance coverage on leased properties owned by the Foundation). Theamount is reported as part of operating expense. $730,721
Scholarships awarded by the College and reimbursed by the Foundation. The amount isreported as part of gifts under non-operating revenue. $1,463,567
See Note 9 regarding lease transactions with the Foundation. Also, the Foundationreimbursed the College $1,403,946 for certain expenditures that were paid by the College for the benefit of the Foundation.
Related party receivables as of June 30, 2005, are as follows:
Due from Foundation $1,156,853
Independent auditors examined the financial statements of the Foundation as of December 31, 2004 and for the year then ended. The Cougar Club is a separately chartered corporation organized exclusively to solicit and provide funds to the athletic department in the form of scholarships and general revenues from
50

season ticket sales and fund raising activities. Season basketball tickets are only available through Cougar Club membership. The College received $319,000 from the Cougar Club in fiscal year 2005, primarily for athletic scholarships, which are reported as part of private gifts for auxiliaries in the operating fund, and $79,607 for basketball ticket sales, which is reported as sales and services of Auxiliary Enterprises in operating funds. The financial statements of the Cougar Club as of June 30, 2005 and for the fiscal year then ended were examined by independent auditors. NOTE 14 – RISK MANAGEMENT The College is exposed to various risks of loss and maintains state or commercial insurance coverage for each of these risks. Management believes such coverage is sufficient to preclude any significant uninsured losses for the covered risks. The costs of settled claims and claim losses have not exceeded this coverage in any of the past three years. The College pays insurance premiums to certain other state agencies and commercial insurers to cover risks that may occur in normal operations. The insurers promise to pay to or on behalf of the insured for covered economic losses sustained during the policy period in accordance with the insurance policy and benefit program limits. The State of South Carolina believes it is more economical to manage certain risks internally and set aside assets for claim settlement. Several state funds accumulate assets and the State itself assumes substantially all risks for the following:
1. Claims of State employees for unemployment compensation benefits. (Employment Security Commission);
2. Claims of covered employees for workers’ compensation benefits for job related
illnesses or injuries (State Accident Fund);
3. Claims of covered public employees for health and dental insurance benefits. (Office of Insurance Services); and
4. Claims of covered public employees for long-term disability and group life
insurance benefits. (Office of Insurance Services). Employees elect health coverage through either a health maintenance organization or through the State’s self-insured plan. All of the other types of coverage listed above are through the applicable State’s self-insured plan except dependent and optional life premiums, which are remitted to commercial carriers. The College and other entities pay premiums to the State’s Insurance Reserve Fund (IRF) which issues policies, accumulates assets to cover the risks of loss, and pays claims incurred for covered losses related to the following College assets, activities, and/or events:
1. Theft of, damage to, or destruction of assets;
2. Real property, its contents, and other equipment;
3. Motor vehicles and watercraft (inland marine);
4. Torts;
5. Business interruptions;
6. Natural disasters; and
7. Medical malpractice claims against covered employees.
51

The IRF is a self-insurer and purchases reinsurance to obtain certain services and specialized coverage and to limit losses in certain areas. The IRF rates are determined actuarially. The College obtains coverage through a commercial insurer for employee fidelity bond insurance for all employees for losses arising from theft or misappropriation. NOTE 15 – OPERATING EXPENSES BY FUNCTION Operating expenses by functional classification for the year ended June 30, 2005 are summarized as follows:
ScholarshipsCompensation Supplies and andand Benefits Services Utilities Fellowships Depreciation Total
46,452,986$ 4,774,635$ -$ -$ -$ 51,227,621$ 2,554,354 2,096,240 - - - 4,650,594
568,428 386,746 - - - 955,174 7,839,825 4,182,377 - - - 12,022,202 5,494,183 1,627,549 - - - 7,121,732
7,784,647 13,621,141 2,942,216 - - 24,348,004 8,870,503 2,564,503 - - - 11,435,006
215,228 - - 5,369,381 - 5,584,609 6,066,616 12,916,459 1,706,229 3,398,104 - 24,087,408
- - - - 6,020,110 6,020,110
85,846,770$ 42,169,650$ 4,648,445$ 8,767,485$ 6,020,110$ 147,452,460$
Depreciation and Amortization
Total Operating Expenses
Scholarships and Fellowships (net of discounts and allowances)Auxiliary Enterprises
Student ServicesOperation and Maintenance of PlantInstitutional Support
InstructionResearchPublic ServiceAcademic Support
NOTE 16 – STATE APPROPRIATIONS AND TRANSACTIONS WITH STATE ENTITIES The College is granted an annual appropriation for operating purposes as authorized by the General Assembly of the State of South Carolina. State appropriations are recognized as revenue when received and available. The original appropriation is the College’s base budget amount presented in the General Funds column of Section 5E of the 2004-2005 Appropriation Act.
52

The following is a reconciliation of the original appropriation as enacted by the General Assembly to State appropriations revenue reported in the financial statements for the fiscal year ended June 30, 2005:
27,039,523$
26,564 1,364,521
465,000
28,895,608$ Total non-capital appropriations recorded as current year revenue
From Commission on Higher Education: Academic Endowment
Other - Low Country Graduate Center Mission Resource Requirements (MRR) Appropriation
Non-Capital State Appropriations Current year's appropriations: Original appropriations per Annual Appropriations Act
The College received substantial funding from the Commission on Higher Education (CHE) for scholarships on behalf of students that are accounted for as operating state grants and contracts. Additional amounts received from CHE are accounted for as both operating and non-operating revenues, depending upon the requirement of deliverables with a current or potential future economic value. The College also receives state funds from various other public service projects. Following is a summary of amounts received from state agencies for scholarships, sponsored research and public service projects for the fiscal year ended June 30, 2005:
272,950$ 10,925,977 2,399,685 1,184,836
26,564 22,590
356,605 579,505 87,645
15,856,357$
Access and Equity
LIFE Scholarships Palmetto Scholarships Need-Based Grants
Other Amounts
Received from CHE: Hope Scholarships
Various other CHE amountsReceived from Department of EducationWinthrop UniversityReceived from Various State Agencies
In addition, the College’s revenue reported under “Other Revenues, Expenses, Gains and Losses” lists Capital Improvement Bond proceeds of $1,669,677 of which includes a receivable of $250,000 as of June 30, 2005.
53

NOTE 17 – STATEMENT OF ACTIVITIES The following information is provided for incorporation in the State of South Carolina Comprehensive Annual Financial Report:
2005 2004 Increase/(Decrease)
Charges for services 121,980,781$ 112,186,599$ 9,794,182$ Operating grants and contributions 3,857,976 3,048,497 809,479 Less: Expenses 151,381,694 141,931,441 9,450,253 Net program revenue (expense) (25,542,937)$ (26,696,345)$ 1,153,408$
Transfers: State appropriations 28,895,608$ 27,353,840$ 1,541,768$ Capital improvement bond proceeds 1,669,677$ -$ 1,669,677$
Additions to permanent endowments 1,000,000 8,099,000 (7,099,000) Total transfers 31,565,285$ 35,452,840$ (3,887,555)$ Change in net assets 6,022,348 8,756,495 (2,734,147) Net assets – beginning 117,822,387 109,065,892 8,756,495 Net assets – ending 123,844,735$ 117,822,387$ 6,022,348$
54

COLLEGE OF CHARLESTON COMPREHENSIVE ANNUAL FINANCIAL REPORT
STATISTICAL SECTION

Schedule Of Revenues By Source
2005 2004 2003 2002 2001 2005 2004 2003 2002 2001RevenuesOperating Revenues:Student Tuition and Fees (net of scholarship allowance) 70,209$ 64,585$ 53,187$ 47,825$ $43,771 44.60% 43.58% 38.50% 38.40% 37.40%Federal Grants and Contracts 9,351 9,787 9,597 8,530 7,183 5.94% 6.60% 7.00% 6.80% 6.10%State Grants and Contracts 15,398 14,715 13,311 7,210 8,623 9.78% 9.93% 9.60% 5.80% 7.40%Local Grants and Contracts 23 - - 15 4 0.01% 0.00% 0.00% 0.00% 0.00%Nongovernmental Grants and Contracts 341 283 208 217 418 0.22% 0.19% 0.20% 0.20% 0.40%Sales and Services of Educational and Other Activities 991 1,050 1,025 1,544 1,167 0.63% 0.71% 0.70% 1.20% 1.00%
Sales and Services of Auxiliary Enterprises (net of scholarship allowance) 24,412 20,206 19,157 20,216 19424 15.51% 13.63% 13.90% 16.20% 16.60%Other Operating Revenue 1,255 1,561 1,342 1,111 1,325 0.80% 1.05% 1.00% 0.90% 1.10%Total Operating Revenues 121,980$ 112,187$ 97,827$ 86,668$ 81,915$ 77.49% 75.69% 70.90% 69.50% 70.00%
Non Operating Revenues: State Appropriations 28,896 27,354 29,682 33,027 33,339 18.36% 18.46% 21.50% 26.50% 28.50%Gifts 1,768 1,517 1,739 2,208 1,483 1.12% 1.02% 1.30% 1.80% 1.30%Interest Income 1,503 59 1,579 1,327 353 0.96% 0.04% 1.10% 1.10% 0.30%Other Non Operating Revenues 3,257 7,106 7,239 1,425 -22 2.07% 4.79% 5.20% 1.10% 0.00%Total Non Operating Revenues 35,424$ 36,036$ 40,239$ 37,987$ 35,153$ 22.51% 24.31% 29.10% 30.50% 30.00%
Total Revenues 157,404$ 148,223$ 138,066$ 124,655$ 117,068$ 100.0% 100.0% 100.0% 100.0% 100.0%
2005 2004 2003 2002 2001 2005 2004 2003 2002 2001
Instruction 51,228$ 48,051$ 45,435$ 43,997$ 42,413$ 33.84% 34.45% 33.2% 36.3% 36.40%Research 4,650 4,750 4,356 3,867 3,569 3.07% 3.41% 3.2% 3.2% 3.10%Public Services 955 1,120 1,299 1,180 1,192 0.63% 0.80% 1.0% 1.0% 1.00%Academic Support 12,022 10,123 9,682 9,535 9,226 7.94% 7.26% 7.1% 7.9% 7.90%Student Services 7,122 6,254 6,058 5,752 5,239 4.70% 4.48% 4.4% 4.8% 4.50%Institutional Support 11,435 11,529 11,194 9,506 8,615 7.55% 8.27% 8.2% 7.9% 7.40%Operation and Maintenance of Plant 24,348 22,526 21,001 12,517 12,309 16.08% 16.15% 15.4% 10.3% 10.60%Scholarships and Fellowships 5,585 8,072 9,452 8,456 7,916 3.69% 5.79% 6.9% 7.0% 6.80%Auxiliary Enterprises 24,087 19,321 20,979 21,395 21,723 15.92% 13.85% 15.3% 17.7% 18.70%Interest on Capital Debt 3,929 2,993 2,501 1,144 1,076 2.60% 2.15% 1.8% 0.9% 0.90%Depreciation 6,020 4,727 4,752 3,758 3,188 3.98% 3.39% 3.5% 3.1% 2.70%
Total Expenses 151,381$ 139,466$ 136,709$ 121,107$ 116,465$ 100.0% 100.0% 100.0% 100.0% 100.0%
Source: The Audited Financial Statements of the College of Charleston for the years ended June 30, 2005, 2004, 2003, 2002, and 2001
For the Year Ended June 30,
(amounts expressed in thousands) (percent of total expenses)For the Year Ended June 30,
Expenses:
Schedule Of Expenses By Function
(amounts expressed in thousands) (percent of total revenue)
56

2005 2004 2003 2002 2001 2005 2004 2003 2002 2001Expenses:Operating Expenses:
Compensation & Employee Benefits 85,847$ 80,533$ 76,082$ 71,754$ 68,716$ 56.7% 57.7% 55.7% 59.3% 61.8%Services and Supplies 42,170 37,192 38,871 32,995 27,404 27.8% 26.7% 28.4% 27.2% 24.6%Utilities 4,648 4,105 3,471 2,999 3,428 3.1% 2.9% 2.5% 2.5% 3.1%Depreciation 6,020 4,727 4,752 3,758 3,188 4.0% 3.4% 3.5% 3.1% 2.9%
Scholarships and Fellowships 8,767 9,916 11,032 8,457 7,292 5.8% 7.1% 8.1% 7.0% 6.6%Total Operating Expenses 147,452$ 136,473$ 134,208$ 119,963$ 110,028$ 97.4% 97.8% 98.2% 99.1% 99.0%
Non Operating Expenses:Interest Capital Asset Related Debt 3,929$ 2,993$ 2,501$ 1,144$ 1,076$ 2.6% 2.2% 1.8% 0.9% 1.0%Total Non Operating Expenses 3,929$ 2,993$ 2,501$ 1,144$ 1,076$ 2.6% 2.2% 1.8% 0.9% 1.0%
Total Expenses 151,381$ 139,466$ 136,709$ 121,107$ 111,104$ 100% 100% 100% 100% 100%
Source: The Audited Financial Statements of the College of Charleston for the years ended June 30, 2005, 2004, 2003, 2002, and 2001
Schedule Of Expenses By Use
(amounts expressed in thousands)For the Year Ended June 30,
(percent of total expenses)
Expenses By UseFiscal Year 2005
Compensation & Employee Benefits
56.7%Services and
Supplies27.8%
Interest Capital Asset Related Debt
2.6%
Scholarships and Fellowships
5.8%Depreciation4.0%
Utilities3.1%
57

Schedule of Bond CoverageLast Ten Fiscal Years(amounts in thousands)
Defined NetRevenue Total Revenue
Fiscal Year Available for Available for CoverageEnded June 30, Debt Service Debt Service Principal Interest Total Ratio
2005 7,105$ 7,105$ 2,410$ 2,683$ 5,093$ 1.402004 5,798 5,798 2,050 2,692 4,742 1.222003 2,996 2,996 580 1,976 2,556 1.172002 1,830 1,830 865 822 1,687 1.082001 2,425 2,425 825 865 1,690 1.442000 2,363 2,363 785 907 1,692 1.401999 2,814 2,814 750 954 1,704 1.651998 2,211 2,211 715 982 1,697 1.301997 2,414 2,414 685 1,015 1,700 1.421996 2,081 2,081 655 1,048 1,703 1.22
2005 1,205$ 1,205$ 225$ 254$ 479$ 2.522004 3,553 3,553 220 265 485 7.33
Source: College of Charleston Controller's Office
Debt Service Payment Requirements
State Institutional Bonds
Revenue Bonds
58

20042003
20022001
20001999
19981997
19961995
Undergraduate
Graduate
1.7 1.7 1.71.7 1.4
22.1
1.7 22
9.9 10 9.9
9.9 9.8 9.89.5
9.3 9.1
8.6
0
1 2
3
4 5
6 7
8
9
10
Thousands
College of CharlestonStudent Head Count
For The Last 10 Years
Undergraduate Graduate
Source: College of Charleston Office of Institutional Research and Planning
59

20042003
2002 2001
20001999
19981997
19961995
Undergraduate
Graduate
0.60.5
0.5 0.60.5 0.6 0.7
0.6 0.70.6
9.3 9.49.2 9.2 9.1 9
8.78.5 8.3
7.9
0
1
2
3
4
5
6
7
8
9
10
Thousands
College of CharlestonStudent Full Time Equivalent
For The Last 10 Years
Undergraduate Graduate
Source: College of Charleston Office of Institutional Research and Planning
60

20042003
20022001
20001999
19981997
19961995
Normal Capacity
Actual Capacity
2.8
2.62.5
2 2.12.1
2 2 2.1 2.1
2.8
2.62.6
22
1.9 1.91.9 1.9
1.9
0
0.5
1
1.5
2
2.5
3
Thou
sand
sCollege of Charleston
Fall Residence Hall OccupancyFor The Last 10 Years
Normal Capacity Actual Capacity
Source: College of Charleston Office of Institutional Research and Planning/Dean of Residence Life
61

College of CharlestonAverage Combined SAT Scores
For The Last 10 Years
11171121 1133 1139 1146
1159 1163
11851206 1208
1015 1013 1016 1017 1016 1016 1020 1020 1026 1026
954 954 953 951 954 954974
981 989 986
800
850
900
950
1000
1050
1100
1150
1200
1250
1995 1996 1997 1998 1999 2000 2001 2002 2003 2004
College of Charleston National High School SC High School
Source: College of Charleston Office of Admissions
62

COLLEGE OF CHARLESTONFALL ROSTER FACULTYRANK, TENURE, AND TERMINAL DEGREESLAST TEN YEARS
Year Ended Associate Assistant TerminalJune 30, Professors Professors Professors Instructors Total Degrees (1) Tenure (2)
2004 115 153 174 61 503 85% 60%
2003 116 148 166 61 491 86% 59%
2002 111 143 154 59 467 85% 58%
2001 105 136 157 64 462 82% 60%
2000 107 137 151 61 456 85% 61%
1999 108 126 149 56 439 83% 63%
1998 100 111 143 66 420 82% 64%
1997 101 101 143 54 399 82% 65%
1996 96 93 147 52 388 82% 61%
1995 89 91 144 38 362 85% 64%
(1) Includes visiting faculty occupying a state position and roster faculty on sabbatical or leave. Excludes administrators and deans holding faculty rank.
(2) Includes roster faculty on sabbatical or leave. Excludes both visiting faculty occupying a state position and administrators holding faculty rank.
Source: College of Charleston Office of Institutional Research and Planning
Percent with
63

COLLEGE OF CHARLESTONSTUDENT AND FACULTY FULL TIME EQUIVALENTSFALL 2004
Student/ Student/FTE IFTE Faculty FTE IFTE Faculty
AREA Students Faculty Ratio Students Faculty Ratio
Biological Science 609.07 40.1 15.19 22.58 3.52 6.41Business and Management 1,000.20 41.38 24.17 25.75 1.25 20.60Computer Science 127.47 10.8 11.80 6.5 0.67 9.70Education 669.4 41.57 16.10 400.58 27.36 14.64Student Teaching 33.6 2.31 14.55 20.25 1.49 13.59Fine Arts 940 64.5 14.57Foreign Languages 1,118.20 74.55 15.00 11.25 1.56 7.21English 1,022.13 64.95 15.74 18.75 1.53 12.25Environmental Studies 6 0.5 12.00 56.92 5.63 10.11Philosophy and Religion 315.2 12.85 24.53Library 4.53 0.51 8.88Mathematics 690.93 26.05 26.52 14.58 1.24 11.76Physical Science 704.14 50.08 14.06Psychology 460.4 23.26 19.79Public Administration 36.25 2.73 13.28Science and Math for Teachers 10.17 1.9 5.35Social Sciences 1,210.80 52.94 22.87 16.67 2.12 7.86Interdisciplinary 391.47 26.61 14.71 4.25 0.25 17.00
Totals 9,303.54 532.96 17.46 644.50 51.25 12.58
College Totals 9,948.04 584.21 17.03
NOTE: Student Full Time Equivalents (FTE) is the calculation based on student credit hours where an undergraduate FTE is the total number of student credit hours generated by undergraduate courses divided by 15, and the graduate FTE is the number of student credit hours generated by Graduate Courses divided by 12.
Instructional Full Time Equivalents (FTE) is an external reporting standard measuring the amount of faculty time used for instructional activity. Contact hours are the basis for calculation; in general, 12 contact courses equal 1 FTE.
Source: College of Charleston Office of Institutional Research and Planning
UNDERGRADUATE GRADUATE
64

COLLEGE OF CHARLESTONACADEMIC SUBJECT AREAS AND DEGREES OFFEREDFall 2005
Accounting A.B., B.S. History A.B., B.A.Anthropology A.B., B.S. Hospitality and Tourism Management A.B., B.S.Art History A.B., B.A. International Business A.B., B.S.Arts Management A.B., B.A. Latin American and Caribbean Studies A.B., B.A.Athletic Training A.B., B.S. Marine Biology A.B.,B.S.Biochemistry A.B., B.S. Mathematics A.B., B.S.Biology A.B., B.A., B.S. Middle Level Education A.B., B.S.Business Administration A.B., B.S. Music A.B., B.A.Chemistry A.B., B.A., B.S. Philosophy A.B., B.A.Classical Studies A.B., B.A. Physical Education and Health A.B., B.S.Communications A.B., B.A. Physics A.B., B.A., B.S.Computer Science A.B., B.A., B.S. Political Science A.B., B.A.Computer Information Systems A.B., B.S. Psychology A.B., B.S.Discovery Informatics A.B., B.S. Religious Studies A.B., B.A.Early Childhood Education A.B., B.S. Sociology A.B., B.S.Economics A.B., B.S. Spanish A.B., B.A.Elementary Education A.B., B.S. Special Education A.B., B.S.English A.B., B.A. Studio Arts A.B., B.A.French A.B., B.A. Theatre A.B., B.A.Geology A.B., B.A., B.S. Urban Studies A.B., B.A.German A.B., B.A. Bachelor of Science - Denistry Emphasis B.S.D.Historic Preservation and Bachelor of Science - Medicine Emphasis B.S.M. Community Planning A.B., B.A.
Accounting M.S. Environmental Studies M.S.Bilingual Legal Interpreting M.A., CER Historic Preservation M.S.Organizational and Corporate History M.A. Communication CER Languages M.E.D.
Marine Biology M.S. Sciences M.S. Mathematics M.S., CEREarly Childhood Education M.ED., M.A.T. Middle Level Education M.E.D.Elementary Education M.ED., M.A.T. Public Administration M.P.A.English M.A. Science and Math for Teachers M.ED.English to Speakers of Other Special Education M.ED., M.A.T. Languages CER
A.B. - Artium Baccalaureatus (Classical Studies) M.A.T. - Master of Arts in TeachingB.A. - Bachelor of Arts M.ED. - Master of EducationB.S. - Bachelor of Science M.P.A. - Master of Public AdministrationCER - Master's Certificate M.S. - Master of ScienceM.A. - Master of Arts
UNDERGRADUATE
GRADUATE
Computer and Information
Source: College of Charleston Office of Institutional Research and Planning
65