college as a job advancement strategy: final report on the
TRANSCRIPT

College as a Job Advancement Strategy: Final Report on the New Visions Self-Sufficiency and Lifelong Learning Project
January 2006
Prepared for Riverside Community College 4800 Magnolia Avenue Riverside, California 92506
Prepared by David J. Fein Erik Beecroft
Abt Associates Inc. Suite 800 North 4550 Montgomery Lane Bethesda, MD 20814-5341
www.abtassoc.com


Contents
Acknowledgements ........................................................................................................................ v
Executive Summary .................................................................................................................... viiThe New Visions Program................................................................................................. viiiEvaluation Design................................................................................................................ ixImplementing New Visions ................................................................................................. ixParticipants’ Experiences in New Visions ........................................................................... xiImpacts on Educational and Economic Outcomes.............................................................. xiiConclusions......................................................................................................................... xv
Chapter 1 Introduction .............................................................................................................. 11.1 Research and Policy Background ............................................................................... 11.2 Context for the New Visions Demonstration ............................................................. 61.3 The New Visions Demonstration ............................................................................... 91.4 Implementing New Visions: Recap from Previous Reports..................................... 17
Chapter 2 Educational Experiences of New Visions Volunteers.......................................... 232.1 Marketing New Visions to Welfare Recipients ........................................................ 232.2 Characteristics of TANF Recipients Who Volunteered for New Visions ................ 282.3 Factors Associated with Core Program Completion ................................................ 332.4 Experiences in the Core Program ............................................................................. 432.5 Education and Training after the New Visions Core Program ................................. 442.6 Conclusions .............................................................................................................. 50
Chapter 3 New Visions’ Educational and Economic Impacts .............................................. 533.1 Approach .................................................................................................................. 533.2 Impacts on GAIN Education and Training (E&T) Participation.............................. 563.3 Impacts on Regular College Enrollment and Certificate and Degree Completion.......603.4 Impacts on Employment and Earnings ..................................................................... 643.5 Impacts on TANF Payments and Receipt................................................................. 693.6 Subgroup Impacts ..................................................................................................... 713.7 Conclusions .............................................................................................................. 77
References .................................................................................................................................... 79
Appendix: Quarterly Impact Estimate Detail........................................................................... 83
Abt Associates Inc. Contents i

List of Exhibits
ES.1 Summary of New Visions’ Impacts on Educational and Economic Outcomes ........xiii ES.2 New Visions’ Impacts on Educational and Economic Outcomes by Follow-up
Quarter.........................................................................................................................ixExhibit 1.1 The New Visions Program Model .............................................................................10 Exhibit 2.1 Percent In and Planning to Go to Education and Training (E&T) by Hours Worked:
GAIN Recipients Eligible for New Visions ...............................................................23 Exhibit 2.2 Reasons for not Being Able to Go to School: New Visions-Eligible GAIN
Recipients not in E&T Who Indicated That They Were Interested in School ...........24 Exhibit 2.3 Reasons for not Volunteering for New Visions, by Whether Respondents Said That
They Were or Were not Interested in the Program.....................................................25 Exhibit 2.4 Characteristics of New Visions Sample at the Time of Random Assignment ...........28 Exhibit 2.5 Percent of New Visions Volunteers by Initial Math and Language Skill Levels.......30 Exhibit 2.6 Initial Math, English, and Reading Scores of New Visions Volunteers Compared
with Other CalWORKS Students and non-CatWORKS Students at RCC ................32 Exhibit 2.7 Number of New Visions Credits Earned by Program Completion Status..................33 Exhibit 2.8 Associations between New Visions Core Program Completion and Varying
Personal Characteristics: Treatment Group...............................................................35 Exhibit 2.9 Percent Participating in New Visions and Any GAIN E&T Activity in Months
Treatment Group Members Were on TANF, by Hours Worked per Month ..............38 Exhibit 2.10 Reasons for No-Shows and Drop-Outs Established by New Visions Counselors .....40 Exhibit 2.11 Education and Training Experiences of Treatment Group Members after Leaving
the New Visions Core Program (Summarized over Follow-Up Years 1-3)...............43 Exhibit 2.12 Areas of Study after Graduates Finished the New Visions Core Program.................45 Exhibit 2.13 Associations between Earning One or More Post-New Visions RCC Credit and
Varying Personal Characteristics: Treatment Group.................................................46 Exhibit 2.14 Reasons for not Enrolling in College after Completing the New Visions Core
Program, as Ascertained by New Visions Counselors ...............................................47 Exhibit 3.1 Impacts on Education and Training Follow-Up Years 1-3, Full Sample ...................55 Exhibit 3.2 Non-New Visions Course Enrollments: Percentage Distribution by Field of Study
and Treatment-Control Status ....................................................................................57 Exhibit 3.3 Participation in Any E & T Activity, by Follow-Up Quarter and T/C Status ............59 Exhibit 3.4 Impacts on Enrollment in Non-New Visions Courses at RCC and at Community
Colleges Statewide over Follow-Up Years 1-3, Full Sample.....................................60 Exhibit 3.5 Enrolled in a Non-New Visions Course at RCC, by Follow-Up Quarter and T/C
Status ..........................................................................................................................61 Exhibit 3.6 Impacts on Earnings, Employment, TANF Payments, and TANF Receipt
Follow-Up Years 1-3, Full Sample ............................................................................63 Exhibit 3.7 Earnings and Employment Full Sample and Early Cohort by Follow-Up Quarter
and T/C Status ............................................................................................................64
Abt Associates Inc. List of Exhibits iii

Exhibit 3.8 Percent with Job Changes Recorded in DPSS Automated System after RandomAssignment and Non-Experimental Comparison of Wages, Occupations, and Employers for Job Changers, by Treatment-Control Status ...................................... 66
Exhibit 3.9 TANF Payments and Receipt Full Sample and Early Cohort by Follow-Up Quarter and T/C Status............................................................................................................ 68
Exhibit 3.10 Impacts on Various Outcomes by Subgroup ............................................................. 72 Exhibit A.1 Percent Participating in Any GAIN E&T Activity by Follow-Up Quarter and T/C
Status.......................................................................................................................... 81 Exhibit A.2 Percent Enrolled in a Non-New Visions Course at RCC by Follow-Up Quarter and
T/C Status .................................................................................................................. 82 Exhibit A.3 Average Earnings and Percent Employed by Follow-Up Quarter and T/C Status .... 83 Exhibit A.4 Average TANF Payments and Receipt by Follow-Up Quarter and T/C Status......... 84
List of Exhibits Abt Associates Inc. iv

Acknowledgements
The New Visions demonstration has benefited from an unusually strong dedication to evaluation on the part of the leadership and staff at Riverside Community College (RCC) and Riverside County’s Department of Public Social Services (DPSS).
At RCC, the authors would like to thank the following former and current administrators and staff for their strong support of, and participation in, the evaluation: Greg Aycock, Shelagh Camak, Sandy Foster, Colleen Molko, Sal Rotella, David Torres, and Joan Wells. We are grateful also to the RCC instructors and staff who participated in interviews and helped with data collection for the study. We owe a special debt to the New Visions students who shared their experiences with us in interviews.
Current and former DPSS administrators and staff also provided superb support for this evaluation. We would like to thank in particular Stephanie Beckett, Dennis Boyle, Cynthia Hinckley, Nancy Presser, Ron Quinn, John Rodgers, and Jeremy Samsky. We also thank the DPSS case managers and other staff who helped to implement random assignment and collect data for the project.
For financial support, we are grateful to the Administration for Children and Families, Office of Policy Research and Evaluation at the U.S. Department of Health and Human Services. We thank especially ACF’s Lenny Sternbach and Nancye Campbell, for their guidance and support throughout the demonstration, and Peter Germanis, for his comments on an earlier draft of this report.
Judy Reichle, formerly of the California Chancellor for Community College’s Office, and her staff were very helpful in providing statewide data on community college enrollment and arranging a stimulating discussion with the CCCCO’s advisory group. Max Elsman of Cygnet Associates deserves kudos for his role in formulating a New Visions marketing strategy.
Finally, we would like to acknowledge the fine contributions of a variety of wonderful former and current Abt Associates staff. Particularly deserving of our appreciation are: Juliana Horowitz, Wang Lee, and Ozan Jaquette for assistance with data analyses; Anne Robertson, David Long, and Jesse Valente for contributions to fieldwork and earlier project reports; Denise Young for help preparing this document; and Judy Alamprese and Chris Hamilton for valuable comments on an earlier draft of this report.
Abt Associates Inc. List of Exhibits v


Executive Summary
Welfare reforms of the 1990s moved thousands of single parents off the welfare rolls and into jobs. Their economic status nonetheless has remained fragile, as most of these jobs provided low wages, few benefits, and little opportunity for advancement. A major obstacle to better jobs has been that most of this population lacks the education and skills needed for economic advancement.
In response, researchers and practitioners have renewed the search for effective education and training (E&T) strategies for welfare recipients and other low-income adults. Building on studies of past E&T programs, reformers are focusing particularly on emerging innovations that address weaknesses in traditional instruction and help students balance school with work and family responsibilities.
Community colleges have become active laboratories for designing and testing these new approaches. One series of innovations has entailed building “bridge programs” to prepare disadvantaged adults to succeed in college. Another approach has been to restructure regular college classes to make it easier for students to balance school, work, and family responsibilities.
In August 1998, two agencies in Riverside County California launched a model program that combined both approaches—the New Visions Self-Sufficiency and Lifelong Learning Project. Riverside Community College (RCC) designed and operated this program in partnership with the county’s Department of Public Social Services (DPSS).
New Visions tested the thesis that success in college and success at work require similar skills and that these skills can be imparted to welfare recipients in a single program. The program provided 24 weeks of preparatory studies at RCC, followed by short sequences of regular college courses providing training for a specific job. New Visions participants attended classes for 12 hours a week, in addition to working at least 20 hours a week in an unsubsidized job.
Believing that the project had substantial demonstration value, the partners developed a random assignment evaluation to test New Visions. They engaged Abt Associates Inc. as the third-party evaluator and secured funding from the federal Administration for Children and Families to support the evaluation. New Visions is the first community college bridge program to be evaluated using random assignment, considered to be the gold standard methodology in evaluation research.
Two previous evaluation reports provided early and interim evaluation findings.1 Here, we provide final findings on the New Visions project.
Fein, D.J; Beecroft, E.; Long, D.A.; & Catalfamo, A.R. (2000). College as a Job Advancement Strategy: An Early Report on the New Visions Self-Sufficiency and Lifelong Learning Project. Bethesda, MD: Abt Associates Inc. and Fein, D.J.; Beecroft, E.; Long, D.A.; & Robertson, A. (2003). College as a Job Advancement Strategy: An Interim Report on the New Visions Self-Sufficiency and Lifelong Learning Project. Bethesda, MD: Abt Associates Inc.
Abt Associates Inc. Executive Summary vii
1

The New Visions Program
New Visions fits into a tradition of experimentation with innovative welfare reform approaches in Riverside County. In the early 1990s, the county’s work-oriented GAIN program attracted wide attention when a random assignment evaluation found that it had positive impacts on employment and earnings. In the late 1990s, the county launched a second wave of reform—this time adding a substantial emphasis on job retention and advancement to its core work attachment services.
The second reform, which continues to this day, embodies a three-phase design. In Phase 1, DPSS employment service counselors help clients find unsubsidized jobs providing at least 20 hours of work per week. After clients achieve stable employment, special Phase 2 case managers encourage them to enroll in one of a variety of E&T programs in the community. Consistent with TANF policies, clients must spend a total of at least 32 hours per week (35 hours for two-parent cases) in work and training activities. In Phase 3, the program offers extended services to support job retention and advancement after clients leave the welfare rolls.
New Visions was a specially-designed Phase 2 program for recipients with a high school diploma or equivalent preparation. Operated by RCC, the program had its own classroom, offices, and computer laboratory on the college’s main Riverside City campus. New Visions was funded partly through a special CalWORKS program for California community colleges and partly through general RCC funds.2
New Visions’ goals were to prepare welfare recipients for community college occupational training programs, foster lifelong learning, and promote job advancement. Following a one-week orientation session, New Visions participants entered a 24-week core program of academic instruction and career guidance. The program included college preparatory classes in math, English, reading, office-related computer software, and guidance. Academic instruction relied heavily on applied learning and hands-on assignments drawn from work situations (e.g., math problems arising in varying occupations, resume and cover letter preparation) and other areas of daily living (e.g., interest on loans, income taxes). The guidance class concentrated on critical thinking, problem-solving, communication and study skills needed for success at college, work, and home.
The core program design responded to the special needs of low-income adult students in several ways. It offered a flexible schedule and individualized instruction delivered in a group setting. New Visions offered classes four days a week, in three-hour time blocks that repeated three times daily to suit varying work, child care, and transportation needs. Small class sizes (typically no more than 10) allowed instructors to work with students on an individual basis. Lessons and assignments were structured so that students could move through the curriculum at their own pace. Courses were divided into three six-week segments, each providing one unit of credit, to reward progress and make it easier for dropouts to re-enroll in the program. All credits appeared on students’ RCC transcripts, although only the four guidance course units were degree-applicable.
CalWORKS—The California Work Opportunity and Responsibility to Kids program—is California’s TANF program. In creating CalWORKS in 1997, the state legislature allocated $81 million to the California Community Colleges Chancellor’s Office (CCCCO) to establish community college programs specifically for welfare recipients and former recipients. Funds are distributed to local college districts and can be used to redesign curricula and provide services such as child care, work study jobs, job development and placement, and coordination with welfare and other local service agencies.
Executive Summary Abt Associates Inc. viii
2

After the 24-week core program, New Visions sought to move participants into “occupational mini-programs” at RCC. These programs consisted of identified sequences of courses in the regular RCC curriculum normally requiring four-to-seven months of part-time study. The mini-programs were designed to train students for entry-level jobs in their chosen occupations. Credits for completed courses also were applicable towards state-recognized certificate programs and Associate’s and Bachelor’s degrees.
The assumption behind breaking up longer programs into shorter modules was that working parents would find it more feasible to combine work and school if they could take breaks between spells of training. The mini-programs also fit within DPSS’ Phase 2 training philosophy, which emphasized short-term programs training for specific jobs. Unlike the New Visions core program, RCC mini-programs were open to any college student.
Evaluation Design
The New Visions evaluation used an experimental design to measure impacts on educational attainment and economic well-being. For this design, RCC and DPSS randomly assigned 1,043 volunteers to a treatment group that was allowed to participate in New Visions or to a control group that was not allowed to participate. Control group members were allowed—indeed, encouraged—to participate in other vocational programs offered through the DPSS Phase 2 program, including taking other (non-New Visions) courses at RCC. Impact estimates thus represent the incremental effects of offering customized services designed to engage working single parents in community college, compared with other E&T services offered through DPSS. The experiment measured impacts on community college attainment, participation in other E&T activities, earnings, and TANF benefits. The analysis used data from management information systems maintained by RCC, the California Community Colleges Chancellor’s Office, DPSS, and the California Employment Development Department.
Two additional study components provided information helpful in understanding the impact findings. The New Visions implementation study documented the way the program was translated from its initial blueprint to an operating program. Discrepancies between the initial vision and actual program help to illuminate whether impacts reflect the effects of a fully, or only partially, realized design. The implementation findings also offer insights into some of the challenges other localities may encounter in developing college bridge programs for welfare recipients. The evaluation’s process study traced participants’ experiences with New Visions, from initial decisions to volunteer to the circumstances affecting continuing college after the New Visions core program. As events unfolded, it became clear that the opportunity to study these experiences would be one of the most valuable aspects of the evaluation.
Implementing New Visions
There were three major requirements for successfully implementing New Visions. One challenge was to recruit a sufficient number of volunteers. A second need was to develop a strong core program of instruction, counseling and other services. The third requirement was to create the occupational mini-programs and establish strong linkages between them and the core program.
Abt Associates Inc. Executive Summary ix

Meeting the evaluation’s sample requirement of 1,000 subjects (treatment and control combined) proved to be much more difficult than developers originally had envisioned. The program’s eligibility requirements and geographic restrictions limited the recruitment pool to a small slice (under ten percent) of the county’s welfare caseload, and recruiters faced growing competition from other Phase 2 providers. Past academic difficulties and work and family responsibilities left many eligible recipients skeptical about their ability to handle college.
RCC staff and DPSS case managers devoted extraordinary effort to recruitment and, in the process, learned a great deal about marketing programs like New Visions. In interviews, RCC staff emphasized the importance of alternating outreach methods; of emphasizing concrete, short-run benefits; and of providing testimonials from actual participants. Techniques used included presentations at welfare offices, on-campus picnics, ads in local media and public spaces, use of New Visions students as recruiters, offering work study positions, and seeking advice from an expert consultant. The consultant advised that communications should put the main emphasis on how new skills could be immediately useful at work, and pitch longer-term college and career development opportunities as secondary benefits.
New Visions staff designed a solid core curriculum and hired a group of instructors who were committed and skillful in working with the target population. Faculty sought to weave “soft skills”— such as communication, time management, and persistence—into their lectures, exercises, discussions, and homework. For example, the English instructor arranged role plays to practice using appropriate grammar and vocabulary in speaking with customers and supervisors at work.
The arrival of a new cohort every six weeks meant that students entered essentially sequential courses at varying points in the 24-week core program. Instructors used a variety of techniques to minimize difficulties associated with missing earlier classes. These techniques included designing courses so that each module could stand on its own better, devoting class time to review, working with individuals and small groups of students, and creating opportunities for self-paced work. Slow recruitment had a silver lining in that small class sizes—typically under ten students—made it much easier to implement such measures.
Both before and after classes started, New Visions struggled to retain volunteers in the program. Counselors tried to maintain contact by telephone during the up-to-six-week period between the time that each recruit volunteered for New Visions and the time the next cohort was scheduled to start the program. During the core program, counselors combined occasional formal meetings with informal personal contacts to try to anticipate and help with difficulties that might jeopardize attendance. When students dropped out, counselors contacted them by phone to offer assistance and encouragement in returning.
Although counselors put substantial time into helping students plan their careers—and particularly their further studies—New Visions did not attempt to develop strong linkages to employers. The program encouraged some participants to apply for internships with a local bank, but otherwise mainly relied on the welfare agency for job development and placement services.
Occupational mini-programs developed more slowly than originally envisioned. For the most part, the mini-programs took the form of short sequences of existing courses, rather than of new courses. The sequences were created to prepare students for entry-level jobs in fields such as medical transcription, cardiac monitor technician, pre-school teacher’s aide, and administrative assistant.
Executive Summary Abt Associates Inc. x

Whereas post-core training through occupational mini-programs was an integral part of the original New Vision design, the implemented program mostly ended with graduation from the core program. New Visions counselors periodically contacted graduates to offer continuing services to help those continuing in school to succeed and to encourage those not continuing to resume their studies. Continuing students also remained eligible for other special services provided under CalWORKS, including counseling and help with tuition and school materials.
Successful implementation of bridge programs for welfare recipients requires extensive collaboration between welfare agencies and community colleges, particularly on recruitment. New Visions was fortunate to have strong support from both the director of DPSS and president of RCC, who jointly conceived the program. Senior and mid-level administrative staff at both agencies also worked together closely from the beginning. The partnership was tested on several occasions as staff dealt with differences in organizational philosophies and perceived responsibilities. Working relationships between front-line staff took some time to gel, partly because it took some time for the two agencies to hire their full staff complements. Senior staff bolstered inter-agency working relationships by organizing staff meetings, by encouraging visits and briefings, and by out-stationing a DPSS case manager at New Visions. The eventual outcome was exceptionally strong day-to-day coordination and mutual reinforcement in arranging needed services, responding to problems at work, and encouraging clients to continue in school.
Participants’ Experiences in New Visions
The New Visions process study found welfare recipients to be very interested and engaged in education and training. A survey of TANF recipients eligible for New Visions found high educational aspirations and substantial participation in Phase 2 programs. A fairly high fraction of respondents (27 percent) reported volunteering for New Visions. This finding implies that the program’s intensive marketing efforts ultimately paid off and suggests that the greatest single obstacle to meeting recruitment targets was the small fraction of welfare recipients who were eligible for New Visions.
Engaging New Visions volunteers in the program proved to be difficult. Only 62 percent of volunteers ever showed up for the program, and only 44 percent of these (27 percent of all volunteers) completed the core program. Conflicts with work represented the largest single category of reasons for attrition. Participants who worked 30 or more hours a week were substantially less likely to finish the New Visions core program than those who worked 20-29 hours. A wide range of other challenges arose as well, including personal and family illnesses and emergencies; changes in educational program preferences; and loss of eligibility resulting from changes in work hours, TANF exits, and moves out of the area.
The substantial drop-out rate is sobering given the high quality of supports and instruction in the core program. New Visions offered intensive personal guidance and counseling and a supportive learning community. Participants consistently praised the environment and quality of instruction.
Although nearly all demonstration participants had a high school diploma or equivalent certificate, volunteers who came to the program had very low academic skill levels. Seventy (70) percent of treatment group members who came in for New Visions orientation scored below the seventh grade level in math, and half scored below this level in language, on the Test of Adult Basic Education.
Abt Associates Inc. Executive Summary xi
The high quality of instruction is evidenced also by the finding that math and language skills increased by over a grade among participants who did finish the core program. Even still, the fractions of completers who had reached the 10th-grade threshold for math and language skills (18 and 34 percent, respectively) were fairly low. It thus is notable that 67 percent enrolled in regular RCC courses and 41 percent accumulated six or more regular credits in the three years after random assignment (implying some credits beyond the four-credit New Visions guidance course). A substantial fraction of completers (28 percent) also opted to go to E&T programs other than RCC.
Two-thirds of core program completers enrolled in at least one more course at RCC. Analyses of subsequent college activity showed that competition from work continued to be the largest source of difficulties in staying in school. Other factors that were related positively to continuing in college included motivation (expressed college ambitions), prior college experience, academic skills, and remaining on TANF for a longer period after random assignment.
Impacts on Educational and Economic Outcomes
By preparing students to take short sequences of occupationally-focused courses, New Visions was designed to lead to more steps onto career ladders and thereby to higher earnings and reduced welfare dependency. The New Visions core program lasted 24 weeks, and subsequent mini-programs typically lasted four-to-seven months. Thus, if the program was working as intended, we would expect to see positive impacts on college enrollment and credits during the first year or two after random assignment and positive impacts on earnings soon thereafter.
In the short run, program designers recognized that increased time devoted to school might reduce work hours and increase welfare payments. At the same time, the program sought to promote short-term gains in job retention and advancement by teaching soft skills in the core program.
Findings from the impact analysis suggest that New Visions did not have the positive effects its designers had envisioned. Compared with a randomly-assigned control group, treatment group members were slightly (six percentage points) more likely to enroll in regular (non-New Visions) courses at RCC but no more likely to accumulate regular college credits (see Exhibit ES.1). Limiting analyses to treatment group members who initially showed up for the New Visions program had little effect on the findings (see last column of exhibit).
On average, members of the treatment group spent two more months in GAIN E&T activities than the control group (Exhibit ES.1, fifth row). This additional E&T was due to entirely to the additional time the former spent in the New Visions core program early in the follow-up period. Control group members were more likely than treatment group members to attend other (non-New Visions) E&T activities (not shown in exhibit).
Executive Summary Abt Associates Inc. xii

Exhibit ES.1 Summary of New Visions’ Impacts on Educational and Economic Outcomes
Impact Adjusted for
No-Shows Treatment
Group Control GroupOutcome Impact
Percent Ever Enrolled in a non-New Visions Course at:
RCC 33.7 27.6 6.1** 9.8 Any CA community college 36.0 30.7 5.3** 5.5
Avg. RCC Credits Earned All types 7.3 2.6 4.7** 7.5 Non-New Visions credits 3.3 2.6 .7 1.2
Avg. Months of GAIN E&T 6.4 4.5 1.9*** 3.0 Avg. Total Earnings ($) 17,244 19,545 -2,301** -3,701 Avg. Quarterly Employment Rate 65.9 68.3 -2.4 -3.9 Avg. Total TANF Payments ($) 7,800 6,856 945** 1,520 Avg. Quarterly TANF Receipt Rate 55.5 52.0 3.7 5.9
Sample Size 528 515
Notes: Earnings and employment outcomes cover a two-and-a-half-year follow-up period. All other outcomes are for a three-year follow-up period. A two-tailed test was applied to regression-adjusted impact estimates. Statistical significance levels are indicated as: * = 10 percent, ** = 5 percent, and *** = 1 percent.
Source: RCC records, UI quarterly earnings records, DPSS GEARS and TANF administrative records.
Treatment group members’ earnings averaged $2,301 below those of control group members over a two-and-a-half year follow-up period, representing a 12-percent proportionate impact (Exhibit ES.1, sixth row).3 The proportionate effect on average quarterly employment rates was comparatively small (four percent), suggesting that the negative earnings impact arose from fewer hours worked or from lower wages, rather than from lower employment rates. Non-experimental analyses of DPSS data on work hours and wages suggest that the principal mechanism was reduced work hours. Because they had less earnings income to be subtracted in grant calculations, average TANF payments to treatment group members were $945 higher than average payments to control group members.
There was little indication that impacts were trending more favorably by the end of the follow-up period. Positive impacts on enrollments in regular RCC classes disappeared after the fifth follow-up quarter, and positive impacts on any GAIN E&T activity vanished after the second follow-up quarter (see Exhibit ES.2, top panel). In contrast, negative earnings impacts grew in the second year and remained sizeable by the middle of the third year (Exhibit ES.2, bottom panel). Positive TANF payment impacts also grew in the second and third follow-up years.
The maximum follow-up period for earnings and employment impacts is two quarters shorter than for other impacts due to reporting lags in the state Unemployment Insurance wage data system on which these analyses are based.
Abt Associates Inc. Executive Summary xiii
3

Exhibit ES.2 New Visions’ Impacts on Educational and Economic Outcomes by Follow-up Quarter
-10
-5
0
5
10
15
20
25
30
35
40
Q0 Q1 Q2 Q3 Q4 Q5 Q6 Q7 Q8 Q9 Q10 Q11 Q12
Quarter after random assignment
Perc
ent i
n A
ctiv
ity (T
reat
men
t-C
ontr
ol D
iffer
ence
)
Any GAIN E&T Activity Non-New Visions Course at RCC
-500
-400
-300
-200
-100
0
100
200
Q0 Q1 Q2 Q3 Q4 Q5 Q6 Q7 Q8 Q9 Q10 Q11 Q12
Quarter after random assignment
Dol
lars
(Tre
atm
ent-C
ontr
ol D
iffer
ence
)
Average Total TANF Payments
Average Total Earnings
Sources: See Appendix Exhibits A.1-A.4
Executive Summary Abt Associates Inc. xiv

Longer-term analyses for a group of early enrollees showed that the unfavorable earnings and TANF impacts disappeared in the fourth year, but there were no signs that favorable impacts were emerging (not shown in exhibit).
There was some variability in impacts across subgroups.4 In general, positive impacts on non-New Visions RCC enrollments were somewhat larger for subgroups where treatment group members were most likely to complete the New Visions core program. Groups with higher RCC enrollment impacts sometimes did, and sometimes did not, show more unfavorable earnings impacts—providing little consistent indication that participants were shifting time to school from work.
Indeed, for the one characteristic where differences in earnings impacts were statistically significant—recent work experience—there was no correspondence. Negative earnings impacts were largest among sample members with the most work experience, and yet this group did not evidence a positive impact on post-New Visions RCC enrollment. This finding raises the possibility that New Visions led some participants to step down from relatively high levels of employment activity without providing them the means to subsequently step back up to better-quality jobs.
It is important to recall that impacts represent the relative effectiveness of two sets of E&T services. The experiment compared TANF recipients who had the opportunity to participate in New Visions with a control group that was not allowed to participate in New Visions but was encouraged to participate in other E&T activities—including regular courses at RCC—and, in fact, did participate actively in other activities.
In such a design, negative earnings impacts could have two possible explanations. One is that both sets of services were helpful (compared with no services), but that New Visions was less helpful than other E&T services. Another is that New Visions was unhelpful in the absolute sense—possibly even leaving participants worse off than they would have been had they received no E&T services through DPSS. The evaluation design does not allow us to say which of these two explanations is correct.
Conclusions
New Visions was in many ways an exemplary college bridge program. It embodied state-of-the art instructional innovations in its core courses, provided intensive counseling and supportive services, and created a highly supportive learning community.
The program nonetheless did not generate the positive impacts its designers had sought. Experimental impact estimates show that New Visions had no statistically significant effects on the accumulation of regular college credits or on participation in education and training activities other than the core program. The average treatment group member earned less, and received more welfare benefits, than her control group counterpart.
In assessing the results, an important question is whether they reflect mainly deficiencies in the program’s basic design or weaknesses in its implementation. We cannot answer this question with
We assessed differences in impacts for six characteristics: college expectations, previous RCC enrollment, race-ethnicity, number of children, whether ever married, and number of quarters with work in the year prior to random assignment.
Abt Associates Inc. Executive Summary xv
4
the same degree of rigor that we can estimate impacts, but we do have good information on the quality of program implementation.
The implementation study found, in addition to exemplary features, a number of significant weaknesses in New Visions’ implementation. These weaknesses included recruiting participants with skills below the threshold likely to benefit, allowing an up-to-six-week hiatus between initial volunteering and the start of classes (leading to a substantial number of program no-shows), not developing a strong job development focus, and not forging strong connections to vocational training programs at RCC. Although it is clear that these problems were serious, we cannot determine from our evaluation whether solving them would lead to positive impacts. It does seem worthwhile, however, to speculate on the kinds of changes that might lead to a stronger implementation.
For example, national statistics suggest that a substantial fraction of welfare recipients are in the 7thto-10th-grade skill range experts believe to be optimal for college bridge programs. By developing strategies for targeting on skills directly, rather than on high school credentials, programs may be able to recruit volunteers who are more likely to benefit. Marketing to TANF recipients who are not currently students is likely to be difficult; thus, it may be productive to expand enrollment to include TANF recipients who already are taking college courses. From the broader perspective of boosting college success for disadvantaged adults, programs like New Visions also might be expanded to other students in the general college population.
RCC did in fact open New Visions to other RCC students after the experiment ended. In the process, it made a number of other revisions to the program (renamed the Workforce Preparation Skills Program, or WPSP). The revised program provided greater flexibility to take only the core courses each student needed based on an up-front assessment. WPSP reduced the six-week wait between sessions, starting some courses every week (Reading, Computers, and Guidance) and others (English and Math) every three weeks. To accommodate a more continuous inflow of new students, the program shifted to a more self-paced instructional model, with periodic “spotlight” lectures designed to be relevant to students at any point in the curriculum.
Future programs also should be able to do more with job development. Greater involvement with local employers and more effort to arrange entry-level jobs and internships in fields of vocational training might increase opportunities to apply new skills at work and lead to steps onto and up career ladders in the longer-term. Job development efforts also could help with the work-school-family juggling problem by helping students to find jobs whose hours are easier to manage and whose substance offers more synergies with academic studies. Work study jobs, in particular, offer opportunities to tailor work to fit school schedules and career interests.
Many New Visions participants worked far more than the 20 hours a week required by county welfare policy, and this made it substantially harder for them to complete the program. Sprinkled through our findings are indications that family finances, pressures from employers, and welfare time limits contributed to decisions to work full-time. In response, programs like New Visions might offer financial aid and incentives that would encourage and help students to maintain lighter workloads. Another option, which a number of states have elected, is to “stop the clock” on welfare time limits while TANF recipients are going to school.
Finally, there are a variety of ways that programs like New Visions might strengthen linkages between preparatory and regular curricula. Possible steps here include adding short extension
Executive Summary Abt Associates Inc. xvi
segments to core courses after graduation (e.g., a short guidance follow-on) and offering special workshops, seminars and social events to alumni. Initiating short introductory segments of occupational training courses within the core program, as well as visits to and introductory lectures by outside faculty also might create a stronger bridge between preparatory and vocational training.
Although there are many ways New Visions might be improved, the present evaluation provides no guarantee that an improved program would generate positive impacts. By the same token, this first experiment does not prove that programs like New Visions cannot succeed. It is still quite early in the history of college bridge programs for disadvantaged adults, and practitioners are only beginning to absorb emerging lessons from research. We thus conclude by endorsing efforts to provide technical assistance to colleges working in the area and evaluate rigorously the best resulting programs.
Abt Associates Inc. Executive Summary xvii


Chapter 1 Introduction
In the late 1990s, thousands of single parents took jobs and left the welfare rolls, marking a dramatic turnaround from years of welfare caseload growth. Changes in welfare policy, as well as a strong economy, contributed to this shift (Grogger et al., 2002). In 1996 Congress made fundamental changes in the welfare system when it replaced Aid to Families with Dependent Children (AFDC) with the Temporary Assistance for Needy Families (TANF) program. TANF’s most consequential reforms were to require welfare recipients to engage in work activities and to limit the amount of time they could receive welfare.
For most welfare recipients, going to work did not mean an end to the struggle to make ends meet. The vast majority took jobs with little pay, benefits, or advancement opportunities (Acs & Loprest, 2001; Loprest, 2001). Family incomes remained low, and prospects for economic mobility remained limited.
As the limits of the “work first” approach have become evident, the focus of research and innovation has moved from reducing welfare dependency to improving the prospects of the working poor. One vibrant arena for innovation has been programs to engage low-income adults in academic and vocational training at community colleges.
This report summarizes findings from an evaluation of a model program designed to create a bridge to community college for working welfare recipients—the New Visions Self-Sufficiency and Lifelong Learning Project in Riverside California. Riverside Community College (RCC) developed this program in partnership with the county Department of Public Social Services (DPSS). Believing that New Visions would have substantial demonstration value, they decided to test the project as a random assignment experiment. RCC and DPSS engaged Abt Associates as the third-party evaluator and secured funding from the federal Administration for Children and Families for the evaluation.
Previous evaluation reports have provided findings on New Visions’ implementation and early impacts (Fein et al., 2000; 2003). In this final report, we recap the earlier implementation findings and provide a full analysis of program impacts. In this chapter, we discuss the relevant research and policy background, describe the New Visions model, and summarize our previous findings on program implementation.
1.1 Research and Policy Background
We begin in this section by providing some background on the rationale for programs to expand access to community colleges for welfare recipients. We then identify some of the principles for designing such programs that have emerged from research and practice.
Welfare Reform and Community Colleges
Good jobs increasingly require more advanced skills. Between 1979 and 2000, real wages increased 21 percent for workers with a college degree but fell three percent for those with only a high school diploma (Mishel et al., 2003). Future growth in the number of jobs requiring high skills also is
Abt Associates Inc. Chapter 1 1

expected to outpace growth in low-skill jobs (Carnevale & Desrochers, 2002). In 2000, median annual income for full-time workers was $42,706 for women with a bachelors or above; $31,071 for those with an associate’s degree; $24,970 for those with a high school degree; and $17,234 for those with no high school degree (U.S. Bureau of the Census, 2001).
Nationally, only 52 percent of TANF recipients had completed 12 or more years of school and only three percent had completed 13 or more years of school in federal fiscal year 2001 (U.S. Department of Health and Human Services, 2003). Even at the same levels of schooling, there is evidence that welfare recipients have poorer academic skills than the general population (Johnson & Tafoya, 1999).
Although it is clear that good jobs require advanced skills, it is uncertain whether cost-effective interventions can succeed in providing these skills to welfare recipients and other low-income adults. Surveying the employment and training (E&T) program evaluation literature, one prominent skeptic has argued that the gaps are too large to bridge for most low-income adults (Heckman, 1999). He concludes that education initiatives therefore should be targeted to disadvantaged children and that assistance for low-income adults should be limited to wage and income subsidies.
Advocates for adult education counter that most of the E&T programs in these studies simply replicated ineffective traditional teaching methods, and they point to a body of emerging research and practices that indicate potential for better results (e.g., Grubb et al., 1999; Martinson & Strawn, 2003). They offer as examples several programs—notably those run by the Center for Employment and Training and Portland, Oregon’s TANF agency—that have shown positive impacts in random assignment evaluations (Martinson and Strawn, 2003). Both programs included a mix of employment and education services—including community college job training in the Portland program.
Advocates for post-secondary education also cite a 1999 study (Carnevale & Desrochers, 1999) that found sizable proportions of welfare recipients already had, or were close to having, skills needed for college-level studies. This study estimated that the basic academic skills of 32 percent of welfare recipients were at least as good as the median high school graduate nationally, and that the skills of another 37 percent were comparable with high school graduates below the median. Carnevale and Desrochers estimate that this second group would need 200 hours of appropriate coursework (about a semester’s worth of developmental education) to be academically prepared for college.5
As interest in post-secondary education-focused strategies for low-income adults has increased, community colleges have become active centers of innovation. Compared with four-year institutions, community colleges provide education at substantially lower cost; have lower academic requirements for enrollment; maintain closer connections to local employers; provide greater flexibility in course schedules for part-time students; and offer a wider range of preparatory, vocational, and academic courses and occupational certification programs. Compared with stand-alone vocational programs, which also offer more occupationally-focused training, community colleges provide access to a much greater variety of fields and the chance to build college credits towards a two-year degree and transfer to four-year school.
They estimate that the remaining 31 percent of welfare recipients would require 900 hours of coursework (over two years’ worth) to reach the second tier (below-average high school graduates).
Chapter 1 Abt Associates Inc. 2
5
Challenges Facing TANF Recipients. In focus groups and interviews, several recent studies have documented the challenges community colleges face in engaging TANF recipients and other low-income adults in regular college programs (Fein et al., 2003; Matus-Grossman & Gooden, 2002; Nelson & Purnell, 2003).
Like many adult students, welfare recipients must juggle school with work and family responsibilities. As the vast majority of welfare recipients are single parents, this juggling act is particularly challenging for them. Time for school is more severely constrained by childrearing and financial responsibilities. Even if the direct costs of school are low, the indirect costs of reduced work hours are much more difficult to absorb when there is only one earner and child care provider in the family. Finding good child care may be difficult, especially if classes are in the evening, and working single parents may be loath to give up time with their children.
In focus groups, low-income adults identify a variety of other barriers to college. These barriers include growing up in homes where no one went to college, assuming they would not go to college, and not appreciating the benefits of a college education. Bad memories of high school and insecurities about weak educational and language skills can lead to apprehension about school. The process of applying for school and understanding the requirements of a new, large and complicated institution can be overwhelming. Other challenges include transportation difficulties, lack of family/social support for attending school, learning disabilities, health problems, substance abuse, domestic violence, unintended pregnancies, and emergencies involving other family members.
TANF Rules and Community College. Another set of challenges to pursuing post-secondary education includes constraints arising from TANF’s work requirements and time limits (Golonka & Matus-Grossman, 2001; Greenberg et al., 2000). States face penalties if they do not meet minimum “work activity”6 participation rates, and the rules allow post-secondary education to count as a “work activity” only under restricted circumstances.7 Lifetime time limits on cash assistance—five years in the federal law, and shorter in many states—have created substantial pressures to move recipients quickly into jobs and off the welfare rolls. Concerns that post-secondary education might lead to longer welfare stays have led many states and localities to severely restrict its use as a TANF activity and, where allowed, limit it to short-term training focused on a specific occupation. These policies contributed to a substantial fall in the fraction of welfare recipients attending college in the late 1990s (Covington & Spriggs, 2004).
Since then, advocates have made substantial headway in helping states and localities understand and exploit flexibility in the TANF rules to promote post-secondary education (Greenberg et al., 2000). TANF doesn’t prohibit states from using TANF funds for post-secondary education outright. Although failure to meet the federal work participation standards carries a financial penalty for the state, states have had little trouble meeting the standards—partly due to reductions in required participation rates granted for caseload reductions. States also can use state Maintenance of Effort (MOE) funds to create separate state programs, and TANF recipients shifted to these programs do not
6 Federal policy required states to have at least 50 percent of single-parent recipients engaged in approved work activities for at least 30 hours per week, with higher standards for two-parent recipients.
7 Post-secondary education can be provided as “vocational education” only if the sum of participants in this activity and those under age 20 completing high school is less than 30 percent of all work participants, and for a maximum of only 12 months.
Abt Associates Inc. Chapter 1 3

count in the work participation rate denominators. Some states have been able to extend previous federal waivers under which post-secondary education was an allowable activity. These mechanisms also allow states to “stop the clock” for recipients in post-secondary education activities. Finally, states can use federal TANF funds to support post-secondary education for non-recipients and former recipients, provided that this support is not used to meet ongoing basic needs.
By 1999, 34 states allowed post-secondary education as a TANF work activity, and many were developing statewide policies and programs supporting the development of programs at two- and four-year colleges (Greenberg et al., 2000; Golonka & Matus-Grossman, 2001). Meanwhile, welfare reform helped to stimulate a wider movement to develop new instructional models and supports for low-income adults at community colleges. To get a sense of where New Visions fits within the wider universe of community college programs for disadvantaged adults, we briefly describe some of the emerging principles that are guiding the development of programs around the nation.
Promising Strategies for Special College Programs for Low-Income Adults
Emerging programs include efforts to create a bridge to regular college programs for students who are not academically ready for college, and efforts to redesign regular programs for students who have the academic skills but face other obstacles to college (Kazis & Liebowitz, 2003). Some programs are designed with both functions in mind: New Visions, with its six-month bridge program followed by participation in short sequences of regular courses, is an example. Researchers have begun to recognize a number of content and format principles as best practices:8
• A core principle for bridge programs is that they should provide sufficient instruction in basic academic skills to prepare students for college-level coursework and do so as rapidly as possible given that working adults generally, and TANF recipients especially, may have limited time horizons for training. In order for it to be realistic to bridge the skills gap in a short-term program, students’ academic skills should be at least at 7th-8th grade level at entry.
• Many low-income students also need help with a variety of practical skills needed to succeed at school, work, and home. These so-called “soft skills” include competencies such as problem-solving, critical thinking, communication, teamwork, persistence, and punctuality.
• Instruction should be engaging, interactive and relevant to every day life. It should avoid long lectures, repetitive drills, and reliance on worksheets and computer exercises. Instructors should be skillful at infusing academic and soft skills instruction with examples and applications useful at work and home, as well as relevant to chosen career paths, and they should be able to connect comfortably with students interpersonally.
• A variety of innovations center around changes in approach to course scheduling and packaging. The aim of these reforms is to help working adults better manage and progress in school by making it easier to fit school into demanding work and family schedules and periods of life when it is not possible to be in school. Examples include strategies such as:
These principles synthesize findings and recommendations from a variety of sources, including: Bailey & Alphonso (2005); Bloom & Sommo (2005); Brock & LeBlanc (2005); Golonka & Matus-Grossman (2001); Grubb et al. (1999); Kazis & Leibowitz (2003); Martinson & Strawn (2003); and Purnell & Blank (2004).
Chapter 1 Abt Associates Inc. 4
8
conducting classes at convenient and alternative times during the week, breaking up courses into smaller segments to make it easier to step back in without having to repeat material following a break, starting courses more frequently than once a semester, and providing opportunities for self-paced instruction.
• Bridge programs should be strongly linked to vocational training opportunities at the college or they may block, rather than facilitate, advancement to such opportunities. Strategies include focusing academic assignments on exploring vocational interests, active guidance and exposure to different fields and programs at the college as part of career planning, offering a mix of basic skills and occupational training that is appropriate to be taken concurrently, and redesigning occupational programs to build in developmental education.
• In addition to changing the formats of individual courses to make them more convenient, vocational programs can be redesigned as shorter sequences of courses preparing students for entry-level jobs in careers of interest, with subsequent sequences leading to higher steps on career ladders and progress towards longer certificate and degree programs. Short sequences may be created simply by selecting combinations of existing courses relevant to jobs in the community, or by creating new curricula. New curricula provide opportunities to make more fundamental changes in teaching approaches and respond to new jobs in demand in the area.
• Bridge programs should be linked to employment opportunities. Ways of doing this include: arranging visits by employers to campus and by students to employers; creating internships, work experience opportunities, and work study positions; and involving employers in developing curriculum and providing training.
• There is substantial evidence that social integration into the college environment matters and is more difficult for part-time students (Bailey and Alphonso, 2005). Accordingly, programs for low-income adults should strive to build learning communities through such means as: grouping students together in cohorts; operating program in a separate, welcoming space; ensuring that faculty and staff are accessible; establishing a warm tone; holding social events and ceremonies; developing newsletters; and coordinating themes and assignments across courses.
• College bridge programs should offer a variety of guidance and counseling services. Low-income students may need extra help planning their educations and understanding and navigating the college system. Because they face more personal and family challenges, programs also should provide counseling and case management. Although such services usually are available in some form on college campuses, in bridge programs these resources should be more intensive and built into the program, rather than waiting for students to find them.
• Programs should provide other services that low-income adults are especially likely to need in order to balance school with work and family responsibilities. Key needs include flexible, high-quality child care and reliable transportation.
Abt Associates Inc. Chapter 1 5

• Low-income adults also are likely to need additional help securing financial assistance, both with the direct costs of tuition and school supplies and indirect costs of foregone earnings from reduced work hours. A number of major financial aid programs are limited to students in full-time regular credit programs. TANF recipients’ needs may be particularly great, since they often are their family’s sole provider and may lose valuable child care and other supports if they leave welfare.
• Finally, the substantial barriers to college facing low-income adults programs also suggest that more intensive outreach will be needed, even when colleges have developed strong programs.
The emerging literature on which these principles are based consists mostly of qualitative and descriptive research, supplemented by a handful of non-experimental program evaluations. Only recently have more rigorous, experimental evaluations begun to assess the effectiveness of new approaches to post-secondary education for low-income adults. Earlier reports from the New Visions evaluation provided the first such evidence (Fein et al., 2000; 2003).
More recently, Bloom & Sommo (2005) reported early findings from an experiment run by Kingsborough Community College in New York. Kingsborough developed a 12-week program comprised of three courses and intensive tutoring and guidance, designed to create a learning community. The program targets freshman scoring low in academic assessment tests. Unlike New Visions, participants mostly are in traditional college age groups, dependent on their parents, and without children. Findings show that the Kingsborough program increased substantially the fractions taking and completing developmental education courses—the core services offered by the program. It did not, however, raise enrollment in, or completion of, regular courses in the semester following the special program. The study has not yet reported findings on the program’s economic effects.
1.2 Context for the New Visions Demonstration
Under TANF, states and localities have adopted a wide variety of policies and practices concerning post-secondary education. In this section, we describe the policies in California and Riverside County which influenced the development of New Visions.
Welfare Reform and Community Colleges in California
California’s Work Opportunity and Responsibility to Kids program (CalWORKS) is in many respects more generous than other states’ TANF programs. California’s five-year time limit on cash assistance applies only to the adult’s portion of the grant and thus is less restrictive than the full-family time limits in many states. With a maximum grant of $679 for a family of three in 2002-2003, California had the fourth-highest benefits in the nation (U.S. House of Representatives, 2004).
During the New Visions demonstration, CalWORKS allowed recipients to participate in approved education activities for up to 24 months in order to fulfill its 32 hour/week work requirement. Counties were required to maintain lists of approved courses of study leading to jobs. After 24
Chapter 1 Abt Associates Inc. 6

months, in most instances education no longer could be counted as a “work activity,” and recipients had to work in either an unsubsidized or community service job.9
The state legislature made an exceptional commitment to post-secondary education through the state’s 108 community colleges when it created CalWORKS in 1997, allocating $81 million to the California Community Colleges Chancellor’s Office (CCCCO) to establish community college programs specifically for welfare recipients and former recipients. Funds are distributed to local college districts and can be used to redesign curricula and provide new services, such as: child care, work study jobs, job development and placement, and coordination with welfare and other local service agencies.10
Anecdotal evidence suggests that many counties retained a strong emphasis on work first and did not promote the college option very vigorously.11 Nonetheless, in 2001-2002, 47,118 students received services through the CalWORKS Community College Program—12 percent of the state’s adult CalWORKS recipients.12
In addition to the CalWORKS community college program, California encourages low-income students to attend community college by keeping fees low. Fees ranged from $11 to 18 per credit unit during the period of the New Visions study. The state also offers fee waivers to low-income students. TANF recipients can receive assistance with the costs of school books and supplies and school-related transportation and child care from county welfare offices. A high school credential is not required to enroll in a community college; rather, on the basis of skills assessments, students are placed at appropriate levels in the curriculum, which may include courses in developmental math, English, and English as a Second Language (ESL).
The County Environment and Welfare Policy Context
Riverside County is a large, socio-economically diverse region in southern California. The county’s 2001 population of 1.6 million made it the 6th largest in California and the 16th largest in the U.S. Much of western Riverside County is economically linked to the highly urbanized portions of Los Angeles and Orange Counties. The City of Riverside, in this western section, is home to the main RCC campus where New Visions was located. Beyond the San Jacinto mountains to the east lies Palm Springs, and beyond that a vast, sparsely populated desert region stretches to the Arizona border.
At 5.2 percent, Riverside’s 2001 unemployment rate was close to the overall rate for California (5.3 percent) and only slightly higher than the U.S. as a whole (4.8 percent). Riverside’s economy grew steadily over most of the period covered by this report. From 1995 to 2001, this economic growth contributed to a substantial decline in the welfare caseload—from 38,764 to 20,477 families.
9 State legislation removed this 24-month “work trigger” at the end of 2004. 10 Spending was reduced to $63 million in 2002-2003. 11 Nelson and Purnell (2003). Some counties were quite active in promoting education and training for
welfare recipients. As explained in the next section, Riverside was one such county. 12 Reported in Nelson and Purnell (2003, p. 7).
Abt Associates Inc. Chapter 1 7

The New Visions demonstration was a partnership between two large county institutions. The Riverside County Department of Public Social Services (DPSS) administers TANF through 11 offices county-wide. Positive evaluation findings on DPSS’s first-generation work program (Riccio et al., 1994) and the agency’s subsequent commitment to rigorous demonstrations have earned it a national reputation for welfare reform innovation. Riverside Community College (RCC) serves nearly 30,000 students district-wide.13 RCC’s Workforce Development department runs a variety of programs aimed at increasing the enrollment, academic performance, and labor market success of disadvantaged students.
New Visions is one aspect of a broader shift in the county’s welfare policies. Prior to 1997, the county’s GAIN (Greater Avenues to Independence) program focused on providing job search and other assistance aimed at moving clients quickly to work.14 Since then, the county’s program has evolved considerably. Under the current “Work Plus” model, DPSS encourages welfare recipients to participate in education and training after they find unsubsidized jobs for at least 20 work hours a week.
The county’s program includes three components. Phase 1 services are essentially the same as those embodied in the work first approach that DPSS had used prior to 1997. Phase 1 case managers and their clients concentrate on job entry, and clients remain in Phase 1 until they are working at least 20 hours a week. While in Phase 1, most clients meet their total activity participation requirement (32 hours for single parent cases and 35 hours for two parent cases in CalWORKs, California’s TANF program) mainly through employment and related services (e.g., job club, job search, and unsubsidized employment).15
After recipients achieve stable employment and are working at least 20 hours per week, they advance to Phase 2, where the emphasis shifts to education, training, and job advancement. Phase 2 clients are assigned to special case managers, who encourage them to take advantage of the various education and training opportunities available in the community. Whereas the agency’s performance assessment scheme rewards Phase 1 case managers primarily for job placements, Phase 2 case managers are assessed on the degree to which their clients engage in and complete education and training, and retain and advance in their jobs.
Phase 2 clients must meet at least 20 of their required 32 or 35 hours of CalWORKs activity through unsubsidized employment. Beyond this level, DPSS encourages them to engage in training and education to the extent that is feasible and consistent with their personal goals.
RCC’s New Visions program is one of a number of Phase 2 service options. Other options include adult basic education, vocational training, and on-the-job training at a variety of proprietary schools and community colleges (including other RCC programs). The program’s philosophy is that better matches will result if the agency encourages clients and providers to find each other, rather than case managers deciding where clients should go. Therefore, DPSS sees its job mainly as strongly
13 RCC is one of four separately administered community college districts in Riverside County. 14 The earlier GAIN program did provide education and training services on a case-by-case basis. 15 Phase 1 clients also can meet the program’s participation requirements with hours spent in mental health
and substance abuse counseling, and, when appropriate, through educational activities such as adult basic education, GED preparation, English as a Second Language classes, and “Self-Initiated Programs.”
Chapter 1 Abt Associates Inc. 8

encouraging education and training in general—and providing information about a range of opportunities—and leaving the final decision up to the client.
After an assessment phase, under CalWORKs rules in effect during the demonstration recipients could participate in approved education and training activities for up to 24 months, after which the 32- or 35-hour participation requirement had to be met through unsubsidized employment or community service. In Riverside County, the clock was triggered when the welfare-to-work plan and activity agreement were signed, typically at the end of the initial Phase 1 job club/job search period. After 24 months, DPSS could allow recipients to continue in school if such activity is linked to a community service assignment.
Clients remain in Phase 2 until either (a) they leave welfare, or (b) their weekly employment falls below the 20-hour level (after a 60-day re-employment window, they are returned to Phase 1). Recipients who leave welfare with employment or find employment within 12 months of leaving are eligible for Phase 3 services. Clients in Phase 3 are offered mentoring and other services intended to foster job retention and advancement.16
1.3 The New Visions Demonstration
New Visions was a specially-designed Phase 2 program for recipients with a high school diploma or equivalent preparation. In this section, we describe the program, note its exemplary features, and provide an overview of the evaluation design.
New Visions Model
The goals of New Visions were to prepare welfare recipients for community college occupational training programs, foster lifelong learning, and promote job advancement and self-sufficiency. Operated by RCC, the program had its own classroom, offices, and computer laboratory on the college’s main Riverside City campus. The program was funded partly through TANF grant dollars provided directly to California community colleges and partly through general college funds.
The New Visions model started with a specially designed 24-week core program followed by a period of occupational training in regular RCC courses (see Exhibit 1.1). Prior to classes, a one-week orientation session introduced students to the campus and New Visions, made sure support services were in place, and assessed academic needs through testing and counseling. In the core program, students attended special preparatory classes in key academic subjects (math, English, and reading), as well as in computer skills and career/life planning. After completing the core program, counselors
16 A separate, ongoing random assignment evaluation is measuring the impacts of the overall Work-Plus program, in comparison to a “work first” only model (essentially limited to Phase I services) and a “training focused” version of Work Plus that initially requires 20 hours of work but subsequently allows participants in education and training to reduce their work hours (provided they maintain 32 hours of activity overall per week). A recently published report on early impacts (Bloom et al., 2005) found similar high rates of education and training participation in the Work Plus and Training Focused groups. Surprisingly, E&T participation rates were nearly as high in the Work Focused group as in the other two groups. The early impacts showed little evidence of impacts on employment and welfare outcomes. The exception was that the average employment rate for the Training Focused group was slightly (4.0 percentage points) lower than for the Work Focused group.
Abt Associates Inc. Chapter 1 9

Exhibit 1.1 The New Visions Program Model
Eligible Volunteers Assigned to Treatment
Orientation
Core Program
1st 6 Weeks 2nd 6 Weeks 3rd 6 Weeks 4th 6 Weeks
Commencement
Occupational Mini-Programs
encouraged participants to enroll in individual courses, or sequence of courses (called occupational mini-programs), that provide occupational training in careers of interest. Although both core and post-core courses provided credits, only those from the core guidance course and post-core work were applicable to an associate’s degree and transferable to four-year institutions in the University of California (UC) system.
Core Program. The 24-week New Visions core program featured small classes, a flexible schedule, and highly individualized instruction. Students attended class for three hours daily from Monday through Thursday (for a weekly total of 12 hours of instruction). Each day, classes were repeated during three different three-hour time blocks (noon–3 p.m., 3–6 p.m., and 6–9 p.m.). Students could choose the time slot most convenient to their work, child care, and transportation schedules, and switch slots as needs changed. Students were encouraged to use the computer lab for study and homework on Friday and Saturday.
The core program consisted of the following five courses:
• English 60A1-60A4. The English class, taught Tuesdays and Thursdays, emphasized the development of basic communication skills in writing and speech. It was designed to promote
Chapter 1 Abt Associates Inc. 10

mastery of basic punctuation; spelling; grammar; paragraph development, structure and coherence; and summarization and argument strategies appropriate for e-mails, memos, and other written and oral communication. The objective was to prepare students to write effectively at work and to take a pre-college English class (or higher) at RCC. These skills correspond approximately to the “High Intermediate Basic Education” level in the U.S. Department of Education’s guidelines for adult basic education (U.S. Department of Education 2001).
The course relied principally on traditional classroom instruction, including a mix of lecture, group discussion, individual writing and problem-solving activities, and worksheets. Some assignments used the proprietary software package PLATO and Internet-based research. All work was done in class—there was no homework.
• Math 62A-62C. The math class, also taught on Tuesdays and Thursdays, provided “a bridge between arithmetic and algebra.” It taught arithmetic up to the eighth-grade level and stressed the development of critical thinking skills. The course covered skills and applications relating to number sense, percents, ratios and the addition, subtraction, multiplication, and division of whole numbers, decimals, and fractions. This course also sought to promote skills at the High Intermediate Basic Education level as described in U.S. Department of Education adult basic education guidelines.
This course relied more heavily on computer-assisted instruction (PLATO) than the English class, though it also included lectures. Class time typically was divided evenly between group lessons (lecture and discussion) and individual computer work.
• Reading 95. The reading class met once a week. This course emphasized developing, expanding and improving vocabulary, and mastering spelling rules using contextual, structural and phonetic analysis. Students were taught to evaluate text for clarity, completeness and consistency; to identify main ideas and supporting details; and to develop conclusions by summarizing essential concepts in reading materials. The course also stressed information-gathering competencies by teaching about the World Wide Web, performing web searches, assessing the validity of web based resources, using e-mail, and downloading information from the Internet. Again, these skills correspond approximately to the High Intermediate Basic Education level.
Students spent most of their classroom time working individually on computer-based instructional programs and other reading assignments. The instructor made substantial use of the Internet to foster research and reading skills.
• Office 99A-99C. The Office Administration course, offered on Wednesdays, covered computer basics, keyboarding, Microsoft’s Word and Excel software, and Internet use. Classes typically began with a brief lecture and then moved on to discussion and student exercises. Students spent a substantial amount of time practicing keyboarding and completing exercises in the New Visions computer lab.
• Guidance 47A, 47B, 48A, 48B. The Guidance class met two days per week (on Monday and Wednesday). It was one of the more innovative courses in the core curriculum. The class
Abt Associates Inc. Chapter 1 11

covered a wide range of topics corresponding to particular SCANS workplace skills.17 These topics ranged from money and time management, to job search techniques, to managing interpersonal relationships in and outside the workplace. The course also included a segment on study skills and other skills needed to survive in college. Guidance drew from curricula in existing RCC courses on career exploration, life skills, and skills for college success. The class had a workshop format and placed substantial emphasis on classroom discussion.
Although the contents of the three basic academic subjects resembled comparable preparatory courses at RCC—specifically, the lowest-level course in each developmental education sequence—the New Visions courses placed special emphasis on basic communication and computational skills critical for work. Specifically, instruction targeted skills specified in the SCANS model developed by the U.S. Department of Labor, including reasoning, critical thinking, and decision-making. Classes emphasized discussion and were organized to foster a supportive peer environment.
Otherwise, classes covered the same material as RCC preparatory classes offered to the general student population. Based on placement tests18 RCC assigned over half of all recent high school graduates to take English 60A, the college’s regular version of the New Visions English class. 19 Like other students, better-prepared New Visions participants could test into a higher level of English, such as English 50 (the next level up), or English 1A (a UC transfer-level course).20
In the fourth year of the demonstration, RCC added a “Capstone” workshop designed to prepare students for successful career transitions after graduation. It was offered during the last six weeks of the core program (in the time available after the end of the math class, which lasted only 18 weeks). The Capstone workshop was designed to help students transition from New Visions’ supportive environment to less supportive work and school settings. It emphasized planning needed to follow through on career plans and particularly the steps necessary to enroll in regular RCC courses and pursue other education and job goals immediately after graduation from the core program. Specific goals were to help students become familiar with wider RCC resources, crystallize job and educational goals, select an occupational mini-program or certificate program, and improve resume and interviewing skills. The class format was informal and discussion-oriented.
Approximately every six weeks, a new cohort of students entered the program. After orientation, incoming students joined ongoing students in core program classes. The new students worked on the same sequence of assignments as ongoing students. Small classes made it possible to provide the highly individualized instruction needed to manage students at differing stages in the curriculum.
17 In 1992, the Secretary’s Commission on Needed Skills (SCANS) identified five broad competencies and a series of associated skills required for employment success. Broad competency areas include using resources, working with others, gathering and using information, understanding systems, and using technology. Associated skills include basic, thinking, and interpersonal skills. See www.wdr.doleta.gov/SCANS.
18 The college currently uses Accuplacer, an internet-based assessment system developed by the College Board.
19 See Section 2.2 in Chapter 2 for statistics comparing the skills of New Visions students to those of other RCC students.
20 These higher-level classes are not special New Visions courses.
Chapter 1 Abt Associates Inc. 12

Students dropping out before completing New Visions were encouraged to return at a future time. Instructors started the returning students at the point they had reached prior to dropping out.
Completing the core program required passing final exams in math and English and completing required assignments in all courses. To help New Visions students build their academic records, the college awarded academic credits for the five core program classes on students’ official RCC transcripts. However, only the four Guidance class credits counted towards an Associate’s degree and were transferable within the UC system.
While students were enrolled in the core program, they received close attention from RCC counselors. Counselors scheduled regular meetings to review progress, develop career and college plans, and work on personal growth issues. Counselors also helped each client to arrange child care and other supports, develop educational and professional goals, and formulate plans for activities following the core program.
As in other DPSS Phase 2 E&T activities, New Visions students who dropped below the 20-hour per week work requirement had 60 days to re-enter employment before becoming ineligible for New Visions. DPSS case managers and New Visions counselors provided assistance during this interval although, as noted later in this section, the former had primary responsibility for employment services. Students dropped due to low work hours could re-enroll if their work hours increased subsequently. Fewer than four percent of all drop-outs resulted from job loss, according to documentation from calls to drop-outs by program counselors (see Exhibit 2.10).
Post-Core Program. After graduating from the six-month core program, students were encouraged to enroll in one of a variety of occupational mini-programs. These programs consisted of one or more regular RCC courses selected to provide marketable training in a shorter time period than required for an Associate’s degree or state-recognized occupational certificate.
The concept behind the mini-programs was to help students take first steps on the career ladders they designed in the New Visions core program. Each cluster of courses was intended to prepare students for entry-level job in their chosen field. At the same time, the mini-programs provided a platform on which students could build towards more advanced certificates or degrees.
The mini-programs drew on diverse courses already available in the existing RCC curriculum. In some instances, existing courses were re-formatted or divided into shorter credit-bearing segments. Most programs were designed to be completed in four to seven months, although individual programs could be as short as a few weeks or take up to a year to finish. For example, training in some early childhood education and allied health specialties could be completed in six or fewer units and be finished in a single 12-week academic term, whereas the culinary arts and registered nurse (RN) programs required a year or longer.
The intention behind these short programs was to create job-relevant training sequences that could fit comfortably within the state’s 24-month time horizon for education and training under TANF. Although DPSS Phase 2 case managers were unable to approve programs longer than 12 months, the agency allowed regional managers to grant exceptions for training with high potential for job advancement.
Abt Associates Inc. Chapter 1 13

The number of programs identified was fairly small at the start of New Visions. Over time the number grew steadily. In 2002, the RCC college catalogue identified short sequences in fields as varied as nursing, medical assisting and technician fields, computer information systems, early childhood education, corrections, police dispatching, culinary arts, business administration, graphics, paralegal, human services, office administration, and manufacturing and construction. The mini-programs were open to all RCC students. College administrators felt that short programs could be helpful to many regular students who might have difficulty completing longer programs.
Staffing and Administration. RCC designed and operated New Visions, with substantial input and participation from DPSS. RCC’s Vice President for Planning and Development and DPSS’s Deputy Director for Planning and Evaluation led the initial planning and were responsible for many aspects of ongoing coordination. Within the college, the Associate Dean of Workforce Preparation administered New Visions, along with other workforce development programs funded under CalWORKs and other auspices. The New Visions program coordinator was responsible for day-to-day management and coordination with DPSS. The two individuals who held the coordinator position both were trained counselors and also provided counseling to students.
Five faculty members taught the core program courses in Office Administration, English, math, reading, and Guidance. Most of these faculty members also taught other RCC courses. The program initially had a half-time financial aid clerk to help students to access financial aid and other services available from RCC and other state and federal programs, but that position was eliminated mid-way through the program.
Similarly, New Visions also originally had a job developer to coordinate with employers and help students secure job placements. RCC administrators discontinued this position because they felt that it was duplicative of services participants received at DPSS. The program’s managers and staff provided some degree of ongoing connections with local employers through contacts they maintained with Riverside County’s Economic Development Agency and several local businesses.
A number of other front-line staff played key roles. At RCC, counselors and instructors were heavily involved in recruitment, curriculum design, and day-to-day coordination with DPSS case managers. They worked with the New Visions coordinator to establish linkages to an array of public and private community service agencies for housing, substance abuse treatment, rape crisis and other services. DPSS GAIN Phase 2 case managers played a central role in informing clients about New Visions and helping to arrange supportive services, such as transportation, child care, and other work-related expenses and services.
To improve coordination between the welfare office and RCC staff, in the program’s third year DPSS assigned a special Phase 2 case manager to work at the New Visions site three afternoons each week. Because this person did not carry a regular caseload (even New Visions students were assigned to other case managers), she was free to concentrate on special problem-solving and facilitation needs, which often concerned students’ employment, welfare benefits, and supportive services.
New Visions counselors normally took full responsibility for students’ educational planning needs, whereas their DPSS counterparts handled income and related supports, including child care. New Visions counselors monitored New Visions participants’ class attendance, academic performance, progress in the core program, and subsequent RCC coursework. Although designated DPSS Phase 2
Chapter 1 Abt Associates Inc. 14
case managers and RCC counselors specialized in New Visions participants, these staff also provided services to other (i.e., non-New Visions) GAIN clients and RCC students.
New Visions as a Model College Bridge Program
The foregoing description suggests that the New Visions design incorporated a number of the principles identified in our general discussion of college bridge programs for low-income adults. The core program put substantial emphasis on developing basic academic and life skills development. Promising strategies included: small class sizes, engaging pedagogical approaches, an emphasis on “soft skills” and everyday applications, flexible scheduling and modularization, and courses in special areas such as computing and guidance. Guidance supports were relatively intensive and varied: the guidance class provided structure and peer support for examining key academic and life planning needs, New Visions counselors provided individualized on-site planning and problem-solving assistance, and an on-site DPSS case manager helped to arrange needed supportive services and coordinate work and training planning between the college and welfare agency.
The New Visions model also took strong steps to create a learning community. The program’s designers secured separate, comfortable space; made this space attractive and inviting; promoted group cohesion by grouping participants in cohorts and placing a strong emphasis on group discussion in classes (especially guidance); sought to hire faculty who would be comfortable interacting with students on a relaxed basis; fostered an environment conducive to such interaction; hired former students and TANF recipients into clerical and receptionist positions; published a newsletter; and held celebrations and social events.
Through strong linkages with the welfare agency and other social services, the program sought to mobilize other supports that low-income single parents needed to stay in school. Direct financial costs of tuition, books, and materials were eliminated in the core program and could be waived subsequently. Finally, though not a strong element in the original plan, the program mounted a vigorous recruitment effort with a number of innovative aspects.
A number of other principles identified earlier were not strong features of the New Visions design. For example, the program did not integrate its basic skills and regular courses as closely as it might have: New Visions’ developmental education phase was relatively long and clearly separated from the subsequent vocational training phase (i.e., mini-programs).21 Although the original design envisioned linking core program graduates to occupational mini-programs, a detailed plan for mini-programs was slow to develop.
Second, although there was some contact with employers, linkages between employers, the program, and its students were not strongly developed in the original design or realized subsequently. As noted below, recruitment absorbed a great deal of time and energy that otherwise might have been spent developing other aspects of the program. Relying on DPSS staff for job search and placement services resulted in weaker linkages between the program and employers than might have been the case had New Visions kept its job developer.
After demonstration phase, RCC made changes to allow greater flexibility to take only selected courses within the core program and do so in combination with regular coursework.
Abt Associates Inc. Chapter 1 15
21

The program provided a substantial amount of career planning, as mentioned above, but it had relatively little capacity to connect students with jobs complementing ongoing studies and school schedules or representing initial steps up career ladders. The work study route was mostly unavailable, due to the strong emphasis on unsubsidized employment in DPSS policy.
Evaluation Design
The New Visions demonstration is the first random assignment evaluation of a community college bridge program. Well-executed experiments are the only known method for ensuring that measured impacts reliably can be attributed to an intervention, and they have become the gold standard in evaluation research.
For the New Visions experiment, welfare recipients who were eligible and volunteered for New Visions were assigned randomly to one of two groups. Treatment group members were allowed to participate in New Visions. Their control group counterparts were not allowed to participate in New Visions but were encouraged to participate in other Phase II education and training activities. Random assignment guaranteed that the two groups would have very similar characteristics at the outset and differ thereafter only in exposure to New Visions.
The demonstration enrolled a total of 1,043 volunteers between September 1998 and May 2002. Random assignment occurred at local DPSS offices, where Phase 2 case managers were responsible for verifying eligibility, entering information needed to obtain a random assignment status for each participant from the automated system, and making sure that each participant completed a Background Information Form (BIF). Case managers forwarded information on treatment group members to New Visions staff, who scheduled orientations and enrollment for new cohorts approximately every six weeks.
As detailed in Chapter 3, the project collected data on a variety of outcomes over a three-year follow-up horizon (with extended follow-up for earlier cohorts). Differences in average values of these outcomes between the treatment and control groups provide estimates of program impacts. Our primary set of impact estimates is calculated over the entire population volunteering for New Visions and includes treatment group members who did and did not actually show up for the program. Such impacts represent the effects of the opportunity to participate in New Visions. We provide also estimates for those who actually did show up, using an adjustment that assumes the program had no impact for no-shows.
Findings represent the incremental effects of an innovative community college bridge program, compared with other education and training services. Control group members were encouraged to enroll in other E&T activities and, as we will see, many did so. The demonstration thus tests the hypothesis that providing special route to college can increase the numbers of welfare recipients attending community college classes and the quality and quantity of their subsequent academic experiences. The objective of subsequent training was to prepare students for specific entry-level jobs in careers of interest.
By providing more welfare recipients with such training, the program was designed to produce more steps onto and up career ladders. Such steps would lead, in turn, to higher earnings and reduced welfare dependency. Since this chain of outcomes would take some time to unfold, we might expect to see increased rates of college enrollment in the year or two following the 24-week New Visions
Chapter 1 Abt Associates Inc. 16

core program, with increased earnings following sometime thereafter. In the short-to-medium run, increased time devoted to school might lead to reduced work hours and higher TANF payments. At the same time, the New Visions core program was designed to provide skills immediately useful at work. The program thus might produce some gains in job retention and advancement in the short-turn, as well as in the longer-run.
Two additional study components help to understand the sources of program impact findings. The first, the implementation study, documents the way the program was translated from its initial blueprint to an operating program. Discrepancies between the initial vision and actual program help to illuminate whether impacts reflect the effects of a fully or only partially-realized design. Implementation findings also can provide valuable lessons on the challenges other localities might expect to encounter in developing similar bridge programs. The second additional study component is the process study, which traces and seeks to understand the experiences of program participants, from initial decisions to volunteer to the circumstances affecting continuing college after the New Visions core program. As events unfolded, it became clear that the opportunity to examine these experiences in detail would be one of the most valuable aspects of the study.
As our earlier report (Fein et al., 2003) provides an in-depth assessment of New Visions’ implementation, the remainder of this chapter summarizes only the highlights of those findings. The body of this final report is devoted to a more detailed presentation of findings from the process (Chapter 2) and impact (Chapter 3) studies.
1.4 Implementing New Visions: Recap from Previous Reports
As with many ambitious new interventions, it was not certain at the outset that New Visions could be successfully implemented. Would a sufficient number of working parents be willing to devote 24 weeks to preparing for college and then go for further studies? Was it possible to create a program that simultaneously prepared students for college and fostered short-term job advancement? Would New Visions build a sturdy bridge between the core program and regular college courses? The evaluation’s implementation study used information from on-site interviews and observations to answer these and related questions.
Recruitment
Recruitment proved to be far more challenging than RCC or DPSS initially had envisioned. Eligibility restrictions limited the pool of potential volunteers to less than 10 percent of the caseload, and recruiters faced growing competition from other Phase 2 training programs in an era of declining welfare caseloads. Eligible clients often were not an easy sell. Past academic difficulties left many skeptical about college, financial needs impelled them towards full-time work, and other Phase 2 programs promised faster pathways to better jobs.
The earliest outreach efforts mainly involved calls and mailings from RCC to Phase 2 clients who had indicated an interest in New Visions or RCC on a form implemented by DPSS. The resulting flow of volunteers—about 30 per six-week cycle, of which half were assigned to the treatment group—was less than half the level needed to fill seats and meet demonstration enrollment requirements.
Abt Associates Inc. Chapter 1 17
Over the next few years, senior staff at the two agencies collaborated closely on an extensive recruitment effort. Notwithstanding an agency philosophy of not intervening in the training program marketplace, DPSS’s administrators and Phase 2 case managers took an active role in this effort. The campaign developed a wide array of techniques, including home visits, presentations at the welfare office, on-campus picnics, ads in local media and public spaces, use of New Visions students as recruiters, marketing to welfare clients before they found jobs, offering work study positions, and hiring an expert consultant to advise. The latter recommended revising the message about New Visions’ benefits and helped implement steps leading to a more uniform message across the two agencies. The revised message told welfare recipients that New Visions was a program for people like them that provided skills that all employers would reward. Previously staff had placed more emphasis on the program as a chance to improve basic educational skills (DPSS) and acquire skills needed to succeed in college (RCC).
The two agencies’ experiences with work study illustrate how programs like New Visions require that both partners be able to understand and accommodate to each other’s policy environments. RCC staff saw offering work study jobs to Phase 1 (pre-employment) clients as a good recruitment tool that would help participants to coordinate their work and school and gain experience with the college environment. DPSS policy normally did not allow work study because it viewed these subsidized, short-term jobs as diverting clients from sustained movement towards financial independence. The agency nonetheless agreed to test the use of work study positions in recruitment. When a surge of volunteers proved too great for the college to place quickly in work study positions, the welfare agency returned to its policy of requiring unsubsidized work.22
Through its extensive recruitment efforts, the demonstration was able to maintain overall intake (treatment and control) at nearly 40 volunteers per cycle and eventually meet the target of 1,000 volunteers. Although not that much higher than early intake, administrators had feared substantial declines as they worked through the initial backlog of eligible clients and as competition increased from other Phase 2 providers. An early 2002 survey of eligible Phase 2 clients found that 27 percent had volunteered for New Visions. This result seems a good one, given competition from other programs, apprehensions about college, and the pull of full-time employment in a robust economy. It suggests that ultimately it was the small pool of eligible clients, rather than failure to make the case for the program, that limited demonstration inflow.
The Core Program
Compared with recruitment, relatively few serious problems arose in implementing the New Visions core program, and it quickly reached its steady state. RCC administrators designed a solid core curriculum and hired an instructional staff committed to working with low-income working parents.
Teaching approaches varied across courses and over time, but generally emphasized a mix of group discussion and self-paced work, periodically punctuated with short lectures. New Visions largely eschewed the traditional lecture-based model. Faculty used a combination of textbooks, worksheet assignments, and computer software as teaching resources.
Each course moved through its subject matter sequentially in six-week blocks timed to correspond to the inflow of students in new cohorts, who were enrolled about every six weeks. More frequent entry
DPSS continued to allow a few participants to hold work study jobs as New Visions recruiters.
Chapter 1 Abt Associates Inc. 18
22

opportunities reduced the wait to begin classes but required that faculty engage new students in ongoing courses who had not had mastered previous material. Instructors responded by devoting time to review, by working with individuals and small groups of students, and by designing curricula to allow substantial self-paced work.
Faculty found that New Visions students’ low academic skills made teaching these courses more challenging than teaching comparable courses offered in more traditional formats to the general RCC student body. Program developers had expected 7th-to-8th-grade competencies, but a majority of incoming New Visions students fell below these levels on the Test of Adult Basic Education (TABE). The gap that New Visions needed to close to bring participants to the college level therefore was substantial.
Instructors used varying techniques to help students with low skills, including individualized tutoring and allowing different rates of progress through the material. In general, they did not change the kind or level of material covered. Inevitably, instructors told us that students completed courses with widely-varying levels of mastery. The program’s philosophy was to recognize and reward effort and base graduation decisions on completion of assignments and evidence that students had acquired workplace-applicable skills, as well as academic skills.
In the program’s first year, counseling staff were stretched thin by multiple responsibilities for counseling, recruitment, instruction, and administration. When the college added more counselors (around the end of New Visions’ second year), the program was able to take a more proactive approach to counseling current students, re-engaging drop-outs, and building stronger bridges to post-core training at RCC.
Strong connections to employers are an important requirement for programs seeking to foster short-term job advancement. As noted earlier, New Visions initially hired a job developer and developed ties to several employers—including a local bank—but ultimately decided it made more sense to rely on welfare agency staff for job development. As a consequence, employers were not as directly involved as they might have been in the core program, which focused more on preparation for work and school than on securing direct job placements.
RCC and DPSS held somewhat different views of what an ideal core curriculum would look like. DPSS staff felt that the program would be more appealing if it introduced occupational training earlier—during the six-month core program. RCC staff shared this view to some extent, but believed also that virtually all New Visions students needed intensive academic preparation to succeed in the college’s regular occupational programs. They noted that the program already provided some flexibility to start occupational training earlier by allowing students to test out of core courses.
Post-Core College Training
An integral component of the original New Visions model was a period of regular college coursework following core program completion. This part of the program was not as fully designed as the core program at the outset, and its subsequent development took a back seat to recruitment efforts on the part of RCC administrators and staff. During the first two years, this component consisted mainly of ad hoc efforts by counselors to interest students in what then was a relatively limited number of occupational mini-programs.
Abt Associates Inc. Chapter 1 19

Two developments eventually strengthened this part of the program. First, the college hired more counselors, who had more time to take a proactive role in career planning and post-core coursework. New Visions also added a Capstone workshop (described in Section 1.3) to solidify career goals and training plans during the last weeks of the core program. Second, a surge of interest in shorter training programs in the general college community led to the creation of many more occupational mini-programs.
Administrators and faculty created mini-programs to address requirements for specific jobs in demand in the community, sometimes working directly with employers to create programs. Most of the mini-programs simply identified short sequences of existing courses needed for a particular job, although some broke up existing courses into smaller (e.g., one-credit) chunks or developed new courses customized to the specifications of local employers. Illustrative programs included training for: medical transcription, cardiac monitor technician, pre-school teacher’s aide, PC publishing, and administrative assistant.23
Whereas post-core training originally was intended to be an integral part of New Visions, the program as implemented mostly ended with graduation from the core program. New Visions counselors periodically contacted participants continuing at RCC to assess their progress, and counselors also contacted non-continuers to encourage them to return to school. Continuing students remained eligible for other special services available to CalWORKS students, including counseling and help with tuition and school materials.
RCC and colleges implementing similar bridge programs could take a number of additional steps to maintain stronger services following their initial preparatory phases. These steps include adding short extension segments to core courses after graduation (e.g., a one-unit guidance follow-on) and offering special workshops, seminars and social events to alumni. Initiating short introductory segments of occupational training courses within the core program, as well as more visits to and introductory lectures by faculty outside New Visions, also might create a stronger bridge between the core program and post-core training.
Changes to the Program after the Experiment
After the experiment, RCC revised New Visions to address some of the problems identified in the evaluation’s implementation study. To target a greater number of appropriately-skilled participants, RCC opened the program—renamed the Workforce Preparation Skills Program (WPSP)—to other RCC students, as well as welfare recipients.
To address the varying needs of different students, WPSP steered students to take only those core cases needed, based on an initial assessment. WPSP reduced the six-week wait between sessions, starting some courses every week (Reading, Computers, and Guidance) and others every three weeks (Math and English). To accommodate a more continuous inflow of new students, WPSP placed an even greater emphasis on self-paced instruction, with periodic “spotlight” lectures on topics designed to be useful to students regardless of where they were in the curriculum.
For more detailed descriptions of several illustrative mini-programs (early childhood, health care, and office administration) see Fein et al. (2003, Chapter 2).
Chapter 1 Abt Associates Inc. 20
23

Another enduring legacy of New Visions in Riverside County is the strong partnership between the county’s welfare agency and its largest community college. RCC and DPSS have continued to work together on a variety of joint programs since the end of the New Visions demonstration.
Abt Associates Inc. Chapter 1 21


Chapter 2 Educational Experiences of New Visions Volunteers
How many working single parents are willing to shoulder the additional pressures of school? What does it take to complete a college preparatory program, and how many do so? After they are prepared, how many will progress into regular courses in occupational fields of interest? What personal characteristics and circumstances affect their decisions and experiences in school?
In this chapter, we explore the educational experiences of program participants, from initial decisions to volunteer to the circumstances affecting continuing college after the New Visions core program. As events unfolded, it became clear that the opportunity to examine these experiences in detail would be one of the most valuable aspects of the study.
We look at summary statistics for recruitment, retention, and advancement to further education after the core preparatory phase of New Visions. Drawing on a variety of sources, we analyze the relationship between these outcomes and factors such as: motivation and confidence, academic skills, educational program preferences, personal and family challenges, social supports, financial pressures, competing work and family responsibilities, transportation problems, and program eligibility rules.
2.1 Marketing New Visions to Welfare Recipients
Although RCC and DPSS eventually recruited the target number of participants needed for the demonstration, in the last chapter we related that doing so took considerably more time and effort than originally envisioned. In this section, we assess some of the challenges associated with recruitment. Analyses focus on the numbers eligible, levels of interest in education and training in general, and responses to New Visions in particular.
Only a small fraction of Riverside’s TANF recipients were eligible for New Visions.
A major reason it took so long to meet the New Visions recruitment targets was that fewer than ten percent of the county’s adult welfare clients were eligible for the program. Statistics for the middle of the demonstration’s first year (January 1999) indicate that only 15 percent of adult recipients in the county met both the 20-hour work standard and high school equivalent degree requirement. Only half of this 15 percent lived in local welfare districts close to the main RCC campus where New Visions was housed.
The work requirement excluded more clients than the educational requirement. Whereas slightly more than half (52 percent) of adult welfare recipients had a high school diploma or equivalent, only 28 percent met the work requirement.
In an effort to boost recruitment, DPSS and RCC decided in early 2001 to modify eligibility for the New Visions demonstration to include clients without high school credentials who tested above the
Abt Associates Inc. Chapter 2 23

median level for high school graduates on a standardized test of academic skills.24 No special accommodation at RCC was needed, because college policy does not require a high school degree.
The amount by which this change expanded the number of TANF recipients eligible for New Visions is difficult to assess directly, because only a portion of Phase 2 clients were tested.25 A rough calculation is that the change increased the number eligible by 17 percent.26
Another question is: How many of those who were technically eligible actually had skills appropriate for New Visions? Later in this chapter we will see that a fairly small fraction of those recruited fell into the skill range experts recommend for bridge programs like New Visions.
New Visions-eligible clients expressed substantial interest in school, and many were involved in educational activities. The most important reasons they gave for non-participation revolved around work and family responsibilities.
Working with DPSS staff, we designed a survey of the educational aspirations and experiences of TANF recipients who were eligible (but had not necessarily volunteered) for New Visions. DPSS mailed survey forms in early 2002 to all 919 New Visions-eligible recipients, with a follow-up mailing to non-respondents several weeks later. The survey achieved a 74-percent response (684 completes)—remarkable for any mail survey and particularly for a survey of low-income adults.
Respondents reported having very high educational aspirations. When asked to indicate their highest level of expected education, 45 percent cited a college degree (only nine percent currently held such a degree). Another third (33 percent) expected to earn a vocational or technical certificate or diploma, and 22 percent indicated no expectations beyond a high school degree or equivalent (not shown in exhibit).
A substantial fraction of respondents, 42 percent, reported being in an education or training program at the time of the survey (Exhibit 2.1), and an additional seven percent said they had been in an activity within the past 12 months (not shown in exhibit). The proportion currently in activities was substantially higher for respondents working 20-29 hours per week (66 percent) than for those working 30-39 hours (31 percent) or 40 hours or more (26 percent, see first row, Exhibit 2.1).
Of respondents not currently in school, the vast majority—85 percent—said they would like to go to school but were currently unable, and 45 percent said they planned to go back to school within the
24 For this purpose, DPSS used the Comprehensive Adult Student Assessment System (CASAS), a basic skills assessment that is widely used in adult education. Thresholds were based on median scores for tested TANF recipients who had a high school diploma or GED.
25 Phase 2 case managers only tested clients who came to see them and agreed to take the test. There was no requirement for Phase 2 clients either to come into the office or to take the test.
26 By April 2002, DPSS determined that 919 clients were eligible by virtue of their work hours and either having a high school credential or CASAS scores above the established threshold. A mail survey of this population (described in the next section) found that 14.7 percent did not have high school credentials, implying a 17-percent increase in the number eligible ([14.7/(100-14.7)] * 100 =17.2 percent). Had the agency been able to test all recipients meeting the work requirement, the increase likely would have been higher.
Chapter 2 Abt Associates Inc. 24

Exhibit 2.1Percent In and Planning to Go to Education and Training (E&T) by Hours Worked:
GAIN Recipients Eligible for New Visions
Education and Training Outcome Percent Currently in E&T Activity Percent Planning to Go to E&T Activity within Six Months (of those not Currently in E&T)
Hours Usually Worked in Current Job 20-29 30-39 40+ All 66.0 31.3 26.4 42.0 61.5 42.8 32.8 45.1
Sample Size (for row 1) 202 200 165 567
Note: Differences across work hours are statistically significant for both outcomes at the 99-percent confidence level. The sample excludes respondents not answering the relevant survey questions and an additional 13 percent who reported fewer than 20 hours of work. (Since all survey sample members initially were working 20+ hours, the attrition probably reflects changes in work hours between the points of initial selection and survey completion.)
Source: Spring 2002 “School, Work…and You Survey”
next six months. As shown in Exhibit 2.1, plans to go to school also were related strongly to current work hours.
These findings generally indicate very high interest and engagement in education and training, with a substantial fraction combining school with full-time employment. It is important to bear in mind that Riverside’s Phase 2 program had been underway for at least two years at the time of the survey and may be partly or largely responsible for this high level of engagement. Nearly 90 percent of respondents said that a GAIN case manager had encouraged them to participate in education and training.
Work schedules and financial constraints were the top reasons cited by recipients who wanted to go to school but were not able to go at the time of the survey.
When asked to indicate applicable reasons from a list, nearly two-thirds (65 percent) of respondents checked “work schedule” and 43 percent checked “I can’t afford school” (Exhibit 2.2). Other common barriers included finding the right program (25 percent); child care issues (24 percent); and transportation problems (22 percent). Few respondents identified English language skills (three percent) or opposition from a family member (one percent) as barriers (Exhibit 2.2).
When asked to indicate the most important reason that they were unable to go to school at this time, one quarter of respondents cited “another reason.” This group’s written explanations provide an interesting window into the breadth of circumstances that impede school. One set of comments focused on conflicts with work and parenting responsibilities:
• “I am working and I will not leave my four children at home when I am going to school at night.”
Abt Associates Inc. Chapter 2 25

Exhibit 2.2 Reasons for not Being Able to Go to School: New Visions-Eligible GAIN Recipients not in E&T
Who Indicated That They Were Interested in School
Percent Checking Reason as
“Most Important”
Percent Checking Reason Reason not Able to Go to School at this Time
My work schedule makes it hard to go to school 64.8 37.1 I can’t afford school 42.6 12.1 I can’t find a program that is right for me 25.5 7.7 It is hard to find child care 23.7 6.5 It is hard to find transportation 21.6 7.3 My academic skills are not strong enough 10.9 4.4 My English is not good enough 2.5 0.0 Someone in my family (other than my children) does not want me to go 1.3 0.0 Another reason 25.0 All reasons --- 100.0
Sample Size 324 248
Source: Spring 2002 “School, Work…and You Survey”
• “I don’t have the energy to work and go to school and be a single mom.” • “My mother requires help from me and I have a four-year-old that I would like to see grow
up!” • “I have too many medical problems with my children and no one for sick daycare or doctor
visits.”
Another set of comments focused on health problems and other personal stresses:
• “I am recovering from being in the intensive care unit at Riverside hospital.” • “I am experiencing depression/anxiety attacks.” • “[I had] a very unexpected pregnancy.” • “[I am] trying to get my life together: [I] just went through a divorce.”
A third category of reasons pertained to eligibility for E&T services through GAIN:
• “I was trained for medical billing… [but] it was hard to find a job… CalWORKS will not give me any more training.
• “CalWORKS gave me limited schooling. Now they say I must work…” • “I enrolled in New Visions, but then I lost my job.” • “I have to work for 90 days before I’m eligible to go back to school.” • “School doesn’t start until June.” • “I am waiting for an answer from [the] ACCESS [program], to see if I am able to [go].” • “I have to wait ‘til points come off my driving record…to go to truck driving school.”
Chapter 2 Abt Associates Inc. 26

Survey findings on awareness and take-up indicate that the New Visions marketing effort was quite successful.
Nearly three quarters (73) of the New Visions-eligible clients we surveyed said they had heard of the program, and more than a third (36 percent) of these (27 percent of all respondents) reported having volunteered. In light of the many barriers to going to school and the numerous alternative education and training options in the county, these statistics indicate substantial awareness and take-up. Why, then, did recruitment take so much longer than originally expected? The findings imply that the problems stemmed in large part from the small fractions of clients who were eligible for the program in the first place.
To learn more about reasons for not volunteering, the survey presented non-volunteers who were aware of New Visions with lists of possible reasons for not volunteering. Exactly half of this group said that they potentially were interested in the program, and the other half said they were not interested in New Visions. We gave each group a somewhat different list of reasons, as summarized in Exhibit 2.3.
Exhibit 2.3 Reasons for not Volunteering for New Visions, by Whether Respondents Said
That They Were or Were not Interested in the Program
Percent Checking Reason as “Most
Important” Percent Checking
Reason Reasons for not Volunteering Among respondents interested in NV My work schedule makes it hard to go to school 51.7 19.5 I haven’t had the time to apply 51.3 13.6 I need to learn more about NV before deciding 46.4 26.3 I can’t afford school 32.0 8.5 It is hard to find child care 18.7 7.6 It is hard to find transportation 18.0 1.7 My academic skills are not strong enough 11.3 6.8 My English is not good enough 4.0 .9 Another reason 15.3 All reasons --- 100.0 Sample size 156 118 Among respondents not interested in NV I am already in (or waiting to get in) to another program 40.7 18.9 I already have enough education to find the job I want 35.0 13.6 I do not want to give up time with my children 30.3 16.7 I don’t think New Visions will help me make more money 28.3 6.8 New Visions does not offer the training I want 26.8 10.6 New Visions takes too long to finish 16.0 2.3 Another reason 31.1 All reasons --- 100.0
Sample Size 153 132
Source: Spring 2002 “School, Work…and You Survey”
Abt Associates Inc. Chapter 2 27

Among the half who said that they were interested, work schedules, time to apply, and affordability were among the most frequently-chosen reasons. A substantial fraction indicated that they didn’t know enough about the program to decide, and this reason was the most frequently cited as most important. Smaller fractions cited other personal and family barriers. Write-in comments for those who checked “another reason” illustrate some of the underlying issues and the additional reason of changes in eligibility status:
• “I am extremely busy between work and my children’s special needs.” • “I don’t know [enough] about New Visions.” • “I’m waiting until my daughter goes to school.” • “I’m recovering from being in the hospital.” • “My work hours dropped.” • “I am moving out of state.”
Reasons the remaining half gave for not being interested in New Visions included not thinking that the program would help them, preferring another type of program, and not having interest in going to school generally. A fairly high fraction also checked “another reason” as the single most important one. In by far the largest group of write-ins under this category, respondents indicated that they already were in another program. Others cited specific reasons for preferring a program other than New Visions, such as:
• “From my understanding these are not degree programs, they are only certificates.” • “I do not want to go to college. I prefer a tech school.” • “I only need a few credits for my Associate’s [degree].” • “Job training would help me more than school.” • “I’m working already towards the goal of owning my own business, through workshop
seminars.”
In sum, our survey of eligible clients revealed considerable awareness of, and interest in, New Visions, as well as substantial interest in education and training generally. There also was substantial participation in New Visions and other programs.
2.2 Characteristics of TANF Recipients Who Volunteered for New Visions
In addition to simply filling chairs, successful recruitment requires convincing people to volunteer who are likely to benefit. Some TANF recipients may have too many personal and family demands and limitations to be able to absorb what the program has to offer. Others already may have the skills and supports needed to succeed in college. College bridge programs are best suited for people somewhere between these extremes.
Chapter 2 Abt Associates Inc. 28

New Visions attracted a diverse cross-section of TANF recipients. Their attributes indicate strengths and weaknesses on factors related to progress in school.
The evaluation gathered information on previous educational experiences, demographic characteristics, and employment situations for the entire study sample of 1,043 New Visions volunteers at the point they entered the study. Data sources include a Background Information Form (BIF) administered to all study participants (treatment and control) at the point of random assignment, RCC records on previous enrollment and course completion, and wage records obtained from California’s Economic Development Department.27 Summary statistics for varied characteristics appear in Exhibit 2.4.
Nearly all sample members had a high school diploma (71 percent) or equivalent (21 percent). A substantial fraction also had some college experience. RCC records showed that 28 percent of volunteers had been enrolled at the college previously and that 18 percent had completed at least one course. Responses on the BIF suggest an even higher fraction (41 percent) with some prior college experience (including attendance at other colleges).
Most volunteers appear to have viewed New Visions as a stepping stone to further college work. When asked what they expected to be doing in one year (after completing New Visions), a large majority (77 percent) included college in their plans.
Many were apprehensive about their academic readiness, however: two-fifths (39 percent) checked “academic skills” as an expected challenge in New Visions. In the next section, we will see that this apprehension was well-founded, as test scores indicate that a majority of volunteers indeed did have very low skills.
Demographically, New Visions volunteers represent a fairly typical cross-section of TANF recipients in the Southwestern U.S. The vast majority (94 percent) was female, many (45 percent) had children under age three, and 35 percent had three or more children. A majority (53 percent) had never married, and only 11 percent were living with a spouse. Whites, blacks, and Hispanics accounted for similar shares of the sample.
Nearly half the sample had received welfare for three or more of the five years prior to random assignment. By design, 87 percent currently were working, and only four percent said they had not worked at all in the past two years.28 A substantial fraction (43 percent) reported working 30 hours/week or more in their current or last job. Average hourly wages were only $6.42, and less than one in five respondents reported earning $8 or more an hour. Over a third expected to face transportation challenges in attending New Visions.
27 See Chapter 3 for a more complete description of these and other data sources. 28 As discussed in Chapter 1, the demonstration briefly allowed non-working recipients to volunteer with the
expectation that RCC would provide a work study job. The college was not ready to provide the number of work study jobs needed, and DPSS required all of these recipients to find unsubsidized employment.
Abt Associates Inc. Chapter 2 29

Exhibit 2.4 Characteristics of New Visions Sample
at the Time of Random Assignment
Percent in Group Characteristic
Educational Background High School Degree?
High school diploma 70.8 GED 21.4 No degree 7.9
Ever Attended Regular College? No 58.5 Yes 41.5
Ever Enrolled in RCC? (RCC records) No 72.3 Yes, no course completed 9.7 Yes, completed 1+ course 18.0
Expects Challenges in NV Due to Academic Skills? No 61.5 Yes 38.5
Expects To Be in College in One Year? No 23.4 Yes 76.6
Demographic Characteristics Gender
Female 94.1 Male 5.9
Marital Status Never married 53.4 Formerly married 35.4 Currently married 11.2
Number of Children 1 33.8 2 30.6 3 20.3 4+ 15.2
Age of Youngest Child Under 3 years 44.8 3-5 years 25.0 6 years and older 30.2
Continued
Chapter 2 Abt Associates Inc. 30

Exhibit 2.4 Characteristics of New Visions Sample
at the Time of Random Assignment (Cont.)
Percent in Group Characteristic
Race-Ethnicity White, non-Hispanic 33.6 Black, non-Hispanic 31.2 Hispanic 30.8 Other 4.5
Economic Characteristics Time on Welfare in Last 5 Years
<1 year 27.7 1-2 years 26.5 3-4 years 15.9 All 5 years 29.9
Employment Status Working 86.6 Not working, employed in the past 24 months 8.8 Not working, not employed in the past 24 months 4.6
Hours of Work/Week in Current/Last Job <20 15.1 20-29 41.7 30+ 43.2
Hourly Wages in Current/Last Job Under $6.00 22.7 $6.00-6.99 41.0 $7.00-7.99 18.0 $8.00 and over 18.2
Number of Quarters with Work in Last Year (Unemployment Insurance wage records)
0 21.3 1-3 48.3 4 30.4
Expects Transportation Challenges in NV? No 64.2 Yes 35.8
Sample Size 1,043
Source: Background Information Form, except where indicated otherwise.
Abt Associates Inc. Chapter 2 31

The academic skills of most New Visions volunteers were quite low.
In the previous chapter, we noted that experts believe that college bridge programs should target students with academic skills somewhere in the 7th-to-10th-grade range. Below 7th grade, it is unlikely that a short program will be able to raise skills sufficient for students to handle college work. Above this range, students may not need more than a light skills brush up.
For the most part, New Visions did not screen volunteers on the basis of academic ability.29 The demonstration’s designers felt that requiring a high school diploma or equivalent would be sufficient to screen out people at the low end of the scale, and they assumed that the most highly-skilled students would choose to go directly to regular college courses.
The degree requirement proved not to be a very effective way to screen out low ability. One data source is test scores for treatment group members who showed up for New Visions orientation and took the Test of Adult Basic Education (TABE). As summarized in Exhibit 2.5, the vast majority tested below the 7th-grade level in math (70 percent), and half fell below the 7th-grade level in language (50 percent).30 Only about a quarter of the sample tested in the 7th-10th grade range recommended for bridge programs. At the other extreme, although 25 percent demonstrated skills above the 10th grade level in language, very few (two percent) did so in math.
Exhibit 2.5 Percent of New Visions Volunteers by Initial Math and Language Skill Levels
70.2
27.8
2.0
50.4
25.0 24.6
0.0
10.0
20.0
30.0
40.0
50.0
60.0
70.0
80.0
Perc
ent o
f NV
Stu
dent
s
Math Language
Below 7th Grade 7th-10th Grade Above 10th Grade
Level of Academic Skills
Note: Statistics for 252 treatment group members who showed up for New Visions orientation and took the Test of Adult Basic Skills (TABE).
29 Midway through the intake period, RCC and DPSS began recruiting for the demonstration clients with acceptable academic skills in lieu of high school credentials, with “acceptable” defined as a CASAS test score at or above the median for GAIN participants with a high school diploma/equivalent.
30 RCC did not administer the TABE reading test to New Visions students.
Chapter 2 Abt Associates Inc. 32

Why were skill levels so low? In interviews, several DPSS case managers told us that they saw New Visions primarily as a program for low-skilled clients and steered academically better-prepared clients elsewhere (encouraging some to enroll in RCC directly). There is also evidence from other research that welfare recipients have poorer academic skills than the general population at comparable levels of formal schooling (Johnson & Tafoyer, 1999).
Data from a separate RCC assessment used for all entering students support comparisons between New Visions participants, other CalWORKS students, and students at RCC who were not welfare recipients.31 We classified scores into three groups, corresponding to whether students were ready only for low-level courses not offering credit towards an RCC degree, mid-level preparatory courses offering RCC degree credits, or higher-level degree credit courses.
These comparisons, summarized in Exhibit 2.6, show that New Visions volunteers’ academic skills fell well below non-TANF students and somewhat below welfare recipients who enrolled at RCC directly (without New Visions). In math, only two percent of New Visions volunteers tested into the highest category, compared with 11 percent of other welfare recipients and 37 percent of other RCC students (see top panel, Exhibit 2.6). Nearly two-thirds (64 percent) of New Visions volunteers fell in to the lowest category, compared with just over half (56 percent) of other welfare recipients and under a third (31 percent) of regular students. English and reading scores show similar differences (middle and bottom panels of Exhibit 2.6).
Statistics in Exhibits 2.5 and 2.6 indicate that a majority of New Visions volunteers began the program with skills too far below readiness for community college occupational training to be likely to be bridged by an intensive six-month program. It is important to recall that improved skills nonetheless might be useful at work in the short run and thus foster job retention and advancement, even if it does not lead to further community college training. Improved academic skills also might put participants in a better position to benefit from (non-college) vocational training programs designed for disadvantaged adults.
Although other welfare recipients and non-recipient students at RCC had higher average test scores than New Visions volunteers, substantial majorities in the former two groups also required preparatory work in math and English. These numbers underscore the substantial challenges facing community colleges generally in fulfilling their mission of expanding educational opportunities for less advantaged populations in their communities.
2.3 Factors Associated with Core Program Completion
The challenge of engaging welfare recipients in programs like New Visions only begins with successful recruitment. As reported in this section, New Visions suffered substantial losses from early no-shows, as well as from drop-outs among students who initially did show up for the core program.
31 The tests on which these analyses are based have changed somewhat over time. The college currently uses an assessment tool called Accuplacer, an internet-based assessment system developed by the College Board.
Abt Associates Inc. Chapter 2 33

Exhibit 2.6 Initial Math, English, and Reading Scores of New Visions Volunteers Compared with
Other CalWORKS Students and non-CalWORKS Students at RCC
Math 100
80
60 Percent
40
20
0 New Visions Other CalWORKS RCC Students Volunteers Students Not on Welfare
(n=409) (n=540)*** (n=67,899)***
64 56
31
33 33
2 11
37
17
English 100
80
60 Percent
40
20
0
55
29
33 41
43
12 14 27
39
New Visions Other CalWORKS RCC Students Volunteers Students Not on Welfare
(n=460) (n=544)*** (n=68,669)***
Reading 100
80
60Percent
40
20
0
36 32
37 32
29
27 36
51
14
New Visions Other CalWORKS RCC Students Volunteers Students Not on Welfare
(n=461) (n=545)** (n=68,678)***
Ready for college-level coursework Needs mid-level preparatory coursework Needs low-level preparatory coursework
***Differences in test score distribution compared to New Visions participants is significant at the 99-percent level; ** at the 95-percent level; * at the 90-percent level; ns not significant. Source: RCC placement assessment records. Data for New Visions volunteers include both treatment and control group members enrolling in RCC course.
Chapter 2 Abt Associates Inc. 34

Most treatment group members (73 percent) did not complete the New Visions core program.
Among all volunteers assigned to the treatment group, only 62 percent showed up for the program orientation and, of the latter, only 44 percent (27 percent of all treatment group members) completed the core program (Exhibit 2.7, last line). The initial no-shows occurred during the period of up to six weeks that volunteers waited after random assignment for the next orientation to occur.
Exhibit 2.7 Number of New Visions Credits Earned by Program Completion Status
New Visions Program Credits New Visions Completion Status Earned Graduate Drop-Out No-Show All Average Number of Credits 11.9 2.1 0.0 4.0 Percent Earning
0 credits 0.0 46.2 100.0 53.6 <4 credits 0.0 31.0 0.0 11.5 4-6 credits 9.0 14.1 0.0 7.4 7-12 credits 43.7 8.7 0.0 15.0 13+ credits 45.8 0.0 0.0 12.5 Total 100.0 100.0 100.0 100.0
Sample Size 142 184 199 525 Percent of Treatment Group 27.3 34.8 37.9 100.0
Note: Chi square test indicates that the distribution for graduates differs from those for drop-outs and no-shows at the 99-percent confidence level. Sample excludes three cases whose credits and completion status were discrepant for reasons unknown. Source: RCC records.
Efforts to re-enroll no-shows and drop-outs largely took the form of telephone contacts by New Visions counselors. Program designers anticipated the benefits of open exit-open entry by providing opportunities to re-enroll in new cohorts starting every six weeks. Dividing courses up into one-half and one-unit segments was a way to provide a clear record of accomplishment on which to build after re-enrolling. Counselors sought to identify and help clients remove barriers and encourage them to re-enroll in the next cohort of enrollees.
Findings suggest that these efforts met with only limited success. For example, of initial no-shows (volunteers who did not appear in the quarter of, or immediately after, random assignment), just six percent enrolled in a later quarter. The fraction of all volunteers enrolled in New Visions at times beyond the normal program participation interval was only three percent, indicating that the net re-engagement rate for no-shows and drop-outs was quite low.32
More exactly, this statistic reflects the percent of all volunteers ever enrolled in New Visions later than three full calendar quarters after the quarter of random assignment. Although the program normally lasted 24 weeks (6 months), the actual dates often spanned three quarters, and the interval between random assignment and enrollment could be as long as six weeks.
Abt Associates Inc. Chapter 2 35
32

Of those who came to orientation but did not subsequently complete the New Visions core program, just over half (54 percent) earned at least some credits in the program (see Exhibit 2.7). Drop-outs who earned New Visions credits received 3.8 units on average (not shown in exhibit).
It is difficult to find statistics on comparable programs and populations to see if the New Visions no-show and drop-out rates were unusually high. Available statistics on several other programs show higher completion rates, but these statistics were for students who already had matriculated and were substantially less disadvantaged than the typical welfare recipient.33
One way to reduce the New Visions no-show rate might be to shorten the period between random assignment and program orientation, or to involve volunteers in meaningful activities during this period. Interests and situations can change rapidly, particularly when commitment to school is tentative from the start. Counselors did touch base with many participants by phone before orientation, but an emphasis on on-campus activities might have helped to create a stronger initial linkage to New Visions.
There is less reason to believe that the program could have done much more to increase retention after orientation. New Visions counselors and staff work fairly intensively with individual students and the program environment generally was very supportive.
A number of personal characteristics were associated with New Visions completion.
In this section, we examine the personal characteristics related to completing New Visions for insights into the circumstances associated with not showing up and dropping out from the program. In a later section, we look at the explanations New Visions counselors recorded during telephone calls they made to try to re-engage these groups in the program.
Statistics in the first column of Exhibit 2.8 show how different characteristics are related to the likelihood of completing New Visions, holding other factors constant. The estimates are based on multiple regression models estimated for all 528 members of the treatment group.34 In these models, the dependent variable is a 1-0 indicator for whether or not sample members completed the core program. 35 We started by estimating a model including terms for all of the characteristics shown in Exhibit 2.4 and then dropped characteristics that did not have a statistically significant association with program completion.36 The findings are as follows:
• Sample members who cited post-New Visions college plans were eight percentage points more likely to complete New Visions than those who did not plan to be in college after New
33 See programs described in Bloom & Sommo (2005) and Kazis & Liebowitz (2003). 34 We used a linear probability (OLS) model to obtain estimates in percentage terms more readily. We also
ran the logit models and found no differences in the characteristics that were statistically significant or in the ordering of coefficients by size.
35 We also ran separate models for the probability of initially showing up and, among shows, for the probability of completing the core program. Except in several instances noted below, coefficients generally had the same sign in both models and we thus present results only for overall completion.
36 In addition to the characteristics in Exhibit 2.4, the models included a cohort variable, with values ranging from 1 to 27 depending on how early or late the cohort enrolled in the demonstration.
Chapter 2 Abt Associates Inc. 36

Visions. This finding suggests that motivation is one factor helping participants to make it through bridge programs.
• Prior college experience was not significantly associated with the likelihood of New Visions completion and does not appear in Exhibit 2.8 for that reason.37
Exhibit 2.8 Associations between New Visions Core Program Completion and Varying
Personal Characteristics: Treatment Groupa
Characteristic Coefficientb Standard ErrorExpects To Be in College in One Year 8.3* 4.5 Expects Challenges in NV Due to Academic Skills 8.6** 3.8
Ever Married 10.4*** 3.9 c Number of Children
2 7.2 4.83 -1.4 5.64 or more -3.3 6.0
Race d
Hispanic -0.6 4.9Black, non-Hispanic -11.8** 4.7 Other -16.4* 8.8
Expects Transportation Challenges in NV 6.5* 3.9 Received Welfare at Least Two Months During the Second Quarter
after RA 5.9*** 1.5 Cohort (1-27, ranging from earliest to latest enrollees) -0.7** 0.3
Intercept 10.9 8.5Adjusted R2 .087 --
Sample Size 528 --
a The outcome in this table is coded as “1” if participant showed up and completed New Visions and “0” otherwise. All covariates are measured as of baseline—i.e., random assignment—except the term measuring welfare receipt during the second quarter following random assignment. b Estimates from Ordinary Least Squares regression model including all covariates shown in the table. Coefficient estimates represent the change in the probability of earning credits associated with a one-unit increase in each covariate, holding other characteristics constant. Tests of a larger model found no othercovariates from Exhibit 2.4 to be significant. Excluding these terms had little effect on coefficients for the remaining covariates, although coefficients for recipients with 2 children were significant in the larger, but not the smaller, model. c Effects are relative to omitted category of participants with 1 child. d Effects are relative to omitted category of whites. *** Association statistically significant at the 99-percent confidence level; **at the 95-percent confidence level; *at the 90-percent confidence level. Source: RCC records, Background Information Form, various DPSS administrative records.
A more detailed analysis revealed that self-reported prior college attendance increased the probability of initially showing up for New Visions, but not the probability of completing the program among those who showed. Another indicator, having earned RCC credits previously, was not associated with showing up but was related positively to the completion rate (conditional on showing up).
Abt Associates Inc. Chapter 2 37
37

• Respondents who cited “academic skills” as an expected challenge in New Visions were nine percentage points more likely to complete New Visions than those who did not cite this challenge. This finding may indicate that students who recognized skills challenges had a more realistic sense of their needs and thus were better prepared to take advantage of New Visions. Initial math test scores (but not language scores) were associated positively with program completion among those who came to orientation, though the relationship was not statistically significant (p<.15).38
• Volunteers who had ever married were ten percentage points more likely to finish New Visions than those who had not. Marriage may be selective on social skills and other personal strengths that also contribute to positive school outcomes. Marriage also may itself support success through material and emotional help from a spouse, and possibly from an enlarged family network.
• Having young children did not affect the likelihood of program completion. • Number of children also had no systematic relationship with program completion.39
• Blacks were 12 percentage points less likely to graduate than Hispanic or white volunteers, reflecting personal and family challenges not captured in other covariates.40
• There was little relationship between a variety of welfare and work backgroundcharacteristics and New Visions graduation.41
• Volunteers who initially cited transportation as an expected challenge were more likely to complete the program than those who did not. The finding, which is similar to that for expected academic challenges, also may indicate a more realistic outlook, as well as a greater need for supports provided to New Visions students.42
• Not surprisingly, welfare exits after random assignment sharply reduced the likelihood of program completion. The completion rate for volunteers who received at least two months of welfare in the second follow-up quarter (76 percent of the sample) was 17 points higher than for those with less than two months of receipt.
• Being in a later cohort was associated with a substantially lower likelihood of completion than being in a cohort that enrolled in New Visions earlier in the demonstration. (The average completion rate for the last five cohorts was 15 percentage points lower than that for the first five cohorts.) This result could be because levels of ability and motivation declined as the program had to dig deeper into the caseload to sustain recruitment targets over time, or it could be that efforts to engage and retain participants weakened over time.
38 Scores for no-shows are not available because New Visions administered the Test of Adult Basic Education only to treatment group members who came to orientation.
39 Number of children, though statistically in significant, is shown in Exhibit 2.8 because the coefficient for 2 children was statistically significant (p<.10) in the larger model.
40 Reporting an “other race” also was associated with a lower likelihood of program completion. 41 There were several indications of complexity underlying the absence of associations with net completion
for these characteristics. For example, more welfare receipt prior to random assignment raised the likelihood of initially showing up for New Visions but bore no clear relationship to subsequent retention. Working less than 20 hours initially—an exception allowed briefly to promote recruitment—increased the show rate substantially (by 15 percentage points, compared with those working 20-29 hours), but then dramatically reduced the fraction of shows completing the program (by 17 percentage points) when the program was unable to deliver work study jobs to this group.
42 Although New Visions did not provide special transportation services, case managers and counselors may have been effective in helping students to arrange their transportation.
Chapter 2 Abt Associates Inc. 38

Although these analyses are useful for establishing some of the personal characteristics associated with program completion, they explained only a small amount (nine percent) of the variation in program completion. One likely reason is that the measured characteristics did not fully capture motivation and other barriers and supports affecting completion. In particular, our measures do not capture very well events occurring after random assignment that interfered with school. We were able to measure one potentially important post-baseline factor: the amount of time participants spent working while receiving welfare. Analyses in the next section suggest that work hours were strongly associated with program completion.
Treatment group members who worked 120 hours or more per month were substantially less likely than those working 80-119 hours to remain in New Visions or participate in other E&T activities, controlling for other factors. The finding implies that balancing school with work and family grows substantially more difficult when work exceeds 30 hours per week
The New Visions demonstration offers an important opportunity to examine the choices welfare recipients make when they are required to work and encouraged to go to school at the same time. Beyond helping to understand factors at work in completing New Visions core program, information on such choices is pertinent to the national debate on the threshold beyond which TANF work requirements may be incompatible with education and training.
In this section, we analyze how rates of participation in New Visions and in any GAIN E&T activity differed in months where treatment group members worked varying amounts. Our measures for school participation and work hours are based on monthly records from the DPSS automated information system, assembled into a longitudinal data file containing multiple records for each sample member. The analysis is restricted to months with welfare receipt and at least 80 hours of work. In analyzing New Visions participation, we include only the first 12 follow-up months and exclude months where recipients participated in other (non-New Visions) GAIN E&T activities (a total of 1,865 person-months). In analyzing GAIN E&T participation, we include the first 24 follow-up months (3,388 person-months).
The models represented the outcomes—participation in New Visions and in any GAIN E&T activity—as 1-0 dependent variables. The key independent variables were a series of 1-0 indicators of whether in a month treatment group members were working: 80-99, 100-119, 120-139, 140-159, or 160 or more hours. The analyses controlled for a series of personal and family characteristics (the set listed in Exhibit 2.4) and adjusted standard errors to correct for inter-correlation of months within individuals.
Estimated participation rates are shown in Exhibit 2.9 for New Visions (solid lines) and for any GAIN activity (broken lines) at different levels of work. Results indicate that there is a threshold—120 hours of work/month—beyond which treatment group members are substantially less likely to participate in New Visions or other GAIN E&T activities. Compared with months with 80-99 hours of work, E&T participation is only slightly lower in months with 100-119 work hours. Participation falls by 14-15 percentage points when work reaches 120-139-hours and remains at that level at higher amounts of work.
Abt Associates Inc. Chapter 2 39

Exhibit 2.9 Percent Participating in New Visions and in Any GAIN E&T Activity
in Months Treatment Group Members Were on TANF, by Hours Worked per Month
56.1
50.2
41.6
43.5
41.3
54.1
51.1
40.1
36.6
41.2
20
25
30
35
40
45
50
55
60
Perc
ent P
artic
ipat
ing
in A
ctiv
ity
Any GAIN E&T
New Visions
80-99 100-119 120-139 140-159 160+
Hours Worked per Month
Note: Estimates are from OLS models regressing E&T participation on work hours in months with welfare and 80+ hours of work. New Visions estimates are based on the first 12 months (1,865 person months) and GAIN estimates on the first 24 months (3,388 person months) after random assignment. Models also control for a series of baseline characteristics, and standard errors are adjusted for within-person clustering of months. Compared to the reference category of 80-99 hours, all participation rates for 120-139 hours category and above are significantly lower at the 99-percent confidence level; GAIN E&T participation for 100-119 hours is significantly lower at the 90-percent level; and New Visions participation for 100-119 hours is not statistically different. R2s are 15% for the New Visions model and 10% for the GAIN E&T model.
Source: GAIN records (monthly E&T participation, work hours); Baseline Information Form.
Chapter 2 Abt Associates Inc. 40

The proportion of observed months with 120 hours of work or more in these samples are fairly high— 57.3 and 55.3 percent, respectively, in the sample months for New Visions and any E&T analyses. Thus, substantial numbers of recipients chose—or perhaps, their employers required—more hours of work than GAIN requires or is conducive to attending school.
Although non-experimental, we have some confidence that the observed relationships between work hours and E&T are causal, since controlling for many other covariates had little effect on the estimates. These analyses do not identify the predominant direction of causation, however; that is, whether decisions to work influence school decisions or vice versa. Anecdotal evidence suggests that both mechanisms were at play. As seen in the next section, counselors reported work schedules and hours as contributing to a fairly high fraction of no-shows and drop-outs. In fieldwork, DPSS administrators told us that they encouraged Phase 2 case managers to work with students to keep their work hours at manageable levels (but above the 20 hours/week standard).
Although hours worked are associated strongly with monthly E&T participation rates, the regression models still account only for a small fraction of the variance in completion probabilities.43 We did not have data on many other circumstances and events suitable for including in these regression models. Fortunately, we are able to get a good sense of the kinds of issues that arose from records kept by New Visions counselors.
New Visions counselors’ notes indicate that work schedules, program preferences, changes in eligibility status, and a variety of other personal and family issues explain failures to appear and complete the program.
New Visions counselors documented reasons for no-shows and drop-outs in their efforts to re-engage these two groups. Counselors’ notes, recorded in electronic spreadsheets, document reasons for 53 no-shows (25 percent of all no-shows) and 109 drop-outs (54 percent of all drop-outs). Most of these contacts occurred by telephone.
Difficulties in meshing New Visions with work schedules accounted for roughly comparable—and substantial—shares of reasons for no-shows and drop-outs, representing around three out of ten reasons in each group (see Exhibit 2.10, second row). Pure “scheduling problems” seem to be somewhat more salient for drop-outs and no-shows than unwillingness to sacrifice work and family opportunities for school (which were more salient as reasons in initial volunteering decisions, as reported earlier in this chapter). Roughly similar fractions of no-shows and drop-outs were due to loss of New Visions eligibility (23 and 15 percent, respectively—a statistically insignificant difference).
Work hours and other covariates explained only 15 percent of the total variance in New Visions participation and 10 percent of the variance in participation in any GAIN E&T activity. The former statistic is not directly comparable with the R2 (9 percent) for New Visions completion Exhibit 2.8, as monthly participation and core program completion are somewhat different (albeit closely-related) outcomes.
Abt Associates Inc. Chapter 2 41
43

Exhibit 2.10 Reasons for No-Shows and Drop-Outs Established by New Visions Counselors
Reason No-Shows Drop-Outs Category Pct. Illustrative reasons Pct. Illustrative reasons Prefers Another Program
34.0 • Student decided to enter the Early Childhood Fast Track program instead.
• Student is not interested in NV. • GAIN counselor suggested a
different program. • Student is attending classes on a
different campus.
15.0 • Student went into ACCESS program for medical assisting instead.
• Student believes that NV does not fit her academic needs.
• Student decided to go into a different program because she had already taken many of the courses that count for NV.
Work Hours/ Schedule
0.2 • Student leaves work too late to make it to campus.
• Student works from 1pm to 10pm as a machinist and loves her job so much that she is unwilling to give up work hours.
• Student works full-time
27.1 • Work schedule conflicts with class schedule.
• Student is working full-time and cannot be on campus when classes meet.
Change in Eligibility Status
22.6 • Student has not yet been a California resident for a year.
• Student is no longer on aid. • Student filed taxes in another
state. • Student does not work enough
hours. • Moved out of area (5 persons)
15.0 • Student is no longer on aid. • Student does not work. • Moved out of area (10 persons)
Other Personal and Family Reasons
13.2 • Student has health problems and has undergone major surgery.
• Student is homeless. • Student is pregnant. • Childcare issues. • Student is dealing with the death
of a parent.
42.9 • Student said that NV is too easy. • Student had to go to adult skill
to learn some basic skills before she comes back to NV.
• Poor English skills • Student has a medical condition. • Student is pregnant. • Student is homeless. • Student was involved in car
accident. • Childcare issues. • Student’s son is sick. • Student has been caring for
dying grandmother. • Student’s car broke down. • Student does not own a car and
the bus cannot get her from work to RCC in time for class.
All Reasons 100.0 100.0
Sample Size 53 109
Source: Notes from records counselor kept of contacts to re-engage no-shows and drop-outs in New Visions.
Chapter 2 Abt Associates Inc. 42
Having second thoughts about the program was more likely to be a reason for initial no-shows (34 percent) than for subsequent drop-outs (15 percent of reasons).44 This finding makes sense, since people who begin a program probably have more confidence that it is what they want than those who decide not to come in the first place. The finding also suggests that volunteers were receiving and acting on information on other Phase 2 programs in the period between random assignment and the next New Visions cohort start-date.
Personal and family difficulties emerging after random assignment accounted for 43 percent of dropouts but only 13 percent of no-shows, as might be expected given the longer time window between random assignment and the former (allowing for more problems to emerge).45 The difficulties recorded in this category are quite diverse and include academic, health, housing, family, transportation, and other issues. An implication is that reducing drop-out rates appreciably will require helping participants with a variety of issues. In light of the fact that New Visions did offer substantial support to each participant, such a reduction may be difficult to achieve.
2.4 Experiences in the Core Program
The quality of experiences in the core program is another key ingredient in program impacts, in addition to volunteers’ characteristics and core program completion. An earlier report (Fein et al., 2003) analyzed these experiences in detail. This section briefly summarizes the earlier findings and reports pre-post changes in academic skills for program completers based on the Test of Adult Basic Education (TABE).
Most students reported positive experiences in New Visions.
In interviews with a small sample (29) of current and former students, nearly all respondents had very positive reactions to New Visions’ courses, staff, and general environment.46 About half felt that the courses were taught at the right level, and they found most of the instructors to be enthusiastic, warm, and effective.47 Students especially liked instructors who combined high expectations with an engaging manner. A repeated observation was that the math and computer classes had helped to break down longstanding fears of these subjects (developing basic facility with computers was especially satisfying), and students also appreciated the Internet experience they gained through the reading class. Many credited English with giving them the skills to communicate more effectively with their employers, their customers, and their children’s teachers. Students cited the guidance course as equipping them to deal with problems and plan their lives, as well as helping them to improve their social skills and self-esteem.
44 This difference is statistically significant at the 95-percent confidence level. 45 This difference is statistically significant at the 99-percent confidence level. 46 Evaluation staff conducted in-person interviews with 21 students in October 2000 and with 15 students
(including re-interviews with seven students) in November 2001. Fein et al. (2003) provide further details on results from these interviews.
47 Several graduates who went on to other RCC courses felt that the core New Visions courses needed to be more advanced to prepare students for regular college classes.
Abt Associates Inc. Chapter 2 43

When asked about skills useful at work, about half of the students we spoke to were able to identify specific ways they had used things they had learned at New Visions at work and home. Examples included improved ability to tally receipts and calculate percentages in retail sales jobs, and better oral and written communications with supervisors and customers. At home, several students reported that their own school work had helped to foster a better learning climate for their children, both from the role model they provided as students and from their improved ability to help with their children’s homework.
Finally, student feedback indicates that New Visions succeeded in creating a strong learning community. Students liked especially the opportunity to go to school with other people in similar situations, the friendliness of the faculty and staff, and being on a college campus and having access to its resources.
Academic skills increased by over one grade level for the average core program completer.
RCC obtained repeated measures of academic skills for New Visions graduates, who took the Test of Adult Basic Education (TABE) once at intake and once at graduation from the core program. Only 98 and 83 students, respectively, took the math and language tests at both time points, however. Thus, findings may not apply exactly to the full population of graduates. 48
The average New Visions graduate’s math test scores increased by 1.5 grades (to grade 7.3) and her language scores increased by 1.2 grades (to grade 8.3). Before New Visions, only one percent tested above 10th grade level (college ready) in math, while 18 percent did so after graduation—a 17percentage point gain. The pre- and post- fractions above the 10th grade level in language are 18 and 34 percent—a 16-point gain.
Some programs consider 9th-grade level skills sufficient to benefit from advanced technical certificate programs in fields such as manufacturing, office technology and computer graphics (Kazis and Liebowitz, 2003). New Visions boosted the fractions meeting this standard from 10 percent to 31 percent in math, and from 37 percent to 46 percent in language.
In sum, some graduates’ skills increased to the level required by college-level occupational training programs, but most remained well-below this level. The average treatment group member likely experienced smaller gains than suggested by these statistics for graduates, since drop-outs and no-shows presumably experienced little or no benefits from New Visions.
2.5 Education and Training after the New Visions Core Program
A central New Visions goal was to equip students with skills and foster interests that would encourage them to continue their educations. In particular, the program model was based on the idea that students would move to occupational training programs at RCC after completing the core program. In this section, we document treatment group members’ educational experiences after leaving the New Visions core program and analyze the characteristics and circumstances associated with continuing at RCC.
48 Post-New Visions TABE assessments were not administered to no-shows and dropouts.
Chapter 2 Abt Associates Inc. 44

After leaving New Visions, participants who graduated the program were much more likely to continue at RCC than those who dropped out or did not show up initially. No-shows and drop-outs were far less likely to pursue college but participated in other GAIN activities at about the same rate as graduates.
Treatment group members who completed the New Visions core program continued to pursue further schooling at a high rate. Two-thirds (67 percent) continued at RCC, and nearly three in ten (29 percent) went to other GAIN vocational training programs (Exhibit 2.11). New Visions graduates who continued at RCC earned an average of 14.8 additional credits.49
Exhibit 2.11 Education and Training Experiences of Treatment Group Members after Leaving the New
Visions Core Program (Summarized over Follow-Up Years 1-3)
Treatment Group Outcome Graduates Drop-outs No-shows All Ever Enrolled in a Non-New Visions Course
At RCC 67.4 24.5 17.5 33.5 At another California community college 0.0 1.6 4.5 2.3
Average Total RCC Credits Attempted, excluding New Visions 14.9 2.8 2.4 5.9 Earned, excluding New Visions 10.0 1.2 1.6 3.7 Earned, including New Visions 21.9 3.2 1.6 7.7
Number of RCC Degree Credits Earneda
Average 12.0 1.5 1.4 4.3 Percent earning 0 credits 10.4 62.0 90.0 58.5 Percent earning 1-5 credits 47.9 30.4 3.5 25.0 Percent earning 6+ credits 41.7 7.6 6.5 16.5
Ever Participated in Other GAIN E&T (non-RCC) 28.5 22.3 24.0 24.6 Average Total Months of GAIN Participation in
New Visions 6.8 3.6 .7 3.4 Other RCC 4.5 .6 1.1 1.8 Other GAIN 1.6 1.4 1.2 1.4 Any E&T activity 12.9 5.7 3.0 6.6
Sample Size 144 184 200 528
a Includes credits earned in the New Visions core program guidance course, the only core course earning regular degree credit.
Note: Other GAIN activities include vocational and basic education. All drop-out and no-show statistics differ statistically from those for graduates at the 99-percent confidence level, except: enrollment at another California community college (non-significant for drop-outs) and ever participation in other GAIN E&T (non-significant for both drop-outs and no-shows).
Source: Administrative records from the Riverside County DPSS GEARS system, the RCC enrollment management information system, and the statewide community college reporting system.
This statistic, not shown in Exhibit 2.11, is obtained by dividing the overall average of 10.0 credits earned by all graduates by .674, the proportion who enrolled in further classes after finishing New Visions.
Abt Associates Inc. Chapter 2 45
49

Although substantially fewer no-shows (18 percent) and drop-outs (25 percent) than core program graduates enrolled in non-New Visions courses at RCC, the fractions doing so were still respectable. This finding echoes anecdotal reports from counselors that a desire to enter college more quickly was one reason for not seeing New Visions through to the end. Some no-shows appear to have resulted from moves out of the area prior to orientation, rather than from a lessening of interest in college: a match to statewide community college records shows that five percent of no-shows enrolled in another California community college, compared with only two percent of drop-outs and no graduates (Exhibit 2.11, second line). Furthermore, participation in other education and training activities offered in Riverside’s GAIN program was nearly as high for no-shows (24 percent) and drop-outs (22 percent) as for New Visions graduates (28 percent).
Altogether, New Visions graduates spent substantially more time in E&T than non-graduates. Graduates averaged 12.9 months in GAIN E&T activities (including New Visions) over the three years after random assignment, compared with 5.7 months for drop-outs and 3.0 months for no-shows (Exhibit 2.11, last panel).
It is important to recognize that graduates’ higher level of college achievement is not necessarily a result of their New Visions experiences. Pre-existing differences in motivation, ability, and circumstances between graduates and non-graduates are likely to explain at least some of the post-New Visions performance gap. In Chapter 3, we will show that New Visions had a modest effect on regular college enrollments but little impact on course completion.
RCC records show that New Visions students took a wide variety of courses after finishing the core program (see Exhibit 2.12). One important category of courses represented the next steps in preparatory English and math sequences. Another popular choice was further training in computer software useful in office settings. Occupational fields with significant coursework included: business, education (especially early childhood studies), health services, and social services (counseling and social science).
The personal characteristics associated with earning RCC credits after New Visions differed somewhat from the characteristics related to core program completion.
To get a sense of the personal characteristics affecting college success, we conducted a multivariate analysis similar to the one reported earlier for core program completion. The dependent variable for this analysis was a 1-0 indicator for whether or not sample members earned any RCC credit after leaving New Visions, and the independent variables were indicators for the baseline characteristics shown in Exhibit 2.4. The analysis included all members of the treatment group. As in the previous analysis, we initially ran a model with all characteristics and then dropped characteristics with no statistically significant association with the outcome.
Chapter 2 Abt Associates Inc. 46

Exhibit 2.12 Areas of Study after Graduates Finished the New Visions Core Program
Percent Taking Courses in Area of
all Graduates Taking Courses Area of Study Detailed subjects
Computers/Electronics 55.1 Computer Information Systems (54), Graphics Technology (2)
Language 30.6 American Sign Language (4), English (25), English as a Second Language (3), Spanish (5)
Education 29.6 Early Childhood Studies (20), Reading (6), Speech Communication (8)
Business 26.7 Accounting (7), Business (18), Economics (18), Management (1), Marketing (1), Office Administration (21)
Medical 24.5 Anatomy and Physiology (4), Dental Technology (1), Health Science (11), Healthcare Technician (9), Medical Assisting (7), Nursing (5)
Mathematics 21.4 Mathematics (21) Social Science 21.4 Anthropology (1), History (7), Philosophy (5),
Political Science (4), Psychology (11), Sociology (11)
Physical Education 20.4 Physical Education (20) Counseling 17.4 Guidance (6), Human Services (11) Creative Arts 11.2 Art (3), Dance (2), Music (6), Theater (1) Science 6.1 Biology (5), Geography (1) Justice 5.1 Administration of Justice (5) Professions 5.1 Paralegal Studies (3), Real Estate (2) Work Experience 2.0 Work Experience (2) Engineering 0.0 Mechanics 0.0
Number of Graduates Taking any Regular RCC Course
98
Source: RCC enrollment records.
Given that core program completers were much more likely than no-shows and drop-outs to earn RCC credits in non-New Visions courses, we expected that the characteristics affecting core program completion and earning subsequent RCC credits would be similar. The results for subsequent credits differed in several respects, however, as seen in Exhibit 2.13:
• Initial plans for college after New Visions were even more strongly associated with post-program credits than with completing the core program. Treatment group members who said they planned to be in college after one year were 14 percentage points more likely to earn regular credits than those who had said they did not plan to be in college.
Abt Associates Inc. Chapter 2 47

Exhibit 2.13 Associations between Earning One or More Post-New Visions RCC Credit
and Varying Personal Characteristics: Treatment Groupa
Characteristic Coefficientb Standard Error Expects To Be in College in One Year (1-0) 14.2*** 4.3 Ever Attended Regular College (1-0) 13.2*** 4.2 Earned Credits at RCC (1-0) 6.3 5.4 Time on Welfare in Last 5 Years: 1-2 Years (1-0)c -10.2** 4.9 Time on Welfare in Last 5 Years: 3-4 Years (1-0)c -14.0** 5.6 Time on Welfare in Last 5 Years: 5 Years (1-0)c -11.0** 5.0 Wages (in $) -3.9* 2.2 Wages2 (in $) .4** .2 Cohort (1-27, ranging from earliest to latest enrollees) -.7** .3 Months on Welfare over the Follow-up Period .2** .1
Intercept 25.9 10.0 Adjusted R2 .085 --
Sample Size 528 --
a The outcome in this table is coded as “1” if participant earned one or more non-New Visions credits and “0” otherwise. All covariates are measured as of baseline—i.e., random assignment—except the term measuring months on welfare over the follow-up period. b Estimates from Ordinary Least Squares regression model including all covariates shown in the table. Coefficient estimates represent the change in the probability of earning credits associated with a one-unit increase in each covariate, holding other characteristics constant. Tests of a larger model found no othercovariates from Exhibit 2.4 to be significant. Excluding these terms had little effect on coefficients for the remaining covariates. c Effect is relative to omitted category of participants on welfare for less than one year.
*** Association statistically significant at the 99-percent confidence level; **at the 95-percent confidence level; *at the 90-percent confidence level.
Source: RCC records, Background Information Form, welfare records.
• A history of prior college attendance also was strongly predictive of post-New Visions credits, whereas it had not been associated with core program completion.
• Initial math scores, available only for treatment group members who came to orientation, also were related positively to earning post-core credits (results not shown in Exhibit 2.13).
• Economic situations at the time of random assignment also mattered. Participants who had entered the welfare rolls fairly recently were substantially more likely to go to college than those who had been on the rolls a year or more. Participants with lower wages in their current or last job before random assignment were somewhat more likely to earn regular credits than those with higher wages, possibly because cutting back on work hours entailed less sacrifice in income among the former than among the latter.
Chapter 2 Abt Associates Inc. 48

• The more months sample members received welfare after random assignment, the more likely they were to earn college credits. We cannot tell whether this result arose because welfare supports and GAIN policies encouraged school, or because wanting to go to school led people to use the supports DPSS provided for a longer time.
• Demographic characteristics associated with higher core program completion (e.g., marital history, number of children, race-ethnicity) were not significantly associated with the probability of earning non-New Visions RCC credits.
As in the core program completion analysis, these characteristics accounted for a small share (also nine percent) of the total variance in earning credits. Again, we look to counselors’ records for more detailed insights into reasons for not continuing at RCC. Specifically, Exhibit 2.14 tabulates reasons documented by counselors for 34 non-continuing core program graduates.
Exhibit 2.14 Reasons for not Enrolling in College after Completing the New Visions Core Program,
as Ascertained by New Visions Counselors
Explanatory Factor Percent Examples Work-Related 52.9 • Student is working full-time and does not have time for
school. • Student is doing community work so she can get a job
and does not have time for school. • Student gets home from work too late to go to school. • Student has a job and is not interested in going to school.
Personal barriers/emergencies 14.6 • Student is undergoing medical treatment. • Student has undergone surgery. • Unspecified personal problems. • Student is pregnant.
Moved out of area 8.8 Other family member 5.8 • Student has been out of town due to a family emergency.
• Student plans of moving to Nevada because of problems with her father.
Eligibility 5.8 • Student is off aid and needs assistance with school cost.
Transportation 5.8 • Student’s car was impounded for registration and she has not been able to retrieve it.
• Student lives a long bus ride away from campus.
Program preference 2.9 • Student has enlisted in the Navy.
Academic skills 2.9 • Student stopped going to school because classes were moving too fast for her.
Sample Size 34
Note: Sample is New Visions graduates who were not in school and who counselors were able to determine a reason. Counselors documented reasons during contacts aimed at re-engaging these persons in school.
Source: New Visions counselor contacts database.
Abt Associates Inc. Chapter 2 49

Issues related to work were identified as reasons for not going to college for just over half of the graduates who were not at RCC. Health and other personal issues formed the second largest category of reasons. Other problems documented included: issues concerning other family members, inability to afford school, transportation, and academic skills.
2.6 Conclusions
This chapter has analyzed some of the challenges of targeting and engaging welfare recipients in a community college bridge program. Although they describe a particular program model, the findings nonetheless have more general implications.
One lesson is that care is needed to ensure that a sufficient number of target persons will be technically eligible and at academic skill levels likely to benefit from short college preparatory programs. The New Visions work and high school equivalency restrictions resulted in a small pool of eligible recipients, and, notwithstanding the high school diploma equivalency standard, the academic skills of a large fraction of recruits fell below levels likely to be bridged in a short preparatory program.
Despite the limited pool of eligible recipients, New Visions was able to convince a substantial fraction to volunteer. Furthermore, TANF recipients generally reported high educational aspirations and substantial participation in Phase 2 programs besides New Visions. These are impressive results, given the many countervailing pressures on low-income working single parents.
Our findings attest to the difficulties low-income single parents face in staying in school. Only 62 percent of New Visions volunteers actually showed up for the program, and only 44 percent of these (27 percent of all volunteers) completed the core program. Difficulties balancing school with work represented the largest single category of explanations. Participants who worked 30 or more hours a week were substantially less likely to finish the New Visions core program. A wide range of other challenges arose as well, ranging from personal and family illnesses and emergencies; changes in educational program preferences; and loss of eligibility resulting from changes in work hours, TANF exits, and moves out of the area.
The substantial drop-out rate is sobering given the high quality of supports and instruction in the core program. New Visions offered intensive personal guidance and counseling and a supportive learning community. Participants consistently praised the environment and quality of instruction.
The quality of instruction is evidenced also by the finding that math and language skills increased by over a grade among participants who did finish the core program. Even still, the fractions of completers who had reached the 10th grade threshold for math and language skills (18 and 34 percent, respectively) were fairly low. It thus is notable that 67 percent enrolled in regular RCC courses and that 41 percent accumulated six or more regular credits in the three years after random assignment (implying some credits beyond the three-credit New Visions guidance course).
Although there may be little potential for participants with low initial academic skills to succeed in college, New Visions nonetheless might impart skills useful at work and home, as well as in moving onto other kinds of training. A substantial fraction of core program completers (28 percent) did go on to E&T programs at other kinds of institutions.
Chapter 2 Abt Associates Inc. 50
A variety of other factors emerged from our analyses as correlates of continuing in college after the New Visions core program. The single most important was competition from work. In follow-up calls by counselors, more than half of non-continuers cited work-related conflicts as the reason they were not in college. Statistical analyses also showed that motivation and prior college experience at random assignment strongly predicted a higher likelihood of enrolling in regular RCC courses, whereas longer previous welfare history and higher wages predicted a lower likelihood. Staying on welfare longer after random assignment, in contrast, was associated with higher rates of enrollment in regular courses—perhaps because welfare provided needed financial support and encouragement (through Phase 2 case management) to continue in school.
Although we have learned a great deal in this chapter about the factors associated with positive New Visions outcomes, the findings do not isolate New Visions’ causal effects on educational and economic outcomes. In the next chapter, we provide impact analyses based on the New Visions experimental design.
Abt Associates Inc. Chapter 2 51


Chapter 3 New Visions’ Educational and Economic Impacts
New Visions’ developers hoped that the core program would increase workplace, as well as academic, skills—stimulating upward wage and job mobility in the workplace in the short run, as well as fostering progress in college and careers over the long term. The philosophy was that both short- and long-term gains could be obtained by encouraging participants to keep one foot each in the worlds of school and work, acquiring academic and life skills through a structured curriculum and then applying those skills on the job. Developers understood that continued reliance on welfare was likely while participants were in school, but over the longer term they hoped to see increased earnings and decreased welfare dependence.
In this chapter, we assess whether these hopes came to fruition. In the first section of this chapter, we provide more detail on the methods and data underlying the impact analysis. Subsequent sections present findings for key study outcomes: GAIN employment and training activities, community college enrollment and achievement, employment and earnings, and TANF receipt and payments. After looking at results for the full sample, we analyze differences in impacts across different subgroups of participants.
3.1 Approach
The experiment randomly assigned New Visions volunteers into one of two groups: a treatment group that was allowed to participate in New Visions and a control group that was not allowed to participate. Random assignment ensures that the initial (baseline) characteristics of these two groups are very similar, differing only by chance. Both groups subsequently experienced the same local economic and social conditions. The only systematic difference was that treatment group members were allowed to participate in New Visions, while control group members were not allowed to participate in New Visions but could participate in other education and training programs offered through GAIN.
We calculate impacts as the difference between average outcomes for treatment and control group members. Following standard practice, we use regression adjustment to improve precision and guard against chance differences between the treatment and control groups arising at random assignment.50
Below, we describe the sample, outcome measures and data sources for the analysis. We distinguish also two kinds of impacts presented in this chapter, impacts of the “intention to treat” and the impacts of the “treatment on the treated.”
50 Specifically, the regression models represented each outcome variable (e.g., the amount of welfare payments received in a quarter) as a function of a treatment-control indicator (with 1 representing a treatment group member and 0 a control group member) and a series of baseline variables. The baseline variables included a measure of the outcome prior to random assignment, race/ethnicity, age of the adult, age of the youngest child, marital status, TANF receipt history, and work experience.
Abt Associates Inc. Chapter 3 53
Sample and Follow-up Horizon
Intake for the experiment extended from September 1998 to May 2002. Analyses in this chapter are based on a sample size of 1,043 volunteers, including 528 treatment group members and 515 control group members.51 Although recruitment and random assignment were ongoing, the program grouped volunteers into 27 discrete cohorts, who started the program at approximately six-week intervals.52
We analyze impacts for most outcomes over a three-year follow-up period: the exception is employment and earnings outcomes, for which we have only 2 ½ years of follow-up data.
We provide results also for a sub-sample of 457 early volunteers for whom we were able to observe impacts for up to 4 ½ years. To ascertain whether New Visions worked better for some people than for others, we provide also estimates for subgroups of the full sample defined on the basis of six characteristics hypothesized to condition responses to the program. We discuss these characteristics and associated hypotheses later in the chapter.
Data Sources
The impact study draws on data from a several sources. These sources include administrative information systems maintained by DPSS, RCC, and state agencies, as well as a Background Information Form developed for the evaluation and administered at random assignment.
Participation in GAIN Employment and Education and Training (E&T) Activities. Impacts on E&T participation are measured using automated records from DPSS’s GAIN Employment Activity Reporting System (GEARS). These data include all types of E&T activities recorded by DPSS case workers. The data do not capture any activities in which New Visions sample members participated on their own (i.e., outside of the GAIN program). Data used in analyses in this report extend from the month of random assignment through June 2004.
Community College Enrollment and Achievement. To estimate impacts on college enrollment and credits, RCC provided course-level data for every New Visions sample member who ever enrolled at RCC. The data extend from several years before random assignment through the Summer 2004 term. We also obtained data from the California Community Colleges Chancellor’s Office (CCCCO) on enrollment at all public two-year colleges in California. These data, which capture enrollment in community colleges statewide only for the Fall 1994 through Fall 2003 terms, showed very little enrollment at community colleges other than RCC. In contrast to the GEARS data, the RCC and CCCCO data measure enrollments regardless of whether participants were receiving welfare or had moved to another California county. In addition to enrollments, both RCC and CCCCO provided information on degrees, certificates, and academic credits earned by sample members.
51 This sample excludes the first 33 recipients to volunteer for New Visions. Early confusion about random assignment procedures resulted in an anomalously high rate of enrollment (42 percent) in non-New Visions classes for the first cohort compared with other cohorts (typically five percent).
52 As explained in earlier chapters, New Visions provided relatively frequent opportunities to start the six-month program (compared with regular college semester dates) in order to minimize waiting times, increase the likelihood of volunteers actually showing up, and make it easier for drop-outs to re-enroll in the program.
Chapter 3 Abt Associates Inc. 54
Earnings and Employment. We measure earnings and employment using quarterly wage data from California’s Unemployment Insurance (UI) reporting system. These data, provided by the California Employment Development Department, cover the vast majority of jobs, but generally exclude self-employment, casual employment, and other jobs not covered by the UI system. Although the UI data miss some jobs, omission rates are likely to be very similar for treatment and control group members—implying little bias in impact estimates (Kornfeld & Bloom, 1999). The measures reflect employment anywhere in California and cover a period extending from early 1998 through the end of 2003. Due to standard reporting lags in the UI system, we were able to measure employment and earnings for a slightly shorter follow-up period (2 ½ years) than other outcomes (three years) for the full sample.
TANF Payments and Receipt. DPSS provided monthly administrative records for the purpose of estimating impacts on TANF use. Data for this report cover the period from random assignment through June 2004. Because California’s TANF program is county-administered and each county maintains a separate information system, our statistics reflect only TANF receipt in Riverside County. We were not able to measure out-migration, but it seems unlikely to have created significant bias.53
Baseline Data. DPSS and RCC used a Background Information Form (BIF) to collect information on the status and characteristics of New Visions volunteers as of random assignment. DPSS and RCC collected BIF data for all but five individuals in the full sample of 1,043 volunteers. These data were used to create covariates for regression models used to estimate program impacts, as described below.
Interpreting the Impact Estimates
Impact estimates represent the difference between average outcomes actually observed under New Visions and the average outcomes for a control group that did not have the opportunity to participate in New Visions. As explained earlier, random assignment provides a control group whose initial characteristics are just like those of the treatment group save for chance differences.54 Any subsequent differences in outcomes therefore can be attributed to the New Visions offer. For example, if average annual earnings one year after random assignment are $8,000 for treatment group
53 In order to lead to an appreciable bias in impact estimates, treatment and control group members would have to have moved out of the county at different rates. A hint that out-migration rates were fairly low and similar for treatment and control group members is that statewide CCCCO data show that only 4.4 and 3.7 percent of each group, respectively, ever enrolled in a community college other than RCC (not shown in exhibit). The treatment-control ratio of non-RCC enrollments, 1.19 (4.4/3.7) is nearly identical to the corresponding ratio for RCC enrollments (1.20) based on CCCCO data. (Note that estimated RCC enrollment rates are slightly lower in the CCCCO than in the RCC data because, as explained above, the former covered a slightly shorter follow-up period.) These non-RCC enrollments include enrollments in the three other community college districts in Riverside County, implying that the fractions enrolling in colleges outside Riverside County were even lower.
54 Of the 16 characteristics shown in Exhibit 2.4 in Chapter 2, treatment-control differences were statistically significant only for one characteristic: treatment group members were somewhat more likely to have a regular high school diploma (74 percent) and somewhat less likely to have a GED (19 percent) than control group members (67 and 24 percent, respectively), with similar small fractions having no degree. Our regression adjustments minimized bias from this and any unobserved chance differences by controlling for measures of each outcome prior to random assignment, as well as for several other personal characteristics. Controlling for high school degree/GED had no effect on the estimates.
Abt Associates Inc. Chapter 3 55

members and $7,000 for control group, the impact is a positive $1,000 and we say that New Visions led volunteers to earn $1,000 more on average than they would have absent the program
In interpreting the impact estimates, it is important to recognize that under DPSS Phase 2 policies case managers encouraged control, as well as treatment, group members to engage in education and training. The only difference was that treatment, but not control group, members were allowed to participate in New Visions. Hence, impacts reflect the difference in outcomes associated with New Visions compared with other education and training services available in the community—including community college—and not the effects of New Visions compared with no education and training.
We provide two different sets of impact estimates. The main set of impacts compares outcomes for all treatment and control group members, even though—as seen in Chapter 2—many of the former never showed up for the program. This first type of impact measures the effects of the opportunity to participate in New Visions and is referred to in the evaluation literature as intention to treat (ITT) impacts. Such estimates help us think about the effects a comparable implementation might produce elsewhere, assuming a similar no-show rate.
We also provide estimates restricted to sample members who actually enrolled in New Visions (i.e., showed up for the program’s orientation). The literature refers to such statistics as impacts of the treatment on the treated (TOT).55 TOT impacts are calculated by dividing the ITT impact estimates by the proportion of sample members who showed up for New Visions. They appear as a separate column in the main impact tables. TOT estimates provide a direct look at treatment efficacy and give us some idea of effects in an implementation where everyone showed up.
Strictly speaking the TOT estimates apply only to the group that did show up for New Visions, and we have seen in Chapter 2 that this group differs from no-shows on a number of characteristics. For this reason, the no-show estimates do not represent exactly the results we would find had the program managed to get 100 percent of volunteers to appear.
An assumption underlying the no-show adjustment is that the New Visions treatment had no effect on no-shows. Although any such effects seem likely to have been small compared to effects on shows, they are possible. For example, follow-up calls by counselors to convince no-shows to come to the program may have led to other responses—such as decisions to enroll in a different kind of program—that otherwise would not have occurred.56
3.2 Impacts on GAIN Education and Training (E&T) Participation
New Visions was designed to lead to further studies in regular occupational training programs at RCC, with a view towards movement onto and up career ladders leading to better economic outcomes. Although subsequent community college enrollment was a major goal, New Visions designers anticipated that some participants would prefer other E&T avenues. Also, although control group members could not participate in New Visions, Phase 2 case managers encouraged them to
55 This adjustment was introduced by Bloom (1984). See also Orr (1999, Chapter 2). 56 The “no effect” assumption is untenable for program drop-outs, who clearly experienced some aspects of
the program. We thus cannot use a comparable “drop-out” adjustment to isolate impacts for New Visions core program completers.
Chapter 3 Abt Associates Inc. 56

***
***
pursue other E&T opportunities. Any impacts on college or economic outcomes we measure under the New Visions demonstration design therefore reflect the net effects of any differences in the kinds and levels of training the two groups received. We start in this section by documenting the E&T experiences treatment and control group members had under GAIN. In Section 3.3, we will turn to impacts on community college enrollment, credits, and certificates and degrees.
More treatment than control group members participated in E&T, and treatment group members received more months of E&T.
According to DPSS administrative records, nearly 80 percent of treatment group members participated in a GAIN education and training activity at least sometime during the three-year follow-up period, compared to almost 60 percent of control group members (Exhibit 3.1, top row).57 In terms of the amount of training, the average treatment group member spent about 6½ months in E&T—almost two months more than the average control group member (Exhibit 3.1, second panel, top row). Excluding no-shows increases the treatment-control difference in training from two to three months (Exhibit 3.1, second panel, top row, last column).
Exhibit 3.1 Impacts on Education and Training Follow-Up Years 1-3, Full Sample
Impact adjusted for no-shows
Treatment Group
Control Group
Percentage Impact Outcome Impact
Ever participated, through GAIN, in: Any education & training activity (%) 78.8 58.6 20.2*** 34.4 32.5 New Visions (%) 68.9 0.0 68.9*** n.a. 100.0 Other RCC (%) 22.6 24.5 -1.9 -7.6 -3.0 Other GAIN (including basic ed.) (%) 27.8 46.8 -19.1*** -40.7 -30.7
Average total months of GAIN participation in:
Any education & training activity 6.4 4.5 1.9*** 41.2 3.0 New Visions 3.4 0.0 3.4*** n.a. 5.4 Other RCC 1.7 1.7 0.1 3.2 0.1 Other GAIN 1.7 3.1 -1.4*** -46.6 -2.3
Sample Size (total=1,043) 528 515
Note: a two-tailed test was applied to regression-adjusted impact estimates. Statistical significance levels are indicated as: * = 10 percent, ** = 5 percent, and *** = 1 percent
Source: Riverside County DPSS GEARS administrative records
Because impacts on E&T receipt are based on administrative records from Riverside County’s TANF system, they apply only to differences in E&T activities while sample members were on TANF. They thus do not provide unbiased estimates of impacts on overall E&T receipt.
Abt Associates Inc. Chapter 3 57
57
That these were fairly high levels of E&T participation also is evident when we consider that it applies only to months that sample members received TANF. The treatment group’s 6.4 months of E&T represents 33.5 percent of active TANF months, whereas the control group’s 4.5 months represents 25.9 percent of active TANF months.
Participation in the New Visions core program is the main reason E&T rates were higher for the treatment group than for the control group.
Although treatment group members had higher rates of E&T participation overall, control group members were substantially more likely than treatment group members to engage in activities outside RCC and about as likely to get training at RCC other than New Visions (Exhibit 3.1, rows 3-4 in each panel).58 The only reason that E&T participation was higher overall in the treatment group is that a high fraction of its members participated in the New Visions core program. The negative impacts on other (non-RCC) activities suggest that the core program was to some extent a substitute for other GAIN activities.
In essence, the experiment compares the effects of providing the average treatment group member 3½ more months of participation in a developmental education program (designed to provide the academic and soft skills needed for college-level training) and 1½ fewer months of participation in vocational training offered by providers other than RCC.59 In order to produce favorable impacts, the additional 3½ months of New Visions must be more beneficial than the loss of 1½ months of non-RCC vocational training.
The administrative data underlying these analyses do not provide much detail on the exact nature of these non-RCC vocational programs. We know from DPSS staff that vocational training typically consisted of a course (or sequence of courses) that lasted four-to-seven months and was geared toward a specific job, such as office assistant, medical assistant, or child care provider. The primary providers of vocational training in the “Other GAIN” category include the Riverside Adult School and the Riverside County public school system, which runs the county’s Regional Occupational Program.
Statistics in Exhibit 3.2 show that treatment and control group members who took regular courses at RCC (that is, non-New Visions courses) generally took similar subjects. Treatment group members were slightly more likely to take classes in computer science and business, whereas control group members were somewhat more likely to take education and social science courses. The differences, which represent non-experimental comparisons, are not statistically significant at the 90-percent confidence level, however.
58 Estimates in Exhibit 3.1 differ slightly from similar statistics for the treatment group in Chapter 2 because the former, and not the latter, are regression-adjusted.
59 These numbers are averages for the entire treatment and control groups, including those who did not participate. The average number of months of participation among those who participated was higher.
Chapter 3 Abt Associates Inc. 58

Exhibit 3.2Non-New Visions Course Enrollments: Percentage Distribution
by Field of Study and Treatment-Control Status
Field Treatment Group Control GrouComputers/Electronics 16.5 12.7Language 11.8 10.5Business 11.2 8.8Education 10.5 15.2Mathematics 8.9 9.1Medical 8.9 9.4Social Science 8.5 12.7 Physical Education 7.4 5.8 Counseling 6.0 6.6Creative Arts 3.1 2.2 Justice 2.9 2.2Science 1.8 1.9Professions 1.6 1.1Work Experience 0.4 0.6 Engineering 0.2 0.3Mechanics 0.2 0.8All Fields 100.0 100.0
Number of students ever enrolling 170 139
Sample Size (total=1,043) 528 515
p
Note: Statistics represent the unadjusted percentage distributions by field of RCC enrollments in courses not including the core New Visions curriculum. The comparison is based only on treatment and control group members enrolling in courses over the three-year follow-up horizon and, thus, does not provide pure experimental impacts. None of the percentages shown in the exhibit differed statistically between the two groups at the 90-percent confidence level.
Source: Riverside Community College enrollment management information system.
The overall level of E&T participation in the New Visions demonstration is very high compared to the national population of TANF recipients, even among control group members. Nationally, only six percent of adult TANF recipients were engaged in education and training activities in a typical month in 2002, according to data submitted by states to the U.S. Department of Health and Human Services’ Administration for Children and Families.60 In contrast, 30 percent of New Visions control group members participated in an education and training activity in a typical quarter during the first follow-up year. Three-out-of-five control group members participated in a GAIN E&T activity at some point during the first three follow-up years.
The relevant 2002 work participation rates are given in: http://www.acf.hhs.gov//programs/ofa/particip/2002/table06c.htm. The six percent figure includes vocational education (3.6 percent), job skills training (1.1 percent), and education related to employment (1.1 percent).
Abt Associates Inc. Chapter 3 59
60

There are several likely reasons for this high E&T participation among control group members. First, the fact that sample members had volunteered for New Visions indicates relatively high interest in education from the outset. Second, New Visions recruitment efforts may have increased interest in education and training among New Visions volunteers, including those assigned to the control group. Third, New Visions occurred in a county whose Phase 2 program sought to engage TANF recipients in education and training generally.61 Jurisdictions that replicated the New Visions experiment without adopting the surrounding Riverside policies might see lower E&T activity rates in the control group.
Most E&T participation, and most of the difference in E&T participation between the treatment and control groups, occurred during the first follow-up year. Regression-adjusted estimates for the full sample show that treatment group members had very high participation rates during the first few quarters after random assignment, because this is when they participated in New Visions (Exhibit 3.3, left panel). Participation rates converged after that, with no difference in participation between the treatment and control groups in Years 2 and 3.
By the end of follow-up Year 3, only about five percent of sample members were engaged in education or training through GAIN. To a substantial degree, of course, the apparent decline reflects diminishing rates of TANF receipt, rather than declining participation among recipients.62
Compared to the full sample, impacts on E&T participation were larger for the early cohort, due both to higher participation rates in the treatment group and to lower rates in the control group, compared with later cohorts (Exhibit 3.3, right panel).
Declining participation rates for treatment group members in later cohorts may be a result of having to dig deeper into the TANF population (and thus recruiting less committed volunteers) after New Visions wooed relatively more able candidates in the caseload. Increasing participation rates for control group members primarily reflects progress in implementing the DPSS Phase 2 program, which was at a fairly early stage when the New Visions demonstration began.
3.3 Impacts on Regular College Enrollment and Certificate and Degree Completion
A fundamental goal of New Visions was to increase lifelong learning by boosting attendance and progress in regular college classes. By improving academic and study skills through the core program and then directing students through shortened series of occupationally-relevant courses, designers hoped to impart skills and credentials leading to meaningful steps up chosen career ladders.
In this section, we assess the program’s impacts on college attainment. Specifically we address the question: Did New Visions participation produce positive impacts on enrollment in regular RCC courses, credits earned, and receipt of certificates or degrees?
61 Consistent with this explanation, E&T participation rates were higher for control group members in later cohorts compared to earlier cohorts. DPSS Phase 2 efforts strengthened over the New Visions enrollment period.
62 Declines in TANF participation rates are show in Exhibit 3.9.
Chapter 3 Abt Associates Inc. 60

Exhibit 3.3 Participation in Any E&T Activity, by
Follow-Up Quarter and T/C Status
Participated in any GAIN E&T Activity (%)Full Sample Early Cohort
75
60
45
30
15
0
0 1 2 3 4 8 12 18 0 1 2 3 4 8 12 18 Quarter since random assignment
Control Treatment
Source: DPSS GEARS administrative records
Treatment group members were somewhat more likely than control group members to enroll in a regular college course at RCC.
Consistent with program goals, the opportunity to participate in New Visions increased the proportion of sample members who enrolled in a regular college course. The impact was not large, however. Thirty-four (34) percent of treatment group members ever enrolled in a regular RCC course, compared to 28 percent of control group members, an impact of six percentage points (Exhibit 3.4, top row).63 Adjusting for no-shows increases the impact to about ten percentage points (top row, last column).
Impacts emerged just after the point that graduates normally finished the core program. In the first two quarters after random assignment—the normal period of core program participation—treatment group members were less likely than control group members to be enrolled in regular (non-New Visions) RCC courses (Exhibit 3.5, left panel). In the subsequent two quarters, immediately after New Visions has ended for most completers, treatment group enrollment in regular courses spikes sharply. Thereafter, impacts decline but remain positive (though generally not statistically significant). In Year 3, treatment group enrollment rates remain around ten percent in most quarters.
63 Estimates in this section are based on data from RCC’s enrollment management information system, and differ somewhat from impact estimates for RCC participation in the last section, which are based on DPSS records. RCC data provide a more complete measure of RCC enrollment than DPSS records, since the latter records only E&T provided through the GAIN program and thus is restricted to activity while sample members were receiving TANF.
Abt Associates Inc. Chapter 3 61

*
*****
***
Exhibit 3.4 Impacts on Enrollment in Non-New Visions Courses at RCC and at Community Colleges
Statewide over Follow-Up Years 1-3, Full Sample
Impact adjusted for
no-shows Treatment
Group Control Group
Percentage Impact Outcome Impact
Ever enrolled in a non-New Visions course at RCC (%) 33.7 27.6 6.1** 22.1 9.8
Average total RCC credits Attempted, excluding New Visions 5.4 4.2 1.2* 28.1 1.9 Earned, excluding New Visions 3.3 2.6 0.7 29.2 1.2 Earned, including New Visions 7.3 2.6 4.7*** 178.1 7.5
Number of RCC degree credits earned 3.7 2.2 1.4*** 65.5 2.33
Ever earned RCC certificate or degree (%) 2.2 1.4 0.8 60.1 1.4
Ever enrolled in non-New Visions course at any California community college 36.0 30.7 5.3** 17.3 8.5
Sample Size (total=1,043) 528 515
Note: a two-tailed test was applied to regression-adjusted impact estimates. Statistical significance levels are indicated as: * = 10 percent, ** = 5 percent, and *** = 1 percent.
Source: Riverside Community College and California Community College Chancellor’s Office management information systems.
The time path for impacts on RCC enrollments is generally similar for the early cohort, except that impacts are somewhat larger and are not initially negative (Exhibit 3.5, right panel). As with the full sample, impacts peak in follow-up quarter 3 and decline thereafter.
Chapter 3 Abt Associates Inc. 62

(%)
25 Full Sample
Enrolleby
d in a Follo
Exhibit 3.5 Non-New Visions w-Up Quarter and T/C Status
Cou
Early Cohort
rse at RCC,
20
15
10
5
Enro
lled
in a
Non
-New
Vis
ions
Cou
rse
0
0 4 8 12 Quar
18 0 ter since random assi
4 gnment
8 12 18
Treatment Control
Source: RCC enrollment management information system
Abt Associates Inc. Chapter 3 63
There was little evidence of positive impacts on college credits earned, other than those received in the New Visions core program.
Overall, treatment group members earned 4.7 more RCC credits on average than control group members, a statistically significant difference (Exhibit 3.4, fourth row). The difference is due entirely to credits in the New Visions core program, however: without such credits the treatment-control difference (0.7 credits) is not statistically significant.
Chiefly because the New Visions guidance course provided degree credits, there also was a positive impact on degree credits earned. This impact was very small (1.4 credits), however.64 We looked also for evidence of impacts on the distribution of credits earned, given the possibility of larger increases within a given credit interval (e.g., the percent earning four or more credits) than indicated by average credit statistics. Results not shown provide little sign of marked differences in credit distributions, however.
Given the absence of impacts on non-New Visions credits, it is not surprising that there also were no impacts on the attainment of degrees or certificates, including state-recognized certificates and RCC mini-certificates (which generally required fewer credit hours than state-recognized certificates). The treatment group was slightly more likely (2.2 percent) than the control group (1.4 percent) to receive
64 Although the guidance credits “counted” as regular degree credits, the guidance course would not normally be one of the specific courses required to earn an occupational certificate or degree.
a certificate or degree during the follow-up period, but the difference was small and not statistically significant (Exhibit 3.4, bottom row).
It is conceivable that New Visions had larger effects on community college involvement than are evident from these results for RCC only. Analyses of statewide community college data show that sample members had very little experience with other colleges, however. The fractions of treatment and control group members ever enrolling in a California community college during the follow-up period were 36 and 31 percent, respectively—only slightly higher than the 34 and 28 percent enrolling in non-New Visions courses at RCC (Exhibit 3.4, last row).
3.4 Impacts on Employment and Earnings
This and the following section analyze impacts on economic outcomes. New Visions’ developers designed the program to impart soft skills useful at work in the short run, as well as to help participants acquire occupational training needed for long term advancement on career ladders. They recognized that negative earnings impacts might arise in the short term if participants worked less than they would have otherwise in order to have time for school.65 Over any period of elevated school attendance, reduced work hours might lead to higher TANF payments for treatment group members (assuming that any cut-backs in work effort were not counterbalanced by increases in hourly wages). After that period, work hours and wages should rise, and TANF reliance should fall.
These hypotheses apply only to the extent that New Visions is more successful than any E&T received by the control group. Specifically, the demonstration tests whether a college bridge program can produce better college outcomes and, thus, better economic outcomes than other routes to education.
We look first at impacts on employment and earnings. Analyses are based on quarterly wage records from California’s Unemployment Insurance (UI) reporting system and thus cover jobs sample members held anywhere in the state. The quarterly records capture the vast majority of jobs, but generally exclude self-employment, casual employment, and other jobs not covered by the UI system. Due to lags in wage reporting, the follow-up period for these outcomes—2 ½ years—is two quarters shorter than for our other outcomes.
The New Visions offer did not increase earnings or employment as intended. Rather, average earnings were lower for treatment than for control group members.
Over the first 2½ follow-up years, treatment group members earned about $2,300 less on average than control group members (Exhibit 3.6, top panel). Employment rates were somewhat lower in the treatment than in the control group, but the proportionate effect on employment (four percent) was much smaller than the proportionate effect on earnings (12 percent).
65 Any such reduction in work hours presumably would be subject to the 20-hour per week work requirement and, thus, not translate into a lower employment rate for the treatment group. Positive employment impacts also might result from any desire to remain eligible for New Visions, leading to increased motivation to stay employed.
Chapter 3 Abt Associates Inc. 64

***
***
********
***
****
***
********
**
Exhibit 3.6 Impacts on Earnings, Employment, TANF Payments, and TANF Receipt
Follow-Up Years 1-3, Full Sample
Impact adjusted for no-shows
Treatment Group
Control Group
Percentage Impact Outcome Impact
Average total earnings, years 1-2.5 ($) 17,244 19,545 -2,301 -11.8** -3,701 Year 1 6,335 6,909 -573 -8.3* -922 Year 2 7,148 8,341 -1,193 -14.3** -1,918 Year 3 (first half) 3,761 4,295 -535 -12.4* -860
Average quarterly employment rate, years 1-2.5 (%) 65.9 68.3 -2.4 -3.6 -3.9
Year 1 71.8 72.6 -0.8 -1.1 -1.3 Year 2 61.3 65.5 -4.1 -6.3* -6.7 Year 3 (first half) 60.1 63.3 -3.2 -5.1 -5.2
Average total TANF payments, years 1-3 ($) 7,800 6,856 945 13.8** 1,520
Year 1 3,477 3,301 176 5.3 284 Year 2 2,388 2,076 312 15.0* 502 Year 3 1,935 1,479 456 30.9** 735
Average quarterly TANF receipt rate, years 1-3 (%) 55.6 52.0 3.7 7.1* 5.9
Year 1 78.0 75.8 2.2 2.9 3.5 Year 2 47.0 43.7 3.3 7.5 5.3 Year 3 36.3 30.4 5.9 19.6* 9.6
Sample Size (total=1,043) 528 515
Note: a two-tailed test was applied to regression-adjusted impact estimates. Statistical significance levels are indicated as: * = 10 percent, ** = 5 percent, and *** = 1 percent. Source: UI quarterly earnings records, DPSS TANF administrative records
The larger proportionate effect for earnings suggests that treatment group members who worked earned less than control group members who worked. Because UI data do not include hours worked or hourly wages, they cannot show whether lower earnings were a result of fewer hours worked, lower hourly wages, or both. Descriptive analyses of DPSS data (not shown in an exhibit) suggest that negative earnings impacts resulted mainly from fewer hours worked, however.66
The DPSS data revealed very similar hourly wages, but fewer hours worked, for treatment compared with control group members. These comparisons are non-experimental because they apply only to sample members in each group who were working and receiving TANF. Since employment and TANF receipt were both potentially affected by the treatment (i.e., endogenous), we no longer are guaranteed well-matched treatment and control groups.
Abt Associates Inc. Chapter 3 65
66

Exhibit 3.7
Earnings and Employment Full Sample and Early Cohort
by Follow-Up Quarter and T/C Status
Earnings Full Sample Early Cohort
Ave
rage
Qua
rterly
Em
ploy
men
t (%
) A
vera
ge E
arni
ngs
($)
1000
150
0 20
00 2
500
3000
0 Quarter since random assignment
EmploymentFull Sample Early Cohort
0 20
40
60
80
10
0
0 4 8 10 16 0 4 8 10 16 Quarter since random assignment
Treatment Control
Source: UI quarterly earnings records
67 See Appendix A.3 for details, including statistical significance, for these estimates.
66 Chapter 3 Abt Associates Inc.
The negative earnings impacts persisted for the first three years but may have faded thereafter. Impacts on employment and earning widened slightly over the first three years for the full research sample (Exhibit 3.7, left top and bottom graphs).67 Longer-term results for the early cohort (Exhibit 3.7, top right graph) show that the negative earnings impacts disappeared, but positive impacts did not emerge, by the end of the fourth year.

Negative earnings impacts do not mean necessarily that average earnings decreased but, rather, that average earnings were lower than they would have been without the New Visions offer. The earnings graphs in Exhibit 3.6 show that average earnings rose steadily over the follow-up period. In striking contrast, average quarterly employment fell over the follow-up period. Because sample members were required to be employed at the time of random assignment, the decline thereafter may reflect a return towards more typical employment rates for a sample of welfare recipients. That average total earnings increased despite a declining employment rate suggests a marked rise in employed sample members’ earnings—either because of higher wage rates, or more hours worked, or both.
The experimental design does not allow us to determine exactly why earnings impacts were negative. One possibility is that treatment group members worked fewer hours than control group members because they spent more time in school. This explanation does not appear to be very likely, however, since impacts on RCC enrollments and GAIN E&T were limited to the first follow-up year, whereas earnings impacts were largest in Year 3. A second possibility is that New Visions led some treatment group members to shift away from employment paths they were on, without helping them to get back to a commensurate level of employment subsequently. A third possibility is that the average treatment group member got some benefit from New Visions, but that this benefit was not as large as that received by control group members from alternative E&T services. We will examine the last two possibilities later in this chapter.
There were no signs that New Visions induced treatment group members to take steps onto career ladders at a higher rate than members of the control group.
The negative impacts estimated from quarterly employment and earnings data imply that New Visions did not move more treatment than control group members into career-track jobs, but the net impacts on these outcomes do not address job advancement directly. To get some idea of the kinds of job changes occurring in each group, we examined data on jobs maintained in the DPSS automated information system (GEARS). These analyses are non-experimental, because they only cover job changes that occurred while sample members were receiving TANF. Any program impacts on TANF receipt could produce differences in the composition of treatment and control group members still receiving TANF, and, thus, comparisons of outcomes between the two groups might reflect these differences rather than pure program effects.
The DPSS data showed at least one job change for 59 percent of treatment group members and 54 percent of control group members (see Exhibit 3.8). The five-percentage-point difference is not statistically significant. The difference also may exaggerate the true difference in job switching: treatment group members had somewhat longer welfare spells, and thus there was more opportunity for the automated system to detect job changes.
Among job switchers, we see no evidence of differences in job advancement. The average change in hourly wages was nearly identical in the two groups, and there was little evidence of differences in occupations or places of employment (see Exhibit 3.8). The most common occupation for both groups was cashier, and the three most common industries for both groups were eating places, temporary help services, and department stores (e.g., Walmart, Target).
Abt Associates Inc. Chapter 3 67

Outcome Treatment ControlPercent with a Job Change in DPSS Records 58.7 54.2
Number with Job Change 310 279
Change in Wages among those Changing Jobs
Median $0.75 $0.80Mean $1.24 $1.11
Wage Rate (mean) Median $7.00 $7.25Mean $7.88 $7.87
Most Frequently Held Job Titles (Percent of Job Changers)
Cashier 10.5 Caregiver 3.0
CNA 3.0 Customer service 2.4
Receptionist 2.1
Cashier 10.0 CNA 4.5
Sales associate 2.3 Caregiver 1.9
Inventory clerk 1.9
Most Frequently Observed DOT Occupations (Percent of Job Changers)
Cashiers and tellers 12.7 Household work 9.0
Health Attendants 6.9 Moving & storage 6.6
Office clerk 5.4
Cashiers and tellers 10.4 Misc NEC 6.5
Health attendants 5.5 Shipping & receiving 5.2
Household work 4.5
Most Frequently Observed Employers (Percent of Job Changers)
Starcrest (mail order) 2.1 Walmart 2.1
RCC 1.5 Target 1.5
Big Lots 0.9 Infonxx 0.9
Ross 0.9 Self-employed 0.9
Sears 1.6 Washington Inventory 1.6
Press Enterprise 1.3 Walmart 1.3
Riverside Auto Auct. 1.0 Target 1.0
Employment Sector (Percent of Job Changers)
Public 15.3 Private, for profit 82.8 Private nonprofit 1.8
Public 17.3 Private, for profit 81.7 Private nonprofit 1.0
Exhibit 3.8 Percent with Job Changes Recorded in DPSS Automated System after Random Assignment
and Non-Experimental Comparison of Wages, Occupations, and Employers for Job Changers, by Treatment-Control Status
Note: Data recorded in DPSS systems are limited to jobs reported while sample members were still receiving TANF. Hence, the statistics likely omit a substantial number of job changes and treatment-control comparisons do not represent pure experimental impacts.
Source: DPSS automated records.
Chapter 3 Abt Associates Inc. 68

3.5 Impacts on TANF Payments and Receipt
New Visions’ developers expected that, by increasing earnings, the program eventually would reduce reliance on TANF. Given the absence of positive earnings impacts, it is not surprising that these expectations were not born out.
New Visions led to higher TANF payments and receipt rates.
Over the first three follow-up years, average total TANF payments were $945 higher for the treatment group than the control group, a difference of about 14 percent (Exhibit 3.6, third panel). The corresponding proportionate impacts for quarterly TANF receipt rates were smaller—about seven percent (Exhibit 3.6, fourth panel).
The fact that the impacts on TANF payments were twice as large as the impacts on TANF receipt (in proportionate terms) means that, in addition to treatment group members receiving TANF for more months than control group members, the average benefit amount while on welfare also was higher in the treatment group. Higher benefits could occur if treatment group members either were less likely to work or earned less while on welfare than control group members.
Time series (in Exhibit 3.9) show that treatment group members consistently relied more on TANF than control group members over the follow-up period. For the full sample, impacts grew through the end of follow-up (Quarter 12) while, for the early cohort, impacts faded after Quarter 13. The pattern of TANF payment impacts is consistent with the pattern of earnings impacts. The approximately two-month lag between the occurrence of earnings and payment impacts is a consequence of the delay between the time DPSS received earnings reports and the time it implemented benefit adjustments to monthly payments.
The increases in TANF receipt and payments are likely the result of decreases in earnings.
TANF eligibility and benefits depend directly on earnings, so negative impacts on earnings can be expected to produce positive impacts on TANF payments and receipt. Whatever the reasons for the unfavorable impacts on earnings and TANF payments, the same reasons likely underlie both sets of impacts.
Abt Associates Inc. Chapter 3 69
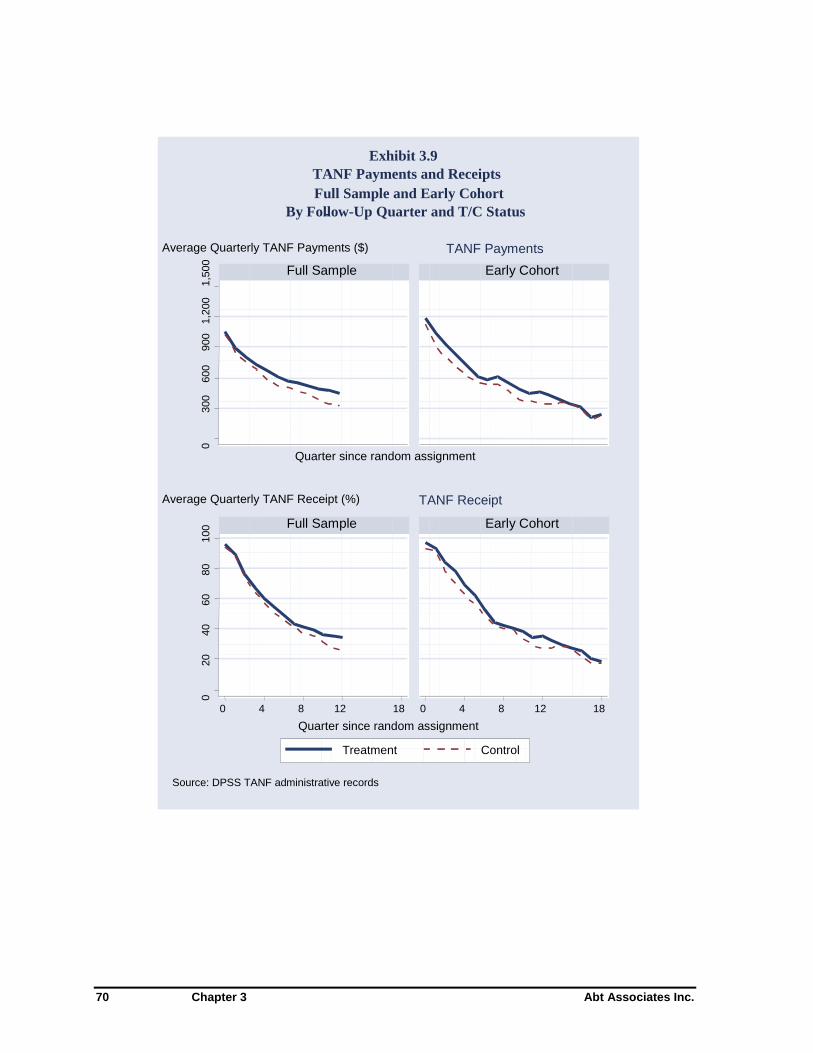
0
0
Exhibit 3.9
TANF Payments and Receipts Full Sample and Early Cohort
By Follow-Up Quarter and T/C Status-
Average Quarterly TANF Payments ($) TANF Payments
300
600
900
1,20
0 1,
500
Full Sample Early Cohort
Quarter since random assignment
Average Quarterly TANF Receipt (%) TANF Receipt
20
40
60
80
100 Full Sample Early Cohort
0 4 8 12 18 0 4 8 12 18 Quarter since random assignment
Treatment Control
Source: DPSS TANF administrative records
70 Chapter 3 Abt Associates Inc.

3.6 Subgroup Impacts
In this section, we assess the degree to which New Visions’ impacts differed for sample members with varying personal and family characteristics. Such analyses can help to identify subgroups that are more or less likely to benefit from an intervention. Patterns of coincidence and non-coincidence of impacts for different outcomes across groups also can provide clues to the causal mechanisms underlying overall impacts.
We selected characteristics to exemplify three basic types of moderating mechanisms, within the limits of available baseline data.68 First, motivation to pursue college studies is likely to influence whether participants are willing to put in the energy and make the sacrifices required to benefit from the boost New Vision provided. As an indicator of motivation, we used responses to a question on college expectations on the baseline information form, which ascertained whether or not participants expected to be in college in one year’s time. We have seen (in Chapter 2) that this indicator was related positively with the likelihoods of completing the core program and of earning RCC credits subsequently.
Second, we reasoned that academic skills were a key requirement for benefiting from New Visions, hypothesizing that to benefit from such a bridge program participants must be within range of handling college level work, but need extra help with the kinds of academic and school-life planning assistance New Visions provides. We saw in Chapter 2 that skills for a high proportion of New Visions recruits were so far below college level as to raise questions about the feasibility of bridging the gap in a six-month, twelve hours/week program. The project did not administer academic assessments to the entire sample at baseline, precluding analysis of subgroups defined in terms of skills. In lieu of this, we use prior college experience, a measure distinguishing sample members who never enrolled at RCC, who enrolled but did not complete any courses, and who enrolled and did complete at least one course. In Chapter 2 we found that prior college experience was not associated with core program completion but was associated positively with earning credits subsequently.
The third category includes external circumstances that may support or hinder participants’ ability to take advantage of opportunities like New Visions. These factors include exposure to norms and role models affirming education, pressures from competing family responsibilities, access to social supports, and competing demands from work. Available indicators included:
• Race-ethnicity. Members of some racial and ethnic minority groups receive less exposure to positive role models and norms concerning school achievement, social behavior, and relationships with sexual partners. New Visions was designed to help disadvantaged students. However, if barriers are too numerous or severe they might overpower program services. The finding in Chapter 2 that African Americans were substantially less likely than whites or Hispanics to complete the core program is suggestive of disproportionate barriers.
• Number of children. Other things being equal, we expect participants with more children to experience more competing demands and thus greater difficulty capitalizing on the opportunities created by New Visions. Analyses in Chapter 2 found, however, that participants with two children were more likely to complete the core program than those with
68 See Chapter 2 for descriptive statistics on the characteristics used to define subgroups.
Abt Associates Inc. Chapter 3 71

fewer or more children. The finding could be a spurious chance occurrence, or it could signal that having two children is associated with other personal characteristics conducive to success in New Visions.
• Ever married. Previously and currently married sample members may have stronger social networks—including current spouses and their kin—and thus more supports on which to draw. Help from family and relatives with child care, transportation, housing expenses, and emotional crises can be vital buffers against a variety of external stresses. Supporting these hypotheses is the finding in Chapter 2 that ever-married women were more likely to complete the core program.
• Recent work experience. As an indicator of competing work commitments, we distinguish sample members on the basis of the portion of the year before random assignment that they worked (none, 1-3 quarters, all 4 quarters). New Visions may provide the strongest work incentives and supports for those with the weakest work histories, whereas those with the strongest work histories may find it harder to make sacrifices at work in order to accommodate school. We did not find significant associations between recent work history and core program completion or subsequent credits in Chapter 2. Other results in that chapter did reveal a negative association between core program completion and number of hours worked after baseline and between post-core college attainment and initial wage levels (i.e., wages in current/last job as of random assignment).
The rest of this section highlights some of the key findings from the subgroup analyses. The analysis focuses on four outcomes: participation in GAIN E&T activities other than through RCC, enrollment in non-New Visions courses at RCC, and total earnings and TANF payments. To facilitate analysis of the coincidence of impacts on these outcomes with core program experiences, our summary table also shows differential rates of core program completion, expressed as impacts (Exhibit 3.10, first column).
Subgroups with higher New Visions completion rates had somewhat larger impacts on subsequent college enrollment rates. The patterns support some, but not all, of our hypotheses for particular characteristics.
Subgroup differences in New Visions completion rates were statistically significant for race-ethnicity, number of children, and marital status (Exhibit 3.10). For all three characteristics, the subgroups with the largest completion rates also had the largest (positive) impacts on college enrollment.69 For example, New Visions completions and impacts on other RCC enrollment in Year 1 were higher among ever-married participants (34 and 11 percent, respectively) than among never-married participants (22 percent and 5 percent, respectively).70
Of these three characteristics, patterns for race-ethnicity and marital status are as expected, with more favorable results for Hispanics, whites, and ever-married sample members. The pattern by number of children shows substantial Year 1 and 2 impacts on non-New Visions RCC enrollments among
69 Subgroup differences for college enrollment were statistically significant only for number of children, however (p<.10).
70 Subgroup differences in impacts on other RCC enrollment by marital status were not statistically significant.
Chapter 3 Abt Associates Inc. 72

participants with two children (15 and 12 percentage points, respectively), but no statistically significant impacts for other family sizes. It is difficult to know what to make of this finding. Participants with two children may differ from those with fewer or more children in some way that affects college impacts. Cross-classifications of number of children with characteristics from Exhibit 2.4 (not shown in exhibit) revealed no differences consistent with such a hypothesis, however.
As hypothesized, initial college expectations are associated with higher chances of New Visions completion in the treatment group and with larger positive impacts on subsequent RCC enrollment, although neither association is statistically significant.71
We see also that impacts on regular RCC enrollment were larger for sample members who did not previously attend RCC (nine and six percentage points in Years 1 and 2, respectively) than for those who did previously attend, although the former were somewhat less likely to finish New Visions.72
The indicator does not tell us much about academic skill levels, but the finding does leave open the possibility that New Visions was helpful for at least some recipients entering with relatively weak academic skills and experience.
Finally, having a stronger recent work history was not significantly associated either with New Visions completion or impacts on RCC enrollment.
Subgroups with higher New Visions completion rates and larger overall impacts on E&T participation tended to have less unfavorable earnings impacts.
Looking again at the three characteristics showing statistically significant differences in New Visions completion rates (race-ethnicity, number of children, and marital status), we see the least unfavorable earnings impacts in the subgroups with the highest completion rates. For example, ever-married sample members were substantially more likely to complete New Visions (34 percent) and had smaller negative earnings impacts (e.g., -$663 in Year 3)) and smaller positive TANF payment impacts (e.g., $119 in Year 3) than their never married counterparts (22 percent, -$1,440, and $758, respectively).73
The largest, and only statistically significant, variation in earnings impacts is across recipients with different amounts of work in the year before random assignment. For example, we find a fairly large negative impact in Year 2 (-$2,316) for sample members who worked throughout the year prior to random assignment, a somewhat smaller negative impact (-$1,241) for those who worked only part of
71 In Chapter 2, we found relatively large differences in the fractions of treatment group members completing New Visions and earning credits in regular RCC courses based on initial college expectations, controlling for other factors. The smaller differences reported here arise partly because the subgroup impact analyses represent marginal effects (i.e., they do not control for interactions between the treatment and other factors) and partly because (in the case of RCC enrollment impacts) the results apply to differences in impacts on enrollments, rather than differences in simple enrollment rates within the treatment group.
72 Neither association is statistically significant at p<.10, however. 73 The differences in New Visions completion rates and TANF impacts in Years 2 and 3 between ever- and
never-married sample members are, but the difference in earnings impacts are not, statistically significant.
Abt Associates Inc. Chapter 3 73
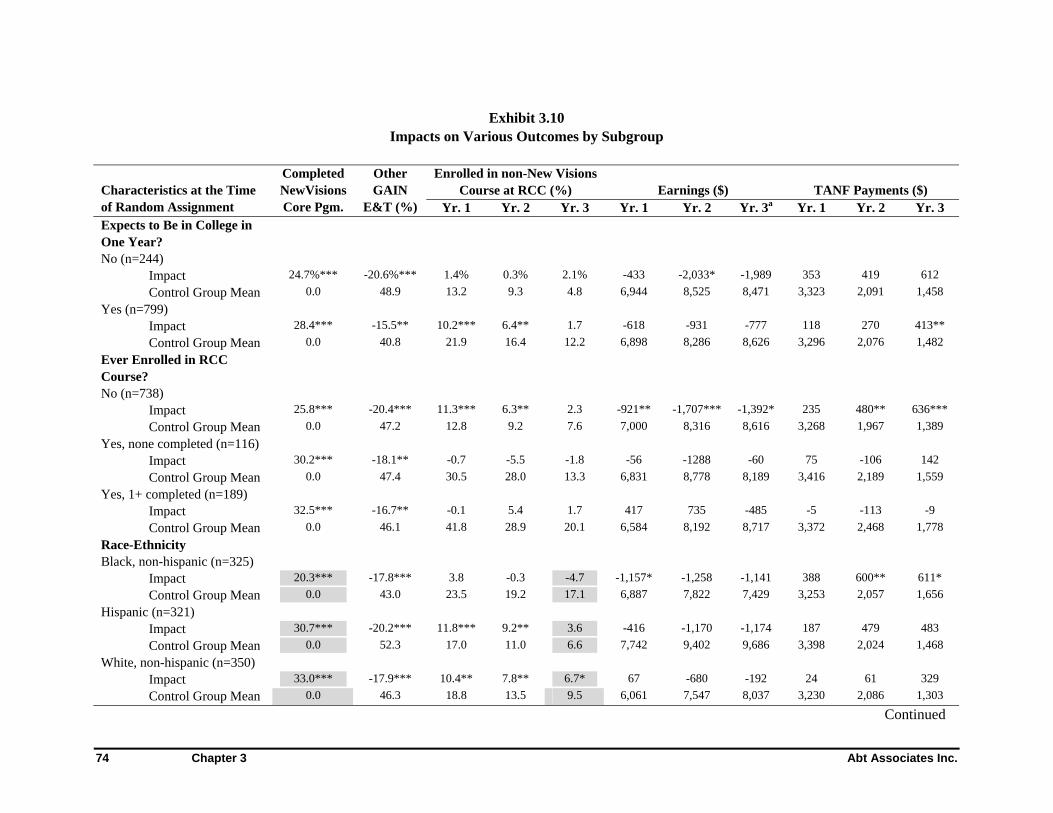
Exhibit 3.10 Impacts on Various Outcomes by Subgroup
Completed NewVisions Core Pgm.
Other GAIN
E&T (%)
Enrolled in non-New Visions Course at RCC (%) Characteristics at the Time
of Random Assignment Earnings ($) TANF Payments ($)
Yr. 1 Yr. 2 Yr. 3 Yr. 1 Yr. 2 Yr. 3a Yr. 1 Yr. 2 Yr. 3 Expects to Be in College in One Year? No (n=244)
Impact 24.7%*** -20.6%*** 1.4% 0.3% 2.1% -433 -2,033* -1,989 353 419 612Control Group Mean 0.0 48.9 13.2 9.3 4.8 6,944 8,525 8,471 3,323 2,091 1,458
Yes (n=799) Impact 28.4*** -15.5** 10.2*** 6.4** 1.7 -618 -931 -777 118 270 413**Control Group Mean 0.0 40.8 21.9 16.4 12.2 6,898 8,286 8,626 3,296 2,076 1,482
Ever Enrolled in RCC Course? No (n=738)
Impact 25.8*** -20.4*** 11.3*** 6.3** 2.3 -921** -1,707*** -1,392* 235 480** 636***Control Group Mean 0.0 47.2 12.8 9.2 7.6 7,000 8,316 8,616 3,268 1,967 1,389
Yes, none completed (n=116) Impact 30.2*** -18.1** -0.7 -5.5 -1.8 -56 -1288 -60 75 -106 142Control Group Mean 0.0 47.4 30.5 28.0 13.3 6,831 8,778 8,189 3,416 2,189 1,559
Yes, 1+ completed (n=189) Impact 32.5*** -16.7** -0.1 5.4 1.7 417 735 -485 -5 -113 -9Control Group Mean 0.0 46.1 41.8 28.9 20.1 6,584 8,192 8,717 3,372 2,468 1,778
Race-Ethnicity Black, non-hispanic (n=325)
Impact 20.3*** -17.8*** 3.8 -0.3 -4.7 -1,157* -1,258 -1,141 388 600** 611*Control Group Mean 0.0 43.0 23.5 19.2 17.1 6,887 7,822 7,429 3,253 2,057 1,656
Hispanic (n=321) Impact 30.7*** -20.2*** 11.8*** 9.2** 3.6 -416 -1,170 -1,174 187 479 483Control Group Mean 0.0 52.3 17.0 11.0 6.6 7,742 9,402 9,686 3,398 2,024 1,468
White, non-hispanic (n=350) Impact 33.0*** -17.9*** 10.4** 7.8** 6.7* 67 -680 -192 24 61 329Control Group Mean 0.0 46.3 18.8 13.5 9.5 6,061 7,547 8,037 3,230 2,086 1,303
Continued
Chapter 3 Abt Associates Inc. 74

Exhibit 3.10 Impacts on Various Outcomes by Subgroup (Cont.)
Number of Children 1 (n=353)
Impact 22.4%*** 0.0
34.5*** 0.0
3+ (n=371) Impact 25.7*** -20.8*** 4.6 0.0 -0.9 -750 -1,927** -1,572 159 428 626**Control Group Mean 0.0 51.3 16.3 13.2 11.1 7,577 9,288 9,347 4,212 2,729 1,863
Ever Married? No (n=557)
Impact 21.8*** -16.3*** 5.2 3.8 0.6 -448 -1,471** -1,440 179 668*** 758*** Control Group Mean 0.0 46.6 20.0 15.5 11.5 6,771 8,260 8,549 3,133 1,848 1,392
Yes (n=486) Impact 33.8*** -22.9*** 11.4*** 6.2* 3.1 -723 -893 -663 172 -119 119 Control Group Mean 0.0 47.5 19.7 13.9 9.3 7,072 8,436 8,640 3,494 2,356 1,579
Quarters Worked of Past 4 None (n=222)
Impact 26.5*** -6.7 7.6 3.1 -1.1 1,099 1,449 992 -297 -133 -295 Control Group Mean 0.0 35.2 19.9 17.7 14.0 3,464 4,771 5700 4,086 2,564 2,146
1-3 (n=499) Impact 26.9*** -20.7*** 7.4** 7.8** 4.9 -468 -1,241* -1649* 497*** 583** 836*** Control Group Mean .0 49.3 20.1 13.3 7.8 6,561 7,829 8,209 3,180 2,117 1,501
All 4 (n=317) Impact 29.1*** -26.0*** 9.9** 1.4 -1.2 -1,209** -2,316*** -1,014 -13 166 339 Control Group Mean 0.0 51.5 22.5 17.1 13.2 9,425 11,173 10,837 2,981 1,726 1,047
17.7
12.1*** 13.2
Control Group Mean 43.9 25.9 9.9 6,580 7,900 8,212 2,371 1,500 1,2162 (n=319)
Impact -16.2*** 15.5*** 3.5 -417 -499 -372 69 242 505Control Group Mean 45.8 17.0 10.5 6,490 7,715 8,123 3,357 2,010 1,330
-21.6%*** 5.1% 3.4% 2.9% -525 -1,061 -1,212 143 148 201
Completed New
Visions Core Pgm.
Partic. Any
GAIN E&T
Enrolled in non-New Visions Course at RCC Earnings ($) TANF Payments ($)
Characteristics at the Time of Random Assignment Yr. 1 Yr. 2 Yr. 3 Yr. 1 Yr. 2 Yr. 3 a Yr. 1 Yr. 2 Yr. 3
a Year 3 earnings estimates apply to the first two quarters of the third follow-up year but have been annualized (multiplied by two) to facilitate comparison with other columns.
Note: Sample sizes refer to totals (treatment plus control) in each subgroup. A two-tailed test was applied to regression-adjusted impact estimates for each subgroup. Statistical significance levels are indicated as: * = 10 percent, ** = 5 percent, and *** = 1 percent. Shaded cells indicate that an F-test found differences in impacts across subgroups to be statistically significant at the 10-percent level or higher.
Abt Associates Inc. Chapter 3 75

the year, and a positive impact for those who did not work in the year before random assignment ($1,449).74 New Visions completion rates did not vary much with work history, but there is some sign of a larger positive impact on non-RCC GAIN E&T in the latter two categories. Specifically, we see relatively large positive impacts on non-New Visions college enrollment among recipients who worked part of the previous year, and a substantially smaller negative impact on other GAIN activities (non-RCC) in the no-work group than in the other two groups.
Impacts on other GAIN E&T activities tend to be somewhat less negative in groups with higher New Visions completion rates, but—other than the work history differences—the differences are not statistically significant. The analysis does not allow us to establish definitively why the overall impact on earnings was negative. Some of the effect is likely to be due to reductions in work hours associated with additional time devoted to New Visions and other RCC courses. But the fact that subgroups most likely to complete New Visions and enroll in other RCC courses generally had smaller negative earnings impacts, and sometimes even positive ones, does not point to a significant amount of time at work traded for time at school.
Rather, the work history differences hint that diversion from work, rather than a tradeoff between work and school, may have occurred. Negative earnings impacts were largest for sample members who worked the most in the year before random assignment, while impacts on education and training outcomes were no more favorable than for sample members with less work in the prior year.
Subgroups with larger decreases in earnings had larger increases in TANF payments, consistent with the expectation that impacts on payments would be driven by impacts on income from earnings.
Subgroup differences in TANF payments were statistically significant for work history (in Years 1 and 2) and marital status (in Years 2 and 3). In general, subgroups with larger negative earnings impacts tended to have larger positive TANF payment impacts, reflecting welfare rules applying income from earnings against payment amounts. For example, we find substantially larger positive TANF payment impacts and substantially larger negative earnings impacts among never- than among ever-married sample members. This correlation is evident even for characteristics where differences in TANF impacts were pronounced but not statistically different (e.g., prior college experience).
An exception is work history. Among sample members who worked throughout the year prior to random assignment, we see the largest negative earnings impacts but relatively small TANF impacts in Years 1 and 2. It is unclear why earnings impacts would have little apparent effect on TANF payments for this subgroup. In Year 3, the expected pattern is manifest, with the largest negative earnings impacts and largest positive TANF payment impacts in the intermediate work history category.
Impacts differ significantly across the three groups (p<.10), but of the three impacts, only the point estimates for those working at least one quarter are statistically significant (p<.05).
Chapter 3 Abt Associates Inc. 76
74

3.7 Conclusions
Analyses in this chapter show that New Visions did not produce better economic outcomes than participants otherwise would have experienced. Rather, outcomes were less favorable for treatment than for control group members. The standard for this comparison was fairly high, since many control group members engaged in other E&T activities—including other RCC programs. Negative earnings impacts thus could arise if both treatment and control group members benefited economically from the services each received, but the control group benefited more. On the other hand, larger negative impacts for recipients with the strongest initial work histories—without compensating positive impacts on education and training activity—suggest that New Visions may have diverted some participants from higher earnings trajectories.
Although the New Visions program was designed to impart skills useful at work in the short- and longer-run, the experiment’s main contribution was to test whether providing specialized community college bridge services can generate higher rates of college enrollment and attainment. New Visions included many of the elements experts believe should be part of a college bridge program. In this regard, the findings are not very encouraging. The program produced a modest boost in college enrollments but had little effect on college credits (other than those earned during the New Visions core program). This result obtained also in analyses restricted to volunteers who showed up for the program.
Analyses do not show signs of more favorable economic impacts emerging over a longer follow-up period. Positive impacts on college enrollment failed to occur later in the three-year period observed for the full sample, or in the fourth and fifth years for an early cohort (see Appendix Exhibit A.2). Negative earnings impacts did disappear in the fourth year for the early cohort, but there were no indications of positive earnings impacts (Appendix Exhibit A.3).
Although we cannot be certain why New Visions did not have more favorable impacts, previous chapters identified some plausible explanations. A majority of participants had academic skills too low to be realistically bridged in a short program, and a majority of those who volunteered either did not show up for, or did not finish, the program. Furthermore, the program did not develop a strong job development function and did not do as much as it might have to continue supports and specialized instruction after the core component.
Analyses in Chapter 2 identified a host of personal circumstances that made it difficult to remain in school. New Visions offered strong counseling, an array of services, and a supportive learning community to help participants balance school with work and family responsibilities. Conflicts with work nonetheless remained the largest single category of reasons for difficulties succeeding in school. Many participants ended up working full-time—well above the 20-hour minimum DPSS required. Future programs might consider providing counseling and job development supports to help students keep their work hours to levels that can be more easily combined with school. Programs also might want to experiment with financial incentives to make part-time work more economically viable.
There is no guarantee that programs that address the challenges identified in this evaluation will produce positive impacts. With the benefit of lessons from the New Visions experience, however, future programs should be in a better position to anticipate and respond to the challenges. We
Abt Associates Inc. Chapter 3 77

therefore believe that further efforts to develop and evaluate college bridge programs for disadvantaged adults would be worthwhile.
Chapter 3 Abt Associates Inc. 78

References
Acs, G. & Loprest, P. (2001). Synthesis Report of the Findings from ASPE’s “Leavers” Grants. Washington, D.C.: U.S. Department of Health and Human Services.
The Aspen Institute. (2003). Grow Faster Together, or Grow Slowly Apart: How Will America Work in the 21st Century? Washington, D.C.: The Aspen Institute.
Bailey, T.R. & Alfonso, M. (2005). Paths to Persistence: An Analysis of Research on Program Effectiveness at Community Colleges. Lumina Foundation for Education New Agenda Series, 6(1).
Bloom, D., Hendra, R., Martinson, K., & Scrivener, S. (2005). The Employment Retention and Advancement Project: Early Results from Four Sites. New York: MDRC.
Bloom, D. & Sommo, C. (2005). Building Learning Communities: Early Results from the Opening Doors Demonstration at Kingsborough Community College. New York: MDRC.
Bloom, H.S. (1984). Accounting for no-shows in experimental evaluation designs. Evaluation Review, 8(2): 225-246.
Brock, T. & LeBlanc, A. (2005). Promoting Student Success in Community College and Beyond: The Opening Doors Demonstration. New York: MDRC.
Carnevale, A.P., & Desrochers, D. M. (1999). Getting Down to Business: Matching Welfare Recipients’ Skills to Jobs That Train. Princeton, NJ: Educational Testing Service.)
Carnevale, A.P. & Desrochers, D.M. (2002). The Missing Middle: Aligning Education and the Knowledge Economy. Presented at Preparing America’s Future: The High School Symposium, sponsored by the Office of Vocational Education, U.S. Department of Education, Washington D.C.
Covington, K.L. & Spriggs, W.E. (2004). Negative effects of state welfare policy on recipient college enrollment. The Review of Black Political Economy. Fall 2004: 7-26.
Fein, D. J., Beecroft, E., Long, D. A., & Catalfamo, A. R. (2000). College as a Job Advancement Strategy: An Early Report on the New Visions Self-Sufficiency and Lifelong Learning Project. Bethesda, MD: Abt Associates Inc. http://www.abtassociates.com/reports/NV-revised.pdf.
Fein, D. J., Beecroft, E., Long, D. A., & Robertson, A. (2003). College as a Job Advancement Strategy: An Interim Report on the New Visions Self-Sufficiency and Lifelong Learning Project. Bethesda, MD: Abt Associates Inc. http://www.abtassociates.com/reports/nv_interim.pdf.
Golonka, S., & Matus-Grossman, L. (2001). Opening Doors: Expanding Educational Opportunities for Low-Income Workers. New York: MDRC and the National Governors Association Center for Best Practices.
Greenberg, M., Strawn, J., & Plimpton, L. (2000). State Opportunities to Provide Access to Postsecondary Education under TANF. Washington, DC: Center for Law and Social Policy. Abt Associates Inc. References 79

Grubb, W., Badway, N., Bell, D., & Castellano, M. (1999). Community colleges and welfare reform: Emerging practices, enduring problems. Community College Journal. June/July 1999: 31-39.
Heckman, J.J. (1999). Doing it right: Job training and education. The Public Interest. Spring 1999.
Johnson, H.P., & Tafoya, S. (1999). The Basic Skills of Welfare Recipients: Implications for welfare reform. San Francisco: Public Policy Institute of California.
Kazis, R. & Liebowitz, M. (2003). Changing Courses: Instructional Innovations that Help Low-Income Students Succeed in Community College. New York: MDRC.
Kornfeld, R. & Bloom, H.S. (1999). Measuring program impacts on earnings and employment: Do unemployment insurance wage reports from employers agree with surveys of individuals? Journal of Labor Economics. 17 (January): 168-197.
Loprest, P. (2001). How Are Families that Left Welfare Doing? A Comparison of Early and Recent Leavers. Washington, D.C.: The Urban Institute.
Martinson, K., & Strawn, J. (2003). Built to Last: Why Skills Matter for Long-Run Success in Welfare Reform. Washington, D.C.: Center for Law and Social Policy, the National Institute for Literacy, and the National Adult Education Professional Development Consortium.
Matus-Grossman, L. & Gooden, S. (2002). Opening Doors: Students’ Perspectives on Juggling Work, Family, and College. NY: MDRC.
Mishel, L., Bernstein, J. & Boushey, H. (2003). The State of Working America. Ithaca, NY: Cornell University Press.
Nelson, L. & Purnell, R. (2003). Supporting CalWORKS Students at California Community Colleges: An Exploratory Focus Group Study. NY: MDRC.
Orr, L.L. (1999). Social Experiments: Evaluating Public Programs with Experimental Methods. Thousand Oaks, CA: Sage Publications.
Purnell, R. & Blank, S. (2004). Support Success: Services that May Help Low-Income Students Succeed in Community College. NY: MDRC.
Riccio, J., Friedlander, D., & Friedman, S. (1994). GAIN: Benefits, Costs, and Three-Year Impacts of a Welfare-to-Work Program. New York, NY: MDRC.
U.S. Bureau of the Census (2001). Median Income of People by Selected Characteristics. http://www.census.gov/hhes/income/income00/inctab7.html.
U.S. Department of Education, Office of Vocational and Adult Education. (2001). Measures and Methods for the National Reporting System: Implementation Guidelines. Washington, DC: author.
References Abt Associates Inc. 80

U.S. Department of Health and Human Services. (2003). Temporary Assistance to Needy Families: Fifth Annual Report to Congress. Washington, D.C.: Author. http://www.acf.hhs.gov/programs/ofa/annualreport5/1026.htm
U.S. House of Representatives, Committee on Ways and Means, (2004). Background Material and Data on the Programs within the Jurisdiction of the Committee on Ways and Means. (2004 Green Book). WMCP 108. http://waysandmeans.house.gov/Documents.asp?section=813.
Abt Associates Inc. References 81


Appendix: Quarterly Impact Estimate Detail
Exhibit A.1 Percent Participating in Any GAIN E&T Activity by Follow-Up Quarter and T/C Status
Full Sample Early Cohort Follow-up Quarter
Treatment Group
Control Group
Treatment Group
Control Group Impact Impact
Quarter 0 61.4 23.9 37.5*** 69.5 13.3 56.2*** Quarter 1 62.0 36.4 25.6*** 65.6 25.1 40.4*** Quarter 2 43.8 32.9 10.9*** 44.9 25.1 19.8*** Quarter 3 25.6 25.8 -0.3 29.3 20.1 9.2** Quarter 4 20.2 21.2 -1.0 24.9 18.0 6.9* Quarter 5 17.3 14.5 2.9 22.7 13.2 9.4*** Quarter 6 13.6 13.5 0.1 16.8 15.2 1.7 Quarter 7 13.1 12.2 0.8 17.8 14.2 3.6 Quarter 8 10.7 9.2 1.6 12.9 12.0 0.9 Quarter 9 9.2 7.5 1.7 10.7 9.9 0.9 Quarter 10 7.6 6.5 1.1 10.7 8.1 2.6 Quarter 11 6.1 4.5 1.6 6.9 4.0 2.9 Quarter 12 4.9 3.6 1.3 7.0 4.0 3.0 Quarter 13 4.8 4.0 0.8 Quarter 14 3.9 2.6 1.3 Quarter 15 4.0 2.6 1.4 Quarter 16 2.7 2.1 0.6 Quarter 17 3.5 1.0 2.5 Quarter 18 2.3 1.3 1.0
Sample Size 528 515 229 228
Note: The outcome “any GAIN E&T” includes participation in New Visions and other RCC activities. A two-tailed test was applied to regression-adjusted impact estimates. Statistical significance levels are indicated as: * = 10 percent, ** = 5 percent, and *** = 1 percent.
Source: DPSS GEARS administrative records.
Abt Associates Inc. Appendix 83

Exhibit A.2 Percent Enrolled in a Non-New Visions Course at RCC
by Follow-Up Quarter and T/C Status
Full Sample Early Cohort Follow-Up Quarter
Treatment Group
Control Group
TreatmentGroup
Control Group Impact Impact
Quarter 0 5.8 9.2 -3.4** 7.9 7.4 0.5 Quarter 1 7.2 11.1 -3.9** 10.0 7.0 3.0 Quarter 2 14.9 12.5 2.4 16.6 8.0 8.6*** Quarter 3 19.1 12.3 6.8*** 20.2 9.6 10.7*** Quarter 4 18.0 10.7 7.3*** 19.5 9.8 9.7*** Quarter 5 15.5 10.6 4.9** 18.1 11.7 6.5** Quarter 6 11.3 9.5 1.8 13.0 11.1 2.0 Quarter 7 9.6 8.6 1.0 11.8 7.9 3.8 Quarter 8 10.2 7.6 2.6 12.0 6.8 5.3* Quarter 9 8.7 6.4 2.4 11.4 4.8 6.6*** Quarter 10 8.6 5.7 2.9* 12.5 4.1 8.4*** Quarter 11 6.5 4.5 2.1 8.4 3.0 5.4** Quarter 12 6.2 4.8 1.4 7.7 5.5 2.2 Quarter 13 5.4 6.8 -1.4 Quarter 14 4.4 4.4 0.0 Quarter 15 4.7 2.8 1.9 Quarter 16 5.7 4.0 1.7 Quarter 17 4.3 2.7 1.6 Quarter 18 2.6 3.1 -0.5
Sample Size 528 515 229 228
Note: A two-tailed test was applied to regression-adjusted impact estimates. Statistical significance levels are indicated as: * = 10 percent, ** = 5 percent, and *** = 1 percent.
Source: RCC enrollment management information system.
Appendix Abt Associates Inc. 84

Exhibit A.3 Average Earnings and Percent Employed by Follow-Up Quarter and T/C Status
Full Sample Early Cohort Follow-Up Quarter
Treatment Group
Control Group
TreatmentGroup
Control Group Impact Impact
Average Earnings ($) Quarter 0 1,436 1,502 -67 1,166 1,362 -196* Quarter 1 1,605 1,683 -78 1,275 1,501 -226* Quarter 2 1,602 1,727 -125 1,479 1,631 -152 Quarter 3 1,618 1,821 -203* 1,610 1,757 -147 Quarter 4 1,658 1,902 -244** 1,683 1,785 -101 Quarter 5 1,728 1,911 -183 1,638 1,727 -89 Quarter 6 1,766 2,162 -396*** 1,693 1,916 -223 Quarter 7 1,884 2,130 -246 1,734 1,924 -190 Quarter 8 1,771 2,137 -367** 1,768 1,980 -212 Quarter 9 1,830 2,104 -274* 1,815 2,070 -254 Quarter 10 1,931 2,191 -261 2,032 2,153 -120 Quarter 11 1,871 2,141 -270 Quarter 12 2,057 2,141 -84 Quarter 13 2,115 2,130 -14 Quarter 14 2,173 2,291 -118 Quarter 15 2,386 2,321 65 Quarter 16 2,584 2,661 -77 Employment Rate (%) Quarter 0 79.5 79.2 0.3 68.1 73.6 -5.5 Quarter 1 75.6 74.1 1.4 66.5 70.8 -4.4 Quarter 2 70.5 70.5 0.0 66.8 71.8 -5.0 Quarter 3 67.9 69.3 -1.3 69.1 71.3 -2.3 Quarter 4 65.5 69.8 -4.3 68.4 69.8 -1.4 Quarter 5 63.6 67.1 -3.5 64.7 66.0 -1.3 Quarter 6 62.3 67.0 -4.7 62.0 65.6 -3.5 Quarter 7 61.1 64.9 -3.9 57.8 63.6 -5.9 Quarter 8 58.4 62.9 -4.5 56.4 64.6 -8.2* Quarter 9 61.4 62.8 -1.4 62.0 63.4 -1.3 Quarter 10 58.8 63.9 -5.0 60.6 63.5 -2.9 Quarter 11 56.0 62.4 -6.4 Quarter 12 59.0 62.8 -3.8 Quarter 13 57.3 61.1 -3.8 Quarter 14 55.7 60.5 -4.8 Quarter 15 60.5 60.5 -0.1 Quarter 16 58.5 65.3 -6.8
Sample Size 526 512 227 226
Note: A two-tailed test was applied to regression-adjusted impact estimates. Statistical significance levels are indicated as: * = 10 percent, ** = 5 percent, and *** = 1 percent.
Source: UI quarterly earnings records.
Abt Associates Inc. Appendix 85

Exhibit A.4 Average TANF Payments and Receipt by Follow-Up Quarter and T/C Status
Full Sample Early Cohort Follow-Up Quarter
Treatment Group
Control Group
Treatment Group
Control Group Impact Impact
Average TANF Payments ($) Quarter 0 860 849 11 848 847 1 Quarter 1 1052 1021 32 1195 1132 63 Quarter 2 895 828 67 1038 901 137** Quarter 3 806 748 58 915 801 114* Quarter 4 733 681 53 817 704 114* Quarter 5 667 579 88* 714 611 102 Quarter 6 605 526 79* 608 548 60 Quarter 7 570 500 70 573 539 34 Quarter 8 546 471 75 608 530 79 Quarter 9 523 429 94** 551 469 82 Quarter 10 484 385 99** 496 390 107 Quarter 11 477 342 135*** 443 366 76 Quarter 12 451 323 128*** 456 348 108* Quarter 13 437 346 91 Quarter 14 383 351 33 Quarter 15 347 352 -5 Quarter 16 314 283 30 TANF Receipt Rate (%) Quarter 0 96.7 94.5 2.2* 97.6 93.2 4.4** Quarter 1 89.5 88.7 0.8 93.4 91.8 1.6 Quarter 2 76.7 73.4 3.3 84.0 78.4 5.5 Quarter 3 67.1 64.9 2.2 78.0 69.9 8.1** Quarter 4 60.2 57.7 2.5 69.4 62.3 7.1 Quarter 5 54.7 50.5 4.2 62.8 56.7 6.2 Quarter 6 48.9 45.9 3.0 53.5 49.4 4.1 Quarter 7 43.3 41.2 2.1 45.0 42.1 3.0 Quarter 8 41.1 37.3 3.9 42.8 40.3 2.5 Quarter 9 39.3 35.8 3.5 40.1 39.1 1.0 Quarter 10 36.5 31.9 4.6 37.9 33.4 4.4 Quarter 11 35.0 27.5 7.5** 34.2 29.3 4.9 Quarter 12 34.4 26.2 8.2** 35.4 27.2 8.2* Quarter 13 32.1 27.9 4.3 Quarter 14 29.7 28.9 0.8 Quarter 15 27.6 27.6 0.0 Quarter 16 25.4 21.9 3.5
Sample Size 528 515 229 228
Note: A two-tailed test was applied to regression-adjusted impact estimates. Statistical significance levels are indicated as: * = 10 percent, ** = 5 percent, and *** = 1 percent.
Source: DPSS TANF administrative records.
Appendix Abt Associates Inc. 86