college & university graduate retention in new …
TRANSCRIPT

i
COLLEGE & UNIVERSITY GRADUATE RETENTION
IN NEW BRUNSWICK
2010 - 2018
Erfan Mahmood Bhuiyan, MA Bethany Daigle, PhD
Ted McDonald, PhD Pablo Miah, MA, MSc

ii
PROJECT TITLE College & university graduate retention in New Brunswick: 2010 - 2018
PRINCIPAL INVESTIGATORS Ted McDonald, Director, NB-IRDT
RESEARCH TEAM Erfan Mahmood Bhuiyan, Data Analyst, NB-IRDT
Bethany Daigle, Scientific Writer, NB-IRDT
Pablo Miah, Data Analyst, NB-IRDT
PUBLICATON DATE March 2021
ACKNOWLEDGEMENTS Funding for this project was provided by the Government of New Brunswick, Department of Post-Secondary Education, Training and Labour (PETL) as part of a five-year research agreement
between PETL and NB-IRDT. Funding was also provided by the Atlantic Canada Opportunities
Agency (ACOA) in the form of a research grant. The views expressed in this study do not necessarily represent those of PETL, ACOA, or their partners.
HOW TO CITE THIS PRODUCT Bhuiyan, E.M., Daigle, B., McDonald, T., & Miah, P (2020). College & university graduate retention in New Brunswick: 2010 - 2018. Fredericton, NB: New Brunswick Institute for Research, Data and
Training.

iii
TABLE OF CONTENTS CAMPUS LOCATIONS OF POST-SECONDARY INSTITUTIONS IN NB ......................................................... vi
ABBREVIATIONS .......................................................................................................................................... vii
EXECUTIVE SUMMARY .................................................................................................................................. 1
Highlight of Findings ................................................................................................................................. 1
INTRODUCTION ............................................................................................................................................. 2
Background .............................................................................................................................................. 3
Literature Review ..................................................................................................................................... 3
Data and Methodology ......................................................................................................................... 5
RESULTS .......................................................................................................................................................... 9
Total ........................................................................................................................................................... 9
By Gender ............................................................................................................................................... 11
By Previous Residence .......................................................................................................................... 14
By Student Status ................................................................................................................................... 18
By Field of Study ..................................................................................................................................... 21
By Field of Study & Gender................................................................................................................... 25
By Nursing & Other Health-Related Fields ........................................................................................... 28
By Health-Related Fields & Previous Residence ................................................................................. 32
By Level of Education............................................................................................................................ 35
*Undergraduates include certificate and diploma holders from universities. ............................... 36
By Educational Institution ...................................................................................................................... 37
DISCUSSION OF FINDINGS ......................................................................................................................... 42
REFERENCES ................................................................................................................................................ 48
APPENDIX A: A COMPARISON OF MEDICARE AND TAX DATA RESULTS .............................................. 50
LIST OF FIGURES
Figure 1: Distribution Among Unmatched Graduates by Previous Residence .................................... 8
Figure 2: 1-Year Retention Rates of University and College Graduates ............................................. 10
Figure 3: 3-Year Retention Rates of University Graduates .................................................................... 11
Figure 4: 1-Year Retention Rates of Graduates by Gender ................................................................. 13
Figure 5: 3-Year Retention Rates of Graduates by Gender (University) ............................................. 14
Figure 6: 1-Year Retention Rates of Graduates by Previous Residence (University) ......................... 16
Figure 7: 1-Year Retention Rates of Graduates by Previous Residence (College) ........................... 17
Figure 8: 3-Year Retention Rates of Graduates by Previous Residence (University) ......................... 18
Figure 9: 1-Year Retention Rates of Graduates by Student Status ...................................................... 20
Figure 10: 3-Year Retention Rates of Graduates by Student Status (University) ................................ 20
Figure 11: 1-Year Retention Rates of Graduates by Field of Study & Gender (University),
Pooled 2010 - 2018..................................................................................................................................... 27

iv
Figure 12: 3-Year Retention Rates of Graduates by Field of Study & Gender (University),
Pooled 2010 - 2016..................................................................................................................................... 28
Figure 13: 1-Year Retention Rates of Graduates by Health-Related Fields (College) ...................... 31
Figure 14: 1-Year Retention Rates of Graduates by Level of Education ............................................ 36
Figure 15: 3-Year Retention Rates of Graduates by Level of Education ............................................ 36
Figure 16: 3-Year Retention Rates of Graduates by Educational Institution
(Undergraduate-Only* Students)............................................................................................................. 40
Figure 17: 3-Year Retention Rates of Graduates by Educational Institution (All Graduates) .......... 41
LIST OF TABLES Table 1: Institutions and Data Ranges ....................................................................................................... 6
Table 2: Distribution of Matched and Unmatched Graduates from Publicly Funded Post-
Secondary Institutions in NB (2010-2018) ................................................................................................... 8
Table 3: Annual Distribution of Matched University Graduates in NB (2010-2018) .............................. 9
Table 4: Annual Distribution of Matched College Graduates in NB (2017-2018) .............................. 10
Table 5: Total Number of Graduates in NB by Gender (University) ..................................................... 12
Table 6: Total Number of Graduates in NB by Gender (College) ....................................................... 12
Table 7: Total Number of Graduates in NB by Previous Residence (University) ................................. 15
Table 8: Total Number of Graduates in NB by Previous Residence (College) ................................... 15
Table 9: Total Number of Graduates in NB by Student Status (University) .......................................... 19
Table 10: Total Number of Graduates in NB by Student Status (College) .......................................... 19
Table 11: Total Number of Graduates in NB by Field of Study (University) ......................................... 21
Table 12: Total Number of Graduates in NB by Field of Study (College) ........................................... 22
Table 13: 1-Year Retention Rates of Graduates by Field of Study (University) ................................... 23
Table 14: 1-Year Retention Rates of Graduates by Field of Study (College) ..................................... 24
Table 15: 3-Year Retention Rates of Graduates by Field of Study (University) ................................... 24
Table 16: Total Number of Graduates in NB by Field of Study & Gender (University), Pooled
2010 - 2018 .................................................................................................................................................. 25
Table 17: Total Number of Graduates in NB by Field of Study & Gender (College), Pooled
2010 - 2018 .................................................................................................................................................. 26
Table 18: Total Number of Graduates in NB by Health-Related Fields: UNB & UdeM ....................... 29
Table 19: Total Number of Graduates in NB by Health-Related Fields (College) .............................. 29
Table 20: 1-Year Retention Rates of Graduates in NB by Health-Related Fields – UNB .................... 30
Table 21: 1-Year Retention Rates (Pooled 2010-2018) of Graduates in NB by Health-Related
Fields – UdeM ............................................................................................................................................. 30
Table 22: 3-Year Retention Rates of Graduates in NB by Health-Related Fields – UNB .................... 31
Table 23: 3-Year Retention Rate (Pooled 2010-2016) of Graduates in NB by Health-Related
Fields – UdeM ............................................................................................................................................. 32
Table 24: Number of Health Graduates by Previous Residence (UNB: 2010-2018) ........................... 32
Table 25: Number of Health Graduates by Previous Residence (UdeM: 2010-2018)........................ 33
v
Table 26: Number of Health Graduates by Previous Residence (College: 2017-2018) .................... 33
Table 27: 1-Year Retention Rates of Health Graduates by Previous Residence
(UNB: 2010-2018) ........................................................................................................................................ 33
Table 28: 1-Year Retention Rates of Health Graduates by Previous Residence
(UdeM: 2010-2018) ..................................................................................................................................... 34
Table 29: 3-Year Retention Rates of Health Graduates by Previous Residence
(UNB: 2010-2016) ........................................................................................................................................ 34
Table 30: 3-Year Retention Rates of Health Graduates by Previous Residence
(UdeM: 2010-2016) ..................................................................................................................................... 34
Table 31: Total Number of Graduates in NB by Level of Education .................................................... 35
Table 32: Total Number of Graduates in NB by Educational Institution (Undergraduate-Only*
Students) ..................................................................................................................................................... 37
Table 33: Total Number of Graduates in NB by Educational Institution (All Graduates) .................. 38
Table 34: Distribution of Graduates in NB by Educational Institution (All Graduates) & Previous
Residence ................................................................................................................................................... 38
Table 35: 1-Year Retention Rates of Graduates by Educational Institution (Undergraduate-
Only* Students) .......................................................................................................................................... 39
Table 36: 1-Year Retention Rates of Graduates by Educational Institution (All Graduates) ........... 40
Table 37: Comparison Between Tax and Medicare Records .............................................................. 52
Table 38: Percentage of University Graduates who File Taxes ............................................................ 53
Table 39: Annual Distribution of Matched University Graduates in NB from 2010 to 2016 ............... 53
Table 40: Total Number of University Graduates in NB .......................................................................... 53
Table 41: Total Number of University Graduates in NB by Level of Education................................... 54
Table 42: Total Number of University Graduates in NB by Institution ................................................... 54
Table 43: Retention Rates for University Graduates by Data Source .................................................. 55
Table 44: Retention Rates for NB Institutions by Data Source .............................................................. 55
vi
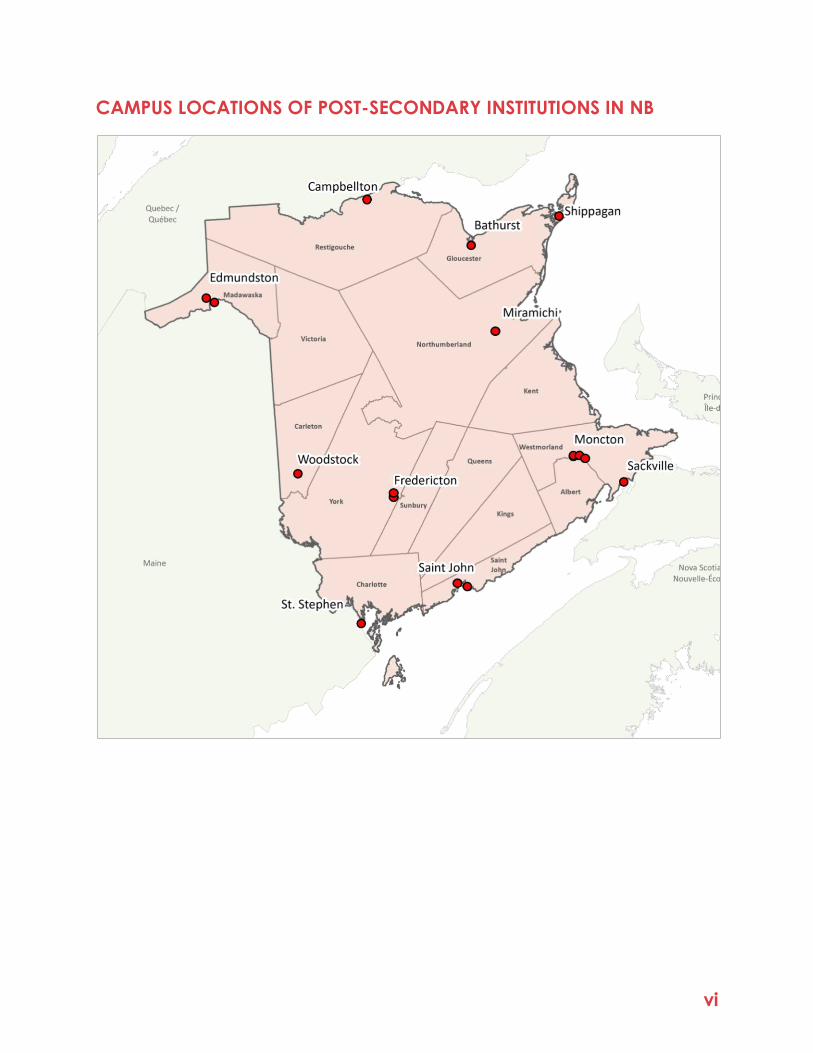
CAMPUS LOCATIONS OF POST-SECONDARY INSTITUTIONS IN NB

vii
ABBREVIATIONS
CCNB: Collège communautaire du Nouveau-Brunswick
EECD: Education and Early Childhood Development
MPHEC: Maritime Provinces Higher Education Commission
MTA: Mount Allison University
NBCC: New Brunswick Community College
NBCCD: New Brunswick College of Craft and Design
STU: St. Thomas University
UdeM: Université de Moncton
UNB: University of New Brunswick

1
EXECUTIVE SUMMARY New Brunswick (NB) invests substantially in educating post-secondary students, but how many of
these students stay and contribute to the local economy? College and university graduates are
among the most mobile Canadians, and when qualified graduates leave the province, taking their human capital and potential earnings with them, much of that investment is lost.
Estimating graduate retention rates can help determine if NB is seeing a high or low return on its
investments, and understanding what kinds of graduates are leaving can help inform targeted
policies that encourage graduates to stay. To this end, this report measures the retention of graduates of publicly funded colleges and universities in NB – specifically, graduates of UNB,
UdeM, MTA, STU, NBCC, CCNB, and NBCCD.
Using matched administrative data from the University and Community College Registrar
Databases and the Citizen Database, this report provides descriptive statistics on the number of
graduates and 1-year retention rates of graduates from the NB institutions listed above, as well as 3-year retention rates among university graduates.
Highlight of Findings
• About 73% of university graduates and 93% of college graduates are matched to the
Citizen Database.
• University graduates have an overall 1-year retention rate of 68%, whereas college
graduates have an overall 1-year retention rate of 91%.
• Among university graduates, 1-year retention rates by previous residence are 89% for NB
residents, 30% for Out of Province graduates, and 34% for Out of Country graduates.
• Among college graduates, 1-year retention rates by previous residence are 97% for NB
residents, 27% for Out of Province graduates, and 50% for Out of Country graduates.
• Domestic university graduates have a 1-year retention rate of 73%, and international
student graduates (student immigration status) have a 1-year retention rate of 32%.
• 1-year retention rates are 71% for female university graduates and 69% for male university
graduates. 1-year retention rates for female and male college graduates are 91%.
• Graduates from NBCC and CCNB have 1-year retention rates of 94% and 85%,
respectively. The highest 1-year retention rate for universities is for UdeM (84%), and the
lowest is for MTA (42%).
The discrepancy between matching ratios and retention rates for universities and colleges is
most likely caused by the composition of graduates by location of previous residence. Approximately 90% of college graduates are NB residents, whereas about 64% of university
graduates are NB residents. The institutions with a high representation of NB graduates (i.e.
NBCC, CCNB, UdeM) exhibit higher retention rates than those with more varied representation (i.e. MTA, UNB). University graduates are also generally more mobile in their search for
employment that matches their skills and wage demand. However, international students’
retention rates have been on the rise more recently, suggesting targeted retention policies are proving effective.
Similar to previous studies, we find that graduates who are originally from NB are more likely to stay, and college graduates who are originally from NB are the most likely of all.

2
INTRODUCTION New Brunswick (NB) invests substantially in educating post-secondary students. When qualified
graduates leave the province, much of that investment is lost, as they take their human capital
(and potential earnings) with them when they relocate. Understanding what kinds of graduates are leaving and what kinds of graduates are staying can help inform targeted policies that
encourage graduates to stay and contribute to the local economy, and estimating graduate retention rates can help determine if NB is seeing a high or low return on its investments.
The objective of this report is to present a statistical description of individuals who have graduated from the following publicly funded colleges and universities in NB:1
• The University of New Brunswick (UNB)
• Université de Moncton (UdeM)
• Mount Allison University (MTA)
• St. Thomas University (STU)
• New Brunswick Community College (NBCC)
• Collège communautaire du Nouveau-Brunswick (CCNB)
• The New Brunswick College of Craft and Design (NBCCD)
To better understand which graduates have a higher probability of remaining in the province, we examine
• the number of post-secondary graduates who stayed in New Brunswick and
• the retention rates of post-secondary graduates who stayed in New Brunswick.
More specifically, we analyze the number and retention rates of post-secondary graduates
remaining in NB 1 year and 3 years after graduation.
To obtain our results, we matched data from the Citizen Database with data from the NB
University and Community College Registrar Databases for analysis. Matching graduation data to the Citizen database (the analytic version of the Medicare Registry) is advantageous
because Medicare coverage in NB is nearly universal (McDonald et al., 2018). The longitudinal
nature of these data files allows individuals – and their mobility decisions – to be tracked and observed over time. Results are broken down by year of graduation, demographics,2 and
educational background.3
In the following sections, we review the existing literature on different dimensions of retention
across different profiles, followed by a discussion of the key definitions, concepts, datasets, and methodology used in this study. We then present the empirical findings. Finally, we summarize
the main results, draw policy implications, and suggest potential avenues for future work.
1 The Maritime College of Forest Technology is excluded from this study. 2 For the purposes of this report, investigated demographics include gender, immigrant status, and previous residence. 3 For the purposes of this report, information on educational background includes institution of study, level of education, and field of study, with results broken down by colleges and universities.

3
Background Population retention in New Brunswick is a pressing policy concern. An aging population and the
interprovincial migration of youth are creating a demographic shift that will continue to impact
the province’s economy, tax base, and social support system. According to the Government of
New Brunswick’s population growth strategy for 2019-2024 (GNB, 2019), the number of working-
age individuals for each senior in NB decreased from 4.6 to 3.1 between 2008 and 2018, and this
ratio is expected to decline further.
While NB invests heavily in measures to tackle these demographic challenges, it also invests
substantially in post-secondary education. Yet, when graduates leave the province, much of
that investment is lost. Not only is the retention of graduates important to combat an aging
population, but taxes on their earnings could also be used to revitalize the provincial economy,
creating a stronger social support system. Understanding the characteristics of graduates who
are staying and graduates who are leaving can help inform the design and delivery of more
targeted policies that may encourage future graduates to stay in NB.
Literature Review
Ample literature exists on the employment and earnings effects of various college and university
degree programs, but there is a lack of studies on the retention of graduates within particular
jurisdictions. The literature that does exist shows that the most important determinant of retention
for graduates is their previous place of residence. If graduates are originally from the region in
which they studied, they are more likely to stay.
2-Year Maritime Retention Rates – MPHEC Survey Data
Of the most relevant existing literature, the Maritime Provinces Higher Education Commission
(MPHEC) surveyed a sample of Maritime university graduates 2 years after completing their
degrees to estimate retention rates.4 The analysis (MPHEC, 2018) was limited to graduates from
bachelor’s programs who had not completed any other post-secondary education prior to
enrolling in their first degree.
Their most recent data, which represents the class of 2014, shows the 2-year retention rates of
graduates in their province of study (57% for NB, 54% for NS, and 59% for PEI).
When only the retention rates of Maritimers in their home province are considered, MPHEC results
show that 74% of New Brunswickers, 76% of Nova Scotians, and 66% of Prince Edward Islanders
were residing in their home province 2 years after graduation.
For those from outside the Maritimes, only 4% of graduates from NB universities remained in the
province 2 years after graduation, indicating that a graduate’s province of origin is a strong
determinant of retention. Following graduation, Maritimers are much more likely to stay in the
region than their peers who came to study from outside the Maritimes. Retention rates for both
groups have remained relatively steady over the last 15 years for all examined cohorts.
4The graduating classes of 1999, 2003, 2007, 2012, and 2014 were surveyed 2 years after graduation.

4
The results of our study are similar to those of MPHEC (2018), though the methodologies differ.
While MPHEC uses a survey-based approach, we use administrative Medicare data to identify
location. Thus, our work uses a much larger sample size, as survey data relies on information from
a sample of the specified population, whereas administrative data contains information on a
specified population as a whole. Moreover, our study takes a more focused approach, as it
examines only graduates from NB instead of the entire Maritimes; and it is more comprehensive
and wider in scope, as it covers all post-secondary graduates – even those with previous post-
secondary education. While we do not expect to achieve exactly the same results as previous
works when using different datasets (i.e., survey data vs. administrative data), the similarity of this
report’s findings and MPHEC findings indicates our results are robust and not overly sensitive, at
the macro level, to approach.
1-Year Maritime Retention Rates – PSIS and Income Tax Data
Galarneau et al. (2017) estimated 1-year retention rates of undergraduate and graduate
students from universities in the Maritimes by combining Postsecondary Information System (PSIS)
data with personal income tax data. Their study combined 6 cohorts of graduates (classes of
2006-2011), as retention rates between the cohorts did not vary significantly. For those with an
undergraduate degree, retention rates were higher for women (70%) than for men (64%).
Retention rates were highest for undergraduates whose place of residence at the time of
admission was in the Maritimes: 83% for women and 77% for men. They were lowest for those
who lived elsewhere in Canada at the time of admission: 15% for both men and women. For
those who came from outside Canada, more than half stayed in the Maritimes after graduating:
retention rates were 51% for women and 56% for men, and these patterns were similar for those
with graduate degrees.
Galarneau et al. (2017) show that retention rates vary by field of study. Graduates from fields
such as education, mathematics and computer and information sciences, humanities, and
health and related fields had relatively high retention rates for both men and women.
Graduates from architecture and engineering programs had the lowest retention rates among
women and the second lowest among men.
Their study also suggests that employment opportunities in specific industries located in other
regions of Canada may explain why some graduates choose to leave; and the authors point
out that the economic prosperity of Western Canada from 2007 to 2012 may have attracted a
number of graduates from Maritime universities during those years.
While Galarneau et al. (2017) use different data sources than this report, we found similar
retention rates for female and male undergraduates (71% and 69%, respectively). Again, this
similarity in findings suggests that despite differences in approach and methodology, our results
are robust.

5
Graduation Year and 2-Year Retention Rates – PSIS and T1 Family File Data
A forthcoming study (Boco, et al., 2020) uses data from PSIS and the T1 Family File (tax records)
to examine labour market outcomes and retention of graduates from post-secondary institutions
in NB. Two retention measures are used in the study: the percentage of graduates still residing in
NB as of Dec. 31 of the graduation year, and the percentage of graduates still residing in NB 2
years later. For instance, for a student who graduated in June 2014, the study measures where
he/she reported living in tax returns on December 31, 2014 and on December 31, 2016.
It should be noted that the study measures the retention of only those who filed a tax return.
Results show that on average 78% of graduates remain in NB at the end of December of their
graduation year, and on average 72% are still in NB 2 years later. The study also finds that
students residing in NB prior to admission are the most likely to remain in the province, averaging
a 92% retention rate in the graduation year and 84% 2 years later.
It is not surprising that the results of the Boco et al. (2020) study differ somewhat from the results of
this report, as the former uses information from different datasets and employs different
methodology, as well as different match rates between PSIS and other administrative data. For
instance, Boco et al. (2020) examine retention rates of college and university graduates
together, whereas this report examines college and university retention rates separately.
Nonetheless, their findings for all graduates still fall between our findings for college and
university graduates.
Takeaway
The most common finding from the above studies is that province or region of residence prior to
enrollment in post-secondary education is a key determinant in predicting retention. Higher
retention rates are expected among graduates who were already living in their home province
at the time of their admission, given family ties, friendships, and other bonds they developed in
the province. Since home province is a key determinant in retention, and given the home
province university participation rate5 is about 17% for NB based on the most recent MPHEC
data, it could be worth considering ways additional strategies could be designed and
implemented to increase the number and proportion of domestic graduates from NB.
Data and Methodology
Data
The results of this report are based on the University and Community College Registrar data
provided by the investigated post-secondary education institutions and on data from the Citizen
Database, available through the New Brunswick Institute for Research, Data and Training (NB-IRDT).
5 Home Province Participation: Number of students enrolled full-time in their home province divided by the provincial population aged 18-24

6
Education Data
The University and Community College Registrar data contains information on individuals who
previously attended or are currently attending any of the 7 different institutions examined in this report. Among other variables, it includes information on the students’ graduation date, student
status, gender, level of education (undergraduate, graduate, college), field of study, program
completion status, and permanent province of residence.
This study only includes individuals who graduated from the 7 specified institutions. Individuals
who have not completed their degrees/diplomas are excluded from our analysis.
Our analysis only includes years for which the educational institutions collected 12 full months
(calendar year) of data (see Table 1).
Table 1: Institutions and Data Ranges
Institution Available Data
UNB 2010-2018
UdeM 2010-2018
MTA 2014-2018
STU 2014-2018
NBCC 2017-2018
CCNB 2017-2018
NBCCD 2017-2018
Humber College Data
One anomaly discovered in the data for UNB students is that graduates of the UNB
Bachelor of Nursing program in Humber College, Ontario, were classified as UNB graduates in the data provided by UNB. Clearly, the question of retention in NB does not
apply to these students. Because of residual disclosure issues, overall statistics for UNB
graduates contain these students, but the net effect on retention estimates is trivial. Statistics based on field of study, and in particular statistics for UNB Nursing graduates,
exclude Humber college graduates from the results reported here.
Citizen Database
The Citizen Database is a longitudinal and administrative database that contains basic
demographic and geographic information on all NB residents who have been issued a provincial Medicare card. The database also contains Medicare eligibility status, such as
whether a Medicare status is “Active” or “Terminated.” This study uses Citizen Database data
from 2010 until the end of 2018.

7
Methodology
This study links data from the University and Community College Registrar Databases and the Citizen Database for analysis, as the longitudinal nature of these datasets allows individuals –
and their mobility – to be tracked and observed over time.
As in previous work on the retention of immigrants (see Leonard et al., 2019; McDonald et al.,
2018), this report assumes that an individual’s NB Medicare status identifies whether he/she
remained in the province and, if so, how long he/she remained. An individual’s departure from the province is determined by the date of termination of his/her active Medicare status in the
Citizen Database. Persons living in NB are extremely likely to have registered with NB Medicare,
as this government program covers the cost of many medical expenses. This makes Medicare Registry data a fairly reliable source for estimating residence in NB (see McDonald et al., 2018).
“Matched” individuals (i.e. individuals with Medicare information) are considered to be
retained if they have an Active Medicare Registration in NB 1 year or 3 years after the
date of graduation – otherwise, they are considered to have left the province on or prior to the date of termination of an active Medicare status.
“Unmatched” individuals (i.e. individuals with no Medicare information) are also assumed
to have left the province.
Individuals could be unmatched for a variety of reasons. The main reason is that a graduating
student does not have an Active Medicare status because he/she does not remain in NB after
graduation. However, other individuals may be unmatched because of missing information or information that is not reported consistently across both datasets. Since matching is based on
date of birth, gender, and name, errors may occur, resulting in an unmatched individual even
though he/she is actually residing in NB after graduation. Match rates are likely to be lower for Out of Province graduates since they might have retained home province health insurance or
may not have been eligible for Medicare (e.g., international students prior to 2017).
As such, the retention rates presented in this analysis are likely to be understated, as graduates
who are unmatched due to technical errors (such as name or gender errors) are assumed to
have left the province. A number of these unmatched graduates may still be in the province, but they are considered to have left due to a lack of Medicare information.
Using the datasets described above, this study reports the number of graduates across different profile categories and across years. Profile categories include universities and community
colleges, gender,6 immigrant status,7 institution, level of education (undergraduate, graduate,
college), field of study, and previous residence. The number of students who graduated each year is based on calendar year and not academic year.
1-year and 3-year retention rates of graduates are also presented. For an individual who completed multiple programs within a year, only the most recent program is considered.
Individuals who continued their studies upon graduation are included in the dataset, and their
retention analysis is based on their date of graduation from the program they previously completed. Retention rates are in presented terms of percentages.
6 Some graduates from UNB (mainly students studying overseas/online) have “Unknown” gender. These students are excluded from analysis by gender. 7 Some international students from UNB do not hold any visa (i.e. they are studying overseas/online). These students are excluded from the sample, and hence not all international graduates from UNB are included in this study.

8
Accounting for Unmatched Individuals
Some insights into the reasons why individuals are unmatched in the data can be derived by considering match rates based on graduates’ permanent residence as stated at their time of
enrollment in post-secondary education. This accounting for unmatched individuals is based on students’ previous residence, and previous residence is based on the “permanent province”
reported by the student in the earliest reporting year of their post-secondary education.
Graduates are classified as from NB if they state their permanent province is NB. If the previous
residence of a graduate is NB, we might assume the student is unmatched due to technical
errors, since permanent NB residents should be registered in Medicare.
Graduates are classified as Out of Province (Domestic) if they state their permanent province is
other than NB, and they are classified as Out of Country (International) if their student status
suggests they are not Canadian citizens or permanent residents, regardless of the permanent
province reported by them. If the previous residence of a graduate is Out of Province or Out of Country, that individual is assumed to be unmatched due to not having Medicare while a
student and not enrolling in Medicare after graduation.
Table 2: Distribution of Matched and Unmatched Graduates from Publicly Funded Post-
Secondary Institutions in NB (2010-2018)
All Graduates Matched Unmatched Proportion of
Unmatched
Total 43,958 33,513 10,445 24%
Table 2 above shows the distribution of matched and unmatched graduates in this study. Among the 43,958 individuals who graduated from publicly funded post-secondary institutions
between 2010 and 2019, 10,445 (24%) are unmatched. Out of these 10,445 unmatched
graduates, approximately 88% (55% Out of Province and 33% Out of Country) did not indicate NB as their previous residence (Figure 1). This indicates that those who could not be matched
are most likely not from the province and most likely left after graduation.
Figure 1: Distribution Among Unmatched Graduates by Previous Residence
12%
55%
33%
New Brunswick Out of Province (Domestic) Out of Country (International)

9
RESULTS
Total
The tables below exhibit the annual number of total graduates from public post-secondary
institutions in NB, along with the matching ratio. The matching ratio shows the proportion of graduates from NB post-secondary institutions linked to the Citizen Database (provincial
Medicare), and it is calculated by dividing the number of graduates who are matched to the
Citizen Database registry by the total number of graduates.
Along with counts, this section also presents estimates for 1-year and 3-year retention rates of all
graduates in the province with the assumption that unmatched graduates are not retained in NB. Descriptive statistics are presented separately for university and college graduates.
Counts with Matching Ratios
In Table 3, university data for the years 2014 and 2018 (the 5 years with all university data) suggests that the annual number of graduates from NB is around 4,500.
From 2014, the numbers move upward as MTA and STU datasets become available. Institution-specific statistics are presented later in the report.
The matching ratio for university graduates hovers around 70%, and the overall matching ratio is 73%, which is likely due to Out of Province and Out of Country students comprising a significant
proportion of university graduates.
Table 3: Annual Distribution of Matched University Graduates in NB (2010-2018)
Graduation Year Total
Graduates
Matched
Graduates
Matching
Ratio
2010 3,646 2,727 75%
2011 3,682 2,782 76%
2012 3,555 2,727 77%
2013 3,612 2,787 77%
2014 4,681 3,272 70%
2015 4,672 3,322 71%
2016 4,554 3,195 70%
2017 4,432 3,169 72%
2018 4,182 3,043 73%
*STU and MTA data begin in 2014.
Compared to the 73% matching ratio for university graduates, the matching ratios for college
graduates is significantly higher (93% overall). This is due to the high proportion of NB residents

10
among college graduates, who are more likely to have provincial Medicare prior to enrollment and are therefore more likely to be matched (see Table 4).
Table 4: Annual Distribution of Matched College Graduates in NB (2017-2018)
Graduation Year Total
Graduates
Matched
Graduates
Matching
Ratio
2017 3,460 3,222 93.1%
2018 3,482 3,267 93.8%
1-year Retention Rates
The overall 1-year retention rate for university graduates is around 68% (see Figure 2), which is
lower than the 1-year retention rate for college graduates (91%).
Similar to matching ratios, the disparity between the retention rates of university and college
graduates can be attributed to the proportion of NB and Non-NB (Out of Province and Out of Country) graduates, since colleges mostly consist of NB residents, who are more likely to remain
in the province after graduation. In addition to having a higher ratio of Out of Province and Out
of Country graduates, university graduates are generally more mobile in terms of the labour market, as they may find better opportunities and greater diversity of jobs elsewhere (Wozniak,
2010). Thus, they might be more likely to leave the province.
Figure 2: 1-Year Retention Rates of University and College Graduates
*STU and MTA data begin in 2014.
70% 71% 70% 70%65% 67% 67% 68% 68%
91% 91%
0%
10%
20%
30%
40%
50%
60%
70%
80%
90%
100%
2010 2011 2012 2013 2014 2015 2016 2017 2018
1-YEAR(University) 1-YEAR(College)

11
3-year Retention Rates
Overall, 61% of university students remain in NB 3 years after graduation. Even though retention rates remain fairly similar through the years, there is a slight drop as of 2014, when the 3-year
retention rates include MTA and STU data.
Figure 3: 3-Year Retention Rates of University Graduates
*STU and MTA data begin in 2014.
The findings of this section indicate that college graduates have higher 1-year retention rates
than university graduates (3-year retention rates for college graduates are unavailable due to a lack of available data from earlier years). Likewise, the matching ratios for college graduates
are higher than those of university graduates. These differences are possibly due to the large
proportion of NB residents among college graduates compared to the smaller proportion of NB residents among university graduates, along with the greater mobility of university graduates
and the higher likelihood that previous residents of NB will remain in the province.
By Gender
The estimates below present the counts and retention rates of both university and college
graduates, stratified by gender. Any graduates with a gender status that is “Not Available” or
“Unknown” have been excluded from the analysis by gender. Therefore, this section’s sample
size is not identical to the rest of the report.
62%
63% 63%62%
58%
61%
61%
55%
56%
57%
58%
59%
60%
61%
62%
63%
64%
2010 2011 2012 2013 2014 2015 2016
3-YEAR(University)

12
Counts
University
Table 5 shows that the proportion of female university graduates is approximately 1.5 times higher than the proportion of male graduates. The changes in numbers over the years are
reflective of the inclusion of different post-secondary institutions’ data, including the significant
rise in both male and female graduates in 2014 reflecting the inclusion MTA and STU graduates.
Table 5: Total Number of Graduates in NB by Gender (University)
Graduation
Years Male Female
2010 1,429 2,111
2011 1,391 2,133
2012 1,413 1,980
2013 1,484 1,997
2014 1,779 2,788
2015 1,833 2,737
2016 1,814 2,640
2017 1,717 2,620
2018 1,650 2,444
NOTE: ”Unknown” gender category is dropped from the sample, thus sample
size by gender is not equal to the sample size in the rest of the study.
College
The ratio between male and female graduates from college is basically 1:1, though the number of male college graduates is higher than that of females (see Table 6).
Table 6: Total Number of Graduates in NB by Gender (College)
Graduation
Years Male Female
2017 1,849 1,611
2018 1,854 1,628
NOTE: ”Unknown” gender category is dropped from the sample, thus sample size
by gender is not equal to the sample size in the rest of the study.
13
1-year Retention Rates
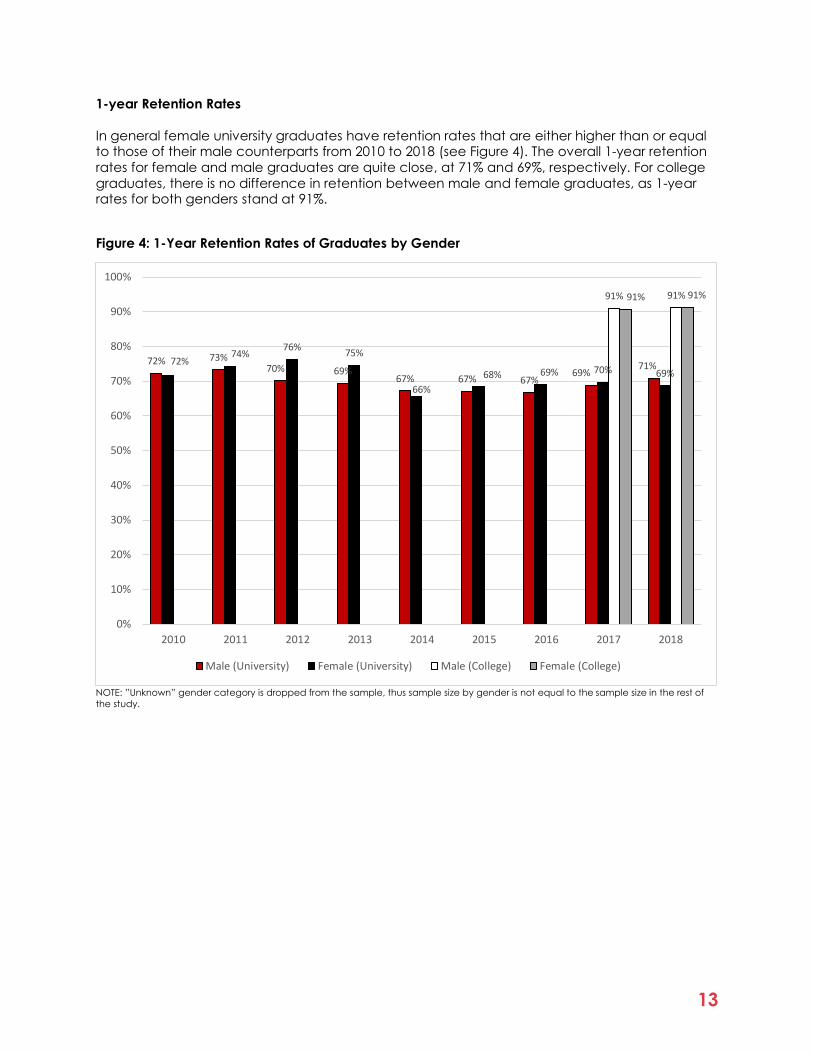
In general female university graduates have retention rates that are either higher than or equal to those of their male counterparts from 2010 to 2018 (see Figure 4). The overall 1-year retention
rates for female and male graduates are quite close, at 71% and 69%, respectively. For college
graduates, there is no difference in retention between male and female graduates, as 1-year rates for both genders stand at 91%.
Figure 4: 1-Year Retention Rates of Graduates by Gender
NOTE: ”Unknown” gender category is dropped from the sample, thus sample size by gender is not equal to the sample size in the rest of
the study.
72% 73%70% 69%
67% 67% 67%69%
71%72%74%
76%75%
66%
68% 69% 70% 69%
91% 91%91% 91%
0%
10%
20%
30%
40%
50%
60%
70%
80%
90%
100%
2010 2011 2012 2013 2014 2015 2016 2017 2018
Male (University) Female (University) Male (College) Female (College)

14
3-year Retention Rates
University
Figure 5: 3-Year Retention Rates of Graduates by Gender (University)
NOTE: ”Unknown” gender category is dropped from the sample, thus sample size by gender is not equal to the sample size in the rest of the study.
The trend of higher retention rates for females continues 3 years after graduation (see Figure 5).
Overall, the retention rate for female graduates is around 65%, while about 62% of male
graduates are likely to remain in the province 3 years after graduation. In other words, it appears that female graduates are slightly less likely to leave NB.
By Previous Residence
The previous residence of students is based on their permanent residence (province) in the earliest reporting cycle (i.e., during registration for a post-secondary institution), including
whether they are from NB or from Out of Province.
The Out of Country classification for international graduates is based on their student status,
which would indicate they are not Canadian citizens or permanent residents, irrespective of
their permanent residence in the first reporting cycle.
Counts
University
The number of Out of Country and Out of Province graduates gradually increased over the
study period (see Table 7). From 2010-2013, about two-thirds (70%) of all graduates indicated NB
was their previous residence. From 2014 onwards, around three-fifths (60%) of all university students were from NB, and the rest were from Out of Province (25%) and Out of Country (15%).
63% 63%
62% 62%
60% 61% 61%
64%
68%
69%
68%
60%
63%
64%
54%
56%
58%
60%
62%
64%
66%
68%
70%
2010 2011 2012 2013 2014 2015 2016
Male Female

15
Table 7: Total Number of Graduates in NB by Previous Residence (University)
Graduation
Year New Brunswick
Out of Province
(Domestic)
Out of Country
(International)
2010 2,507 701 438
2011 2,485 725 472
2012 2,466 556 533
2013 2,505 552 555
2014 2,871 1,106 704
2015 2,869 1,108 695
2016 2,746 1,099 709
2017 2,672 1,126 634
2018 2,402 1,204 576
*STU and MTA data begin in 2014.
College
Table 8 shows the vast majority (90%) of college graduates are from NB. The share of college
graduates from Out of Country is higher (7%) compared to Out of Province graduates (3%).
Table 8: Total Number of Graduates in NB by Previous Residence (College)
Graduation
Year New Brunswick
Out of Province
(Domestic)
Out of Country
(International)
2017 3,101 98 261
2018 3,099 103 280
1-year Retention Rates
University
Figure 6 below clearly shows that graduates originally residing in NB have much higher retention rates than Non-NB (Out of Province and Out of Country) graduates. Overall, 89% of NB
graduates are retained after 1 year. For Out of Province graduates, the overall 1-year retention
rate is at 30%, although it appears that since 2014 (even after the inclusion of STU and MTA data) the annual rate has dropped to about 25%.

16
Out of Country graduates initially exhibited lower retention rates than the other 2 categories, but as of 2015 more remained in province after 1 year as opposed to Out of Province graduates. The
notable rise in retention rates for international graduates from 2017 onwards could have been
caused by the implementation of policy making international students eligible to apply for provincial Medicare (i.e. more matched international graduates), as well as various student and
work permit programs aimed at international graduates.
Figure 6: 1-Year Retention Rates of Graduates by Previous Residence (University)
*STU and MTA data begin in 2014.
College
Figure 7 below shows that college graduates who are NB residents have much higher retention
rates (97%) than Out of Province and Out of Country graduates from college – a trend similar to
that of university graduates.
Overall, 50% of (international) college students from Out of Country remain in the province 1
year after graduating, which is significantly higher than Out of Province students, who have an overall retention rate of 27%.
0%
10%
20%
30%
40%
50%
60%
70%
80%
90%
100%
2010 2011 2012 2013 2014 2015 2016 2017 2018
New Brunswick Out of Province(Domestic) Out of Country(International)

17
Figure 7: 1-Year Retention Rates of Graduates by Previous Residence (College)
3-Year Retention Rates
University
The overall 3-year retention rate for NB university graduates is 80% (see Figure 8).
Retention rates are much lower for Out of Province and Out of Country graduates, who exhibit
overall retention rates of 28% and 26%, respectively.
Once again, these results show that one’s previous residence is the biggest indicator of
retention. In other words, if you are from NB, you are far more likely to remain in NB.
Among Non-NB students, Out of Country students appear to be retained more in recent years
than Out of Province students. This could be partially attributed to the growth of incentives for Out of Country graduates to stay in the province due to targeted student and employment
programs. It is also possible that as students originally from other provinces graduate in NB, they return to their home provinces, whereas international students may wish to stay because of
factors such as the financial costs of moving.
97% 97%
30%24%
47%53%
0%
10%
20%
30%
40%
50%
60%
70%
80%
90%
100%
2017 2018
New Brunswick Out of Province (Domestic) Out of Country (International)

18
Figure 8: 3-Year Retention Rates of Graduates by Previous Residence (University)
*STU and MTA data begin in 2014.
By Student Status
Any graduate whose student status indicates he/she is a Canadian citizen or permanent
resident on their graduation day is considered to be a domestic graduate.
Anyone without a Canadian citizenship or permanent residency visa is defined as an
international student.
International students studying overseas without any visa (such as those studying through NB
institutions’ international programs) are excluded from the sample, and thus not all international
graduates from an NB-branded institution are included in our analysis.
Counts
University
Table 9 reveals that the number of international students in the examined universities ranges
from 400 to more than 600 over the study period. The number of domestic graduates is about 6
times higher than the number of international graduates.
0%
10%
20%
30%
40%
50%
60%
70%
80%
90%
2010 2011 2012 2013 2014 2015 2016
New Brunswick Out of Province (Domestic) Out of Country (International)

19
Table 9: Total Number of Graduates in NB by Student Status (University)
Graduation
Years Domestic International
2010 3,237 409
2011 3,234 448
2012 3,044 511
2013 3,086 526
2014 4,011 670
2015 4014 658
2016 3,876 678
2017 3,829 603
2018 3,624 558
*STU and MTA data begin in 2014.
College
In NB colleges, the proportion of domestic graduates is 12 times higher than that of international
graduates, indicating that mostly Canadian students opt to pursue college education in NB (see
Table 10).
Table 10: Total Number of Graduates in NB by Student Status (College)
Graduation
Years Domestic International
2017 3,199 261
2018 3,202 280
1-Year Retention Rates
The retention rates for international graduates are much lower than the retention rates for domestic graduates (see Figure 9), which is consistent with the assumption that previous
residence is an important factor influencing retention.
Around 73% of domestic graduates from university remain in the province 1 year after
graduation, while about one-third (32%) of international graduates from university remain in the
province after 1 year. Similarly, domestic graduates from colleges exhibit a high retention rate of 95%, while about half of international graduates leave NB within a year of graduation.
Domestic graduates from colleges are much more likely to remain in the province as opposed
to international graduates.
20
Figure 9: 1-Year Retention Rates of Graduates by Student Status
*STU and MTA data begin in 2014.
3-year Retention Rates
University
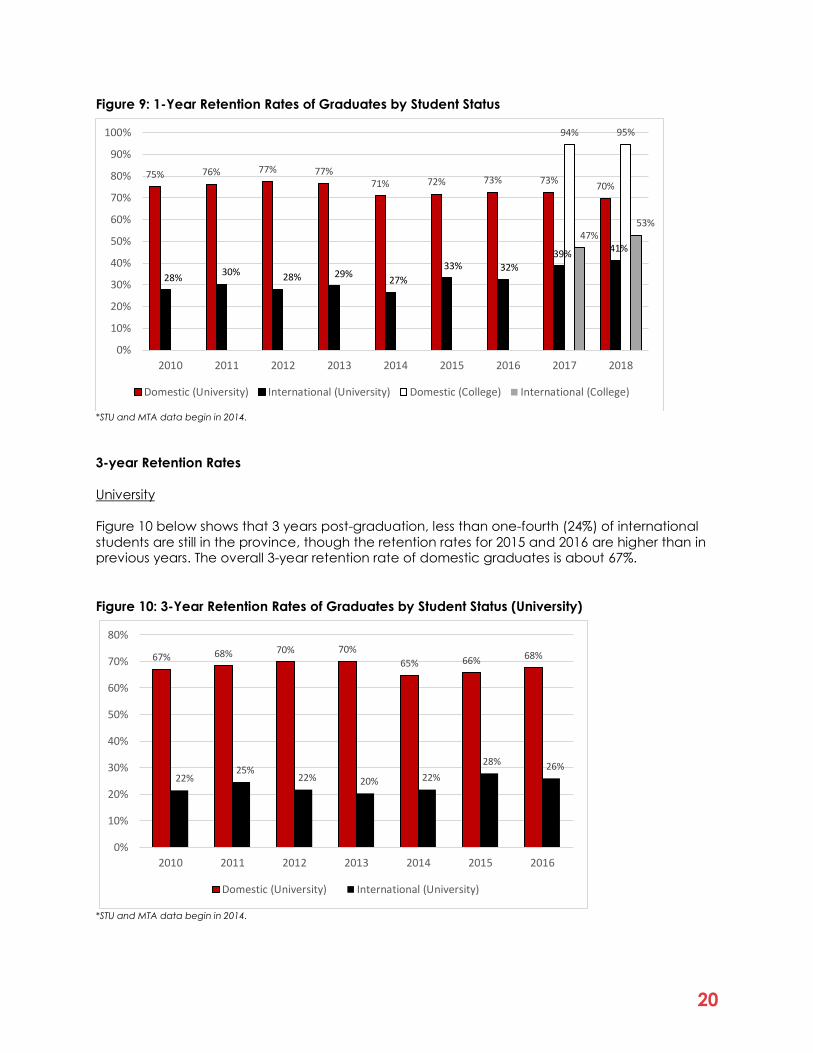
Figure 10 below shows that 3 years post-graduation, less than one-fourth (24%) of international
students are still in the province, though the retention rates for 2015 and 2016 are higher than in previous years. The overall 3-year retention rate of domestic graduates is about 67%.
Figure 10: 3-Year Retention Rates of Graduates by Student Status (University)
*STU and MTA data begin in 2014.
75% 76% 77% 77%71% 72% 73% 73%
70%
28%30% 28% 29%
27%
33% 32%
39%41%
94% 95%
47%53%
0%
10%
20%
30%
40%
50%
60%
70%
80%
90%
100%
2010 2011 2012 2013 2014 2015 2016 2017 2018
Domestic (University) International (University) Domestic (College) International (College)
67% 68% 70% 70%
65% 66% 68%
22%25%
22% 20% 22%
28% 26%
0%
10%
20%
30%
40%
50%
60%
70%
80%
2010 2011 2012 2013 2014 2015 2016
Domestic (University) International (University)

21
The retention rates for previous residence and student status are similar, showing that domestic graduates, especially those from NB, are more likely to be retained compared to international
(Out of Country) graduates. However, findings for recent years show that more international
students are being retained in the province compared to earlier periods, implying some effect of the various student and employment programs targeted at them, such as the Atlantic
Immigration Pilot Program (AIPP) and Atlantic Canada Study and StayTM – New Brunswick.
By Field of Study
The tables in this section disaggregate the number of graduates and their retention rates by field
of study based on primary groupings of the Classification of Instructional Programs (CIP).8 Due to low counts, some groups have been combined to meet the disclosure requirements.
Counts
University
In general, “Business, management & public administration” and “Health & related fields” have a higher number of university graduates compared to other groups in Table 11. The spike in
numbers for “Social sciences & law” from 2014 onwards can be attributed to the inclusion of
graduates from STU and MTA.
Table 11: Total Number of Graduates in NB by Field of Study (University)
Graduation Year
Education
Social
sciences & law
Business,
management & public
admin
Physical
& life sciences
& tech
Architecture,
engineering, & related tech
Health
& related
fields
Other
2010 704 410 739 318 350 622 382
2011 774 397 736 283 324 639 391
2012 607 347 817 323 355 688 418
2013 602 400 834 302 404 712 358
2014 621 772 973 447 400 657 616
2015 585 876 899 468 390 693 555
2016 556 803 887 512 416 642 559
2017 549 825 872 490 426 617 454
2018 532 676 789 451 400 563 541
a) Physical & life sciences & tech: This field also includes Mathematics, computer & information sciences b) Other includes: 1) Humanities, 2) Visual and performing arts, and communications tech, 3) Agriculture, natural resources and conservation
*STU and MTA data begin in 2014.
8 The Classification of Instructional Programs (CIP) 2011 version was jointly compiled by Statistics Canada and the National Center for Education Statistics in the United States.

22
College
Over one-third of total college graduates are in the “Architecture, engineering and related
technologies” group (Table 12). The “Education” category has the lowest number of graduates among all college students.
Table 12: Total Number of Graduates in NB by Field of Study (College)
Graduation Year
Education
Social
sciences & law
Business,
management & public
admin
Physical
& life sciences
& tech
Architecture,
engineering, & related tech
Health
& related
fields
Other
2017 33 229 693 252 1,215 552 486
2018 58 265 730 243 1,196 463 527
a) Physical & life sciences & tech: this field also includes Mathematics, computer & information sciences b) Other includes: 1) Humanities, 2) Visual and performing arts, and communications tech, 3) Agriculture, natural resources and conservation
1-year Retention Rates
University
The differences in 1-year retention rates between various fields of study among university
graduates are relatively minor.
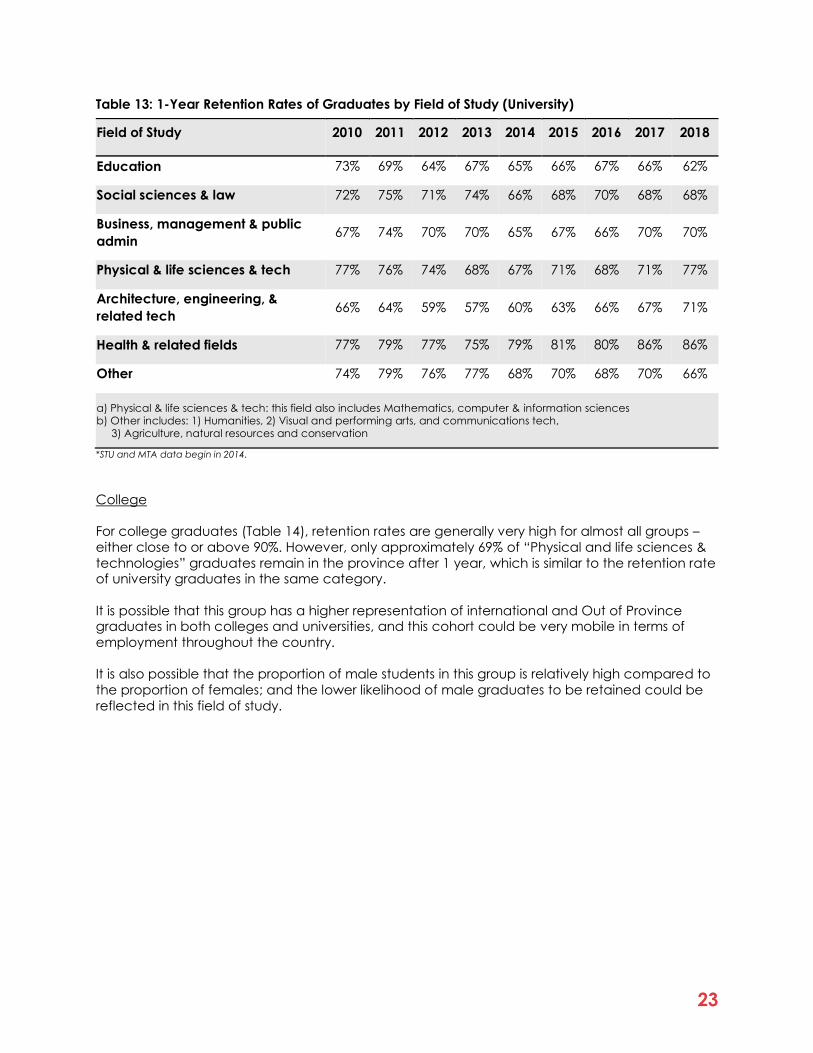
The graduates in “Health & related fields” exhibit the highest overall retention rate of 80%,
followed by “Physical and life sciences & technologies” (which includes “Mathematics,
computer & information sciences”) at 72%, and then graduates in the “Other” category, at 71%.
On the contrary, the lowest retention rates are among “Architecture, engineering and related
technologies” graduates, with 64% on average remaining in NB 1 year after graduation.
23
Table 13: 1-Year Retention Rates of Graduates by Field of Study (University)
Field of Study 2010 2011 2012 2013 2014 2015 2016 2017 2018
Education 73% 69% 64% 67% 65% 66% 67% 66% 62%
Social sciences & law 72% 75% 71% 74% 66% 68% 70% 68% 68%
Business, management & public
admin 67% 74% 70% 70% 65% 67% 66% 70% 70%
Physical & life sciences & tech 77% 76% 74% 68% 67% 71% 68% 71% 77%
Architecture, engineering, &
related tech 66% 64% 59% 57% 60% 63% 66% 67% 71%
Health & related fields 77% 79% 77% 75% 79% 81% 80% 86% 86%
Other 74% 79% 76% 77% 68% 70% 68% 70% 66%
a) Physical & life sciences & tech: this field also includes Mathematics, computer & information sciences b) Other includes: 1) Humanities, 2) Visual and performing arts, and communications tech, 3) Agriculture, natural resources and conservation
*STU and MTA data begin in 2014.
College
For college graduates (Table 14), retention rates are generally very high for almost all groups –
either close to or above 90%. However, only approximately 69% of “Physical and life sciences &
technologies” graduates remain in the province after 1 year, which is similar to the retention rate of university graduates in the same category.
It is possible that this group has a higher representation of international and Out of Province graduates in both colleges and universities, and this cohort could be very mobile in terms of
employment throughout the country.
It is also possible that the proportion of male students in this group is relatively high compared to
the proportion of females; and the lower likelihood of male graduates to be retained could be
reflected in this field of study.

24
Table 14: 1-Year Retention Rates of Graduates by Field of Study (College)
Field of Study 2017 2018
Education 94% 97%
Social sciences & law 93% 92%
Business, management & public admin 88% 89%
Physical & life sciences & tech 67% 71%
Architecture, engineering, & related tech 96% 95%
Health & related fields 93% 95%
Other 92% 91%
a) Physical & life sciences & tech: this field also includes Mathematics, computer & information sciences
b) Other includes: 1) Humanities, 2) Visual and performing arts, and communications tech, 3) Agriculture, natural resources and conservation
3-Year Retention Rates
University
Similar to 1-year retention rates, the 3-year retention rates of university students among various
groupings are not very different from one another. Over 70% of “Health & related fields” students
remain in the province 3 years after graduation. Just about half (53%) of the “Architecture, engineering and related technologies” graduates are retained after 3 years.
Table 15: 3-Year Retention Rates of Graduates by Field of Study (University)
2010 2011 2012 2013 2014 2015 2016
Education 67% 64% 61% 63% 61% 63% 65%
Social sciences & law 63% 63% 61% 64% 59% 59% 64%
Business, management & public admin 61% 67% 62% 62% 60% 61% 60%
Physical & life sciences & tech 66% 66% 67% 60% 61% 64% 60%
Architecture, engineering, & related
tech 54% 52% 47% 47% 51% 56% 61%
Health & related fields 70% 72% 71% 70% 73% 76% 75%
Other 64% 70% 67% 69% 60% 63% 62%
a) Physical & life sciences & tech: this field also includes Mathematics, computer & information sciences b) Other includes: 1) Humanities, 2) Visual and performing arts, and communications tech, 3) Agriculture, natural resources and conservation *STU and MTA data begin in 2014.

25
The retention rates for college graduates in most field of study categories are higher than those of university graduates. However, one field of study (“Physical and life sciences & technologies”)
appears to exhibit similar retention rates for both university and college graduates, which can
probably be attributed to a higher representation of male and/or Non-NB (Out of Province and Out of Country) graduates in this category.
By Field of Study & Gender The tables below show the disaggregation of fields of study by graduates’ gender. To avoid any
disclosure requirement issues, the counts for both university and college graduates are pooled
across years from 2010-2018. For the exact same reason, only university graduates’ retention rates (pooled 2010-2018) are presented in this section.
Counts
University
The distribution of university graduates by gender and field of study in Table 16 shows that the
proportion of male graduates (82%) in “Architecture, engineering and related technologies” is significantly greater than the proportion of females (18%). For “Physical and life sciences &
technologies” graduates, the male proportion is 10 percentage points higher than their female
counterparts. For the rest of the categories, the distribution leans more towards female graduates, especially in “Education,” with three-quarters of graduates being female.
Table 16: Total Number of Graduates in NB by Field of Study & Gender (University), Pooled 2010 -
2018
Field of Study Male % Male Female % Female
Education 1,282 26% 3,571 74%
Social sciences & law 1,811 33% 3,695 67%
Business, management & public
admin 3,630 50% 3,616 50%
Physical & life sciences & tech 1,968 55% 1,626 45%
Architecture, engineering, & related
tech 2,839 82% 626 18%
Health & related fields 1,180 20% 4,653 80%
Other 1,672 39% 2,602 61%
NOTE: ”Unknown” gender category is dropped from the sample, thus sample size by gender is not equal to the sample size in the rest
of the study.

26
College
In the case of college graduates, several fields of study exhibit a higher ratio of females to
males, with 2 noteworthy exceptions (see Table 17). The groups of “Physical and life sciences & technologies” and “Architecture, engineering and related technologies” are mostly comprised
of male graduates: 79% and 91%, respectively.
Significantly, there is a high proportion of Non-NB residents in “Physical and life sciences &
technologies.” Most graduates in “Architecture, engineering and related technologies” are NB
residents. Thus, the combination of higher male representation and significant Non-NB residents may have contributed to the lower retention rates of “Physical and life sciences & technologies”
graduates in Table 14.
Table 17: Total Number of Graduates in NB by Field of Study & Gender (College), Pooled 2010 -
2018
Field of Study Male % Male Female % Female
Education 12 13% 79 87%
Social sciences & law 40 8% 454 92%
Business, management & public
admin 465 33% 958 67%
Physical & life sciences & tech 391 79% 104 21%
Architecture, engineering, & related
tech 2,201 91% 210 9%
Health & related fields 84 8% 931 92%
Other 510 50% 503 50%
NOTE: ”Unknown” gender category is dropped from the sample, thus sample size by gender is not equal to the sample size in the rest
of the study.
1-Year Retention Rates
University
Figure 11 shows that the difference between female and male retention within each field of
study is not very significant. The biggest difference is among “Business, management & public
administration” students, for whom the female retention rate is 5 percentage points higher than male retention.

27
Figure 11: 1-Year Retention Rates of Graduates by Field of Study & Gender (University), Pooled
2010 - 2018
NOTE: ”Unknown” gender category is dropped from the sample, thus sample size by gender is not equal to the sample size in the rest of the study.
3-Year Retention Rates
University
The comparisons between retention rates for male and female students are similar to 1-year estimates (Figure 12). Like the 1-year retention rate, the 3-year retention rate for female
graduates in “Business, management & public administration” is 5 percentage points greater
than for male graduates.
76% 76%
67%71%69%
74%73%70%
64%61%
77%80%
71% 72%
0%
10%
20%
30%
40%
50%
60%
70%
80%
90%
Male Female
Education Social sciences & law Business, mgt & public admin
Physical & life sciences Architecture & engineering Health & related fields
Other

28
Figure 12: 3-Year Retention Rates of Graduates by Field of Study & Gender (University), Pooled
2010 - 2016
NOTE: ”Unknown” gender category is dropped from the sample, thus sample size by gender is not equal to the sample size in the rest of the study.
These findings indicate that, generally, female graduates are marginally less likely out-migrate.
By Nursing & Other Health-Related Fields Graduate retention among health-related fields of study is of particular interest in New
Brunswick, given the shortage of nurses in the province and increased investment and incentives
from government to address this problem.
To shed light on the current situation in relation to nursing graduate retention, this section breaks
down “Health & related fields” into “Nursing” and “Other” categories for universities (UNB and UdeM) and college graduates. “Other” categories include university degrees such as a Bachelor
of Kinesiology, Health Sciences, and other non-nursing health fields. For college graduates, the
“Other” category consists of programs such as Personal Support Worker, Acute Care, and other non-nursing programs. Humber College graduates have been removed from this section (see
“Data and Methodology”). Due to disclosure requirements, the rates for UdeM are pooled
together for 1-year retention (2010-2018) and 3-year retention (2010-2016) rates.
Counts
University
For UNB, the number of individuals graduating with Bachelor of Nursing degrees has been
consistently higher than those with other health degrees, such as Kinesiology. However, more UdeM graduates have held other health degrees over the years (see Table 18).
72% 73%
60% 63%62%67%64%
61%
54%49%
70% 73%
65% 64%
0%
10%
20%
30%
40%
50%
60%
70%
80%
Male Female
Education Social sciences & law Business, mgt & public admin
Physical & life sciences Architecture & engineering Health & related fields
Other

29
Table 18: Total Number of Graduates in NB by Health-Related Fields: UNB & UdeM
UNB UdeM
Graduation
Year Nursing Other Nursing Other
2010 220 131 122 149
2011 231 151 123 134
2012 236 154 138 160
2013 240 168 131 173
2014 229 165 80 183
2015 237 185 102 169
2016 222 173 112 135
2017 200 178 100 139
2018 155 141 86 181
Note: The number of Health-related fields’ graduates across these categories has some discrepancy compared to publicly available data because of the different datasets and methodology used.
College
In the case of colleges, Table 19 shows that about twice as many individuals graduate with other health-related diplomas than those with nursing diplomas (i.e. Licensed Practical Nurses).
Table 19: Total Number of Graduates in NB by Health-Related Fields (College)
Graduation
Year Nursing Other
2017 190 362
2018 147 316
1-Year Retention Rates
University
The overall 1-year retention rate for nursing graduates from UNB is 74%, whereas about 71% of
graduates in other health-related fields remain in the province 1 year after graduation (see Table 20). Similarly, Table 21 shows that UdeM nursing graduates are more likely to be retained,
with 1-year retention rates of 92% and 87%, respectively.

30
Table 20: 1-Year Retention Rates of Graduates in NB by Health-Related Fields – UNB
Graduation
Year Nursing Other
2010 69% 63%
2011 76% 71%
2012 65% 75%
2013 60% 71%
2014 71% 78%
2015 79% 69%
2016 79% 64%
2017 89% 75%
2018 85% 75%
Table 21: 1-Year Retention Rates (Pooled 2010-2018) of Graduates in NB by Health-Related Fields
– UdeM
Graduation
Year Nursing Other
Pooled (2010-2018) 92% 87%
Note: Data has been pooled across years, as small counts precluded disclosure by year.
College
1-year retention rates for graduates with nursing and other health-related diplomas are over
90%. This is likely due to the fairly high distribution of local students in colleges (Figure 13).

31
Figure 13: 1-Year Retention Rates of Graduates by Health-Related Fields (College)
3-Year Retention Rates
University
Overall, the 3-year retention rate for graduates with Bachelor of Nursing degrees from UNB is 66%
in Table 22. Over 62% of individuals in other health-related fields (UNB) remain in the province
after 3 years. In the case of UdeM, 87% of nursing graduates are retained after 3 years, while 82% of graduates in other health-related fields are retained (see Table 23) .
Table 22: 3-Year Retention Rates of Graduates in NB by Health-Related Fields – UNB
Graduation
Year Nursing Other
2010 64% 53%
2011 68% 60%
2012 60% 63%
2013 56% 66%
2014 66% 68%
2015 73% 65%
2016 74% 60%
96%
93%
91%
95%
89%
90%
91%
92%
93%
94%
95%
96%
97%
2017 2018
Nursing Other

32
Table 23: 3-Year Retention Rate (Pooled 2010-2016) of Graduates in NB by Health-Related Fields
– UdeM
Graduation
Year Nursing Other
Pooled (2010-2016) 87% 82%
Note: Data has been pooled across years, as small counts precluded disclosure by year.
By Health-Related Fields & Previous Residence This section provides distributions of graduates in health-related fields by previous residence. Due
to disclosure requirements, the categories of Out of Province and Out of Country are combined
into Non-NB category, and all the years are pooled together for 1-year retention (2010-2018) and 3-year retention (2010-2016) rates. For college graduates, 1-year retention rates by health-
related fields and previous residence have been excluded due to small counts. Like the previous
section, this section excludes Humber College data.
Counts
University
Table 24 shows that the majority of UNB nursing graduates are from NB (81%), while the other 19%
are Non-NB graduates (Out of Province + Out of Country). Around 67% of graduates in other health-related degrees from UNB have indicated NB as their previous residence.
Table 24: Number of Health Graduates by Previous Residence (UNB: 2010-2018)
Previous Residence Nursing Other
NB 1,604 974
Out of Province 353 407
Out of Country 13 65
Note: Data has been pooled across years, as small counts precluded disclosure by year.
Out of all nursing graduates from UdeM, 93% are from the province, while Out of Province and
Out of Country graduates constitute 3% and 4%, respectively. Approximately 88% of graduates in other health-related fields are from NB, followed by 9% for Out of Province and 3% for Out of
Country (see Table 25).

33
Table 25: Number of Health Graduates by Previous Residence (UdeM: 2010-2018)
Previous Residence Nursing Other
NB 928 1,252
Out of Province 29 128
Out of Country 37 43
Note: Data has been pooled across years, as small counts precluded disclosure by year.
College
For college graduates in health-related fields, over 90% of graduates in both nursing and other
categories are from NB (Table 26).
Table 26: Number of Health Graduates by Previous Residence (College: 2017-2018)
Previous Residence Nursing Other
New Brunswick 324 639
Out of Province 6 20
Out of Country 7 19
1-Year Retention Rates
University
UNB health graduates from NB exhibit higher retention rates than Non-NB (Out of Province + Out
of Country) graduates in both nursing and other degree categories in Table 27. However, it
appears that over half of the Non-NB (Out of Province + Out of Country) individuals in nursing remain in the province 1 year after graduation, as opposed to 37% in other health-related
degrees.
Table 27: 1-Year Retention Rates of Health Graduates by Previous Residence (UNB: 2010-2018)
Previous Residence Nursing Other
NB 79% 88%
Non-NB 51% 37%
Note: Non-NB is Out of Province + Out of Country. Data has been pooled aross years, as small counts precluded disclosure by year.
34
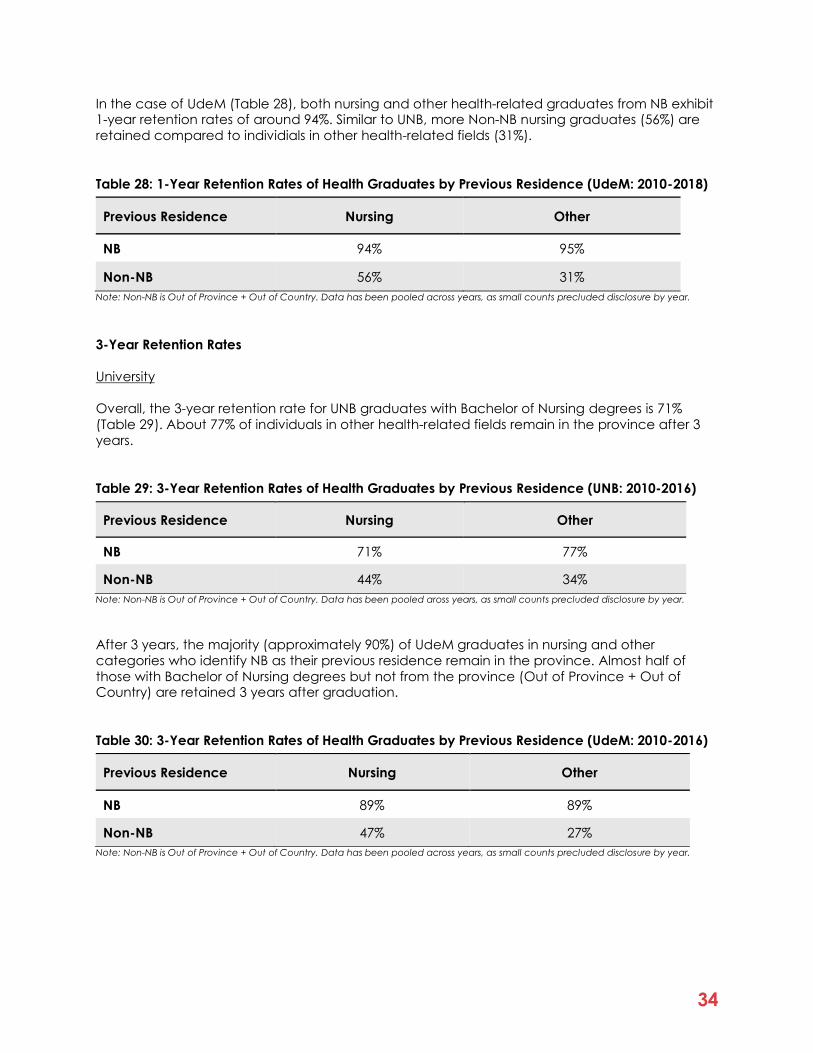
In the case of UdeM (Table 28), both nursing and other health-related graduates from NB exhibit 1-year retention rates of around 94%. Similar to UNB, more Non-NB nursing graduates (56%) are
retained compared to individials in other health-related fields (31%).
Table 28: 1-Year Retention Rates of Health Graduates by Previous Residence (UdeM: 2010-2018)
Previous Residence Nursing Other
NB 94% 95%
Non-NB 56% 31%
Note: Non-NB is Out of Province + Out of Country. Data has been pooled across years, as small counts precluded disclosure by year.
3-Year Retention Rates
University
Overall, the 3-year retention rate for UNB graduates with Bachelor of Nursing degrees is 71%
(Table 29). About 77% of individuals in other health-related fields remain in the province after 3
years.
Table 29: 3-Year Retention Rates of Health Graduates by Previous Residence (UNB: 2010-2016)
Previous Residence Nursing Other
NB 71% 77%
Non-NB 44% 34%
Note: Non-NB is Out of Province + Out of Country. Data has been pooled aross years, as small counts precluded disclosure by year.
After 3 years, the majority (approximately 90%) of UdeM graduates in nursing and other
categories who identify NB as their previous residence remain in the province. Almost half of
those with Bachelor of Nursing degrees but not from the province (Out of Province + Out of Country) are retained 3 years after graduation.
Table 30: 3-Year Retention Rates of Health Graduates by Previous Residence (UdeM: 2010-2016)
Previous Residence Nursing Other
NB 89% 89%
Non-NB 47% 27%
Note: Non-NB is Out of Province + Out of Country. Data has been pooled across years, as small counts precluded disclosure by year.

35
By Level of Education
This section presents estimates by level of education divided into undergraduate, postgraduate, and college categories. Any certificate or diploma holders from universities are included under
the undergraduate category for the purpose of disclosure requirements.
Counts
The jump in undergraduate numbers from 2014 onwards is due to the inclusion of MTA and STU
students. However, it is not reflected in the postgraduate category, as STU does not offer postgraduate programs and MTA only has a few postgraduate students.
Table 31: Total Number of Graduates in NB by Level of Education
Graduation Year Undergraduate* Postgraduate College
2010 3,062 584
2011 3,092 590
2012 2,804 751
2013 2,900 712
2014 3,924 757
2015 3,970 702
2016 3,891 663
2017 3,757 675 3,460
2018 3,539 643 3,482
*Undergraduates include certificate and diploma holders from universities.
1-Year Retention Rates
Even though the number of undergraduate students is much higher than postgraduate students, the overall 1-year retention rates are quite similar: 68% and 67%, respectively (Figure 14). More
than 90% of college graduates are retained in NB 1 year after graduation.

36
Figure 14: 1-Year Retention Rates of Graduates by Level of Education
*Undergraduates include certificate and diploma holders from universities.
3-Year Retention Rates
As expected, 3-year retention rates drop in comparison for both undergraduate (55%) and
postgraduate (58%) students. The trajectory of retention over the years is quite steady for these categories, with bit of a decline since 2014, which perhaps can be attributed to the presence of
MTA and STU graduates in the data.
Figure 15: 3-Year Retention Rates of Graduates by Level of Education
*Undergraduates include certificate and diploma holders from universities.
70% 71% 71% 71%65% 66% 67% 68% 68%
71% 72%67% 66%
61%66% 66%
68% 68%
91% 91%
0%
10%
20%
30%
40%
50%
60%
70%
80%
90%
100%
2010 2011 2012 2013 2014 2015 2016 2017 2018
Undergraduate Postgraduate College
62% 62% 64% 64%59% 61% 62%
64%66%
60% 59%55%
59%61%
0%
10%
20%
30%
40%
50%
60%
70%
2010 2011 2012 2013 2014 2015 2016
Undergraduate Postgraduate

37
By Educational Institution
The tables and figures in this section estimate the number of graduates and retention rates by institution. First, only undergraduate students for each institution are presented, followed by the
presentation of all graduates by institution. This section also presents the distribution of graduates in each institution by their previous residence.
Counts
Undergraduate-Only Students, by Institution
Table 32 reveals that UNB has the highest number of undergraduates among all universities in NB,
with graduating numbers ranging from 1,800-2,000 annually. Certificate and diploma holders from universities have been combined with undergraduate degree holders due to disclosure
issues. Based on MPHEC data, the proportion of certificate and diploma holders is less than 5%
for most years and most institutions.
Table 32: Total Number of Graduates in NB by Educational Institution (Undergraduate-Only*
Students)
Graduation Year UNB UdeM
2010 2,146 916
2011 2,142 950
2012 1,867 937
2013 1,893 1,007
2014 1,987 893
2015 2,018 940
2016 1,995 902
2017 1,959 855
2018 1,914 794 *Undergraduates include certificate and diploma holders from universities. These
have been combined due to small counts in retention for university certificate and diploma holders.
All Graduates, by Institution
UNB continues to have the largest number of graduates when all categories are considered across all post-secondary institutions in the province (see Table 33). After the colleges (NBCC &
NBCCD and CCNB), UdeM is the next largest institution in terms of number of graduates per
year. The number of graduates in Table 33 is larger than the number in Table 32 because it accounts for all graduates (undergraduates and postgraduates), rather than undergraduates
only.
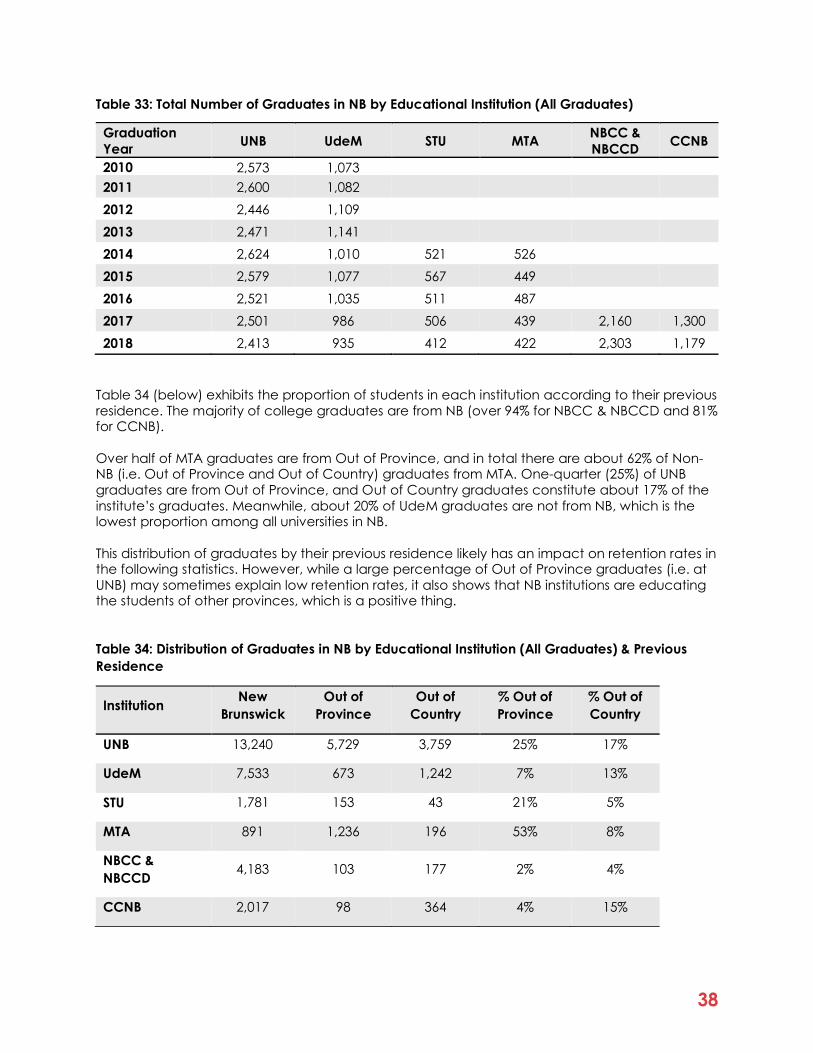
38
Table 33: Total Number of Graduates in NB by Educational Institution (All Graduates)
Graduation
Year UNB UdeM STU MTA
NBCC &
NBCCD CCNB
2010 2,573 1,073
2011 2,600 1,082
2012 2,446 1,109
2013 2,471 1,141
2014 2,624 1,010 521 526
2015 2,579 1,077 567 449
2016 2,521 1,035 511 487
2017 2,501 986 506 439 2,160 1,300
2018 2,413 935 412 422 2,303 1,179
Table 34 (below) exhibits the proportion of students in each institution according to their previous
residence. The majority of college graduates are from NB (over 94% for NBCC & NBCCD and 81% for CCNB).
Over half of MTA graduates are from Out of Province, and in total there are about 62% of Non-NB (i.e. Out of Province and Out of Country) graduates from MTA. One-quarter (25%) of UNB
graduates are from Out of Province, and Out of Country graduates constitute about 17% of the
institute’s graduates. Meanwhile, about 20% of UdeM graduates are not from NB, which is the lowest proportion among all universities in NB.
This distribution of graduates by their previous residence likely has an impact on retention rates in the following statistics. However, while a large percentage of Out of Province graduates (i.e. at
UNB) may sometimes explain low retention rates, it also shows that NB institutions are educating the students of other provinces, which is a positive thing.
Table 34: Distribution of Graduates in NB by Educational Institution (All Graduates) & Previous
Residence
Institution New
Brunswick
Out of
Province
Out of
Country
% Out of
Province
% Out of
Country
UNB 13,240 5,729 3,759 25% 17%
UdeM 7,533 673 1,242 7% 13%
STU 1,781 153 43 21% 5%
MTA 891 1,236 196 53% 8%
NBCC &
NBCCD 4,183 103 177 2% 4%
CCNB 2,017 98 364 4% 15%

39
1-Year Retention Rates
Undergraduate-Only Students, by Institution
Among the post-secondary institutions that offer at least undergraduate degrees, UdeM exhibits
the highest retention rates, with 84% of the graduates retained after 1 year (see Table 35). Along with having a higher ratio of local students compared to other universities, UdeM is a French
university, and Francophones have a lower likelihood of outmigration compared to others (see
Emery et al., 2019). For UNB undergraduates, the 1-year retention rate is 63% overall.
Table 35: 1-Year Retention Rates of Graduates by Educational Institution (Undergraduate-Only*
Students)
Graduation Year UNB UdeM
2010 63% 85%
2011 63% 87%
2012 64% 86%
2013 64% 83%
2014 62% 83%
2015 63% 82%
2016 63% 82%
2017 64% 84%
2018 65% 87%
*Undergraduates include certificate and diploma holders from universities.
Institutions, All Levels
Colleges exhibit the highest 1-year retention rates among all post-secondary institutions in NB,
with about 94% of NBCC & NBCCD and 85% of CCNB graduates remaining in NB after 1 year
(Table 36). STU graduates are also comprised of a significant portion of NB residents, and the overall 1-year retention rate of STU undergraduates is the second highest, at 75%. In comparison,
less than half of MTA graduates (42%) remain in the province 1 year after graduation.

40
Table 36: 1-Year Retention Rates of Graduates by Educational Institution (All Graduates)
Graduation
Year UNB UdeM STU MTA
NBCC &
NBCCD CCNB
2010 64% 84%
2011 64% 86%
2012 64% 84%
2013 64% 83%
2014 61% 83% 72% 40%
2015 62% 82% 74% 43%
2016 63% 81% 76% 43%
2017 64% 83% 76% 44% 94% 85%
2018 64% 86% 78% 41% 94% 85%
3-Year Retention Rates
Undergraduate-Only Students, by Institution
Figure 16 shows that, 3 years after graduation, about 56% of UNB undergraduates remain. The 3-year retention rates for graduates from STU and UdeM are higher, at 65% and 78%, respectively.
Figure 16: 3-Year Retention Rates of Graduates by Educational Institution (Undergraduate-Only*
Students)
*Undergraduates include certificate and diploma holders from universities.
55% 54% 56% 57% 57% 57% 58%
78%81% 79% 77% 78% 77% 77%
61% 65%70%
36% 37% 37%
0%
10%
20%
30%
40%
50%
60%
70%
80%
90%
2010 2011 2012 2013 2014 2015 2016
UNB UdeM STU MTA

41
Institutions: All Levels
The findings presented in Figure 17 below (All Graduates) are very similar to the those in Figure 15
(Undergraduates Only). The 3-year retention rate for MTA graduates is below 40%, while UdeM exhibits the highest rates with an overall 3-year retention of 77%.
Figure 17: 3-Year Retention Rates of Graduates by Educational Institution (All Graduates)
The descriptive statistics in this section further reinforce the notion that the previous residence of graduates plays a significant role in retention rates.
56% 56% 56% 56% 56% 57% 58%
76%80% 78% 76% 75% 77% 77%
61%65%
70%
36% 37% 38%
0%
10%
20%
30%
40%
50%
60%
70%
80%
90%
2010 2011 2012 2013 2014 2015 2016
UNB UdeM STU MTA

42
DISCUSSION OF FINDINGS The objective of this report is to measure the retention rates of graduates from different publicly
funded post-secondary institutions in NB. Results are broken down by educational institution,
year of graduation, gender, immigrant status, level of education, field of study, and previous residence.
Overall, we find that college graduates have a higher retention rate (1-year retention of 91%)
than university graduates (1-year retention of 67%).
Among both college and university graduates, those who were originally from NB before
pursuing post-secondary education appear the most likely to remain in NB after graduating. That
being said, in recent years the retention rates for Out of Country students have been increasing.
Females have higher retention rates than males, and graduates from UdeM have the highest
university retention rates, while graduates from MTA have the lowest.
These key findings are discussed in more detail, and with commentary on their implications, in
the subsections below.
University vs Community College
The results of this study may initially seem to imply that university graduates in NB are far less likely
to remain in the province as opposed to college graduates, and the comparative findings throughout the paper are quite consistent.
This is not unique to NB, as individuals with higher levels of education are more likely to be geographically mobile in terms of the labour market (Machin et al., 2012; Malamud & Wozniak,
2012). One of the reasons why university graduates move away could be that they are unable
to find local employment meeting their expected wage demands (Costa and Kahn, 2000; Davis & Dingel, 2019; Lkhagvasuren, 2014; Wheeler, 2001). University graduates are more spatially
integrated in terms of the labour market, meaning they are more versatile in terms of skills and
can find employment that better matches their expertise and wage demands elsewhere (Amior, 2019).
Results from 2017 and 2018 (Figures 6 and 7) show that in general the 1-year retention rate for college graduates is about 5 percentage points higher than for university graduates, regardless
of previous residence. This difference should be interpreted with caution, as retention can be
seen as a “bi-polar” concept in which higher retention could be either positive or negative depending on the rationale.
On the one hand, the nature of community college training may be more in line with local and provincial needs, and that may contribute to higher retention. On the other hand, higher
retention may also indicate that skills gained had little market value elsewhere, as graduates
failed to find employers (outside NB) who would pay them high enough wages to influence a decision to relocate.
It could also be the case that college graduates settled for other jobs in the province, as there was perhaps little difference between the job they were trained for in terms of wages or
conditions in other jurisdictions and the jobs they settled for in NB. At the same time, lower
retention rates for university graduates could imply that they are more versatile in terms of skills and are therefore in higher demand.

43
The composition of students in terms of previous residence largely explains the difference in retention rates between college and university graduates. Community colleges mostly consist of
graduates who are originally from NB. Meanwhile, a significant proportion of university graduates
are not from the province. When retention rates are disaggregated by previous residence, 1-year rates for NB residents who graduated from universities reaches over 90%.
Previous Residence/Student Status
As suggested in the paragraph above, we find that one of the significant factors affecting retention in NB is the previous residence of graduates.
Graduates who lived in NB before pursuing post-secondary education are more likely to stay in NB after graduating. This is certainly not surprising, and it is quite natural to expect higher
retention rates among graduates who were already living in the province, given the family and
social ties they likely developed over the years. Conversely, by the same logic, lower retention rates are expected from domestic graduates from Out of Province because of their similar ties to
their home province. By this reasoning, unless there are other motivations, such as economic incentives in terms of employment, Out of Province graduates are more likely to leave NB and
return to their home provinces.
Out of Country (international) graduates exhibit lower retention rates than NB residents. The
migration decisions of international students could perhaps be due to a combination of 2
factors: (i) the availability/existence of compatriot communities and (ii) employment opportunities.
For instance, on the one hand, Haan and Prokopenko (2016) find that a large proportion of immigrants move to Ontario from other provinces with smaller immigrant populations. Krahn
et al. (2003) also indicate that interprovincial migration often arises from immigrants moving to
the urban centres of Montreal, Toronto, and Vancouver in search of compatriot communities.
On the other hand, Akbari and Sun (2006) find evidence that immigrants in Atlantic Canada
choose to settle in smaller areas if they can secure employment and if an existing immigrant population exists. Likewise, Krahn et al. (2003) find that employment opportunities were among
the most important factors contributing to the retention of refugee newcomers in Alberta.
An interesting observation in this report is that there is a spike in the retention of international
graduates from 2017 onwards. In 2016, the 1-year retention rate for international students is 32%,
but in 2017 and 2018 retention rates rose to 39% and 41%, respectively.9 This spike could be related to the implementation of new incentives to encourage international graduates to stay.
In March 2017, the Atlantic Immigration Pilot Program (AIPP) was introduced. AIPP helps employers in Atlantic Canada hire foreign skilled workers who want to immigrate to Atlantic
Canada, as well as international graduates who want to stay in Atlantic Canada after they
graduate. Other employment programs aimed at international graduates such as Atlantic Canada Study and StayTM – New Brunswick could also be impacting the retention of
international graduates.
Another policy component that may have improved the retention rates of international students
was introduced in October 2017, making international students eligible to apply for NB Medicare. This means that as of October 2017, more international graduates could be matched
9 In comparison, Galarneau et al. (2017) find that more than 50% of international graduates stayed in the Maritimes 1 year after graduating.

44
with the Citizen Database and could therefore be identified as retained in NB. In previous years, unmatched individuals (i.e. those without Medicare information) were assumed to have left NB
even if they stayed in the province for more than a year, resulting in lower retention rates for
international students. The extent to which Medicare played a role in increasing retention rates due to improved data matching is yet to be examined and is currently beyond the scope of this
study.
While the retention rates of Out of Country and Out of Province graduates are lower than those
of NB residents, one factor that should be considered is the economic value these groups of
students bring to NB. International students, while less likely to remain in the province, pay greater tuition amounts and also spend money supporting the local economy. In addition to a
greater probability of immigrating to NB over those who have never been to the province,
international students also make educational institutions more cosmopolitan, bringing different exposures and experiences to the NB post-secondary education system.
Male vs Female and Field of Study
Year-to-year comparisons in this report show that female retention rates (71% overall) are either higher than or equal to male retention rates (69% overall%). Notably, these statistics are similar to
those presented by Galarneau et al. in a 2017 Statistics Canada report, with similar rates for
females and somewhat higher rates for males.
These findings are not surprising, given previous literature that investigates mobility decisions by
gender. Birchall (2016) suggests that an individual’s characteristics shape every stage of his/her migration decisions and that men are more mobile compared to women. Results from Emery et
al. (2019) also show that NB males have higher rates of moving out of the province, while
females show lower rates.
In this report, we break down graduate retention rates by gender and then break them down
further by field of study. The difference in 1-year and 3-year retention rates by gender is within 5 percentage points for all fields of study. However, the distribution of male graduates (82%) in
“Architecture and Engineering” is significantly higher than female students (18%), while the opposite is true in the case of “Education” (74% female, 26% male) and Health (80% female, 20%
male).
When 3-year retention rates are broken down only by field of study, “Architecture and
Engineering” categories tend to have the lowest retention rates for most years, while the “Other”
category (which consists of Humanities, Visual Arts, and Agriculture) tends to have higher retention rates.
It is possible that the lower retention rates of Architecture and Engineering graduates could reflect the greater versatility of these graduates’ skills compared to graduates of the Humanities.
Nonetheless, these retention rates by field of study should be interpreted with caution, as some
relatively unrelated fields (i.e. Humanities, Visual Arts, Agriculture) were grouped to avoid disclosure issues.

45
Educational Institutions
Results show that UdeM has the highest retention rate of the universities, with around 84% of its graduates retained after 1 year and 77% retained after 3 years.
The composition of graduates by previous residence is likely an influential factor here, as only 20% of UdeM graduates are from outside NB. Another element at play could be UdeM’s status
as a French language institution, suggesting that most UdeM graduates are likely Francophones.
Due to lower language barriers, Anglophones have historically been more mobile in Canada
relative to their Francophone counterparts. For instance, Emery et al. (2019) show that both
unilingual and bilingual Francophone men and women in NB were significantly less likely to emigrate from the province between 2001 and 2016 than unilingual and bilingual English New
Brunswickers.
MTA has the lowest retention rate of the universities, with a 1-year retention of less than 50% and
3-year retention of less than 40%. MTA has a significant proportion of students who are not
originally from NB – the highest of the NB universities. Thus, the composition of MTA graduates in terms of previous residence likely plays a large part in its lower graduate retention rates.
Similarity with Other Studies
Our report finds that university graduates have an overall 1-year retention rate of 68%, whereas college graduates have a retention rate of 91%. This finding and the results detailed above are
similar to those of previous studies, despite differences in data and methodology, which suggests
again that the findings are robust.
As mentioned in the earlier literature review, MPHEC (2018) survey data shows a 2-year retention
rate of 57% for NB university graduates.10 Meanwhile, in Galarneau et al. (2017), calculations using linked income tax data show a 1-year retention rate of ~70% for Maritime university
graduates. Finally, a forthcoming NB-IRDT (Boco et al., 2020) report using matched administrative
data shows a same-year retention rate of 78% and 2-year retention rate of 72% for NB graduates (university and college graduates combined). While these rates are lower than the rates we
calculated, Boco et al.’s examination of NB residents finds retention rates of 92% and 84%,
respectively, which are higher, putting our findings within the range of their outcomes.
Consistent across the literature is the finding that graduates’ previous residence is the most
important determinant of retention.
According to MPHEC (2018), 74% of New Brunswickers reside in the province 2 years after
graduation, and Galarneau et al. (2017) show that about 80% of Maritimers stay in the Maritimes 1 year after graduation. Boco et al. (2020) show that students residing in NB prior to admission
are most likely to remain in the province, averaging a 92% retention rate in the graduation year
and 84% 2 years later.
In this report, we find that about 89% of previous NB residents remain 1 year after graduation,
followed by 30% retention for Out of Province graduates and 34% for Out of Country graduates. The discrepancy in overall retention rates between universities and community colleges is likely
because most graduates from community colleges are originally from NB, whereas a large proportion of university graduates are Out of Province or international students.
10 These results are based on survey responses from a sample of the class of 2014. It should also be noted that the MPHEC study (2018) does not differentiate between international and Out of Province domestic students.

46
Galarneau et al. (2017) find that international students have a 1-year retention rate of about
50%, and Boco et al. (2020) also find that about 50% of international graduates remain in NB by
the end of their graduation year, and 35% remain 2 years later.
This report finds that the 1-year retention rate for international university students is about 35%,
and the 3-year rate is about 25%.
Galarneau et al. (2017) find the 1-year retention rate to be about 15% for domestic students not
from the Maritimes. Boco et al. (2020) show the retention rate is about 18% for those NB graduates previously residing in Nova Scotia and about 10% for those previously residing in
Ontario. MPHEC (2018) results show 4% of non-Maritime graduates from NB universities remained
in NB 2 years after graduation.
In comparison, this report shows that the 1-year retention rate for Out of Province (domestic)
students is about 30% whereas the 3-year rate is about 28%.
It is important to note that, for all the results discussed above, Galarneau et al. (2017) look at retention rates for the Maritimes as a whole, and their results cover all 3 provinces. As it is possible
a fair number of NB graduates may go to NS for work opportunities or further study, it is not
surprising that Galarneau et al.’s Maritime retention rates differ from ours.
In a similar manner, differences between our results and MPHEC (2018) results on certain
measures are to be expected. For instance, MPHEC’s estimate of a 2-year retention rate of 4% for non-Maritime graduates from NB universities is much, much lower than our findings for 1-year
retention rates of Out of Province university and college graduates (30% and 27%, respectively).
Our results are likely much higher because we classify graduates from neighbouring Maritime provinces as Out of Province graduates, and we would expect that a large proportion of
retained Out of Province graduates in NB are from Prince Edward Island and Nova Scotia.
Given that the methodology is different across each study,11 it is possible that the samples of Out
of Country and Out of Province students are also different. For instance both Galarneau et al.
(2017) and Boco et al. (2020) use tax data to identify individuals residing in different locations, whereas this study uses Medicare information, which is present regardless of whether individuals
are paying taxes or not – and as such, the different samples and time periods used across the
studies could potentially explain the variation in numbers, where such variation exists.
MPHEC (2018) based its results on the graduating classes of 1999, 2003, 2007, 2012, and 2014,
whereas Galarneau et al. (2017) combined 6 cohorts of graduates (classes of 2006-2011) and presented results for the all Maritime provinces as a whole. Retention numbers by Boco et al.
(2020) were based on graduates who filed taxes and measured retention until 2016.
Unlike the previous work on student retention, this report presents results by different educational
institutions and by year until 2018, utilizing a larger sample size, longer study period, and more
accurate method of identifying location than the previous studies.
11 For information on methodological differences, see the Literature Review in the Introduction to this report.

47
Limitations
This report assumes that graduates without Medicare information have left the province. However, due to technical reasons such as inconsistency in naming and birthdates, a portion of
individuals could not be matched with Medicare information. This means that these groups of
individuals, while still residing in NB, are assumed to have left the province. As such, retention rates are likely understated and may be higher than presented.
We attempt to account for unmatched graduates by identifying what proportion of individuals are unmatched due to technical errors and what proportion are unmatched due to not having
Medicare (either being from a different province or being an international student) based on
the graduates’ previous residence. Results show that among the unmatched, about 12% of individuals are originally from NB, implying that 12% of individuals do not have Medicare
information because of technical errors. The remaining 88% do not have Medicare information
because they are either from a different province or they are international students.
Another limitation we face in this report is the inconsistency in time periods for which data is
available. Analysis in this report only includes years for which the educational institutions collected 12 full months of data. As a result, this report excludes 2016 data for the community
colleges, as not all months of data are available for these years.
Looking Forward
In subsequent phases of our analysis, we will evaluate the labour market outcomes of the
graduates examined herein and will address questions such as the following:
• How much are these graduates earning?
• Are graduates working in the field(s) they were originally trained in?
• What are the economic returns to different disciplines?
Since the present analysis focuses on post-secondary graduates only, subsequent phases will
compare retention rates for these individuals against 2 control groups.
The first control group is comprised of high school graduates who do not attend post-secondary
education, which will be analyzed using report card data from Education and Early Childhood Development (EECD).
The second control group is comprised of individuals who enrolled in but did not complete credentials at an NB post-secondary institution.
Future reports will also compare how economic and retention outcomes differ between university and college graduates and those who have completed different apprenticeship and
other labour market training programs.
While this report addresses whether graduates remained in NB after graduation, future research
at NB-IRDT will expand on this topic to look at intra-provincial migration. While it is important for graduates to remain in NB, it is also important to know the retention of students locally within NB
to see which region(s) may be more vulnerable so that better targeted policies can be
implemented.

48
REFERENCES Akbari, A.H., & Sun, C. (2006). Immigrant attraction and retention: What can work and what is
being done in Atlantic Canada. Our Diverse Cities, 2, 129–133.
Amior, M. (2019, May). Education and geographical mobility: The role of the job surplus,” CEP
Discussion Papers dp1616. Centre for Economic Performance, LSE.
Bhuiyan, E.M., Daigle, B., McDonald, T., & Miah, P (2021). College & university graduate retention
in New Brunswick: 2010 - 2018. Fredericton, NB: New Brunswick Institute for Research, Data and Training.
Birchall, J. (2016). Gender, age and migration: An extended briefing [PDF file]. Retrieved from https://www.rosavzw.be/digidocs/dd-001417_2016_Gender_Age_Migration_IDS.pdf
Boco, E., Leonard, P., & McDonald, T. (2021). Retention, attraction, and labour market outcomes of post-secondary graduates in New Brunswick. Fredericton, NB: New Brunswick Institute for
Research, Data and Training.
Boco, E., Leonard, P., & McDonald, J.T. (2020). Retention and labour market outcomes of post-
secondary education recipients in New Brunswick. Fredericton, NB: New Brunswick Institute
for Research, Data and Training.
Costa, D. L., & Kahn, M.E. (2000). Power couples: Changes in the location choice of the college
educated. Quarterly Journal of Economics, 115(4), 1287-1315.
Davis, D. R., & Dingel, J.I. (2019). A spatial knowledge economy. American Economic
Review, 109(1), 153-170.
Emery, J.C.H., Wang, L., & Daigle, B. (2019). The impact of official bilingualism on the geographic
mobility of New Brunswickers: Evidence from 2001 to 2016. Fredericton, NB: New Brunswick Institute for Research, Data and Training.
Galarneau, D., Hinchley, C., & Ntwari, A. (2017, April). Labour market outcomes of graduates from universities in the Maritime provinces: Insights on Canadian society. Statistics Canada
Catalogue no. 75-006-X. Retrieved from https://www150.statcan.gc.ca/n1/pub/75-006-
x/2017001/article/14798-eng.htm
Government of New Brunswick. (2019). New beginnings: A population growth strategy for New Brunswick: 2019-2024. Retrieved from
https://www2.gnb.ca/content/dam/gnb/Departments/petl-
epft/PDF/PopGrowth/Population_growth_strategy.pdf
Haan, M., & Prokopenko, E. (2016). Overview of secondary migration of immigrants to Canada.
Pathways to prosperity working paper, Western University. http://p2pcanada.ca/fles/2016/02/Overviewof-Secondary-Migration-of-Immigrants-to-
Canada.pdf
Krahn, H., Derwing, T. M., & Abu-Laban, B. (2003). The retention of newcomers in second and
third tier cities in Canada. Edmonton, AB: Prairie Centre of Excellence for Research on
Immigration and Integration.

49
Leonard, P., McDonald, T., & Miah, P. (2019). Immigrant retention in New Brunswick: Results from BizNet and Citizen Database. Fredericton, NB: New Brunswick Institute for Research, Data
and Training.
Machin, S.P. (2012). Education and mobility. Journal of the European Economic Association, 10,
417-450.
Lkhagvasuren, D. (2014). Education, mobility and the college wage premium. European
Economic Review, 67, 159-173.
Malamud, O., & Wozniak, A. (2012). The impact of college on migration: Evidence from the
Vietnam generation. The Journal of Human Resources, 47(4), 913-950. Retrieved October 5,
2020, from http://www.jstor.org/stable/23798521
Maritime Provinces Higher Education Commission. (2018, January). Maritime university graduate
migration: Fifteen-year trend. Retrieved from http://www.mphec.ca/media/163338/Migration-Trend_Infographic.pdf]
McDonald, J.T., Cruickshank, B., & Liu, Z. (2018). Immigrant retention in NB: An analysis using
administrative Medicare Registry data. Journal of Population Research 35(4), 325-41.
Retrieved from https://ideas.repec.org/a/spr/joprea/v35y2018i4d10.1007_s12546-018-9217-8.html
Wheeler, A. (2001). Search, sorting, and urban agglomeration. Journal of Labor Economics,
19(4), 880–898.
Wozniak, A. (2010). Are college graduates more responsive to distant labor market
opportunities? The Journal of Human Resources, 45(4), 944-970.

50
APPENDIX A: A COMPARISON OF MEDICARE AND TAX DATA RESULTS In spite of a rich culture and vast natural resources, the province of New Brunswick (NB) is faced
with demographic challenges, including an aging population and the out-migration of many
younger, working-age individuals.
To help boost both the population and economy of NB, the Government of New Brunswick has invested substantially in post-secondary education (PSE) in the province. Improving PSE is likely to
attract more individuals to NB and help produce a more highly skilled labour force; however,
there is always the potential that some of that investment could be lost as qualified graduates leave the province, taking their human capital and potential earnings with them.
Retaining post-secondary graduates in the province plays a vital role in remedying demographic challenges and the fiscal challenges that arise as a result – making it a salient
research topic in NB. Student labour market and retention research in particular helps inform
targeted policies that aim to encourage graduates to remain in NB while examining whether students’ decisions to stay or leave are tied to economic outcomes.
In 2021, the New Brunswick Institute for Research, Data and Training (NB-IRDT) released two reports analyzing post-secondary graduate retention in the province:
- College & university graduate retention in New Brunswick: 2010 – 2018 (Bhuiyan et al., 2021)12
- Retention, attraction, and labour market outcomes of post-secondary education recipients in New Brunswick
(Boco et al., 2021)13
While both reports attempt to answer the same overarching question (How many graduates
from NB PSE institutions are staying in NB?), they examine different study periods, utilize
administrative data from different sources, and employ different methodologies to address this question. Most notably, Bhuiyan et al. (2021) use Medicare data in their calculations, while Boco
et al. (2021) employ tax data.
This appendix compares NB graduate retention rates as estimated in these two NB-IRDT reports,
explaining the methodologies behind both sets of calculations and the similarities and
differences between the data sources. Since different estimates from different data sources and methodologies could lead to uncertainty in policy recommendations and questions about data
integrity, it is important to compare such estimates systematically. Results show that estimates of retention in both studies are similar, suggesting that retention results are robust to alternative
data sources.
12 Bhuiyan, E.M., Daigle, B., McDonald, T., & Miah, P (2021). College & university graduate retention in New Brunswick: 2010 - 2018. Fredericton, NB: New Brunswick Institute for Research, Data and Training. 13 Boco, E., Leonard, P., & McDonald, T. (2021). Retention, attraction, and labour market outcomes of post-secondary graduates in New Brunswick. Fredericton, NB: New Brunswick Institute for Research, Data and Training.

51
Calculating Graduate Retention in New Brunswick – Methodological Differences
Tax Records
Medicare Records
• The Post-Secondary Information System
(PSIS) linked with tax records provided in
the T1 Family File is used.
• Tax records are used to determine
residence in NB after graduation.
• Two retention/attraction measures are used:
o Grad-year retention - the
percentage of graduates still in
NB as of December 31st of the
graduation year (e.g., graduating in 2014 and province
of taxation in Dec. 2014).
o 2-year retention rate - the
percentage of graduates still in
NB as of Dec. 31st two years later
(e.g., graduating in 2014 and province of taxation in Dec.
2016.) o Retention is calculated as the
number of NB PSE institution
graduates who declared NB as their province of taxation on
Dec. 31st of a given tax year
divided by the total number of tax filers who are part of the
graduation-year cohort.
• Data from the University and
Community College Registrar
Databases and the Citizen Database (Medicare Registry) are linked.
• “Matched” individuals (i.e., individuals
with Medicare information) are considered retained if they have an
Active Medicare Registration in NB 1
year or 3 years after the date of graduation – otherwise, they are
considered to have left the province on
or prior to the date of termination of an active Medicare status.
• “Unmatched” individuals (i.e., individuals
with no Medicare information) are also assumed to have left the province.
Individuals can be “Unmatched” for various reasons:
o A graduating student does not
have an Active Medicare status because he/she does not
remain in NB after graduation.
o Individuals may be unmatched because of missing information
or information that is not
reported consistently across both datasets.
• The number of students who graduated
each year is based on calendar year and not academic year.
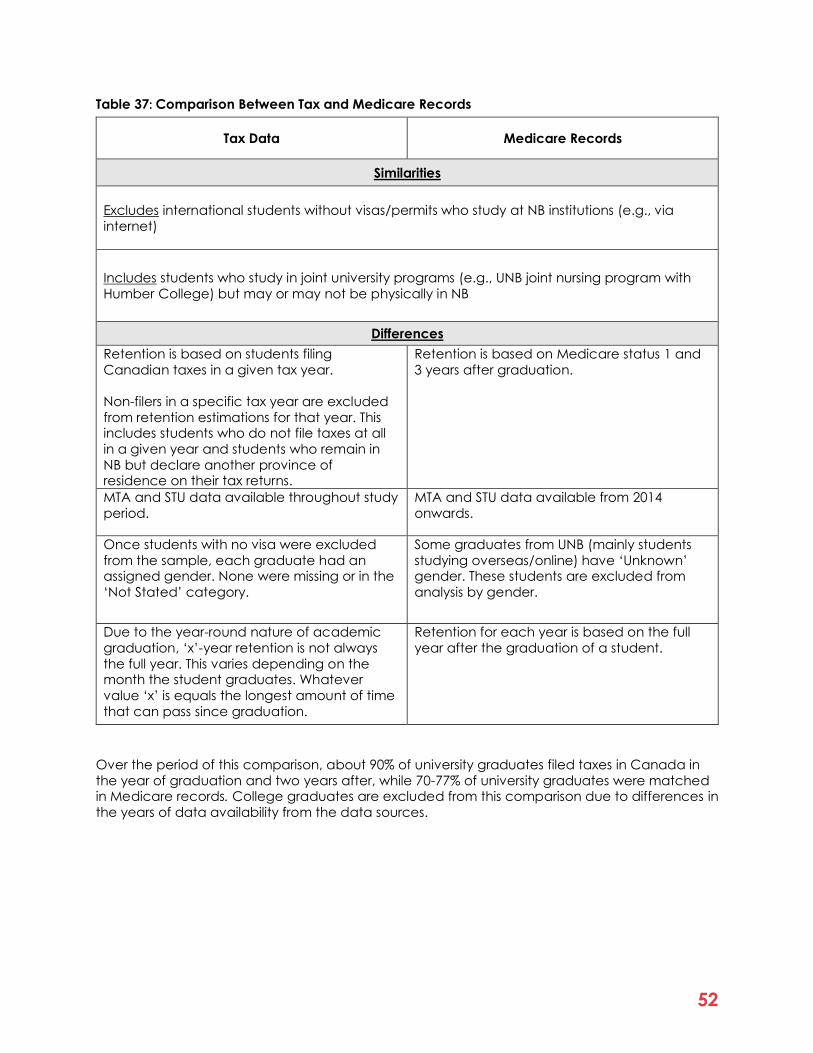
52
Table 37: Comparison Between Tax and Medicare Records
Tax Data Medicare Records
Similarities
Excludes international students without visas/permits who study at NB institutions (e.g., via
internet)
Includes students who study in joint university programs (e.g., UNB joint nursing program with
Humber College) but may or may not be physically in NB
Differences
Retention is based on students filing
Canadian taxes in a given tax year.
Non-filers in a specific tax year are excluded
from retention estimations for that year. This includes students who do not file taxes at all
in a given year and students who remain in
NB but declare another province of residence on their tax returns.
Retention is based on Medicare status 1 and
3 years after graduation.
MTA and STU data available throughout study
period.
MTA and STU data available from 2014
onwards.
Once students with no visa were excluded
from the sample, each graduate had an assigned gender. None were missing or in the
‘Not Stated’ category.
Some graduates from UNB (mainly students
studying overseas/online) have ‘Unknown’ gender. These students are excluded from
analysis by gender.
Due to the year-round nature of academic
graduation, ‘x’-year retention is not always
the full year. This varies depending on the month the student graduates. Whatever
value ‘x’ is equals the longest amount of time
that can pass since graduation.
Retention for each year is based on the full
year after the graduation of a student.
Over the period of this comparison, about 90% of university graduates filed taxes in Canada in
the year of graduation and two years after, while 70-77% of university graduates were matched in Medicare records. College graduates are excluded from this comparison due to differences in
the years of data availability from the data sources.

53
Table 38: Percentage of University Graduates who File Taxes
Year of Graduation 2010 2011 2012 2013 2014 2015 2016
In year of Graduation 93% 93% 93% 92% 91% 92% 87%
2 years after graduation 92% 92% 91% 90% 87%
Table 39: Annual Distribution of Matched University Graduates in NB from 2010 to 2016
Year of Graduation 2010 2011 2012 2013 2014 2015 2016
Matching Ratio 75% 76% 77% 77% 70% 71% 70%
STU and MTA data begin in 2014.
Graduate Counts by Data Source Given the similarities and differences between the data sources, the tables below show the
number of graduates reported based on administrative records made available by both
datasets.
• The overall number of graduates each year for both data sources is very close in range –
off by only a few students each year (Table 4).
• Differences between data sources in graduate counts by level of education are driven chiefly by undergraduates in larger institutions (Table 5).
• The larger the institution in terms of student population and programs offered, the more
pronounced the differences in graduate counts. In other words, graduate counts by data source for smaller universities like MTA and STU are nearly identical, whereas larger
universities like UNB and UdeM show larger differences (Table 6).
• These differences between the data sources likely occur because separate agencies compile the datasets.
Table 40: Total Number of University Graduates in NB
Graduation Year 2014 2015 2016
Post-Secondary Information System (PSIS) 4,660 4,690 4,600
University and Community College Registrar
Databases 4,681 4,672 4,554
*STU and MTA data begin in 2014 in the University and Community College Registrar Databases.
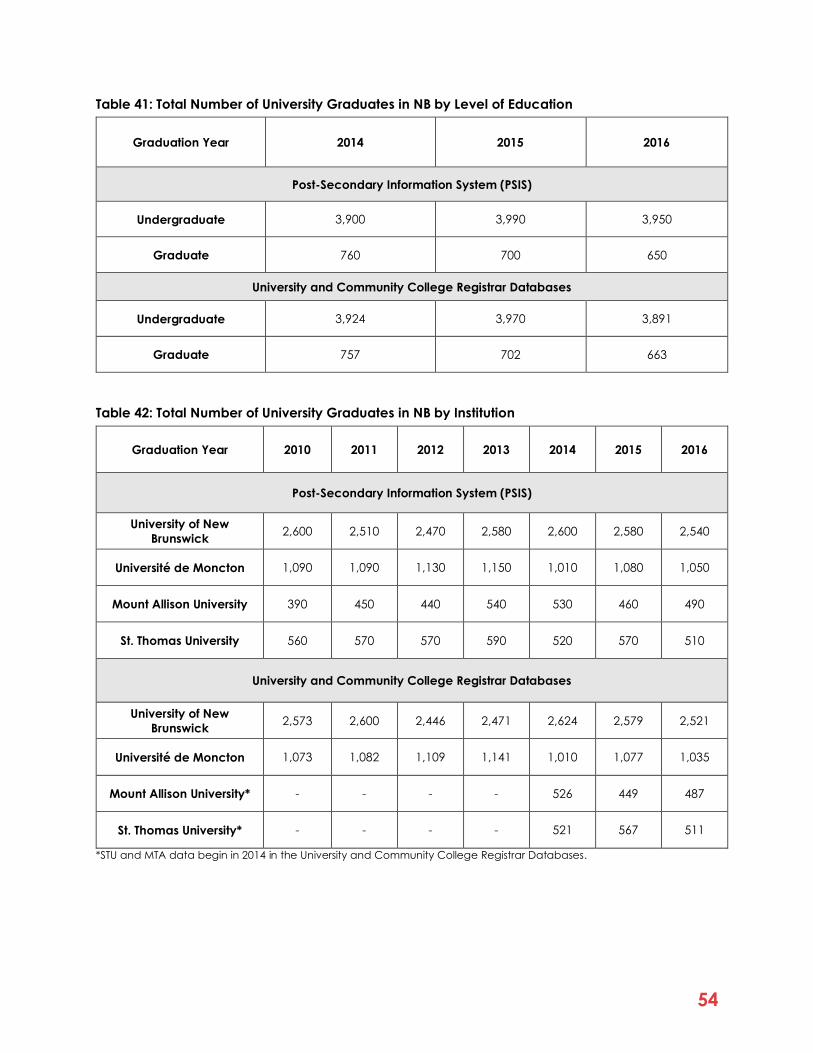
54
Table 41: Total Number of University Graduates in NB by Level of Education
Graduation Year 2014 2015 2016
Post-Secondary Information System (PSIS)
Undergraduate 3,900 3,990 3,950
Graduate 760 700 650
University and Community College Registrar Databases
Undergraduate 3,924 3,970 3,891
Graduate 757 702 663
Table 42: Total Number of University Graduates in NB by Institution
Graduation Year 2010 2011 2012 2013 2014 2015 2016
Post-Secondary Information System (PSIS)
University of New
Brunswick 2,600 2,510 2,470 2,580 2,600 2,580 2,540
Université de Moncton 1,090 1,090 1,130 1,150 1,010 1,080 1,050
Mount Allison University 390 450 440 540 530 460 490
St. Thomas University 560 570 570 590 520 570 510
University and Community College Registrar Databases
University of New
Brunswick 2,573 2,600 2,446 2,471 2,624 2,579 2,521
Université de Moncton 1,073 1,082 1,109 1,141 1,010 1,077 1,035
Mount Allison University* - - - - 526 449 487
St. Thomas University* - - - - 521 567 511
*STU and MTA data begin in 2014 in the University and Community College Registrar Databases.

55
Does NB Student Retention Vary by Data Source?
Despite the use of different data sources and methodologies, the retention rates for university graduates produced using PSIS and Medicare data are within close range and follow the
expected retention trends: that is, they decline as more time passes since graduation. The
calculated declines are also of similar magnitudes.
• With both data sources, UdeM graduates are the most likely to still be in NB after
graduation, while MTA graduates are the least likely.
• Retention rates calculated using Medicare data show stable retention rates over the study period. Graduation-year retention rates from tax data are stable, but two-year
rates show a slight decline, specifically for UNB and STU graduates. However, they are still
close in range.
Table 43: Retention Rates for University Graduates by Data Source
Graduation Year 2014 2015 2016
Grad-year retention
(Tax records) 66% 68% 70%
1-year retention
(Medicare Records) 65% 67% 67%
2-year retention
(Tax records) 60%
3-year retention
(Medicare Records) 58% 61% 61%
Note: The study period for the student retention report using tax records goes from 2009 to 2016, whereas the study period for Medicare records goes from 2010 to 2019.
Table 44: Retention Rates for NB Institutions by Data Source
Graduation Year 2010 2011 2012 2013 2014 2015 2016
University of New Brunswick
Grad-year retention (Tax records)
69% 68% 65% 63% 63% 64% 69%
1-year retention rate (Medicare Records)
64% 64% 64% 64% 61% 62% 63%
2-year retention rate (Tax records)
61% 59% 57% 56% 57%
3-year retention rate
(Medicare Records) 56% 56% 56% 56% 56% 57% 58%
Université de Moncton
Grad-year retention (Tax records)
85% 86% 85% 84% 82% 83% 83%
1-year retention rate (Medicare Records)
84% 86% 84% 83% 82% 82% 81%
2-year retention rate (Tax records)
78% 79% 80% 79% 79%
3-year retention rate (Medicare Records)
76% 80% 78% 76% 75% 77% 77%

56
Mount Allison University
Grad-year retention (Tax records)
37% 45% 40% 39% 35% 40% 40%
1-year retention rate* (Medicare Records)
40% 43% 43%
2-year retention rate (Tax records)
31% 36% 29% 28% 31%
3-year retention rate* (Medicare Records)
36% 37% 38%
St. Thomas University
Grad-year retention (Tax records)
70% 70% 70% 71% 71% 74% 75%
1-year retention rate* (Medicare Records)
72% 74% 76%
2-year retention rate (Tax records)
63% 63% 63% 59% 57%
3-year retention rate* (Medicare Records)
61% 65% 70%
*STU and MTA data begin in 2014 in the University and Community College Registrar Databases.
Summary and Conclusion This appendix compares post-secondary graduate counts and retention rates in NB as estimated
by two NB-IRDT reports. The first study (Bhuiyan et al., 2021) uses provincial Medicare records to investigate retention of post-secondary graduates in the province, while the second (Boco et
al., 2021) uses graduates’ tax records to investigate residence after graduation.
Except for a decline in two-year retention rates for UNB and STU graduates in the tax data, this
comparison shows similar numbers and trends in graduate counts as well as retention rates. Both
data sources reveal that university graduates in NB have a retention rate of about 60% over the comparison period, and UdeM graduates are the most likely to remain in the province while MTA
graduates are the least likely to remain. For the purpose of informing policy, this comparison
shows that Medicare data is a useful complement to other data sources that can be used in analysis.