collation and review of stem density data and thinning prescriptions
TRANSCRIPT

COLLATION AND REVIEW OF
STEM DENSITY DATA AND THINNING PRESCRIPTIONS
FOR THE VEGETATION COMMUNITIES OF NEW
SOUTH WALES Report prepared for Department of Environment and
Conservation (NSW), Policy and Science Division
by Dr J. A. Kerle
July 2005
Any opinions expressed in this document are those of the author and do not represent the opinions of the Department of Environment and Conservation.

2

Contents 1. Background
1.1 Historical Perceptions of Vegetation in New South Wales 1.2 Dynamics of Vegetation Structure and Condition 1.3 Vegetation Communities of New South Wales 1.4 Vegetation Legislation in New South Wales 1.5 Project Brief
2. Stem Densities
2.1 Project Brief 2.2 Data Sources 2.3 Recorded Stem Densities
2.3.1 Murray Darling Basin 2.3.2 Cypress Pine (Callitris spp) 2.3.3 Narrow-leaved Ironbark and White Cypress 2.3.4 Box-Ironbark Forests and Woodlands of Victoria 2.3.5 Gum and Box Woodlands of Victoria 2.3.6 Grassy Eucalypt Woodlands 2.3.7 Grey Box (Eucalyptus microcarpa) 2.3.8 Poplar Box (Eucalyptus populnea) 2.3.9 Brigalow (Acacia harpophylla) 2.3.10 Coolibah (Eucalyptus coolabah) and Black Box (Eucalyptus largiflorens) 2.3.11 River Red Gum (Eucalyptus camaldulensis) 2.3.12 Mulga (Acacia aneura) 2.3.13 Rosewood-Belah-Pine-Scrub 2.3.14 Mallee 2.3.15 Northern Tablelands 2.3.16 Coastal Forests and Woodlands 2.3.17 Wet Sclerophyll Forests 2.3.18 Rainforests 2.3.19 Coastal Heathlands
3. Thinning Prescriptions
3.1 Project Brief 3.2 Thinning Prescriptions from the Regional Vegetation Management
Plans (RVMP’s) 3.2.1 Background 3.2.2 Mid-Lachlan RVMP 3.2.3 Lower Macquarie – Castlereagh Draft RVMP 3.2.4 Richmond Draft RVMP 3.2.5 Riverina Highlands RVMP 3.2.6 Western Riverina Draft RVMP 3.2.7 Brewarrina Draft RVMP 3.2.8 Clarence Draft RVMP 3.2.9 Inverell Yallaroi Draft RVP 3.2.10 North Lachlan Bogan Draft RVMP 3.2.11 Manning Draft RVMP
3

3.2.12 Moree Draft RVMP 3.2.13 Tenterfield Draft RVMP 3.2.14 Walgett Draft RVMP
3.3 Management prescriptions of State Forests of New South Wales 3.3.1 Silvicultural procedures 3.3.2 Coastal and Tablelands Region 3.3.3 Alpine Ash Region 3.3.4 River Red Gum 3.3.5 White Cypress
3.4 Other Suggested Thinning Prescriptions 3.4.1 White Cypress 3.4.2 Ironbark Cypress Forests 3.4.3 Box-Ironbark Forests 3.4.4 Grassy Box Woodlands 3.4.5 River Red Gum 3.4.6 Coolibah and Black Box 3.4.7 Rainforest 3.4.8 Wet Sclerophyll Forest
4. Thinning: Density Manipulation to a Benchmark
4.1 Introduction 4.2 Impact of Thinning on Faunal and Floristic Biodiversity 4.3 Stem Density Benchmarks 4.4 Development of Benchmarks and Thinning Protocols
4.4.1 Stem Densities 4.4.2 Ecological Thinning
4.5 Conclusions and Recommendations References Appendix 1: Source Material, which is the Basis of the Stem Density Summary
(Section 2). Appendix 2: Source Material, which is the basis of the Thinning Prescription
Summary (Section 3) Appendix 3: Vegetation Legislation in N.S.W.
4

1. Background 1.1 Historical Perceptions of Vegetation in New
South Wales There has been considerable debate about the structure of native vegetation communities at the time of the arrival of the European settlers on the continent. Unfortunately much of the public debate regarding the density of the ‘bush’ and ‘scrub’ in New South Wales has been generalised and simplistic. In some of the debate, there has been no recognition of the natural variation of plant communities across the landscape, no knowledge of the growth rates of trees and densities are stated with no indication of whether this is the density of one species in a mixed woodland or all species, or whether it includes all trees or just the larger trees. Historical records of explorers, early settlers and even ‘old timers’ whose recollections go back 50 to 80 years are frequently used to provide an indication of the condition of vegetation and density estimates (e.g. Ryan et al. 1995, Benson and Redpath 1997, van Kempen 1997). Such records are difficult to interpret and can produce misleading conclusions. The records of the early explorers are selective, affected by the imposition of their knowledge of the completely different ecological systems from Europe (a 19th Century view of natural history and landscape) and the purpose of their journeys. Many were seeking land suitable for agriculture and this is likely to have biased their observations. Other historical botanical descriptions, such as Cambage (1900 a, b, c, d), provide a listing of species and discuss species distributions. Despite this, it is clear that areas of dense ‘scrub’ existed across the landscape before the influence of European pastoralism on plant communities and the removal of Aboriginal land management (Beadle 1948, Croft et al. 1997, Benson and Redpath 1997, Allen 1997, Noble 1997). Some more detailed extracts from early historical accounts are provided in Appendix 1. The meanings of historical observations need to be interpreted with care (Allen 1997, van Kempen 1997). The observations were written with the need for new pastoral and agricultural land in mind. To the explorer Thomas Mitchell, for example,
“A ‘forest’ means in New South Wales, an open wood with grass. The common ‘bush’ or scrub’ consists of trees and saplings, where little grass is to be found.” (quoted by Allen 1997).
The botanist Cunningham described an area as “a very sterile scrubby district, somewhat elevated, thickly wooded with Bastard Box, Cypress and the Casuarina (or Swamp Oak) …” while the explorer Oxley described the same area as “box scrub”, “a poor barren country covered with box trees and low acacia shrubs”. Oxley also described the Pilliga as ‘Open Forests’. The Pilliga ‘Scrub’ contained belts of Acacia while areas of very young pine and ironbark were described as ‘inferior scrub’ (Allen 1997, van Kempen 1997). In addition to the descriptive terms used by early Europeans travelling through the Australian landscape, some actual densities were recorded. For example Leichhardt
5

recorded 120 trees /quarter mile radius north of Sydney and in 1827 Cunningham quoted 1 dozen per acre (30/ha) in the Upper Hunter (quoted in Benson & Redpath 1997) and explorer Evans recorded 25 trees / ha on plains near Bathurst (quoted in Croft et al. 1997). For the Pilliga, Rolls (1981) records the 1877 density estimate by the forest ranger James Ward of 4 mature and twenty five young pines per hectare. Lunt (2002) notes that very few studies of structural changes in the Australian vegetation communities provide quantitative ecological data on century-scale structural changes. Much more detailed work is required to embed this history in spatial, geographic and ecological considerations. Spatial variation in tree densities prior to recruitment events, and the spatial extent and size of structural changes since European settlement need much further assessment and analysis. Methods have been developed which estimate tree density from original land survey maps. Fensham and Holman (1997) quantitatively compared current vegetation densities with historical land survey maps in order to define terms such as open, light, shrubby and dense. Their results suggest that minimal vegetation thickening has occurred in the Darling Downs in Qld since the early land surveys. A density of 2 to 59 per ha with an average density of 30/ha was determined from a similar analysis of historical maps of a lowland Gippsland Plain by Lunt (1997). From this he concluded that even though areas had been annotated as ‘thickly’ or ‘heavily timbered’, tree densities at the time of mapping appear to be low compared with present tree densities in roadside remnants which represent regrowth timber. Conversely, Stubbs and Specht (2002) concluded that tree densities indicated by historical portion surveys are very similar to present tree densities in sub-tropical rainforest remnants. They suggest that the low original densities calculated by Lunt (1997) may result from an inadequate interpretation of the surveyors tree selection needs: permanence, stability and visual prominence, in other words, trees of at least 30 – 40 cm dbh. Observations by settlers and more recent residents are valuable for providing a ‘snapshot in place and time’ but should not be used as definitive or be generalised. The underlying time frame in the interpretation of these snapshots is mostly ignored, the over-riding climatic influence on ecological responses are rarely discussed and the fact that the rainfall does not have an annual cycle but rather a cycle with an amplitude of possibly fifty years is not incorporated into analyses. Density of regrowth and tree size (dbh) does not necessarily reflect a specific age of the vegetation, for example, a forty-year-old dense regrowth of Stringybarks at Tarcutta has the same density and size as a ten-year-old regrowth of the same species at Nundle (A. Stewart, pers. comm.). This age/size difference may be due to abiotic site factors, the type of disturbance that created the regrowth or the prevailing climatic conditions. Without the knowledge of the actual age of the regrowth these two communities should not be compared. Significant changes to the native vegetation had occurred within very few years of European settlement on the coast and after only 25 years of grazing and occupation of inland NSW. In the 1860’s and 1870’s inland NSW was changing and the squatters were aware of it. Prior to settlement, grazing of the Australian rangelands by native herbivores generally had a light impact on the ecosystem compared with the introduction of stock. This represented a new impact on ecosystems which had little resistance to heavy grazing. It is important to remember that early stock numbers were
6
extremely high with a peak of 15.4 million DSE’s compared with about 6 million now in the Western Division. Plants had evolved to cope with water shortage, extreme desiccation, low nutrients and moderate to high salinity but not the impact of five introduced herbivores (Mitchell 1991). The extent of tree decline in central and western NSW is one of the greatest areas of dispute as exemplified by the debate resulting from Ryan et al. (1995) and Benson and Redpath (1997). In his analysis of this issue, Allen (1983) addressed all the probable causes for changes in tree and shrub density including clearing, fire, insect attack, grazing, rising water tables and salinity and several miscellaneous causes. While he does not have data for changes in floristic composition or structure he provides clear evidence and a rationale for tree decline and shrub increase where this has occurred. Suggested causes for excessive tree and shrub growth include fewer bushfires, periods of good rainfall, floods, the inability to control large numbers of seedlings and coppice following the clearing of big timber, reduction in rabbit numbers and over grazing. Significant changes in vegetation have also been documented for coastal areas. The probable distribution of sub-tropical rainforest in the Illawarra has been assessed from historical records and abiotic factors of the area (Mills 1988). There are now a few tiny rainforest remnants in this area, where once there were three extensive rainforests. In the arid zone there was a huge loss of trees as a result of the European settlers meeting their needs for housing and firewood as well as and the needs of their stock (wells, fences etc). Denny (1992) has calculated that some 30,000 fence posts were required for a medium sized sheep property and the tree species used were Coolibah, River Red Gum, Mulga, Gidgee, Whitewood, Bloodwood and White Cypress Pine. Probably only one post was taken from each tree suggesting that about a quarter of a million trees were used for fencing alone in the NW corner of NSW. Denny (1992) also demonstrates that the density of ‘woody weeds’ fluctuated over many years and are not a new phenomenon. They are a response to disturbance which will, in time evolve into a woodland – grassland community. Thinning, initially by ringbarking and then herbicides or tractors, has been employed by landholders in the Western Division since settlement to improve and maintain pastoral productivity. As a result of these practices, areas of long term pastoral parkland have been created or alternatively, a dense increase in woody shrubs which reduce pastoral productivity (Campbell 1994). The product of these thinning practices will have been dependent on edaphic factors and the prevailing climatic conditions.
7
1.2 Dynamics of Vegetation Structure and Condition The objective of this project is to provide data for one element of the structure of specific vegetation communities, stem densities, and to assess this for the determination of possible prescriptions for thinning as part of pre-clearing assessments. It is impossible to separate the structural element of stem density from the issues of ecological succession, patchiness of the abiotic environment and the resultant patchiness of the biotic environment in addition to the disturbance history of the site. Vegetation communities are dynamic systems. They alter in composition and structure through time with or without human interference, they are never static, and a simple comparison of forest conditions at two points in time fails to give due recognition to this dynamic. Disturbance is both a natural and man-made factor caused by events such as the impact of fires, floods, droughts, clearing and grazing by native and introduced herbivores. After disturbance, the initial regrowth of the community is dominated by fast and often dense growth of the early colonising species. Without any further disturbance, the species composition and structure of the community will change through time, ultimately reaching a stable state. The original dense regrowth will self-thin and conditions will change enabling the growth of new suites of species. The time taken for this ecological succession to occur is variable, depending on climatic conditions and the imposition of successive disturbance factors. Multiple stable vegetation states can exist in response to the sequence of disturbances on similar sites, which develop into quite different communities (Allen 1997, Noble 1997). A comprehensive study of ecological succession in the managed Australian environment is provided by Lunt (1998) for the remnant coastal woodland at Ocean Grove on the Bellarine Peninsula in southern Victoria. In this study he has described the observations of the earliest explorers of a sparsely wooded grassland which became a dense thicket of Acacia pycnantha. It was retained as this early colonising post-disturbance community for about 100 years by rotational harvesting for the wattle bark industry. When harvesting ceased succession recommenced and the community changed into a woodland with Eucalyptus, Allocasuarina, Acacia and Banksia and by the 1970’s the Allocasuarina was taking over from the eucalypts establishing dense thickets. This succession has taken place in the absence of fire and since the cessation of wattlebark harvesting and with almost no human disturbance. Fire can initiate a process of recolonisation by species present before the fire or it can produce a structural change in the vegetation. The forest fire regime 200 years ago is most likely to have included frequent low intensity fires lit by Aboriginal people as well as irregular intense fires ignited by lightning or people (Gill and Catling 2002). In the tall Mountain Ash forests stand-killing fires occurred at about 100 year intervals and exposure of the understorey to fire was about double, at 50-year intervals. Partly as a result of the fire history the southern Australian forests vary greatly in structure and species composition (Gill and Catling 2002). Plant communities also vary across the landscape and this variation can be at either a landscape or small local scale. When first seen by Europeans the central west of New South Wales was not a vast open plain covered with grass and a scattering of trees,
8
but a mosaic of vegetation cover – open plains, thick scrub, open and dense forests, and Myall plains. This patchwork landscape was a result of variations in the underlying edaphic factors, seasonal moisture availability and other site characteristics in addition to Aboriginal land management. Germination events can be episodic and determined by flood or fire events (e.g. Coolibah and Cypress), or they can be annual if conditions are appropriate (Allen 1983). This is another factor driving the patchiness of vegetation communities. With clearing of vegetation, the natural ecosystems have become increasingly fragmented, changing from an ecological continuum to ecologically segregated communities. Before European settlement, grassy woodlands and forests formed a continuous but patchy ecosystem. With fragmentation, some species have prospered in one remnant patch while others have prospered in other isolated fragments. These were once part of the same plant community but now appear to represent different communities. This also demonstrates the heterogeneous nature of the pre-existing community with species remaining in more open remnants representing gap-requiring specialists that were not present in the more dense parts of the original forest (Lunt 1995). The impact of past management is another factor which needs to be incorporated into any assessment of existing vegetation structure. Historical data can be used in conjunction with specific structural or vegetation condition variables to develop an ecological understanding of fragmented ecosystems e.g. roadside ecosystems (Spooner and Lunt 2004). In their study relating the conservation value (roadside conservation ranking) of roadside reserves with the original date of survey, Spooner and Lunt (2004) found that the oldest roads surveyed (pre 1870) were not strongly correlated with conservation values, with many having only medium conservation status, probably as a result of long term heavy grazing. Wider road reserves were mostly in better condition as they provided a buffer from the impact of edge effects, especially the increase in stem density. Ecological succession, disturbance history, species germination requirements, past management history, patchiness within the landscape and the loss of an ecological continuum across the landscape are all elements that should be incorporated in the development of conservation management strategies such as thinning prescriptions. It is also important to acknowledge that with the advent of European settlement and our impact on the landscape, Australia has become a managed landscape. There has been a shift from ‘nature’ conservation to ‘biodiversity’ conservation. As part of this ecological basis for the development of management prescriptions, some specific issues need to be highlighted. It is essential to integrate patchiness with thinning prescriptions and to maintain a diversity of structure both vertically and horizontally in the landscape and reduce the increasing trend towards stand simplification. The post fire seral stage and the type of fire response pattern exhibited by the plant community being assessed (Whelan et al. 2002 p96) is another factor to be considered when assessing strategies for thinning for management. Equally the use of fire for management of vegetation density must be carefully considered (Hobbs 2002).
9

Fencing for control of grazing pressures is one of many techniques being promoted for conservation management. The value of this technique has been evaluated by Spooner et al. (2002). Tree recruitment was recorded in 38% of fenced plots compared with 11% in unfenced plots. It was more effective in fenced Yellow Box (60% sites) than Grey Box (40%) or White Cypress Pine (18%) and recruitment levels in fenced sites increased with time. Overstorey crown cover was an important factor influencing tree recruitment and understorey composition with recruitment being more common in gaps or near the edges of mature trees than under mature trees (Spooner et al. 2002). 1.3 Vegetation Communities of New South Wales In this analysis, the descriptions listed are those described by the collector and where possible this information has been allocated to one of the Keith (2004) vegetation communities. In his description of the native vegetation of NSW and the ACT Keith (2004) described twelve Vegetation Formations and subdivided these into ninety-nine Vegetation Classes. Of the twelve vegetation formations, six are described as rainforests, forests or woodlands and contain a tree layer. The remainder are wetlands, heathlands, alpine formations and arid shrublands, without a tree layer. The focus of this review of stem densities and thinning prescriptions is on the formations with a tree layer and the tall shrub formations of the arid shrublands (North-west Plain, Gibber Transition and Mulga Shrublands). In describing the vegetation communities of NSW, Keith (2004) recognised that the structure, physiognomy and species composition of plant communities may change with time and can be complex, but they tend to show overriding systematic patterns that make these features useful for the classification of vegetation. In addition to variation in the abiotic environment (water availability, climatic variables, soil and substrate, nutrients, topography), plant communities are also a product of the interactions between plant species, plant and animal species and environmental disturbances (bushfires, floods, landslides). In the last 200 years vegetation communities have had an added influence of the land management practices of European settlement and changes from the Aboriginal land management previously employed. The scale of the vegetation compilation map and detail of the descriptions in Keith’s (2004) analysis does not allow for the representation of much of this variation. It is a broadscale representation of the patterns of the native vegetation in NSW. This, and the fact that it is a new classification, may result in some difficulty in allocating some of the stem density data to specific vegetation classes, especially the historical descriptions. Best approximations have been used. Discussion of the shrubland communities is also limited by the confusion that exists between natural variation in shrub density and the management problem of ‘invasive scrub’ or ‘woody weeds’ as these native plant communities are called. The issue of ‘invasive scrub’ is not the subject of this report.
10

1.4 Vegetation Legislation in New South Wales SEPP 46 In 1995 the NSW government introduced the State Environment Planning Policy (SEPP) No 46. This was in response to increasing concerns regarding the continuing extensive clearing of land and its impact on the environment. It included a requirement for Grassland Management Plans and Regional Vegetation Management Plans. NVC Act (1997) The Native Vegetation Conservation Act replaced SEPP 46. The objectives of this act were to conserve and manage native vegetation on a regional basis, encourage and promote native vegetation, protect native vegetation of high conservation value, improve vegetation condition and encourage revegetation, prevent inappropriate clearing and promote the significance of native vegetation. Definitions of terms used in this act, including the definition of clearing, are in Appendix 3. An important component in the administration of this act was the appointment of Regional Vegetation Committees for the development of Regional Vegetation Management Plans. These were intended to enable for communities to develop their own regional solutions to native vegetation conservation, the viability of agricultural production and rural communities, conservation of native species and their habitats and the protection of cultural relics and management of cultural landscapes. At the time the NVC Act (1997) was replaced by the Native Vegetation Act 2003, two vegetation Regional Vegetation Management Plans had been made by the Minister and several more had reached the final draft stage. Others had been partially compiled but had not fulfilled Ministerial requirements. In 2001 the NSW NVC Act had been in operation for 3 years with 300,000 ha cleared since enactment (78,000 ha in 2000). Most clearing at this time was in a belt of land 150 km wide along the eastern and southern boundaries of the Western Division and in the northern wheatbelt of the Central Division. In other areas remnant vegetation is cleared (Stevens 2001). Native Vegetation Act 2003 The Native Vegetation Act (NV) 2003 replaced the NVC Act 1997. The objects of the act are:
(a) to provide for, encourage and promote the management of native vegetation on a regional basis in the social, economic and environmental interests of the State, and (b) to prevent broadscale clearing unless it improves or maintains environmental outcomes, and (c) to protect native vegetation of high conservation value having regard to its contribution to such matters as water quality, biodiversity, or the prevention of salinity or land degradation, and (d) to improve the condition of existing native vegetation, particularly where it has high conservation value, and (e) to encourage the revegetation of land, and the rehabilitation of land, with
11

appropriate native vegetation, in accordance with the principles of ecologically sustainable development.
Within the Act, clearing is defined as:
(a) cutting down, felling, thinning, logging or removing native vegetation, (b) killing, destroying, poisoning, ringbarking, uprooting or burning native vegetation. Further definitions are in Appendix 3.
Under this Act, native vegetation must not be cleared except in accordance with: (a) a development consent granted in accordance with this Act, or (b) a property vegetation plan.
The Property Vegetation Plan (PVP) may make provision for native vegetation management on the land to which it applies, including the following:
(a) proposals for clearing native vegetation on the land, (b) the identification of native vegetation on the land as regrowth, as referred to in section 9 (2), (c) proposals relating to the thinning of native vegetation in the central area of the State that has regrown between 1 January 1983 and 1 January 1990, (d) proposals to enable landholders to obtain financial incentives for the management of natural resources, being proposals relating to the carrying out or funding of native vegetation management activities by catchment management authorities or other bodies, (e) proposals relating to the continuation of existing farming or other rural practices, (f) provisions excluding clearing for routine agricultural management or other activities from being permitted clearing, (g) such other provisions as are prescribed by the regulations.
This review of stem density data for vegetation communities across NSW is required for the development of possible management strategies or clearing proposals including thinning in the context of the requirement for PVP’s by the legislation. 1.5 Project Brief This project has been designed to collate, summarise and interpret available information about stem densities (stems per hectare) of native tree and shrub species and vegetation communities across NSW. This information has become important in the context of the debate regarding the density of ‘1750’ vegetation and the need to determine the requirements for PVP’s in relation to thinning.
12

Data for this assessment has been obtained through a comprehensive literature review. The approach used has been to collate species-specific information, focussing on ‘problem’ tree species and when data for stem densities by community type has been available this has also been used. Both the species-specific and plant community data have been classified in terms of the vegetation classes described by Keith (2004). The location, tree species, species diversity, size class and, where possible, management or disturbance history has been incorporated. A PVP assessment tool for biodiversity, using established benchmarks, is being developed. Benchmarks describe the range of variability in condition in vegetation in relatively unmodified condition, that is, vegetation with relatively little evidence of alteration, disturbance or modification by humans since European settlement. Benchmarks are described for condition variables by vegetation community, at the scale of the stand or patch. Benchmarks describe the range of variation in condition variables in such communities. The determination of benchmarks for stem densities within defined vegetation communities in New South Wales is inevitably complex. It is open to debate given the occurrence of a range of vegetation types occurring within NSW, variable and undocumented disturbance histories and the existence of several transitional and stable states for each community depending on the interaction of disturbance, climatic and abiotic site factors. In addition, the majority of structural descriptions of woodlands and forests, both historical observations and current assessments (e.g. Cox et al. 2001), are defined by a variety of measures of crown cover and continuity of canopy rather than stand or stem density or focus on species lists without any density estimates (Benson ND) and determining benchmarks is problematic. In assessing this element of the structure of a vegetation community it is essential that a simplistic approach be avoided and the ecological complexities be incorporated. Vegetation condition is a context-dependant concept. A variety of methods are used in the literature to describe vegetation and species density ranging from general descriptions and cover estimates (e.g. Cox et al. 2001, Sivertsen and Metcalf 1995, Bennett and Ford 1997) to stem density and forestry measurements such as basal area and cubic metres. Until the development of definitions by Specht (1970, 1981, Table 1.1), the recording of cover estimates and structural forms was variable. When assessing historical records and reports it is essential to recognise that there has been a variation in the methods of estimation of tree density in addition to the purely descriptive terms that have also been used. Definitions of canopy density measures (Specht 1970, 1981, McIntyre 2002, Walker et al. 1988, McDonald et al. 1990, Specht and Specht 1999) include:
Crown Cover: The percentage of the sample area shaded by the crowns if lit from directly overhead. The crowns are assumed to be solid shade. Foliage Cover: The percentage of the sample area shaded by the crowns if lit from directly overhead but the shade is that represented by the foliage and branches (crown is not solid). Foliage cover ranges are: open forest 30-70%; woodland 10-30%; open woodland<10%. Foliage Projective Cover: The percentage of the sample area shaded by the crowns if lit from directly overhead but the shade is that represented by the
13

foliage only (crown is not solid) and represents photosynthetic potential. This is rarely used due to the difficulty of measurement. Crown Separation Ratio (CSR): The average distance between the edges of the crowns divided by the average width of the crowns. Forest/open forest has a CSR of 0-0.25, woodland 0.25-1, open woodland 1-20 and isolated trees >20. Basal area: the proportion of the ground occupied by the area of the tree trunks (dbh x stem density).
Basal area is commonly used in forestry literature, for example, the draft Private Native Forestry code uses basal area and canopy height. An important limitation with the use of basal area, as well as the various canopy cover measurements, is that it does not indicate patchiness of stem density or size variation across the stand. Forestry plans also routinely use cubic metres (m3) as their primary indicator of available timber and some forestry management plans have used undefined descriptive terms to indicate density e.g.
‘5 ha med. pine in NW. 110 ha med box. 6 ha hill type, 12 ha scattered pine. 105 ha med box – scattered pine, 18 ha dense pine; 64 ha med – pine-box.’
(Forestry Commission of NSW 1984)
While stem densities are the focus of this review these alternative methods of estimating the density of tree coverage have been included as it may be possible to convert these into estimates of trees/ha. In a study of the number of trees cleared in the Murray Darling Basin over two centuries Walker et al. (1993) recognised the need to be able to infer tree numbers from vegetation maps without extensive ground truthing. They developed a plot of percent projected foliage cover against the number of trees per hectare from sample sites widely distributed across the basin (Figure 1.1). This only included mature upper stratum trees and excluded small trees (Walker et al. 1993). Figure 1.1: A plot of projected foliage cover % vs. number of trees per hectare. The mean values for each formation are shown (from Walker et al. 1993).
14
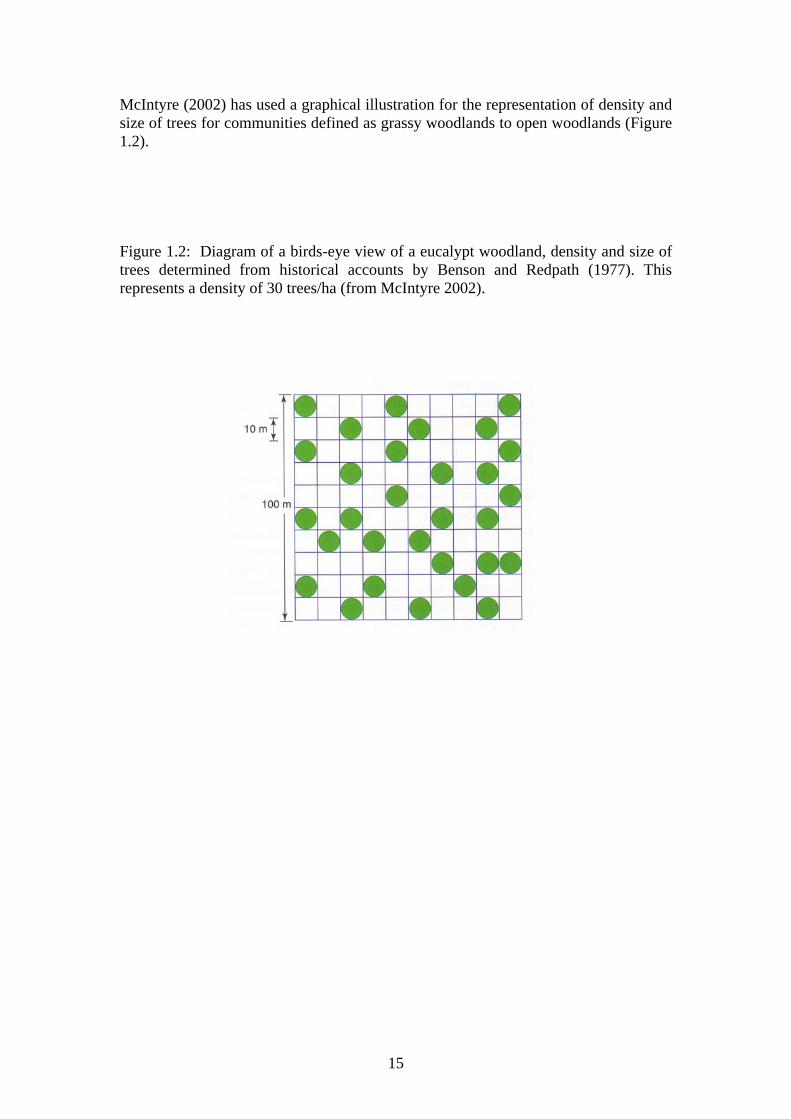
McIntyre (2002) has used a graphical illustration for the representation of density and size of trees for communities defined as grassy woodlands to open woodlands (Figure 1.2). Figure 1.2: Diagram of a birds-eye view of a eucalypt woodland, density and size of trees determined from historical accounts by Benson and Redpath (1977). This represents a density of 30 trees/ha (from McIntyre 2002).
15
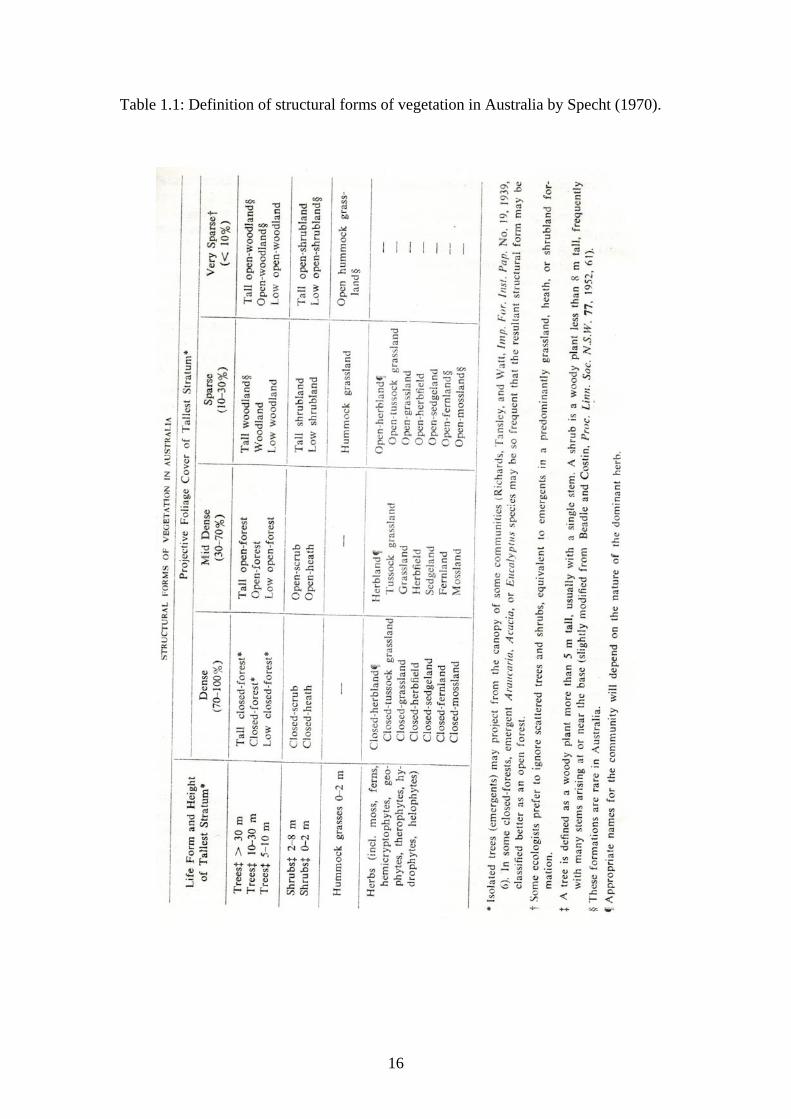
Table 1.1: Definition of structural forms of vegetation in Australia by Specht (1970).
16

2. Stem Densities 2.1 Project Brief To collate, summarise, interpret available information on stem densities for tree and shrub species in terms of stems per hectare:
1. By species and/or vegetation communities 2. From Regional Vegetation Management Plans 3. In relation to benchmarks for native vegetation
2.2 Data Sources Records of stem densities for both individual species and vegetation communities have been obtained from:
• Published papers and historical accounts based on a range of assessments and a range of tree sizes (diameter at breast height (dbh) or diameter at breast height over bark (dbhob).
• The results of counting stumps remaining in harvested forests • State Forests data from thinning trials • Assessment of tree densities from historical survey maps • Vegetation survey publications.
There are significant limitations in the use of these data:
• Ecological variables are not consistent across all sets of data – climatic conditions, soil type, variations within the plant community, variable spatial scale, unknown disturbance history, frequently from production forests.
• Forestry trials are based on silviculturally managed forests (not ‘benchmark’ forests) and selectively use only the merchantable species from the plant community; also only from selected parts of a particular plant community (eg Pilliga cypress trials only consider cypress in areas where the cypress is the dominant species – overall the proportion of cypress is about 1/3 with 1/3 narrow leaved ironbark and 1/3 other tree species (W. Bratby pers. com.).
• dbh classes used are very variable, if they are used at all. For the Victorian Ecological Vegetation Class benchmarks there is only a specification of dbh for large trees (varying from 50 cm to 90 cm depending on vegetation class) but no specifications for smaller size classes. Most vegetation in the central west, even ‘high quality’ vegetation has little recruitment, a loss of older trees and the presence of a high proportion of coppiced trees.
• The successional state of the plant community is mostly not described. Ideally distinctions need to be made between regrowth, climax communities and derived or secondary communities
2.3 Recorded Stem Densities The collated information for tree stem densities is summarised below. It is listed under tree species and the Keith (2004) Vegetation Class allocated where possible.
17

The detailed collation of source material, which is the basis of this summary, can be found in Appendix 1. 2.3.1 Murray Darling Basin Because of the influence of land clearing on soil and watercourse salinity levels, Walker et al. (1993) began their study of the ecohydrological changes in the Murray Darling Basin (MDB) with an analysis of the extent of tree loss across the whole basin. For their analysis they used satellite imagery to determine foliage cover and then developed a function to convert this into the number of trees per hectare. Only the mature stratum (trees <60cm in girth) was incorporated. The vegetation of the one million square kilometres of the MDB was divided into six formation classes by Walker et al. (1993) and these include many of the vegetation classes described by Keith (2004). To define these structural classes as Keith classes is inappropriate given the scale of the analysis and the fact that it also includes land outside the NSW State boundaries. The structural classification used for their analysis has been retained here. Overall, Walker et al. (1993) estimated that the pre-European tree density in the MDB has been reduced by 38 – 42%. The estimated tree densities, divided into the formation classes range from 720 trees/ha in forests to 47 trees/ha in open woodland (Table 2.1, from Walker et al. 1993). Table 2.1: Changes in estimated tree densities (no/ha), the number of trees calculated to have occurred in the original vegetation, in the present vegetation and the change (whether an increase +, or decrease -) between these two estimates (original and present) of tree numbers. These estimates are calculated for the six major vegetation formation classes present in the Murray Darling Basin in addition to the estimate of total tree numbers in the MDB (From Walker et al. 1993).
.3.2 Cypress Pine (Callitris spp.) llitris glaucophylla) originally extended from
2Forests of White Cypress Pine (Casouth-eastern Queensland down the western slopes and across the plains of NSW. Clearing throughout this area has reduced its occurrence to small, scattered areas. While White Cypress Pine now grows in almost pure stands this was probably rather rare prior to European management of the landscape. Associated species are most
18
frequently box and ironbark and less commonly red gum species. White Cypress Pine commonly grows to a height of 20 to 25 metres and 60cms dbh but under optimum conditions it will grow to 35 metres in height and 90cms dbh (‘Old Greys’). In the western parts of its distribution it may grow to a maximum of only 7 metres in height and 22cms dbh (Hall et al. 1975). The White Cypress Pine is frequently cited as a pest species, growing in impenetrable
he perception of a wave of cypress regeneration sweeping across New South Wales
he most comprehensive study of the ecology and history of the cypress forests on the
on across the central western region,
lly take 300 years or more without major
llen has constructed a very plausible natural cypress life cycle (Figure 2.1). This
thickets which become ‘locked’ and without management intervention it is assumed that it will not grow into mature communities. There is a significant volume of literature regarding the densities of this species but much of it is uncritically reported anecdotal evidence without detailed historical analysis. Occasionally regeneration of the Black Cypress Pine (Callitris endlicheri) can also produce ‘locked’ thickets but this species is less frequently considered a problem and is often not separated from the descriptions of White Cypress. Tat one time is clearly not true when the historical information is examined (Mitchell 1991, Noble 1997). Similar events may have occurred at several locations, but their timing varied. This was due to the fact that each area was not settled with equal intensity by Europeans at the same time, for example, pastoralism was well established before the 1860’s in southern NSW while most claimed land in the Pilliga was taken up a little later, by the 1880’s (Curby 1997, Norris et al. 1991). There is also limted evidence that the core of the Pilliga was ever intensively settled or heavily grazed (Norris et al. 1991). Twestern slopes of NSW is by Allen (1997). He provides a detailed analysis of ecological cycles, edaphic factors and the influences of natural environmental forces and management practices. From his detailed research of historical records and existing forest structure, Allen provides evidence that the pre-European forest was clearly a mosaic of plains, ‘scrubs’ and open and dense forests. This included seedlings generally growing in clumps, to trees of about 20 metres in height, and the phases of maturity differed between the forests.
‘The explorers found a mosaic of vegetatiand today’s forests were part of that mosaic though not necessarily as we see them now … long term natural cycle influenced to a greater or lesser degree by Aboriginal burning. … To pick out any one date (1750) … ignores the fact that forests are and were dynamic systems, and fails to give a true picture of process’ Allen (1997, p131). ‘A cycle which may naturainterference is being compressed into a third of that period, and at the same time, across almost the whole of the forests, one species has been deliberately promoted at the detriment of the others.’ Allen (1997, p132).
Acycle probably takes 200 to 300 years from dense regrowth to individual old trees but the cycle can be compressed to 100 years using silvicultural practices. In this reconstruction Allen assessed the influence of fire, rabbits and logging. It is also critical to incorporate the eucalypt component of these forests into any assessment of the appropriate management strategies. The densities and maturity of eucalypt
19

hardwoods in these forests managed for cypress harvesting has frequently been ignored but all three State Forests assessed by Allen contain vastly fewer hardwoods than the pre-European forests. The change in hardwood and pine density has been determined or inferred for Strahorn State Forest near Forbes by Allen (1997) and is illustrated in Figure 2.2. He indicates that the original forests were mixed box-cypress communities and in some areas were dominated by box species. These forests now contain almost no box trees except for some small areas of young box regeneration.
20

Figure 2.1: Comparison of pre-European and managed late 20th century cypress pine forest cycles (Figure 6.6 p122 from Allen 1997)
21

Figure 2.2: Schematic diagram of inferred or known cypress pine and hardwood components over the past 250 years (Figure 6.3 p 125, Allen 1997)
22

Keith Vegetation Classes The historical descriptions of Cypress Pine have been based on a range of vegetation communities from dry sclerophyll forests to woodlands and semi-arid woodlands. These have naturally varying densities of cypress in the mature community, in addition to the natural variation reflecting age of the stand and substrate factors. White Cypress Pine can be a significant species in the following Keith (2004) Vegetation classes:
• Western Slopes Grassy Woodlands (Grassy Woodlands Formation) with Eucalyptus albens (dominant) Brachychiton populneus, E, blakelyi and E. melliodora. Also E. melanophloia and E. pillagaensis in the north.
• Floodplain Transition Woodlands (Grassy Woodlands Formation) with E. microcarpa (dominant), E. melliodora (south), E conica, E. pilligaensis, Casuarina crista (north), pine more common in the drier parts of this community with Acacia homalophylla, Allocasuarina luemannii, Casuarina pauper, E. populnea and Brachychiton populneus.
• North-west Slopes Dry Sclerophyll Woodlands (Dry Sclerophyll Forest Formation) with Brachychiton populneus, Eucalyptus albens and E. melanophloia, E. pillagaensis in the north.
• Upper Riverina Dry Sclerophyll Forests (Dry Sclerophyll Forest Formation) -patchy occurrence with Eucalyptus albens, E. blakelyi, E. macorhyncha, E. sideroxylon and occasionally C. endlicheri.
• Pilliga Outwash Dry Sclerophyll Forests (Dry Sclerophyll Forest Formation) with E. albens, E. chloroclada, E. conica, E. microcarpa, E. pilligaensis, Allocasuarina leumannii and Casuarina cristata. On elevated sites E. crebra, E. dealbata, E. melanophloia, E. nubila, E. populnea, E. sideroxylon.
• Western Slopes Dry Sclerophyll Forests (Dry Sclerophyll Forest Formation) –E. dealbata and E. sideroxylon, occur throughout. Callitris endlicheri and C. glaucophylla locally common, other eucalypt species (E. crebra, E. chloroclada, E. melanophloia, E. nubila) more common in the northern part of the range.
• North-west Alluvial Sand Woodlands (Semi-arid Woodland Formation) with Allocasuarina luehmannii, Corymbia dolicharpa, C. tessellaris and E. populnea.
• Riverine Sandhill Woodlands (Semi-arid Woodland Formation) with E. intertexta, E. populnea and Brachychiton populneus.
• Inland Rocky Hill Woodlands (Semi-arid Woodland Formation) with E. dwyeri, E. intertexta, E. vicina, E. viridis.
• Subtropical Semi-arid Woodlands (Semi-arid Woodland Formation) with E. melanophloia (dominant), Brachychiton populneus and E. populnea.
• Western Peneplain Woodlands (Semi-arid Woodland Formation) with E. populnea, E. intertexta, Brachychiton populneus, E. conica, E. melliodora, E. microcarpa depending on substrate.
Black Cypress Pine is a dominant species in:
• Northern Tableland Dry Sclerophyll Forest (Dry Sclerophyll Forest Formation) with E. andrewsii, E. dealbata, E. prava and other Eucalypt species.
23
Only 3 or 4 of these Keith (2004) vegetation communities containing Cypress Pine have been the subjects of the major Cypress Pine studies. Stem Densities Pilliga Outwash Dry Sclerophyll Forest and Western Slopes Dry Sclerophyll Forest (Keith 2004). It is difficult to determine precisely which of these vegetation classes is the subject of the studies by Paull (2001), Date & Paull (2000), van Kempen (1997) and Norris et al. (1991) as the descriptions focus on two or three species rather than the floristic or structural composition of the forest. In these studies there is also no consistency in the size classes used for description. Mature trees
>64cm dbh: 30/ha (4.8 Callitris glaucophylla per ha + 24.7 Eucalyptus crebra per ha historically from stump analyses); >50cm dbh: 7/ha in 1923; 25cm dbh: 20.5 in 1923 (Paull 2001).
25 milling trees/ha; 2.5 to 62.5/ha in 1908 (van Kempen 1997). 25-30 cm dbh 5/ha, 2/ha >30 cm dbh 1923 - West Pilliga (van Kempen 1997). >25 cm dbh 20/ha, 1926 (van Kempen 1997). >25 cm dbh, 9/ha; 10-13 cm dbh, 50/ha – 1929 Pilliga Coonamble Rd (van
Kempen 1997). 10-13 cm dbh, 80/ha; 13-25 cm dbh, 60/ha; 25 cm dbh, 3/ha; Total 144/ha
Merriwindi State Forest compared with 82/ha (all dbh) in the west. 280 stems/ha with a recommended 6 x 6m spacing.
‘Wheatfield’ Regeneration 120,000/ha; 1 million per ha (van Kempen 1997).
Total tree and Shrub density 1825/ha Goonoo Forest (Shelly 1998).
Floodplain Transition Woodland (Keith 2004). This is the most likely Keith vegetation class covered by the studies by Curby (1997), Allen (1997) and, in Victoria, Lunt et al. (2001) and Parker and Lunt (2000). Mature trees
<20cm dbh, 43/ha; >20 cm dbh, 7/ha; 1860’s estimate from stump counts (Lunt et al. 2001).
172 stems/ha (all sizes) 1998; (Lunt et al. 2001) 50-60 cm dbh, 20/ha; 30-40 cm dbh, 20/ha pre-1900 estimate from stump
counts (Curby 1997). Dense sapling pine 400-800 stems/ha – varying size with site quality, smaller
on poor gravely ridges; Back Yamma State Forest (Allen 1997). Many thousands of large pine >100 years old cut for milling by 1882; Back
Yamma State Forest (Allen 1997). 50 cm dbh, 5/ha; 30 cm dbh, 10/ha; <30 cm dbh, 300/ha; 1883 Strahorn State
Forest (Allen 1997) from stump counts. 60-80 pine trees/ha in the north, fewer in the south in early nineteenth century
Euglo State Forest (Allen 1997) from stump counts. 14 – 20 cm dbh, 225/ha; 20 – 26 cm dbh, 75/ha.
‘Wheatfield’ regeneration 900,000 – 3,240,000 stems/ha (Noble 1997). 125,000 stems/ha when 20 years old (Noble 1997). 100,000 stems/ha 40 years old, 3 cm dbh, 2m tall (SFNSW).
24
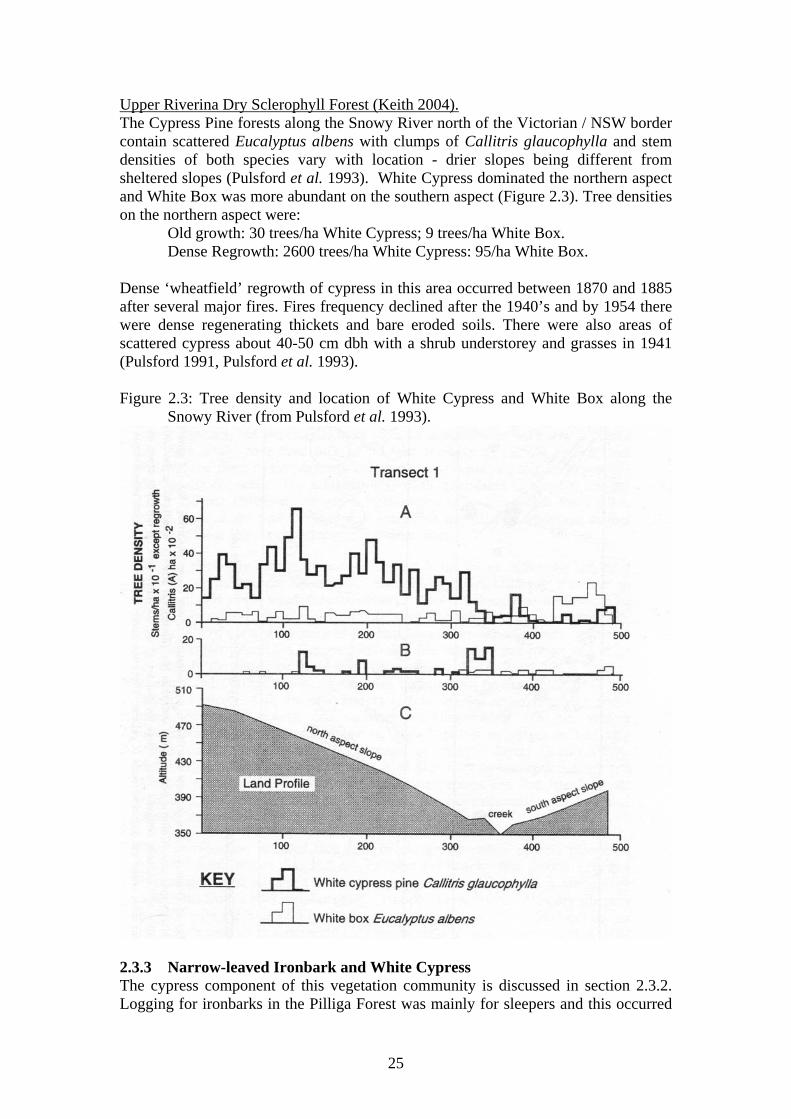
Upper Riverina Dry Sclerophyll Forest (Keith 2004). The Cypress Pine forests along the Snowy River north of the Victorian / NSW border contain scattered Eucalyptus albens with clumps of Callitris glaucophylla and stem densities of both species vary with location - drier slopes being different from sheltered slopes (Pulsford et al. 1993). White Cypress dominated the northern aspect and White Box was more abundant on the southern aspect (Figure 2.3). Tree densities on the northern aspect were:
Old growth: 30 trees/ha White Cypress; 9 trees/ha White Box. Dense Regrowth: 2600 trees/ha White Cypress: 95/ha White Box.
Dense ‘wheatfield’ regrowth of cypress in this area occurred between 1870 and 1885 after several major fires. Fires frequency declined after the 1940’s and by 1954 there were dense regenerating thickets and bare eroded soils. There were also areas of scattered cypress about 40-50 cm dbh with a shrub understorey and grasses in 1941 (Pulsford 1991, Pulsford et al. 1993). Figure 2.3: Tree density and location of White Cypress and White Box along the
Snowy River (from Pulsford et al. 1993).
2.3.3 Narrow-leaved Ironbark and White Cypress The cypress component of this vegetation community is discussed in section 2.3.2. Logging for ironbarks in the Pilliga Forest was mainly for sleepers and this occurred
25
from 1880. Before the arrival of the railway, large areas of old eucalypts and cypress were ringbarked by pastoralists and the remaining hardwoods were removed for sleepers. Most hardwood supplies (especially ironbarks) were depleted by the 1950’s. Regeneration of ironbarks between the 1890’s and 1950’s was limited by rabbit plagues but since then has been adequate or even prolific. Most stands contain a ‘generation gap’ with few old trees and many young trees (too young to log or to have become conservation value). Ironbarks include Narrow-leafed Ironbark (most targeted), as well as Broad-leaved and Mugga Ironbarks. In 1918 Austin described the Coborrah estate, north-east of Dubbo along the Talbragar River:
“Practically all of this country was very heavily timbered mostly with fine large ironbarks from which hundreds of sleepers had been cut in 1915-1917.”
Insultimber (droppers for electric fences) cutting of all 3 ironbark species began 1979 in the Pilliga and Goonoo forests – usually old growth or mature trees with ‘pipes’ or hollows and smaller trees with growth defects (fauna habitat trees). Some parts of the Pilliga forests are almost devoid of healthy ironbarks >40 cm dbh. From 1986 to 1993, 2 large habitat trees (any species) were to be retained during logging. Now it is the same as for sleeper cutting. Keith vegetation classes
• Pilliga Outwash Dry Sclerophyll Forests (Dry Sclerophyll Forest Formation) dominated by Callitris glaucophylla, E. albens, E. chloroclada, E. conica, E. microcarpa, E. pilligaensis, Allocasuarina leumannii and Casuarina cristata. On elevated sites E. crebra, E. dealbata, E. melanophloia, E. nubila, E. populnea, E. sideroxylon.
Stem Densities Pilliga Outwash Dry Sclerophyll Forests (Keith 2004). E. crebra in the central Pilliga West State Forest (Eastern Grassy woodland)
>64 cm dbh – 24.7/ha plus 4.8 White Cypress per ha.; 7.2>50 cm dbh (1923 forestry records, District Forester Burrow); 5.6 >25 cm dbh (1929 forestry records B. Priestman).
E. crebra woodland, South Burnett region Qld
640 trees/ha - 70 cm girth [22 cm dbh] and 18 m high, canopy width 5 m (Walker et al. 1986).
Dry Sclerophyll Forest Subformation, E. dealbata – E. sideroxylon Canopy continuous, not usually interlacing (Beadle 1948). 2.3.4 Box-Ironbark Forests and Woodlands of Victoria The box-ironbark woodlands and forests form a well defined region in central Victoria occurring across the gently undulating rises and low hills (Tzaros 2005). A variety of plant associations occur in that area: Red Ironbark, Grey Box and Yellow Gum in the central and western area; Grey Box, Red Box and Mugga Ironbark in the east; Red Stringybark, Red Box and Long-leaf Box on higher slopes. The understorey is also variable but generally sparse with Golden Wattle, Drooping Cassinia and a
26
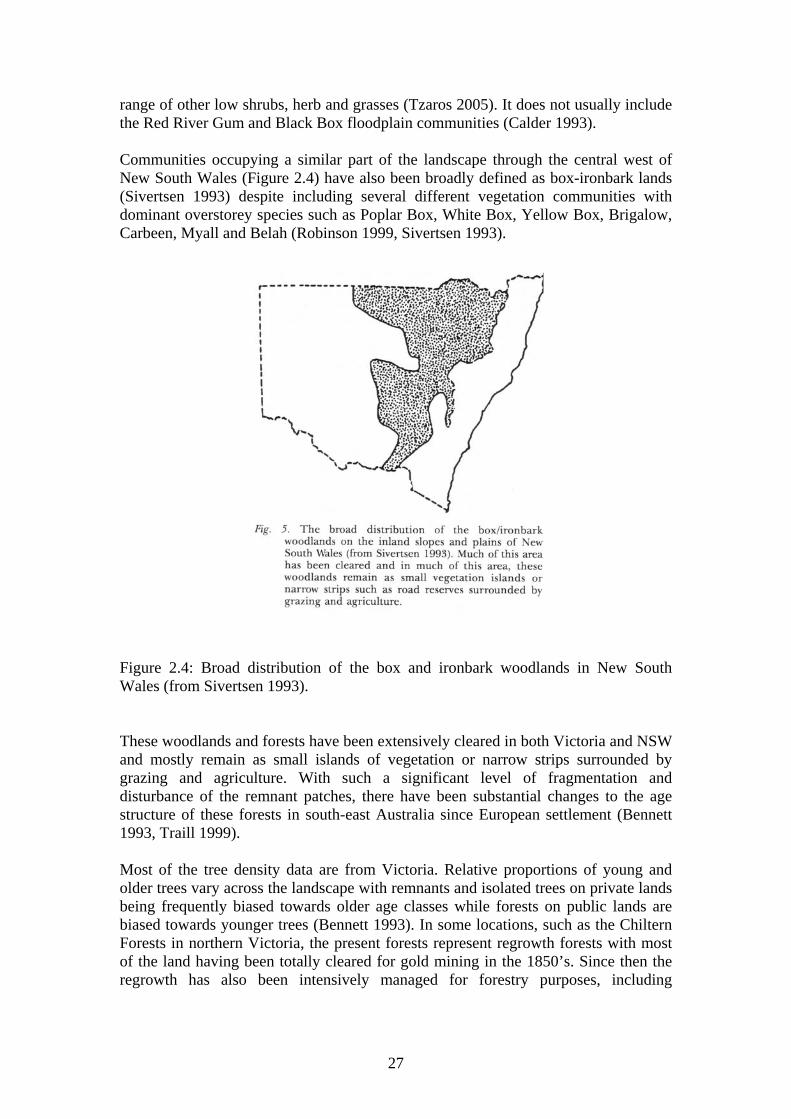
range of other low shrubs, herb and grasses (Tzaros 2005). It does not usually include the Red River Gum and Black Box floodplain communities (Calder 1993). Communities occupying a similar part of the landscape through the central west of New South Wales (Figure 2.4) have also been broadly defined as box-ironbark lands (Sivertsen 1993) despite including several different vegetation communities with dominant overstorey species such as Poplar Box, White Box, Yellow Box, Brigalow, Carbeen, Myall and Belah (Robinson 1999, Sivertsen 1993).
Figure 2.4: Broad distribution of the box and ironbark woodlands in New South Wales (from Sivertsen 1993). These woodlands and forests have been extensively cleared in both Victoria and NSW and mostly remain as small islands of vegetation or narrow strips surrounded by grazing and agriculture. With such a significant level of fragmentation and disturbance of the remnant patches, there have been substantial changes to the age structure of these forests in south-east Australia since European settlement (Bennett 1993, Traill 1999). Most of the tree density data are from Victoria. Relative proportions of young and older trees vary across the landscape with remnants and isolated trees on private lands being frequently biased towards older age classes while forests on public lands are biased towards younger trees (Bennett 1993). In some locations, such as the Chiltern Forests in northern Victoria, the present forests represent regrowth forests with most of the land having been totally cleared for gold mining in the 1850’s. Since then the regrowth has also been intensively managed for forestry purposes, including
27
‘liberation treatment’, the removal of mature trees to enhance growth of the commercially valuable younger trees (Traill 1991). Keith Vegetation Classes The Keith (2004) vegetation classes that could be described as box–ironbark forests and woodlands in NSW are:
• Western Slopes Grassy Woodlands (Grassy Woodlands Formation) dominated by Eucalyptus albens (dominant) Brachychiton populneus, E, blakelyi and E. melliodora. Also E. melanophloia and E. pillagaensis in the north.
• North-west Slopes Dry Sclerophyll Woodlands (Dry Sclerophyll Forest Formation) Brachychiton populneus, Callitris glaucophylla, Eucalyptus albens and E. melanophloia, E. pillagaensis in the north.
• Upper Riverina Dry Sclerophyll Forests (Dry Sclerophyll Forest Formation) - Eucalyptus albens, E. blakelyi, E. macorhyncha, E. goniocalyx, E. nortonii, E. sideroxylon and occasionally Callitris glaucophylla and C. endlicheri.
• Pilliga Outwash Dry Sclerophyll Forests (Dry Sclerophyll Forest Formation) dominated by Callitris glaucophylla, E. albens, E. chloroclada, E. conica, E. microcarpa, E. pilligaensis, Allocasuarina leumannii and Casuarina cristata. On elevated sites E. crebra, E. dealbata, E. melanophloia, E. nubila, E. populnea, E. sideroxylon.
• Western Slopes Dry Sclerophyll Forests (Dry Sclerophyll Forest Formation) –E. dealbata and E. sideroxylon, occur throughout. Callitris endlicheri and C. glaucophylla locally common, other eucalypt species (E. crebra, E. chloroclada, E. melanophloia, E. nubila) more common in the northern part of the range.
Stem densities Victorian Box-Ironbark Forests
Pre-European estimates: up to 30 very large trees (>80 cm dbh) per hectare (Newman 1961).
Present densities: 2 trees >60 cm dbh. These trees are unevenly distributed with two-thirds of the remaining forest devoid of any large trees, compared with the best patches which have 12 / ha (Soderquist et al. 1999).
Chiltern Forest (Red Ironbark, Red Stringybark, Red Box, Grey Box, White
Box and Blakely’s Red Gum) (Traill 1991, 1993): Pre-European – open stands of probably 30-40 trees/ha, mostly large mature
trees (>1m dbh); Present densities - much more dense stands of immature trees with very little
remnant timber. Northern Victorian Plains Vegetation associations included in this study which focussed on tree hollows were River Red Gum, Black Box, Grey Box, mixed Box/Stringybark, Yellow Box and Cypress Pine with Box (Bennett et al. 1994). The stem density within each size class was compared between sites within remnant vegetation blocks of different sizes (>200 ha, 30-200 ha, 5-30 ha, <5 ha, scattered trees, roadside vegetation, narrow streamside, wide streamside). The range of stem densities for each block size is also provided (See table Appendix 1). The relative abundance of tree species between the sites is
28
also provided in Appendix 1) with the most abundant being E. camaldulensis, E. microcarpa and dead trees. The distribution of tree hollows between the size classes is assessed (see Appendix 1).
Large trees (>70 cm dbh): 7/ha (blocks 30-200 ha) to 30/ha in narrow streamsides.
Small trees (10-30 cm): 56/ha (blocks <5 ha) to 157/ha (blocks 30-200 ha). Saplings (<10 cm): 242/ha (blocks >200 ha) to 12/ha (blocks <5 ha).
Stringybark (Riverina) This observation possibly refers to the Keith Class: Upper Riverina Dry Sclerophyll Forest (Dry Sclerophyll Forests). Dense regrowth – too dense to ride a horse through; 10 cm dbh, 40 years old regrowth after a hot fire in 1939 (A. Stewart pers. comm.). 2.3.5 Gum and Box Woodlands of Victoria Using historical sources from East Gippsland, Douglas (1997) has described two predominant structural formations. These are:
• Open forests or woodlands with a grassy understorey: Red Gum and box on lake margins and plains, box woodlands in the inland valleys and gum woodlands on the tablelands.
• Dense forests on the foothills, mountain and coastal areas. The extensive forests of very large old trees known from South Gippsland were not noted from East Gippsland.
Stem Densities Lowland Gippsland Plain These were determined from historical plans which contained descriptive notes varying from ‘open plain’ and ‘forest’. Vegetation communities were described as mixed eucalypt woodlands with Red Gum, box and She Oak (Lunt 1997). No size classes are provided for these analyses.
2-9 trees per ha in ‘open plains good agricultural land’. 59 trees per ha on ‘ good agricultural land liable to be flooded in very wet
seasons. 34 trees per ha in Stratford township. 18-30 trees per ha ‘thickly timbered … gum and she oak’.
Tree densities in existing vegetation remnants along roadsides are much greater.
1425 trees per ha in a flora reserve in the same area. 2.3.6 Grassy Eucalypt Woodlands Grassy woodlands are typified by a tree layer of Eucalyptus and Corymbia species over an herbaceous ground layer dominated by perennial tussock grasses. In woodlands tree canopies are clearly separated but tree density varies from open woodland to grassy forests (McIvor and McIntyre 2002). The distribution of these vegetation communities is a similar distribution to the box–ironbark forests (Figure 2.4). The grassy eucalypt woodlands occur on the fertile soils and well grassed landscapes preferred for agriculture and settlement and have been substantially lost or altered by clearing and changed management regimes. Only 24% of this original woodland cover remains and most of these remnants are seriously degraded by dieback and loss of understorey (Windsor 2000, McIvor and McIntyre 2002).
29

With such a significant levels of alteration in these communities it is difficult to estimate the optimal tree density. Patch size is also mostly quite small and a minimum population of 500 trees is required to maintain genetic diversity. A typical population structure of grazed woodlands is a scattering of mature trees with few or no saplings and the long term viability of these populations is in doubt (McIntyre 2002). Some dense even aged regrowth stands of saplings or a series of distinct ages in the central west appear to result from specific trigger events (Windsor (2000).
“If you don’t have a tree regrowth problem you have a tree decline problem.” (R. W. Johnson quoted in McIntyre 2002).
Pre-European box woodlands have been described as ‘relatively open woodland, with a somewhat clumped distribution of trees … with a grassy understorey’ (Croft et al. (1997).In the central west of NSW two alliances are dominant: Yellow Box and White Box which are distributed as a mosaic across the landscape (Windsor 2000). Keith Vegetation Classes Seven vegetation classes in NSW are described by Keith (2004) as belonging to the Grassy Woodlands formation.
• Coastal Valley Grassy Woodlands (Grassy Woodlands Formation) contain a suite of highly diverse plant assemblages isolated in different dry coastal valleys affected by rain shadow. Tree species include Angophora floribunda, E. tereticornis, Corymbia maculata, E. crebra, E. eugenioides and E. mollucana.
• Tableland Clay Grassy Woodlands (Grassy Woodlands Formation). These occur on the gently undulating tablelands of the Great Dividing Range. Dominant tree species include E. pauciflora, E. stellulata, E. viminalis, occasionally E. melliodora and Angophora florabumda, E dalrympleana and E. nova-anglia on the New England Tableland.
• New England Grassy Woodlands (Grassy Woodlands Formation). Occurs in north-eastern NSW above 600m elevation. Dominated by Angophora floribunda, E. blakelyi, E. bridgesiana, E. caliginosa, E. laevopinea, E. melliodora, E. youmanii.
• Southern Tablelands Grassy Woodlands (Grassy Woodlands Formation). Occur on the southern tablelands above 600m, from Bathurst to the Victorian highlands. Common tree species include E. blakelyi, E. bridgesiana, E. goniocalyx, E. macorhyncha, E. melliodora, E. nortonii.
• Subalpine Woodlands (Grassy Woodlands Formation). Occur at elevations 1000 to 1800 m. Dominated by E. pauciflora.
• Western Slopes Grassy Woodlands (Grassy Woodlands Formation). Also known as the Grassy White Box woodlands occurring along the western slopes of the Great Dividing Range. E. albens dominant with Brachychiton populneus, Callitris glaucophylla, E. blakelyi, E. melliodora, and E. melanophloia and E. pillagaensis in the north.
• Floodplain Transition Woodlands (Grassy Woodlands Formation). This occurs as a band along the arid/semi arid zones on the western slopes and plains. E. microcarpa throughout with E. melliodora (southern and central regions) and E. conica, E. pillagaensis, Casuarina cristata in the north.
30
Stem Densities Grassy box woodlands in drier coastal valleys, tablelands and western slopes 30 large trees per ha (Benson and Redpath 1999) Western Slopes Grassy Woodlands (Keith 2004). 30-40 mature trees per ha – one crown width spacing (Prober and Brown 1994, quoted in McIntyre 2002)
2.3.7 Grey Box (Eucalyptus microcarpa) This species is widespread on the western slopes and plains of south-eastern Australia (Victoria, New South Wales and southern Queensland) and occurs in several vegetation communities (Brooker and Kleinig 1999). In some areas Grey Box communities provide important grazing lands and like Poplar Box communities they have been subject to thinning trials aimed at improving grass production. Keith Vegetation Classes Grey Box occurs in the following Keith (2004) Vegetation classes:
• Floodplain Transition Woodlands (Grassy Woodlands Formation). This occurs as a band along the arid/semi arid zones on the western slopes and plains. E. microcarpa throughout with E. melliodora (southern and central regions) and E. conica, E. pillagaensis, Casuarina cristata in the north.
• Pilliga Outwash Dry Sclerophyll Forests (Dry Sclerophyll Forest Formation) Callitris glaucophylla with E. albens, E. chloroclada, E. conica, E. microcarpa, E. pilligaensis, Allocasuarina leumannii and Casuarina cristata. On elevated sites E. crebra, E. dealbata, E. melanophloia, E. nubila, E. populnea, E. sideroxylon.
Stem Densities Floodplain Transition Woodlands (Keith 2004).
Tall Woodland formation of E. woollsiana (microcarpa) to 21 metres (70 ft), commonly closely packed with branches interlacing (>40 trees/ha). Callitris glaucophylla where present is usually a lower layer tree (Beadle 1948).
South-east Queensland
>400 trees per ha. At this density there was low grass production. All trees (mostly 46-65 cm dbh) except saplings, were then poisoned (Robertson and Young 1996).
Euroa, Victoria Linear strips of woodland along roads and reserves dominated by Grey Box (E. microcarpa) with an understorey of Golden Wattle (Acacia pycnantha) over a grassy or herbaceous ground cover. Presence of small and medium trees reflected a mixed aged structure in the absence of grazing by stock (van der Ree and Bennett 2001). See also Table 2.2.
Large Eucalypt trees >70 cm dbh: 7-36 (mean 20) stems/ha; linear sites 0-70 stems/ha; these trees estimated to be >200 years old (growth rate 3.5 mm/a) and pre-date pastoral settlement by at least 40 years.
Eucalypt Trees 30-70 cm dbh: 18-111 stems/ha; linear sites 0-270 stems/ha.
31

Small Eucalypt trees 11-30 cms dbh: 17-517 stems/ha; linear sites 0-550 stems/ha.
Eucalypt Saplings: 0-860 stems/ha; linear sites 0-553 stems/ha; density highly variable but absent where reserve had been grazed regularly and abundant elsewhere.
Other roadside sites in northern Victorian plains:
14 stems / ha large trees. Large Box-Ironbark forests with a logging history:
2 stems/ha >60 cm dbh.
Table 2.2: The size class distribution of Eucalyptus stems in remnant woodland along roadsides and unused road reserves near Euroa, northeast Victoria. Local Scale: 21.8 km of continuous roadside divided into 436 segments; landscape scale: 42 plots each 1 ha in size (van der Ree and Bennett 2001). 2.3.8 Poplar Box (Eucalyptus populnea) This species is widespread on the western plains of NSW, extending across the inland plains from the gentle western slopes to west of the Darling River. In the drier parts of this range it is most frequently found on the soils that are likely to be waterlogged, including reddish loams and black cracking clays. It is these areas where dense regrowth is most likely to occur. It is also common in southern and eastern Queensland (Hall et al. 1975, Brooker and Kleinig 1999). The distribution of this species covers some 150,000 km2 in New South Wales and Queensland (Harrington 1979). Two sub-species of this eucalypt have been described with E. populnea bimbil having narrower leaves and occurring in the NSW portion of the species distribution and E. p. populnea more common in Queensland. However, there is considerable overlap in the distribution of the two subspecies and frequent occurrence of intermediates suggesting that the subspecific separation may not be warranted (Brooker et al. 2002). The Poplar Box lands are prime grazing lands and their management has focussed on the need to maximise herbage production. This has required reducing the production of trees and woody shrubs to increase the herbaceous layer under them (Adamson and Fox 1982). Tree felling and thinning have been utilised to reduce the Poplar Box density below 2-6 trees per hectare. Densities above this are considered to prevent
32

maximum herbage production (Noble 1997). Large areas have been cleared but regeneration can be rapid (Harrington 1979). Wilson et al. (2002) have calculated that in Queensland less than 40% of the pre-clearing extent of the E. populnea and E. melanophloia broad vegetation group occurring in the Brigalow Belt and South-east Queensland bioregions remains. This was also one of the five most cleared broad vegetation types in the Brigalow Belt, Mulga Lands and Desert Uplands bioregions between 1997 and 1999 in Queensland. Vegetation Classes Poplar Box occurs in ten Keith (2004) Vegetation classes and is the dominant species in Brigalow Clay Plain Woodlands, North-west Alluvial Sand Woodlands and Western Peneplain Woodlands. In a detailed analysis Beetson et al. (1980) defined seven vegetation communities with Poplar Box as a dominant species depending on the presence or absence of grasses and shrubs, other eucalypts, Acacia species and Callitris and provided an indication the density of trees typical of most of these communities. The vegetation communities are only briefly described by Beetson et al. (1980) but they highlight the substantial floristic and structural variation present in Poplar Box communities (see Appendix 1). Keith (2004) classes with Poplar Box:
• Floodplain Transition woodlands (Grassy Woodlands Formation). E. microcarpa (dominant throughout), with E. melliodora (south), E conica, E. pilligaensis, Casuarina cristata (north), and E. populnea, Acacia homalophylla, Allocasuarina luemannii, Callitris glaucophylla, Casuarina pauper, and Brachychiton populneus more common in the drier parts of the range.
• Pilliga Outwash Dry Sclerophyll Forests (Dry Sclerophyll Forest Formation). Dominated by Callitris glaucophylla with E. albens, E. chloroclada, E. conica, E. microcarpa, E. pilligaensis, Allocasuarina leumannii and Casuarina cristata. On elevated sites E. crebra, E. dealbata, E. melanophloia, E. nubila, E. populnea, E. sideroxylon.
• North-west Floodplain Woodlands (Semi-arid Woodlands). Eucalyptus coolabah, E. largiflorens dominant with Casuarina cristata and C. pauper. E. populnea occurs in this community on upper floodplains and drier depressions. Shrubs include some which can be small trees (Acacia stenophylla, Alectryon oleifolius, Atalaya hemiglauca) and saltbush.
• Brigalow Clay Plain Woodlands (Semi-arid Woodlands). Acacia harpophylla, Casuarina cristata and Eucalyptus populnea common throughout. Also Acacia aneura and Flindersia maculosa in the western community and E. pillagaensis in the eastern community. Other shrub species include Apophyllum anomalum, Dodonaea viscosa, Eremophila mitchellii and Geijera parviflora.
• North-west Alluvial Sand Woodlands (Semi-arid Woodlands). Canopy species include Eucalyptus populnea, Allocasuarina luehmannii, Corymbia tessellaris, C. dolichocarpa and Callitris glaucophylla. Shrubby understorey can include Acacia salicina, Alstonia constricta, Atalaya hemiglauca, Eremophila mitchellii, Geijera parviflora and Petalostigma pubescens.
• Riverine Sandhill Woodlands (Semi-arid Woodlands). E. populnea is occasionally present in the northern occurrence of this community with the
33

dominant species Brachychiton populneus and Callitris glaucophylla. A diverse tall shrub layer is frequently present.
• Inland Rocky Hill Woodlands (Semi-arid Woodland Formation). Callitris glaucophylla, E. dwyeri, E. intertexta, E. vicina, E. viridis. E. populnea occurs with this community on the lower slopes in the west.
• Subtropical Semi-arid Woodlands (Semi-arid Woodland Formation). E. melanophloia (dominant), Brachychiton populneus, E. populnea and Callitris glaucophylla. Shrubs include Acacia aneura, A. excelsa, A. murrayana, Atalaya hemiglauca, Eremophila mitchelli, Geijera parviflora.
• Western Peneplain Woodlands (Semi-arid Woodland Formation). E. populnea dominant with E. intertexta on drier stonier soils and Callitris glaucophylla on light textures soils. Brachychiton populneus, E. conica, E. melliodora, E. microcarpa also occur in the east. Tall shrubs include Acacia excelsa, A. homalophylla, Alectryon oleifolius, Allocasuarina leuhmanii, Atalaya hemiglauca, Capparis mitchellii, Casuarina pauper, Eremophila mitchellii.
• Desert Woodlands (Semi-arid Woodland Formation). Eucalyptus populnea and Corymbia tumescens with Atalaya hemiglauca, Dodonaea viscosa, Grevillea striata, Hakea ivoryi and Senna artemisioides.
Stem Densities Most of the stem densities included here are from Beetson et al. (1980). They are a measure of the tree density at the time of the field assessment rather than an evaluation of densities likely to have occurred prior to grazing and the implementation of European land management practices. The vegetation descriptions given by Beetson et al. (1980) have been assigned to possible equivalent Keith (2004) vegetation class. The appropriate Keith (2004) class was not always clearly evident so more than one has been listed and others indicated by a question mark. Floodplain Transition woodlands (Keith 2004)
E. populnea with grassy lower layer: In Qld and NSW the most common structural types are woodland and open woodland. Tree density averaged 100/ha in Qld and 50/ha in NSW (Beetson et al. 1980).
North-west Alluvial Sand Woodlands, North-west Floodplain Woodlands (Keith 2004)
E. populnea with shrubs: Qld 170 trees/ha over Eremophila mitchellii; in NSW structural form varies from open forest, open woodland, and woodland – tree density average 109/ha - composition of shrub layer variable (Beetson et al. 1980).
Floodplain Transition woodlands, Pilliga Outwash Dry Sclerophyll Forests, Western Peneplain Woodlands (Keith 2004) E. populnea / E. woollsiana (microcarpa): woodland to open forest 3-180 trees/ha, variable shrub layer, occurs from Tamworth / Cobar to Griffith (Beetson et al. 1980).
Western Peneplain Woodlands (Keith 2004) E. populnea with Acacia aneura (A): SW Qld and NW NSW. In NSW this is mainly a low woodland with some open forest and low open forest - average
34

density of 150 trees/ha, E. intertexta and Callitris glaucophylla also sometimes present. Shrubs frequent. (Beetson et al. 1980). E. populnea with E. intertexta, western plains of NSW: average tree density 45/ha + shrub layer (Beetson et al. 1980). E. populnea 10-15 m in height with a mean density of 36 trees/ha and a canopy cover of about 15%; shrubs 4,800/ha (Johns 1981, Harrington and Johns 1990).
Subtropical Semi-arid Woodlands (?), North-west Plain Shrublands (?)(Keith 2004) E. populnea with Acacia aneura (B): Average tree density 108/ha in NSW (Beetson et al. 1980). This community does not appear to equate closely with the Keith Vegetation classes. E. populifolia (populnea) – Acacia shrub woodland: crowns rarely touch, density and height of eucalypts decreases from east to west with a corresponding increase in the density of tall shrubs (Beadle 1948).
Floodplain Transition woodlands (Keith 2004) E. populnea with Casuarina cristata: open woodland with 20 trees/ha (Beetson et al. 1980). E. populofolia (populnea) – Callitris glauca with E. woollsiana (microcarpa) and E. intertexta to the west. Canopy interrupted, tree crowns separated by a distance greater than the crown (20-30 / ha). Occasionally box and pine grow closely together. Trees to 12 m in height (Beadle 1948).
North-west Floodplain Woodlands, Semi-arid Sandplain Woodlands (Keith 2004) Casuarina cristata and Heterodendrum oleifolium (Alectryon oleifolius): at the western limit of E. populnea - average density 30/ha. E. populnea usually confined to drainage lines (Beetson et al. 1980).
Western Peneplain Woodlands, Subtropical Semi-arid Woodlands, Riverine Sandhill Woodlands, North-west Alluvial Sand Woodlands (Keith 2004) Callitris glaucophylla dominant with E. populnea: open forest, low open forest, woodland and open woodland - average density 100 trees/ha (Beetson et al. 1980). E. populnea and Callitris glaucophylla: density extremely variable from 1 to 780/ha (Beetson et al. 1980).
Brigalow Clay Plain Woodlands (Keith 2004) Acacia harpophylla – E. populnea: Dominated by Brigalow, average tree density of 530/ha; communities with the 2 species co-dominant are woodlands with some open woodlands 270 trees/ha (Beetson et al. 1980). Casuarina cristata – with Acacia harpophylla and E. populnea: average tree density in NSW 50/ha (Beetson et al. 1980).
Tallwood, Southern Qld Vegetation described as Poplar Box shrub woodlands.
200-500 trees/ha in intact stands (Tunstall 1981, Tunstall and Walker 1975)
35
2.3.9 Brigalow (Acacia harpophylla) At the time of European settlement Brigalow communities occupied about 6.5 million hectares south from Charters Towers into northern NSW. Over the past 100 years Brigalow has been extensively cleared. The dynamics of Brigalow and adjoining communities have changed with Brigalow increasing in density in mixed Brigalow-grassland mosaics and in Poplar Box and Silver-leaved Ironbark woodlands but it has died out in stands invaded by softwood scrub or semi-evergreen vine thicket (Johnson 1997). The most detailed assessment has been carried out with long term monitoring of plots at the Brigalow Research Station in Theodore, Queensland. There 182 20x20m plots, originally classified as Silver-leaved Ironbark were surveyed in the 1960’s and 18 plots remeasured in 1990. Keith Vegetation Class Stem density data are all from Queensland in areas where regrowth rates after pulling and burning have been assessed. In NSW Brigalow is classified by Keith (2004) as:
• Brigalow Clay Plain Woodlands (Semi-arid Woodlands). Acacia harpophylla, Casuarina cristata and Eucalyptus populnea common throughout. Also Acacia aneura and Flindersia maculosa in the western community and E. pillagaensis in the eastern community. Other shrub species include Apophyllum anomalum, Dodonaea viscosa, Eremophila mitchellii and Geijera parviflora.
Stem Densities Western NSW Acacia harpophylla Association – crowns touch and interlace, can reach 5 m (Beadle
1948). Southern Queensland Plot 140: 1968 density A. harpophylla 275/ha + E. melanophloia 125/ha
1990 density A. harpophylla 1125/ha + E. melanophloia 100/ha Plot 150: 1968 density A. harpophylla 0/ha + E. melanophloia 50/ha
1990 density A. harpophylla 550/ha + E. melanophloia 50/ha In an area of Brigalow regrowth following pulling and burning
28000 Brigalow suckers/ha 9 months after burning; After 30 years the population had halved and grown to 7 metres in height,
including a significant loss of stems between 27 and 32 years (drought conditions + competition);
4000-6000 stems/ha including 2500-3000 trees >2.5 cm dbh and canopy heights of 12-15m in mature stands similar to those at the time of clearing.
(Johnson 1997) Near Tallwood, Qld:
310-325 trees per ha in ‘intact’ Brigalow (Tunstall and Walker 1975).
2.3.10 Coolibah (Eucalyptus coolabah) and Black Box (Eucalyptus largiflorens) Black Box is typically a species of the low lying areas subject to periodic but irregular inundations, mostly growing at a higher elevation than the River Red Gum in inland NSW. On flat poorly drained areas with heavy clay soils, Black Box may occur in
36

almost pure stands, particularly in the southern arid and semi-arid parts of NSW. In the middle of its range it frequently occurs as a mixed stand with Coolibah but Coolibah becomes dominant in the north of NSW (Hall et al. 1975, Brooker and Kleinig 1999, Brooker et al. 2002). Coolibah is a widespread species occurring across the continent on seasonally flooded, heavy soil plains. In NSW it occurs along the Darling Barwon River system, north from Menindee and into the north-west region (Brooker et al. 2002). The Coolibah – Black Box woodland of the northern riverine plains in NSW is an ecological community occurring on grey, self-mulching clays of the periodically waterlogged floodplains, swamp margins, ephemeral wetlands of stream levees. The structure of the community varies from tall riparian woodlands to the more common very open ‘savannah like’ grassy woodlands with a midstorey of shrubs and saplings (NSW Scientific Committee final determination). This community has been listed as an endangered ecological community under the Threatened Species Conservation Act (1995). Between 1997 and 1999 riparian woodlands, mostly dominated by E. coolabah, in the Brigalow Belt bioregion in Queensland was one of the five most cleared broad vegetation groups (Wilson et al. 2002). Keith (2004) Vegetation Classes
• Inland Riverine Forests (Forested Wetlands Formation). Dominated by E. camaldulensis, occasionally with E. largiflorens, E melliodora or E. microcarpa. Acacia salicina and A. stenophylla occur as emergent small trees.
• Inland Floodplain Woodlands (Semi-arid Woodlands). E. largiflorens usually in pure stands or with E. coolabah in the north, E. camaldulensis in frequently flooded sites, E. microcarpa in eastern areas, E. melliodora in the south-east. Saltbush and lignum understorey with A. salicina and A. stenophylla as emergent trees closer to rivers.
• North-west Floodplain Woodlands (Forested Wetlands Formation). Eucalyptus coolabah, E. largiflorens with Casuarina cristata and C. pauper. E. camaldulensis occurs in association with drainage channels, E. populnea on upper floodplains and drier depressions and E. ochrophloia on the Paroo floodplain. Shrubs include some which can be small trees (Acacia stenophylla, Alectryon oleifolius, Atalaya hemiglauca) and saltbush.
The density and natural thinning process of these two species of eucalypt has been determined by Maher (1995). In the portion of the landscape occupied by these species, floods are the exception but are also the driving force behind the ecological process. The frequency, duration and timing of the flood events determine the vegetation that grows on the floodplains. Coolibah is entirely dependant on flooding for germination while flooding enhances Black Box germination. Given that germination events are infrequent, establishment is rare and this provides an opportunity to determine the age classes of trees on the floodplain. Maher (1995) has determined that there were four establishment opportunities in the last 105 years: pre-1890, 1890, 1955-56 and 1983. These germination events can produce dense regrowth and natural thinning occurs during periods of stress. Dense regrowth of these species is an issue mainly on the Nidgery, Wombeira, and Eurie landsystems.
37

Stem Densities Inland Floodplain Woodlands (Keith 2004). Coolibah densities (Maher 1995):
1890 flood: 84 stems/ha in addition to 60 River Cooba per ha, 40% of the Coolibah contained hollows, Birrie River floodplain
Floods in the 1950’s: 128 stems/ha, Birrie River floodplain; 320 stems/ha, Culgoa River floodplain (Four sites, average of 192)
1970’s floods: 1913 live stems/ha + 975 standing dead stems, Culgoa River floodplain.
Typical Savannah Woodland with canopy interrupted tree crowns being separated by a distance equal to or slightly greater than the diameter of the crown 10-14 m high (Beadle 1948).
Black Box densities (Beadle 1948).
Trees widely separated by a distance equal to or slightly less than the diameter of the canopy or massed into narrow belts separated by a small area of treeless country.
Based on the flood method of aging the cohorts of Coolibah and Black Box, Maher (1995) has determined a natural thinning curve for these communities (Figure 2.5). After 40 years, 94% of established trees have died and less than 3% survive 100 years (97% mortality). This leaves an average density of about two old trees per hectare, with higher densities along watercourses. Figure 2.5: Natural Thinning Curve illustrating the natural attrition rate of one cohort
of Coolibah (from Maher 1995).
38

Inland Riverine Forests (Keith 2004) E. largiflorens regeneration densities (>5 cm in height to 20 cm dbh) (Margules Report 1990)
Deniliquin to Wakool Junction: 203 saplings/ha; From Wakool Junction to the confluence with the Darling River: 331
saplings/ha From the Darling confluence to Loxton: 39 saplings/ha.
2.3.11 River Red Gum (Eucalyptus camaldulensis) The River Red Gum is the most widely distributed of all eucalypts and is common in the rivers, creeks and valleys in south-eastern Australia. It is most frequently found along rivers and plains but it can also extend onto hill slopes. It occupies the lowest land adjacent to both permanent and intermittent streams (Hall et al. 1975, Brooker and Kleinig 1999, Brooker et al. 2002). Along parts of the Murray River, such as Barmah -Millewa, Gulpa Island and Moira State Forests, River Red Gum forests are almost monospecific on the flooded areas. Grass plains are also scattered through these forests and historically these were large open areas fringed by Red Gum (Bren 1992). Occasional sandhills vegetated with White Cypress Pine occur and on the drier margins Red Gum is replaced by Black Box or Grey Box (Donovan 1997). Most of the literature regarding the River Red Gum forests discusses the density of the stands in descriptive terms rather than stems per hectare. For example:
‘When the first settlers came to the district the bulk of the River Red Gum forests were more of an open woodland than today’s relatively dense forest, strongly suggesting the effects of frequent burning. … Many of these forests were leased, and ringbarking of trees for pasture improvement was encouraged by way of Improvement Lease conditions. With the cessation of Aboriginal burning, extensive regeneration began to dominate much of this lower flood country and led to a drastic change in the structure of the forests. The year 1911 is identified as the origin of extensive regeneration over the area, although, it is probable that the occurrence of the regeneration was spread over a decade or so about this time.’ (Forestry Commission 1986).
This lack of stem density data may be due to the highly variable nature of these forests, from a narrow band along banks of watercourses, sometimes in a double or single row to extensive areas of woodlands or scattered trees and tall forests along the major rivers of the Murray system (Bren 1992). The River Red Gum forests along the Murray River occur in an area with an annual average rainfall of about 400mm and depend on water from the river for their survival. They often have a density similar to forests sustained by a 1200mm annual rainfall (Bren 1990). Changes to the riverine environment have impacted significantly on the River Red Gum forests in NSW. In particular, the continued growth of intensively irrigated agriculture has resulted in the increased demands for regulation of river flows and dramatic changes in water quality and this has led to a decline in some River Red Gum communities or encroachment of seedlings into other areas such as Moira grasslands (Helman and Estella 1983 quoted by Denny 1992, Bren 1992). River Red Gum communities may not have been as extensively cleared for agriculture as other communities because of their flood prone location. However, there has been
39

significant clearing as a result of timber harvesting and earthworks for flood control (Wilson 1989). The silvicultural approach to extraction of River Red Gums began in about the 1890’s along the Murray River and from 1926 in the Murrumbidgee management area. This involved ringbarking or removal of ‘over-mature’ trees and thinning of the often dense stands of regrowth for ‘stand improvement’, on the basis of a theoretical ‘sustained yield’ (Wilson 1989). Thinning was considered necessary because extensive regrowth had occurred in the forests due to successive wet years, regular flooding and on areas that had previously been heavily logged. Cessation of traditional Aboriginal burning practices is also considered to have been a factor in the promotion of successful regrowth (Donovan 1997). Dense regeneration of River Red Gum can occur when there is an appropriate flooding regime to enable germination to occur. Floods in 1870 brought the first extensive regeneration over logged areas and many of the trees there in 1990 were thought to date from that regeneration event (Bren 1990). With river regulation some areas are remaining flooded for longer while other areas are not being flooded and regeneration has not occurred. In the Barmah Forest Red Gum seedlings are encroaching onto the Moira Grass plains and the changed flooding regime as a result of water regulation is cited as the cause for this increase in distribution and density (Bren 1992). Changed flooding patterns caused by the Marebone Weir on the Macquarie River downstream from Narromine is assumed to have enabled the growth of a dense Red Gum forest where it had previously not occurred (pers. obs.). Keith Vegetation Classes Vegetation classes containing River Red Gum are:
• Inland Riverine Forests (Forested Wetlands Formation). Dominated by E. camaldulensis, occasionally with E. largiflorens, E melliodora or E. microcarpa. Acacia salicina and A. stenophylla occur as emergent small trees.
• Inland Floodplain Woodlands (Semi-arid Woodlands). E. largiflorens usually in pure stands or with E. camaldulensis in frequently flooded sites. Saltbush and lignum understorey with A. salicina and A. stenophylla as emergent trees closer to rivers.
• North-west Floodplain Woodlands (Forested Wetlands Formation). Eucalyptus coolabah, E. largiflorens dominant with Casuarina cristata and C. pauper. E. camaldulensis occurs in association with drainage channels. Shrubs include some which can be small trees (Acacia stenophylla, Alectryon oleifolius, Atalaya hemiglauca) and saltbush.
• North-west Alluvial Sand Woodlands (Semi-arid Woodlands). E. camaldulensis occurs but is not common with the dominant canopy species: Eucalyptus populnea, Allocasuarina luehmannii, Corymbia tessellaris, C. dolichocarpa and Callitris glaucophylla.
Stem Densities Inland Riverine Forests (Keith 2004) From below the Hume Dam to Loxton (Margules Report 1990).
Regeneration densities ( >5 cm in height to 20 cm dbh) ranged from 185 saplings per ha (between Yarrawonga and Tocumwal) to 957 per ha (in the Millewa – Barmah forests).
Within the 21 Red Gum vegetation communities the eucalypt regeneration varied from 950/ha to 28/ha
40

Murrumbidgee management area (Forestry Commission of NSW 1986): Trees > 80 cm dbh: >10/ha to 1/ha
Barmah-Millewa forest: Density classification used by Bren (1992) when assessing the encroachment
by red gums onto Moira grass plains: Dense – well stocked forest with small gaps between trees; Scattered – < 5 trees / ha; Occasional – < 1 / ha.
Red Gums increased from an area of about 20% dense forest in 1945 to 37% in 1985 (Bren 1992).
Some densities are indicated in the following extract from a letter by the Inspecting Forester, Mr Manton in 1895: “I estimate that there are two matured red gum trees to the acre [5/ha] fit for saw-mill purposes; trees full of growth, but valueless by reason of their being hollow, spongy and winding growth, at about 8 to the acre [20/ha]; young vigorous and healthy trees, varying from 16 in. [40 cm] to 20 in. [50 cm] in diameter, may be reckoned at 7 to the acre [17.5/ha]; while on large areas there is a dense growth of young trees numbering in places over 2,000 to the acre [5000/ha].” “Had the forests been left in their unassisted state, where there are now fifty to sixty such trees to the acre [125 to 150 / ha] there would probably not have been more than five or six [12.5 or 15 / ha].” Where there was one young tree in 1875, when I took charge of the forest reserves, there are now twenty, and all that is required to make these reserves almost practically inexhaustible is the inexpensive work of thinning.” [This suggests a 20 fold increase in tree density] (Quoted in Donovan 1997).
2.3.12 Mulga Mulga (Acacia aneura) is a widely distributed species, especially across the north-west corner of NSW. The Mulga vegetation associations are highly variable ranging from open-forests on deep loamy soils near Charleville to a scattered shrub (2-3m) in a tall open shrubland (Neldner 1986). Keith Vegetation Classes Keith (2004) classes containing Mulga are:
• Sub-tropical Semi-arid Woodlands (Semi-arid Woodlands). E. melanophloia woodland with Brachychiton populneus, Callitris glaucophylla, E. populnea in the overstorey and A. aneura as one of many shrubs in the understorey.
• North-west Plain Shrublands (Arid Shrublands). A. aneura, with A. excelsa, A. homalophylla, A. victoriae, Apophyllum anomalum, Atalaya hemiglauca, Dodonaea viscose, Eremophila sturtii, E. mitchellii, Flindersia maculosa, Geijera parviflora, Grevillea striata, Hakea leucoptera, Myoporum platycarpum, Pittosporum phylliraeoides, Senna artemisioides as the dominant shrub species with occasional emergent Acacia excelsa or Callitris glaucophylla as emergents. Flat to undulating plains.
• Gibber Transition Shrublands (Arid Shrublands). Acacia dominated shrublands and woodlands of variable density to 10m tall. Upper layer of tall shrubs dominated by A. aneura, A. cambagei, Alectryon oleifolius,
41

Apophyllum anomalum, Atalaya hemiglauca, Casuarina pauper, Eremophila mitchellii, Flindersia maculosa, Grevillea striata.
• Stony Desert Mulga Shrublands (Arid Shrublands). Occurs on the stony downs, ranges and gibber plains. Many shrub species but with Acacia aneura prominent.
• Sandplain Mulga Shrublands (Arid Shrublands). Tall sparse shrublands with an open cover of small shrubs and perennial tussock grasses. Tall shrub layer dominanted by A. aneura with A. ligulata, A. victoriae.
Stem Densities Sandplain Mulga Shrublands (Keith 2004)
Before the introduction of stock A. aneura, Hakea leucoptera, Callitris glauca, Alectryon oleifolius and Flindersia maculosa 3 to 7m high, formed a dense and almost impenetrable scrub, broken only by the treeless claypans (Beadle 1948).
Stony Desert Mulga Shrublands (Keith 2004)
‘Dense scrub of Mulga very similar in appearance to the stabilised dunes’ (Beadle 1948).
Loamy Red Earths Charleville
1200 stems/ha (up to 8000), projected foliage cover 30-40%, 10-15 m high (Neldner1986). >350 shrubs/ha low shrub layer, eastern Mulga lands (Neldner1986).
2.3.13 Rosewood-Belah-Pine Scrub Keith Vegetation Class In this community each species commonly occurs in a pure stand depending on soil type. This vegetation association is classified by Keith (2004) as:
• Semi-arid Sandplain Woodlands (Semi-arid Woodlands). Dominated by Casuarina pauper with Alectryon oleifolius frequently occurring.
Stem Densities Density varies considerably from timberless areas to being so dense that the herbaceous stratum is completely suppressed. High densities are increased by suckering from exposed roots (Beadle 1948). 2.3.13 Mallee Mallee woodlands occur on the dunes and sandplains of south-western NSW. The overstorey varies little between whipstick (2-5m tall) and bull (5-10m tall) mallee but the understorey is more variable (Bradstock and Cohn 2002). Keith Vegetation Communities
• Dune Mallee Woodlands (Semi-arid Woodlands). Mallee species include E. costata, E. dumosa, and E. socialis. E. leptophylla and E. gracilis occur less commonly as does Callitris verrucosa.
• Sand Plain Mallee Woodlands (Semi-arid Woodlands). Mallee species E. dumosa, E. gracilis, E. oleosa, and E. socialis.
42
Stem Densities Sand Plain Mallee Woodlands Keith 2004) E. oleosa – E. dumosa: Invariably a dense community (Beadle 1948). Variation in density and mallee species present between four sites (Fox 1990):
630 stems / ha (2 stems / plant) – E. gracilis, E. oleosa, E. dumosa; Balranald. 1510 stems / ha (5.8 stems / plant) – E. socialis; Mungo. 1030 stems / ha (2.1 stems / plant) – E. dumosa, E. gracilis; Pulletop.
E. incrassata (extreme south-west NSW, Victoria and SA) (Wellington 1989). 100,000 seedlings / ha after post fire germination; 10,000 juveniles / ha;
<10000 adults / ha. 1,000 / ha / year germination without fire; <10000 adults / ha.
Melaleuca uncinata (Broombush) understorey (Woinarski 1989) Woody plant species /quadrat – 2.5 (depauperate) to 10.3 (floristically rich).
2.3.15 Northern Tablelands Estimated from an interpretation of descriptions by John Oxley when he first travelled across the tablelands. Oxley travelled from the west, passed over the Moonbi Range and crossed the southern part of the tablelands on their way to the coast. Descriptions mostly refer to stringybark trees (Northern Tablelands Draft RVMP 2002). Stem densities
20-25 large mature trees per ha. 2.3.16 Coastal Forests and Woodlands In his description of the vegetation of the Penrith 1: 100,000 map sheet Benson (1992) has included the Turpentine-Ironbark Forests, Cumberland Plain Woodlands (Spotted Gum Forest, Shale/Gravel Transition Forest, Grey Box Woodland, Grey Box-Ironbark Woodland), Castlereagh Woodlands (Shale/gravel Transition Forest, Castlereagh Ironbark Forest, Castlereagh Scribbly Gum Woodland, Agnes Banks Woodland, Swamp Woodland), River-flat Forests (Camden White Gum Forest, River-flat Forest), Sandstone Heaths and Woodlands (Sydney Sandstone Gully Forest, Sydney Sandstone Ridgetop Woodland), Lower Blue Mountains Heath), Estuarine complex. He has collected stem densities for five plant communities from 50x20m plots. For each of these Benson (1992) gives a mean and standard error for each species as well as the percentage of the total density As part of a land use study of Sclerophyll open-forest on the NSW south-coast Austin (1978) obtained stem density counts for three communities. Keith vegetation classes The probable Keith (2004) vegetation classes for these plant associations are described below:
• Hunter - Macleay Dry Sclerophyll Forest. (Dry Sclerophyll Forest Formation). Corymbia maculata, E. crebra, E. moluccana, E. propinqua, E. siderophloia, Syncarpia glomulifera.
• Cumberland Dry Sclerophyll Forest (Dry Sclerophyll Forest Formation). E. fibrosa common throughout with Melaleuca decora in the sub-canopy. E. crebra, E. longifolia, E. eugenioides may also be common.
43

• Coastal Valley Grassy woodlands (Grassy Woodlands Formation). Angophora floribunda, E. tereticornis, Corymbia maculata, E. crebra, E. eugenioides, E. mollucana.
• Sydney Sand Flats Dry Sclerophyll Forest (Dry Sclerophyll Forest Formation). E. parramattensis, Angophora bakeri, E. sclerophylla. Melaleuca decora on damper soils with a higher clay content and sometimes E. fibrosa.
• Southern Hinterland Dry Sclerophyll Forests (Dry Sclerophyll Forest Formation). E. angophoroides, E. bosistoana, E. cypellocarpa, E. globoidea, E. maidenii, E. polyanthemos.
• South East Dry Sclerophyll Forest (Dry Sclerophyll Forest Formation). E. agglomerata, E. globoidea, E. seiberi
• Sydney Hinterland Dry Sclerophyll Forest (Dry Sclerophyll Forest Formation). Angophora bakeri, Corymbia exima, C. gummifera, E. beyeriana, E. consideniana, E. punctata, E. sclerophylla, E. sparsifolia on ridges, exposed slopes and plateaux. In sheltered gullies Angophora costata, E. agglomerata, E. deanei, E. pilularis and Syncarpia glomulifera.
Stem Densities Hunter - Macleay Dry Sclerophyll Forest (Keith 2004) E. maculata - E. moluccana open forest (Benson 1991).
E. maculata: 225 +/- 97 (43%) E. mollucana: 69 +/- 42 (13%) E. fibrosa: 42 +/- 27 (8%) Total: 516 +/- 135
Cumberland Dry Sclerophyll Forest (Keith 2004) E. fibrosa open forest(Benson 1991).
Melaleuca decora: 470 +/- 183 (69%) E. fibrosa: 145 +/- 31 (21%) Total: 679 +/- 184
Coastal Valley Grassy Woodlands (Keith 2004) E. moluccana – E. tereticornis woodland (Benson 1991).
E. moluccana: 113 +/- 21 (30%) E. tereticornis: 125 +/- 29 (33%) E. eugenioides: 13 +/- 7 (3%) Melaleuca decora: 53 +/- 27 (14%) Total: 378
Castlereagh Scribbly Gum Woodland (Benson 1991). Angophora bakeri: 496 +/- 139 (82%) E. sclerophylla: 38 +/- 17 (6%)
Bega Valley Forest Red Gum, box and Spotted Gum in valleys, stringybarks and woollybut on slopes (Lunney and Leary 1988).
Early descriptions: ‘undulating forest lightly timbered’, ‘thickly timbered’, ‘very scrubby’, ‘open forest’. Timber abundant throughout. Wattles were harvested for their bark and the Director General of forests in 1891 said ‘portions of the country carry 200-400 trees/acre [500-1000 trees / ha].’ It was not indicated whether this included only wattles or all trees.
44
Sydney Sand Flats Dry Sclerophyll Forest (Keith 2004) Eucalyptus parramattensis low woodland (Benson 1991).
E. parramattensis: 166 +/- 74 (44%) Melaleuca decora: 83 +/- 71 (22%). E. sclerophylla: 75 +/- 43 (20%) Total: 375 +/- 80
Southern Hinterland Dry Sclerophyll Forests (Keith 2004) (??). E. cypellocarpa – E. muellerana community (Austin (1978):
1960 stems / ha most in dbh classes <20 and 20-40 cm dbh (all species). South East Dry Sclerophyll Forest (Keith 2004) E. agglomerata – E. seiberi Community (Austin 1978):
3360 stems / ha most in dbh classes <20 and 20-40 cm dbh (all species). E. muellerana – E. seiberi Community (Austin 1978):
3020 stems / ha most in dbh classes <20 and 20-40 cm dbh (all species). Sydney Hinterland Dry Sclerophyll Forest (Keith 2004) Grey Gum (E. punctata) dominant or co-dominant in sites near Nowra. A range of forest ages from about 1 year regrowth to 150 years + were included in the sites (Goldingay and Eyre 2004). Dominant tree species (>50cm dbh) in the study area (total stem count converted to stems / ha):
Corymbia gummifera (7232), Eucalyptus punctata (4800), Syncarpia glomulifera (3400), E. agglomerata (2208), E. eugenioides (1832), and C. maculata (1808), Angophora floribunda (872), E. paniculate (808), E. pilulatis (736), E. globoidea (664), E. sclerophyla (465), E. sparsifolia (376), E. robusta (200), E. pilularis hybrid (192), E. piperata (184), E. longifolia (160), E. fibrosa (136), E. scias (120), E. crebra (40), C. maculata hybrid (32), E. imitans (24), E. eximia (16) and E. saligna (16).
All shrubs greater than 1m in height (included a total of 14 species of acacia): Average of 180 stems / ha per site (range 0-1134).
Other common shrubs: Hakea spp (0-975 s/ha), Kunzea ambigua (0-816 s/ha), Macrozamia communis (0-530 s/ha), Banksia spinulosa (0-424 s/ha), Persoonia spp (0-403 s/ha), Lambertia formosa (0-289 s/ha), Allocasuarina littoralis (0-289 s/ha) and Leptospermum spp (0-196 s/ha).
2.3.17 Wet Sclerophyll Forests Tallowwood, Blue Gum and Brush Box from Buladelah to southern Queensland. (King 1985). In a study of hollow bearing trees in forestry sites near Eden dominated by Messmate, Brown Barrel and Mountain Grey Gum logged sites were compared with unlogged sites. A downward trend in the number and diameter of trees retained on logged sites was predicted (Lindenmeyer and Gibbons 2004).
45
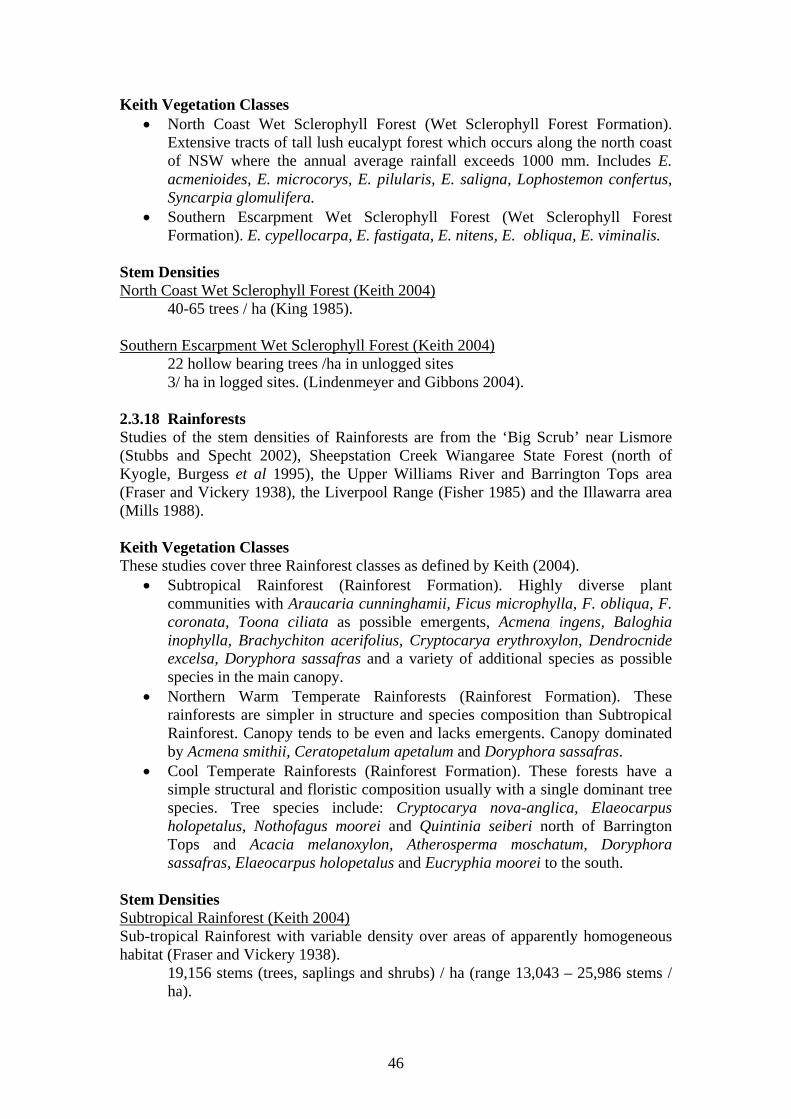
Keith Vegetation Classes • North Coast Wet Sclerophyll Forest (Wet Sclerophyll Forest Formation).
Extensive tracts of tall lush eucalypt forest which occurs along the north coast of NSW where the annual average rainfall exceeds 1000 mm. Includes E. acmenioides, E. microcorys, E. pilularis, E. saligna, Lophostemon confertus, Syncarpia glomulifera.
• Southern Escarpment Wet Sclerophyll Forest (Wet Sclerophyll Forest Formation). E. cypellocarpa, E. fastigata, E. nitens, E. obliqua, E. viminalis.
Stem Densities North Coast Wet Sclerophyll Forest (Keith 2004)
40-65 trees / ha (King 1985). Southern Escarpment Wet Sclerophyll Forest (Keith 2004)
22 hollow bearing trees /ha in unlogged sites 3/ ha in logged sites. (Lindenmeyer and Gibbons 2004).
2.3.18 Rainforests Studies of the stem densities of Rainforests are from the ‘Big Scrub’ near Lismore (Stubbs and Specht 2002), Sheepstation Creek Wiangaree State Forest (north of Kyogle, Burgess et al 1995), the Upper Williams River and Barrington Tops area (Fraser and Vickery 1938), the Liverpool Range (Fisher 1985) and the Illawarra area (Mills 1988). Keith Vegetation Classes These studies cover three Rainforest classes as defined by Keith (2004).
• Subtropical Rainforest (Rainforest Formation). Highly diverse plant communities with Araucaria cunninghamii, Ficus microphylla, F. obliqua, F. coronata, Toona ciliata as possible emergents, Acmena ingens, Baloghia inophylla, Brachychiton acerifolius, Cryptocarya erythroxylon, Dendrocnide excelsa, Doryphora sassafras and a variety of additional species as possible species in the main canopy.
• Northern Warm Temperate Rainforests (Rainforest Formation). These rainforests are simpler in structure and species composition than Subtropical Rainforest. Canopy tends to be even and lacks emergents. Canopy dominated by Acmena smithii, Ceratopetalum apetalum and Doryphora sassafras.
• Cool Temperate Rainforests (Rainforest Formation). These forests have a simple structural and floristic composition usually with a single dominant tree species. Tree species include: Cryptocarya nova-anglica, Elaeocarpus holopetalus, Nothofagus moorei and Quintinia seiberi north of Barrington Tops and Acacia melanoxylon, Atherosperma moschatum, Doryphora sassafras, Elaeocarpus holopetalus and Eucryphia moorei to the south.
Stem Densities Subtropical Rainforest (Keith 2004) Sub-tropical Rainforest with variable density over areas of apparently homogeneous habitat (Fraser and Vickery 1938).
19,156 stems (trees, saplings and shrubs) / ha (range 13,043 – 25,986 stems / ha).
46

Sub-tropical Rainforest of the Booyang (Heritiera spp) type but with isolated areas of Cool Temperate Rainforest dominated by Nothofagus moorei on higher ridges and sheltered gullies (Burgess et al. 1975).
284 stems >20 cm dbh / ha (range 227 – 363 / ha). Stem proportions of the nine most common tree species (>20 cm dbh): 22.2
(Acama paniculate), 11.9 (Heritiera spp), 9.6 (Geissois benthamii), 7.8 (Doryphora sassafras), 7.7 (Sloanea woollsii), 4.8 (Cinnamomum oliveri), 3.8 (Orites excelsa), 3.4 (Planchonella australe)
The ‘Big Scrub’ sub-tropical rainforest: density at early settlement was estimated from historical portion surveys and compared with modern forests (Stubbs and Specht 2002).
Historical densities: 123.8 trees / ha, >30-40 cm dbh mean, range 32-248 trees / ha (see Appendix 1).
Tree densities from extant rainforest plots, for three size classes are given in Table 2.4 (from Stubbs and Specht 2002).
Table 2.4: Tree densities from rainforest plots (Stubbs and Specht 2002)
Mills (1988) reconstructed the pre-European extent of sub-tropical rainforests in the Illawarra Region. Three types of sub-tropical rainforest are described for this area: Complex Notophyll Vine Forest below the escarpment and above the escarpment Mixed Notophyll Vine-Fern Forest and Simple Notophyll Vine-Fern Forest. Density of the Rainforest above the escarpment near the Wingecarribee Swamp described in 1830 by surveyor Robert Hoddle (Quoted in Mills 1988):
“Having crossed the Wingecarribee Swamp, and ascertained the most southern part of it, I commenced to encounter the most formidable brush I have ever met with, for so great a distance since I have been in the colony. It abounded with every species of Prickly bush, brambles and nettles. The Native Vines were so thickly entwined around the trees, as to render the sun obscure at the time it shone with great brilliance.”
47
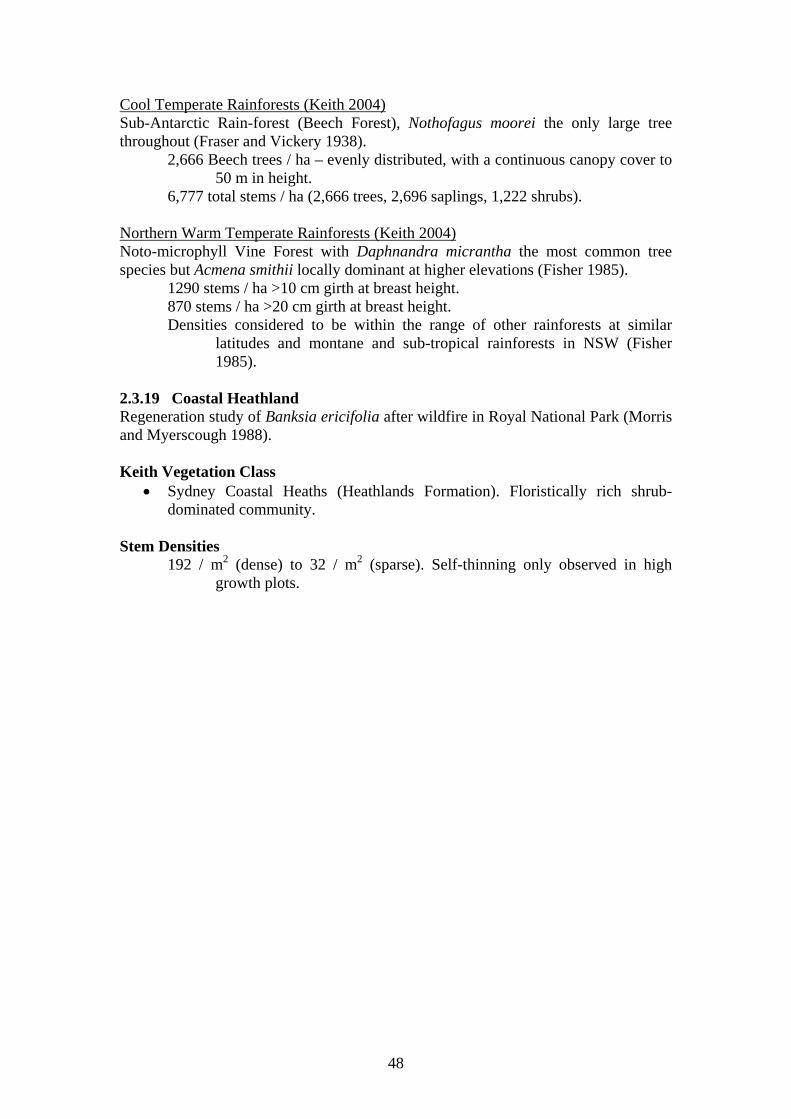
Cool Temperate Rainforests (Keith 2004) Sub-Antarctic Rain-forest (Beech Forest), Nothofagus moorei the only large tree throughout (Fraser and Vickery 1938).
2,666 Beech trees / ha – evenly distributed, with a continuous canopy cover to 50 m in height.
6,777 total stems / ha (2,666 trees, 2,696 saplings, 1,222 shrubs). Northern Warm Temperate Rainforests (Keith 2004) Noto-microphyll Vine Forest with Daphnandra micrantha the most common tree species but Acmena smithii locally dominant at higher elevations (Fisher 1985).
1290 stems / ha >10 cm girth at breast height. 870 stems / ha >20 cm girth at breast height. Densities considered to be within the range of other rainforests at similar
latitudes and montane and sub-tropical rainforests in NSW (Fisher 1985).
2.3.19 Coastal Heathland Regeneration study of Banksia ericifolia after wildfire in Royal National Park (Morris and Myerscough 1988). Keith Vegetation Class
• Sydney Coastal Heaths (Heathlands Formation). Floristically rich shrub-dominated community.
Stem Densities
192 / m2 (dense) to 32 / m2 (sparse). Self-thinning only observed in high growth plots.
48
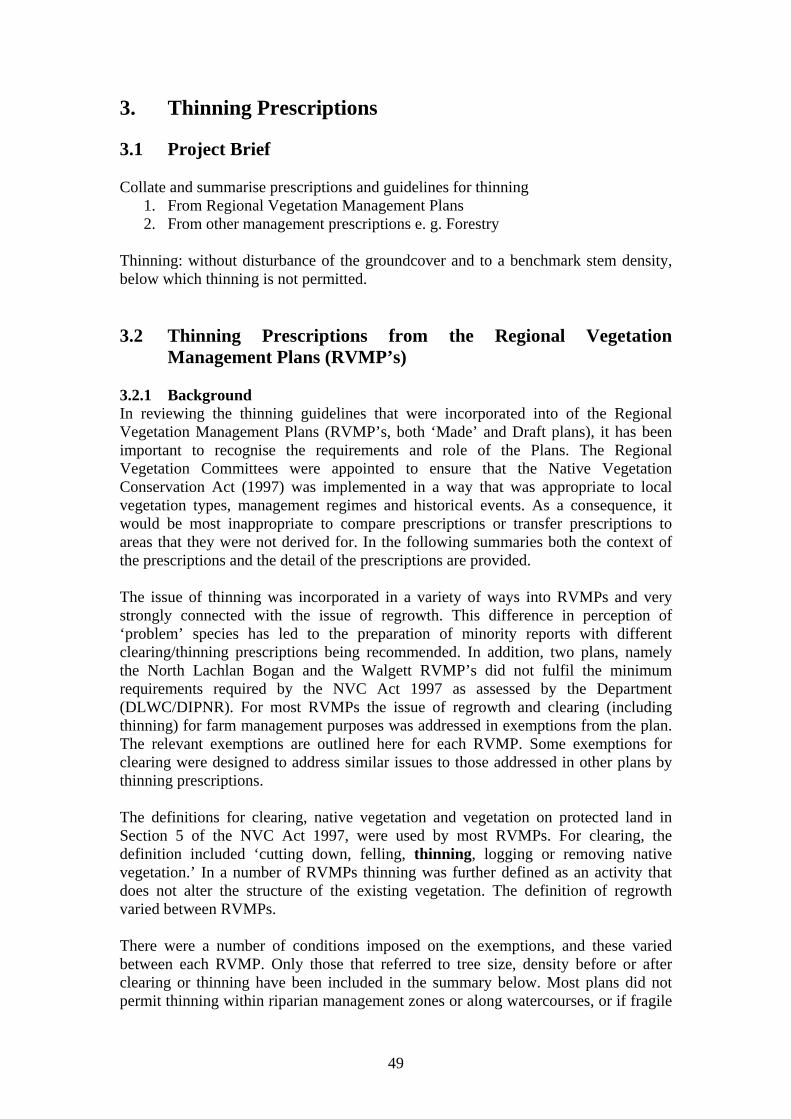
3. Thinning Prescriptions 3.1 Project Brief Collate and summarise prescriptions and guidelines for thinning
1. From Regional Vegetation Management Plans 2. From other management prescriptions e. g. Forestry
Thinning: without disturbance of the groundcover and to a benchmark stem density, below which thinning is not permitted. 3.2 Thinning Prescriptions from the Regional Vegetation
Management Plans (RVMP’s) 3.2.1 Background In reviewing the thinning guidelines that were incorporated into of the Regional Vegetation Management Plans (RVMP’s, both ‘Made’ and Draft plans), it has been important to recognise the requirements and role of the Plans. The Regional Vegetation Committees were appointed to ensure that the Native Vegetation Conservation Act (1997) was implemented in a way that was appropriate to local vegetation types, management regimes and historical events. As a consequence, it would be most inappropriate to compare prescriptions or transfer prescriptions to areas that they were not derived for. In the following summaries both the context of the prescriptions and the detail of the prescriptions are provided. The issue of thinning was incorporated in a variety of ways into RVMPs and very strongly connected with the issue of regrowth. This difference in perception of ‘problem’ species has led to the preparation of minority reports with different clearing/thinning prescriptions being recommended. In addition, two plans, namely the North Lachlan Bogan and the Walgett RVMP’s did not fulfil the minimum requirements required by the NVC Act 1997 as assessed by the Department (DLWC/DIPNR). For most RVMPs the issue of regrowth and clearing (including thinning) for farm management purposes was addressed in exemptions from the plan. The relevant exemptions are outlined here for each RVMP. Some exemptions for clearing were designed to address similar issues to those addressed in other plans by thinning prescriptions. The definitions for clearing, native vegetation and vegetation on protected land in Section 5 of the NVC Act 1997, were used by most RVMPs. For clearing, the definition included ‘cutting down, felling, thinning, logging or removing native vegetation.’ In a number of RVMPs thinning was further defined as an activity that does not alter the structure of the existing vegetation. The definition of regrowth varied between RVMPs. There were a number of conditions imposed on the exemptions, and these varied between each RVMP. Only those that referred to tree size, density before or after clearing or thinning have been included in the summary below. Most plans did not permit thinning within riparian management zones or along watercourses, or if fragile
49

soils, threatened species, significant communities, corridors or Aboriginal cultural heritage were to be affected. The exemptions were also designated for specific ‘management zones’ within the RVMP. These also varied between the plans. Under the NVC Act 1997 the clearing of regrowth less than 10 years old was exempt from regulation. Beneficial conservation management was frequently referred to in RVMP’s and defined as management which maintains or enhances the conservation values of the site. This could have included such elements as appropriate thinning, burning or weed removal. 3.2.2 Mid-Lachlan RVMP The Mid Lachlan RVMP covered the Local Government Areas of Bland, Forbes, Lachlan (south of the River), Parkes and Weddin. The issue of thinning in the Mid-Lachlan RVMP was included to address two issues:
1. Management of native vegetation regrowth, and 2. Sustainable management for forestry production
In addition, thinning of regrowth was suggested as a management tool for controlling erosion, as the more open canopy would encourage growth of a better groundcover, and to enhance biodiversity. Stem densities were not used to define communities requiring thinning but rather, a percentage canopy cover is specified. Concerns about the density of tree and shrub regrowth on lands formerly occupied by open box, kurrajong and pine woodlands in this area emerged as early as the 1870’s. This regrowth was generally associated with landscapes supporting Bimble Box (Eucalyptus populnea) / White Cypress (Callitris glaucophylla) and / or Black Cypress (C. endlicheri) communities. Clearing River Red Gum Regrowth This exemption applied to Riparian, Wetland and Floodplain protection areas such as:
• River Red Gum regrowth since the last flood event affecting the land and that were not more than 10 years old at the time of clearing; or
• River Red Gums not more than 15 years old at the time of clearing occurring in natural or derived grassland or an area that had been previously cleared.
• River Red Gums < 15 years old at the time of clearing within an area of native vegetation in which the canopy provided by the crowns covers more than 10% of the area.
At least 20% of the total canopy cover of River Red Gums was to be retained in the designated area and sufficient River Red Gums retained to provide at least 20% canopy cover of the total area when mature. The exemption required the development of a full farm plan with the area to be thinned fully delineated and the thinning was to be carried out with minimal disturbance to soil, groundcover, understorey and any other native species. The exemption had two purposes:
1. To allow clearing of River Red Gum regrowth from the most recent flood event and recognising the need to continue current agricultural practices, and
2. To allow the thinning of regrowth less than 15 years old in a way that balanced the need to ensure adequate recruitment of the species in riparian corridors and other areas subject to periodic inundation.
50

Clearing Cypress Pine Regrowth The intent of this exemption was to allow for the management of ‘invasive’ White and Black Cypress Pine but only in landscape management areas, riparian, wetland and floodplain protection areas and in priority plant communities and habitat areas. It was recognised that these pines are an important floristic component of many of the plant communities of the region and dense thickets of cypress regrowth are also a natural part of the landscape. It also suggested there was a need to intervene to balance the recruitment of the species, prevent large areas from becoming dense ‘growth-locked’ stands, maintain groundcover and other species to enhance habitat values and reduce soil erosion and weed invasion. Dense regrowth is habitat and refuge for the threatened and regionally significant Gilberts Whistler (Pachycephala inornata). Cypress pines could be cleared:
• if the DBH was less than 30 cms; • the trees occurred in grasslands or an area that had previously been cleared for
agricultural purposes or areas where the cover of native tree species comprised less than 10%. In these areas a minimum of 5 pines at least 2 metres tall per hectare had to be retained;
• in an area of native vegetation with a canopy cover of more than 10% of the area. At least 25% of the area to be thinned had to be retained and be representative of the structure and density of the existing vegetation and at least 50 cypress pines retained per hectare of the remaining 75% of the area.
Because pine regrowth can form dense ‘locked’ thickets, there was no age limit imposed for thinning of these stands. On the other hand, Cypress Pines with a dbh 30cms or more, the ‘old greys’, are rare and must be retained. Thinning for Grazing Purposes For this a minimum standard for thinning in self-assessment areas for grazing were specified. These were:
• all trees with a dbh greater than 25cms had to be retained; • all native vegetation that is representative of a significant community had to be
retained; • if the existing crown cover of the vegetation is greater than 85%, the thinned
crown cover must be no less than 85%; • if the existing crown cover is 35% to 70%, the thinned crown cover must be
no less than 35%; • if the existing crown cover is 15% to 30%, the thinned crown cover must be
no less than 15%; • if the existing crown cover is 5% to 10%, the thinned crown cover must be no
less than 5%; • any community with a crown cover les than 5%, thinning was not allowed.
These limits were designed to ensure that the structure of the vegetation was not significantly altered by the thinning. Habitat trees All mature hollow bearing trees (dead and alive) were to be retained at a density of about 10/ha as well as an additional 7 recruitment trees. In the ‘Vegetation Guide 4.4: Mature Habitat Trees and Nest Hollows’ this requirement was further specified:
51

‘The first step in managing hollow-dependent wildlife is therefore to retain all mature hollow-bearing trees, whether alive or dead. Depending on the density of the patch of vegetation, retain 3-10 hollow-bearing trees, with around 30 hollows of various sizes per hectare.’
Definition: a large development meant the thinning of more than 400 ha of land in a 10 year period for grazing purposes that involved the thinning of some or all of the native vegetation on that land. 3.2.3 Lower Macquarie - Castlereagh Draft RVMP Thinning was considered at length by the Lower Macquarie - Castlereagh Regional Vegetation Committee for the Regional Vegetation Plan. The most significant species in the area covered by this vegetation plan (the Local Government Areas of Narromine, Dubbo, Warren, Gilgandra and Coonamble) were frequent occurrences of dense regrowth of cypress pine and smaller areas of ‘excessive’ regeneration of riparian vegetation including River Red Gum (E. camaldulensis) (e.g. property ‘Nellievale’ on the Macquarie River). Applications for thinning represented 4% of all applications to DIPNR for clearing in the Lower Macquarie Castlereagh area. In the Clearing Controls developed for the LM-C Draft RVMP (Part 3 p11) it was stated that beneficial management may include thinning provided:
• It could be a valuable management tool for enhancing productivity and biodiversity
• Each application was judged on its merits • It did not result in landuse change • The thinning operation maintained or enhanced ecological values • It did not reduce the area / extent of the vegetation • That when thinning for economic benefit, the operation had to offer
enhancement in production and ideally a diverse range of productive uses. In the LM-C Draft RVMP Advisory Manual (p22) it was stated that:
‘In many parts of the region it makes environmental and economic sense to remove regrowth from previously cleared land when it reaches a certain point in its maturity. This may not necessarily be every 10 years as it may be associated with longer paddock rotations. The point at which you manage tree and / or shrub regrowth becomes the management regime most appropriate to your property. When recording your regrowth management practices you must stipulate on your Property Sketch Plan at what point you traditionally manage regrowth on cropping or grazing paddocks. This can be described in terms of either:
Years Stand height Regrowth density, or Production impact.’
In this plan, thinning was exempted from the provisions of the plan for some species of trees, to improve the overall health of the remaining vegetation. Exemptions were not allowable for trees greater than 35cm dbh. The exemption was for:
‘The thinning of native vegetation but only if: - The vegetation was Callitris glaucophylla or Callitris endlicheri
52

- Any other species in an area no more than 10 hectares in any one year, and
- Carried out in accordance with the thinning exemption guideline in the LM-C RVMP Regulatory Manual.’
The exemption was developed to allow for thinning of both C. glaucophylla and C. endlicheri in large and small areas, and the thinning of other species within a maximum area of 10 ha. This was designed to allow for the maintenance of an ecologically diverse landscape while also allowing landholders to thin to increase grazing productivity. The following conditions were specified for thinning (LM-C RVMP Draft Regulatory
Manual p 31): • Thinning of all trees to be at a 6 x 6m spacing from the centre of the trunk (no
single trunk to be more than 6m from the next but may be less than 6m); • No tree over 10 cm dbh to be thinned; • Thinning will be carried out using hand tools only e.g. chainsaw, brushcutter; • Thinning should not reduce the spatial extent of the vegetation being thinned; • In any 10 ha area no species can be eliminated.
3.2.4 Richmond Draft RVMP The provisions in this Draft RVMP were defined for the Local Government Regions of Lismore, Kyogle, Ballina and Richmond Valley. It is important to note two significant issues in relation to the prescriptions included in this draft RVMP:
1. In addition to the final draft report produced by the Richmond Regional Vegetation Committee, there were two dissenting reports – one from the Nature Conservation Council and the Ecological Society of Ausralia representatives on the committee and the other from the Rural Interests and Local Government members.
2. The draft plan as produced was not designed around the definition of vegetation communities but rather protection of listed threatened species and ecological communities and definitions of the structure of the vegetation community, specifically successional stage – senescing forest, mature forest, young forest and recently disturbed forest. Further definitions applied depending on the level of disturbance that had occurred in the forest. Vegetation communities were briefly described but not extensively used in the plan.
In general terms, the vegetation of the region was described as having the highest level of biodiversity in the state with more than 75 distinct forest ecosystems. These were divided into seven broad groups: Closed Forest (with five sub-groups), Tall Open Forest (Lophostemon and Eucalyptus), Woodland and Open Forest (Eucalyptus and Angophora), Closed Grassland, Open Forest and Woodland (Paperbark), Heath (Banksia, Acacia etc) and Low Closed Forest (Mangrove). These exemptions from the Richmond draft RVMP were for clearing not thinning but were designed to address similar issues to those addressed in other plans by thinning prescriptions. This plan used the same definition for clearing, native vegetation and vegetation on protected land as that used by the NVC Act 1997 which includes ‘cutting down, felling, thinning, logging or removing native vegetation.’
53

Exemption 2: Regrowth This allowed for clearing of regrowth native vegetation (less than 10 years old) in essentially cleared land or allowed for sustainable grazing. It was not for use in non-grazed forests or to change the landuse and was applicable to all land in the plan.
Exemption 3: Minimal Clearing of regrowth (less than 10 years old) in forested land in the vicinity of existing permanent structures. This exemption was to allow clearing of regrowth around structures where the regrowth exemption could not be used (e.g. forested land). It applied to all land except old growth forests, rainforest, mangrove and wetlands.
Exemption 5: Selective Tree Harvesting This was to enable landholders to harvest timber by tree cutting on their property for any purpose (including low impact native forestry). The definition required the cutting of no more than 10 live trees per hectare (within a 56m radius) on a contiguous landholding over a 10 year period. It should be dispersed, not concentrated in place and time, was undertaken if there was sufficient (undefined term) tree density, stump left in the ground, was less than the defined maximum number for the property and avoids visible habitat hollows. Conditions were applied to the use of this exemption, including the retention of two healthy trees of the same species and smaller diameter (>50%) and one healthy tree of the same species and a greater diameter for each tree removed or 1 removed = 2 of greater diameter retained; maximum of 3 trees per ha per year; land stability and water quality to be protected. The NCC and ESA representatives dissented from this exemption and instead required:
• No trees over 80 cm dbh to be removed • No more than 6 trees per ha of forested land (55m radius) to be felled
for the life of the plan • A maximum of 3 trees per hectare in the size class 40 cm dbh to 80 cm
dbh to be felled over the life of the plan - 2 healthy trees of the same species and greater dbh to be retained within each hectare for each tree removed
• A maximum of 50 trees to be felled per contiguous land holding in any one year.
Exemption 12: Private Native Forestry The intent of this exemption was to allow low intensity selective harvesting and silvicultural management of native forests where these activities were undertaken in accordance with the code of practice (that had not been developed). Not to be applied to Category 1 land.
The regrowth exemption in the draft RVMP was not accepted in the dissenting report by the NCC and ESA members as it could be applied within rainforests, old growth forests, wetlands, buffers around rock outcrops and caves, cultural heritage sites, aboriginal places and riparian protected lands. It also did not allow for an assessment of the use of the regrowth by threatened species. They also believe that the definition of ‘cleared land’ required a more precise definition.
54
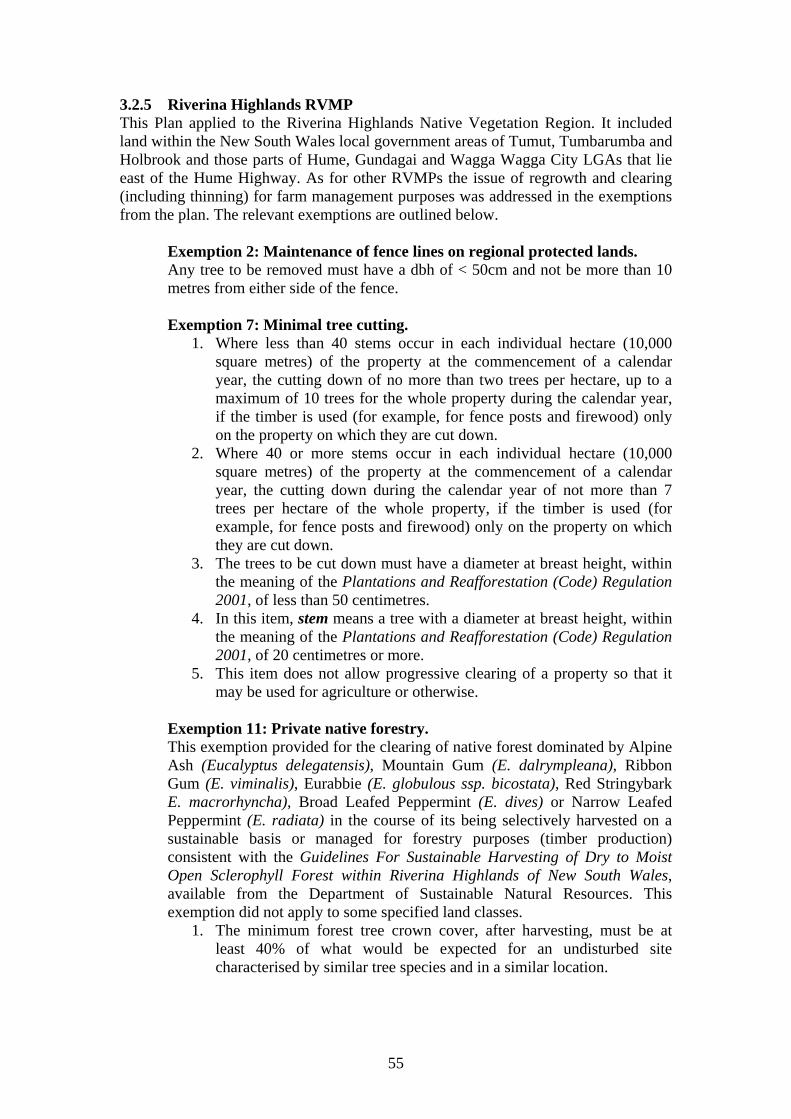
3.2.5 Riverina Highlands RVMP This Plan applied to the Riverina Highlands Native Vegetation Region. It included land within the New South Wales local government areas of Tumut, Tumbarumba and Holbrook and those parts of Hume, Gundagai and Wagga Wagga City LGAs that lie east of the Hume Highway. As for other RVMPs the issue of regrowth and clearing (including thinning) for farm management purposes was addressed in the exemptions from the plan. The relevant exemptions are outlined below.
Exemption 2: Maintenance of fence lines on regional protected lands. Any tree to be removed must have a dbh of < 50cm and not be more than 10 metres from either side of the fence. Exemption 7: Minimal tree cutting.
1. Where less than 40 stems occur in each individual hectare (10,000 square metres) of the property at the commencement of a calendar year, the cutting down of no more than two trees per hectare, up to a maximum of 10 trees for the whole property during the calendar year, if the timber is used (for example, for fence posts and firewood) only on the property on which they are cut down.
2. Where 40 or more stems occur in each individual hectare (10,000 square metres) of the property at the commencement of a calendar year, the cutting down during the calendar year of not more than 7 trees per hectare of the whole property, if the timber is used (for example, for fence posts and firewood) only on the property on which they are cut down.
3. The trees to be cut down must have a diameter at breast height, within the meaning of the Plantations and Reafforestation (Code) Regulation 2001, of less than 50 centimetres.
4. In this item, stem means a tree with a diameter at breast height, within the meaning of the Plantations and Reafforestation (Code) Regulation 2001, of 20 centimetres or more.
5. This item does not allow progressive clearing of a property so that it may be used for agriculture or otherwise.
Exemption 11: Private native forestry. This exemption provided for the clearing of native forest dominated by Alpine Ash (Eucalyptus delegatensis), Mountain Gum (E. dalrympleana), Ribbon Gum (E. viminalis), Eurabbie (E. globulous ssp. bicostata), Red Stringybark E. macrorhyncha), Broad Leafed Peppermint (E. dives) or Narrow Leafed Peppermint (E. radiata) in the course of its being selectively harvested on a sustainable basis or managed for forestry purposes (timber production) consistent with the Guidelines For Sustainable Harvesting of Dry to Moist Open Sclerophyll Forest within Riverina Highlands of New South Wales, available from the Department of Sustainable Natural Resources. This exemption did not apply to some specified land classes.
1. The minimum forest tree crown cover, after harvesting, must be at least 40% of what would be expected for an undisturbed site characterised by similar tree species and in a similar location.
55

2. The volume harvested must not exceed the equivalent of an average of 3 cubic metres per hectare per annum over a period of 20 years or more.
3. This activity may be carried out without consent only if the Department of Sustainable Natural Resources has been given notice of the proposed clearing prior to the commencement of clearing.
4. Where the volume harvested will be more than 500 cubic metres of product in total on any contiguous landholding in any one year period, this activity may be carried out without consent only if a forestry management plan documenting forest management practices and harvesting operations has been prepared. If a forestry management plan is required for any clearing but is not produced at the request of the Director-General of the Department of Sustainable Natural Resources, this item does not allow the clearing until after it is produced.
It was also required that more than 50% of trees with a dbh >40cm be retained (clumping with gaps up to 40 m allowable), all trees >1 metre dbh in moist open forest (Manna Gum, Peppermint and Mountain Gum) and all trees >75 cm dbh in dry open forest (Red Stringybark, Red Box and Broad-leaved Peppermint), a minimum of 5 habitat trees and 5 recruitment trees per hectare or, if these are not present, retain the largest 10 trees per hectare must be retained. The same age structure and species mix and native groundcover must be retained. Exemption 13: Regrowth removal The intent of this exemption is stated in the plan as: ‘There is not enough regrowth in the region to warrant a large impact on threatened species because of the level of grazing management.’ Other factors important to consider when analysing the impacts of this exemption include:
• the Minimal Tree Clearing (2ha) exemption was not adopted in this plan; • the requirement for advice to the DIPNR for removal of more than 0.5 ha did not differentiate between single paddock trees and larger patches; • in a regional context this exemption would not significantly impact on the quality and quantity of native vegetation in the region; • changes to grazing management to be encouraged to foster regeneration. This exemption would not adversely impact on this process. Restrictions on the removal of trees/patches from previously cleared areas which are impacting on economic returns would discourage these changes and reinforce the practices of rotating sheep grazing to stop regeneration. • trees less than 20cm dbhob still have a way to go to be significant habitat resources (i.e. form hollows and to flower significantly).
The exemption allowed for the removal of vegetation, whether seedlings or regrowth, less than 10 years old and less than 10 cm dbh. Only 2 hectares per year to be removed from regional protected lands and if more than 0.5 hectares
56

of seedlings or regrowth of Yellow Box, Blakely’s Red Gum, and/or White Box per year was to be removed, notice must be given to the local DIPNR office.
3.2.6 Western Riverina Draft RVMP This plan applied to all land within the Western Riverina Region, including the local government areas of Berrigan, Carrathool, Conargo, Deniliquin, Griffith, Hay, Jerilderie, Leeton, Murray, Murrumbidgee and Wakool. Nineteen vegetation communities have been defined for this area. In this plan, the definition of thinning was ‘to reduce the density of plant species, to enhance the ecological values of the site’ and regrowth specifically referred to native vegetation that had regrown after clearing Clearing paddock trees ‘Paddock tree’ meant any native tree in a paddock (except Black Box and River Red Gum), where the tree density was equal to or less than 10 trees per hectare. Tree density in this plan was measured by the hectare, on a 100 metre by 100 metre grid, with the tree or trees located in the centre of the grid.
• Generally, the clearing of paddock trees, particularly those trees with a diameter at breast height over bark (dbhob) of 90 centimetres or more, was inappropriate and would not be permitted, unless the landholder could demonstrate how the removal of the tree would meet or satisfy the aims and matters for consideration within this plan and the targets within the Advisory Manual.
• An area based offset planting ratio of 400:1 was to be required within any development consent granted for the removal of paddock trees with a dbhob of 90 centimetres or more.
• An area based offset planting ratio of 10:1 was to be required for the clearing of all other paddock trees. For the purpose of calculating the offset planting area, the area of each existing paddock tree was to be assessed as 0.02 hectares.
• In determining a development application to clear paddock trees, the consent authority could refer to the guidelines for the removal, replanting and establishment of paddock trees, contained within the Advisory Manual.
River Red Gum private native forests Development consent was required for the harvesting of River Red Gum, where the tree density was more than 40 trees per hectare (100x100m), and more than 5% of the trees were to be cleared. Where the tree density was more than 40 trees per hectare, but 5% or less of the trees were proposed for clearing, the provisions of the River Red Gum clearing exemption were to apply. There were clearing exemptions for the minimal clearing of River Red Gum, Black Box and Cypress Pine. Exemption: Minimal Tree Clearing - River Red Gum (Eucalyptus
camaldulensis) and Black Box (Eucalyptus largiflorens) This exemption could apply in areas:
57

• with a density greater than 40 trees per hectare, 5% of the trees with a dbh <50cm may be cleared each year, excluding those with visible hollows or cracks in the bark more then 5cms wide;
• with a density between 10 and 40 trees per hectare, 2 trees with a dbh <50cm may be cleared each year excluding those with visible hollows or cracks in the bark more then 5cms wide;
• if the tree density was <10 per hectare, no clearing except for maintenance of rural structures.
Black Box and River Red Gum seedlings up to 10cm dbh in specified uncultivated areas could be cleared in association with an approved property vegetation plan to continue with traditional grazing practices Exemption: Minimal Tree Clearing – Cypress Pine (Callitris, glaucophylla, C.
endlicheri; C. gracilis). This exemption could apply in areas:
• with a tree density >40/ha, 5% trees with a dbh < 30cms may be cleared; • with a tree density between 15 and 40 trees / ha, 2 trees / ha with a dbh <
30cms may be cleared per year; • with a tree density <15/ha, consent is required for clearing.
Notification for use of this exemption was required. Clearing of regrowth in cultivated areas could occur in areas where native vegetation had regrown after a clearing event within the preceding 15 years. 3.2.7 Brewarrina Draft RVMP The Brewarrina RVMP Region covered the Shire of Brewarrina in north-western NSW. It bordered Queensland in the north and was bounded by the Narran River and Marra Creek to the east. The southern tip of the Region extended from Marra Creek to east of Byrock and the western boundary adjoined Bourke Shire. Thinning exemptions were developed for Coolibah (Eucalyptus coolabah), Black Box (E. largiflorens), Poplar Box (E. populnea), Mulga (Acacia aneura) and Black Wattle (A. stenophylla). Thinning of Coolibah (Eucalyptus coolabah) and Black Box (Eucalyptus largiflorens)
Standard conditions: • No more than 500 hectares to be thinned in any single notification. • No more than 30% of the area of each individual pre-clearing
Coolibah/Other and Black Box/Coolibah vegetation communities on any property to be thinned.
• Thinning methods were required to be selective to individual trees. • All dead trees to be left standing. • Only Coolibah and Black Box species could be killed under this
exemption. • All trees larger than 30cm diameter at breast height to be retained. • All trees with visible hollows to be retained.
58

• The number of trees of Coolibah and/or Black Box retained after thinning could not be less than 20 trees per hectare with a minimum of 5 trees of each age class per hectare.
• Trees retained must be scattered across the landscape. Thinning of Mulga (Acacia aneura) This exemption applies to pre-clearing Mulga, Poplar Box/Pine, Red Box/Poplar Box/Mulga and Poplar Box/Ironwood vegetation communities as mapped on the Pre-Clearing Vegetation Community Map and described in the Vegetation Community Descriptions of the draft plan and vegetation communities where more than 75% of trees present are mulga.
Standard conditions: • No more than 500 hectares could be thinned in any single notification. • No more than 30% of the area of each individual pre-clearing Mulga,
Poplar Box/Pine, Red Box/Poplar Box/Mulga and Poplar Box/ Ironwood vegetation communities existing on any property could be thinned.
• Any clearing under this exemption must target Mulga and clearing of other species must be kept to the minimal extent necessary.
• All trees larger than 20cm diameter at breast height to be retained. • The number of Mulga trees retained after thinning could not be less
than 20 trees per hectare with a minimum of 5 trees of each age class per hectare.
• Trees retained to be scattered across the landscape. • Thinning debris must be left scattered across the landscape.
Thinning of Poplar Box (Eucalyptus populnea) This exemption applied to pre-clearing Poplar Box / Belah, Poplar Box / Coolibah, Poplar Box / Gidgee, Poplar Box / Ironwood, Poplar Box / Mulga / Pine, Poplar Box / Pine / Other, Poplar Box / Silver-Leaf Ironbark, Red Box / Poplar Box / Mulga as mapped on the Pre-Clearing Vegetation Community Map and described in the Vegetation Community Descriptions in this draft RVMP.
Standard conditions • No more than 500 hectares to be thinned on a property. • No more than 30% of the area of each individual pre-clearing Poplar
Box/ Belah, Poplar Box/ Coolibah, Poplar Box/ Gidgee, Poplar Box/ Ironwood, Poplar Box/Mulga/ Pine, Poplar Box/ Pine/ Other, Poplar/ Silver-Leaf Ironbark, Red Box/ Poplar Box/ Mulga vegetation communities on any property could be thinned and no more than 10% of the vegetation community across the Region.
• Thinning methods were to be selective to individual trees. • All dead trees were to be left standing. • Only Poplar Box species could be killed under this exemption. • All trees larger than 30cm diameter at breast height to be retained. • All trees with visible hollows to be retained.
59

• The number of trees of Poplar Box retained after thinning could not be less than 20 trees per hectare with a minimum of 5 trees of each age class per hectare.
• Trees retained to be scattered across the landscape. Thinning of Black Wattle (Acacia stenophylla) This exemption applied to pre-clearing Coolibah, Other Grassland and Lignum vegetation communities as mapped on the Pre-Clearing Vegetation Community Map and described in the Vegetation Community Descriptions in this draft plan.
Standard conditions: • No more than 500 hectares to be thinned in any single notification. • No more than 30% of the area of each individual pre-clearing
Coolibah/ Other, Grassland and Lignum vegetation communities on any property could be thinned.
• Only Black Wattle species could be killed under this exemption. • All trees larger than 20cm diameter at breast height to be retained. • The number trees of Black Wattle retained after thinning could not be
less than 20 trees per hectare. A minimum of 5 trees of each age class to be retained.
Invasive Scrub Woody weed proliferation was another vegetation management issue in these areas. The most common woody weed is Budda (Eremophia mitchellii) however thick turpentine (E. sturtii) is found mainly west of the Culgoa River and in the south of the Region. There is also Narrow-leaf Hopbush (Dodonaea attenuata) and Broad-leaf Hopbush (D. viscosa) west of the Culgoa and Bogan Rivers. Although not listed as a woody weed under the NVC Act, dense Gidgee regrowth is a management issue in the north-western part of the Region. 3.2.8 Clarence Draft RVMP The Plan applied to all land within the New South Wales local government areas of Pristine Waters (formerly Ulmarra and Nymboida), Maclean, Grafton and Copmanhurst. Exemption: Tree cutting This allowed for the cutting of no more than 10 trees on any one hectare of a contiguous land holding in the same ownership in any period of five years, to enable land owners to harvest timber on their property using tree cutting. The cutting to be:
• dispersed rather than concentrated, in terms of both the location of the clearing and the time when it was done,
• was only undertaken where there existed a sufficient density of trees to withstand the tree cutting, without adverse effect on the environmental values of the existing vegetation,
• left the stump in the ground, so that the cutting was a means of harvesting timber rather than clearing land;
• was below a defined maximum number of harvested trees for any one property.
60

• was not undertaken on regional protected land (riparian), mapped rainforest or mapped wetland.
After the cutting of any tree:
• land within a 50m radius of that tree must contain more than 25 stems of trees greater than or equal to 25 cm dbhob.
• no more than 50 trees to be removed from a contiguous land holding in any period of one year from the commencement of this plan.
Exemption: Regrowth This allowed landowners to maintain land as cleared cultivation land or as cleared pasture land. Clearing to be limited to vegetation that is no more than 10 years old. Private Native Forestry The draft Clarence RVMP did not contain an exemption for private native forestry. 3.2.9 Inverell Yallaroi Draft RVMP This plan covered the Local Government Areas of Inverell and Yallaroi. Definitions: stem density: the number of tree stems per unit area either expressed as trees per hectare or one tree per ‘x’ number of square metres. thinning: the selective removal of woody vegetation from within a vegetation community. Exemption: Thinning of Cypress Pine The intent of this exemption was to allow landholders to thin locked stand Cypress Pine to improve groundcover, reduce erosion, enhance biodiversity and maintain farm productivity. Stand lockup was defined as where:
• Cypress Pine trees or seedlings had a diameter at breast height over the bark (dbhob) of 15cm or less; and
• Cypress Pine trees or seedlings were at stem densities of more than 1 tree or seedling for every 4 m2 area measured over one ha; and
• living groundcover under canopy is less than 20%. It only applied:
• to Black Cypress Pine (Callitris endlicheri) and White Cypress Pine (Callitris glaucophylla)
• if thinning resulted in stem densities of no less than 1 tree per 6x6m area. Exemption: Woody regrowth control The intent of this exemption was to allow landholders to clear regrowth of woody native vegetation to maintain land as cleared cultivation land or as cleared pasture land. This exemption initially applied only to woody vegetation that had grown since 1982. From 2007, this exemption was to apply only to woody vegetation that was 25 years old or less. Older woody vegetation was to be no longer regarded as regrowth. An
61

area of native vegetation comprising 10% of the property to be designated and defined as an area managed for conservation and following proposed clearing of regrowth, at least 30% of the property to consist of woody native vegetation. Exemption: Minimal tree cutting This exemption allowed for minimal tree cutting for the purpose of timber harvesting for on farm use. It allowed for the use of trees growing on the property while recognising the value of remaining native vegetation. Thresholds were adopted to encourage landholders to maintain vegetation so that it could be a benefit to them for future on farm use. The landholder was required to set aside an area 10% of the property area of native vegetation to be managed for conservation in which the exemption did not apply. Trees were to be cut only, leaving stumps remaining to reshoot and regrow and to be used within a 2 year period from cutting. The maximum level of cutting per hectare was 50% of trees within size classes <60 cm or 50% of trees within 15 - 60cm, cut within a 10 year period; The suggested maximum level of cutting for different percentages of vegetation on the property could be calculated from the following based on the % of wooded vegetation on property. If there was:
• greater than 30% wooded vegetation, 1 tree for every 3 ha of property/year.
• between 10 and 30% wooded vegetation, 1 tree for every 6 ha of property/year.
• 10% or less of woody vegetation, exemption does not apply. The Committee based the maximum levels of clearing on conservative calculations of amounts of timber that would be needed for the average property. An example of these calculations for farm use for a 1000 ha property is shown below.
• Fencing: 22 km every 10 years = 2,200 split posts (max 1,000 trees) - 0.1 tree/ha/year.
• Firewood: 10m3/year = 3 trees / 1000ha / year 0.03 trees/ha/year. • 1 shed every 10 years (10x10x4 with 0.1 x 0.1@ 1 m) = 22 m3 / 10
year 0.03 trees/ha/year. • Other miscellaneous: 0.03 trees/ha/year. TOTAL 0.19 trees/ha/year.
If 30% of the property was wooded (300 ha), 1 tree/3ha/year would be more than sufficient to supply these needs. For a property of 200 hectares:
• If existing wooded hectares = 80 ha = 40% of property • Allowance for tree cutting of 66 trees/year • If existing wooded hectares = 30 ha = 15% of property • Allowance made for tree cutting of 33 trees/year
If 10% of property of property is wooded = 20 ha. No tree cutting would be allowable under the exemption.
62
3.2.10 North Lachlan Bogan Draft RVMP The North Lachlan-Bogan Region covered the local government areas of Bogan and Lachlan north of the Lachlan River. At the time the Regional Vegetation Committees were disbanded, the North Lachlan Bogan Vegetation Committee had not reached conclusions on many issues and produced a ‘Draft Interim Vegetation Plan’ which did not fulfill the legislative requirements. The focus of the draft interim plan was the contentious issue of regrowth management. There was no consensus achieved by this committee with the result that the report contained prescriptions proposed by a majority group of landholders. Minority reports were also produced but not available for this assessment. One key problem area was the definition of ‘regrowth’ in the draft interim plan in which it was interpreted to include all vegetation communities, including mature communities. Regrowth up to 20 years old on land previously cleared and cultivated could be cleared without consent. ‘Regrowth’ on land that had not been cultivated and cropped could be cleared (including by mechanical means) but a minimum of 30% to be retained (some other conditions applied). These exemptions were designed to cover the following broad range of species:
Trees: White Cypress Pine, Red Box, Black Box, Bimble Box, Grey Box, Wilga, Belah, Congo Mallee, Ironwood, Yarran, Cooba.
Shrubs: Narrowleaf Hopbush, Broadleaf Hopbush, Emubush, Budda, Silver Cassia, Punty Bush, Turpentine, Hickory Wattle, Dogwood .
Leopardwood (Flindersia maculosa) ‘Regrowth’ on land that had not been cultivated and cropped in the past could be cleared without development consent if not less than 30% of the area of Leopardwood regrowth at a property level was retained at its current density and individual Leopardwood with a diameter at breast height over bark of greater than 30 centimeters was retained. It was suggested that this vegetation community always had an open woodland structure but that ‘a proportion’ of dense thickets were to be retained. River Red Gums (Eucalyptus camaldulensis), Black Box (E. largiflorens) or Coolibah (E. coolabah) This exemption was designed to allow the management of River Red Gum, Black Box or Coolibah on development consent areas where mass germination events associated with flooding could impact on the continuation of current agricultural practices. It also allowed thinning of communities less than 20 years old to ensure adequate recruitment of the species in riparian corridors and other areas subject to periodic inundation. This was based around the debated assertion that these communities always had a natural open grassland structure (see Section 1.1).
1. These species could be cleared without development consent if they were not more than 20 years old at the time they were cleared on areas of land to which this exemption applied.
2. River Red Gums, Black Box or Coolibah that were not more than 20 years old at the time they were cleared (whether or not they had occurred since that last
63

flood event) and that occurred in natural or derived native grassland (or both) or in an area that had previously been cleared, could be thinned without development consent. Conditions included:
• at least 20% of the total canopy cover provided by the River Red Gums, Black Box or Coolibah in the designated area to be retained, and
• an estimated mature canopy cover equivalent to at least 20% of the designated area to be retained (that is, there must be retained sufficient River Red Gums, Black Box or Coolibah as would, on their maturity, provide a canopy cover equivalent to at least 20% of the designated area).
Minimal Tree Cutting This exemption allowed for the cutting of no more than seven trees per hectare in any period of one year for on-farm uses, including fence posts and firewood. 3.2.11 Manning Draft RVMP The Region, encompassed the Gloucester and Greater Taree City Council (GTCC) Local Government Areas. Thirteen broad vegetation types were defined for the Manning RVMP. In addition to vegetation communities listed for special protection and riparian zones, Candidate Old Growth Forest was protected from the use of Exemptions for Private Native Forestry and Minimal Tree Cutting. Exemption: Minimal Tree Cutting This exemption was intended to enable landholders of properties of 10 hectares or more to harvest timber for use on the property on which the tree cutting occurs. It could only be used in the Vegetation Conservation and Management Zone. Landholders could cut up to one percent of the tree stems greater than 15cm diameter at breast height over bark, up to a maximum of 30 harvested trees, in any 12 month period.
• no trees >100cm dbh. • stumps of all trees removed under this exemption must be left in the ground
and be visible above ground. • not be used in areas of Candidate Old Growth forest
3.2.12 Moree Draft RVMP This plan covered the Moree Plains Shire Council. Thirteen broad vegetation types have been defined for this region. ‘Problem’ communities – Coolibah / Black Box, scattered Myall / Rosewood, Poplar Box Exemption: Minimal tree cutting for on-farm use This exemption could only be used within the General Consent Management Zone. It allowed for cutting of 20 native trees per 100 hectares (or pro rata), with a maximum of 200 trees per contiguous property, over the life of the plan. The following trees were excluded from this exemption:
• significant species, • hollow bearing trees,
64

• trees with a diameter at breast height of more than 30 centimetres, • the trees were not ‘groups’ as identified in the exemption Clearing single trees
in cultivation Exemption: Clearing Single Trees in Cultivation Single trees were defined as:
• Isolated trees scattered within land that had previously been cultivated • Greater than 2 metres in height, • Trees that occurred as individuals (that is not as groups of 2 or more) at
densities of less than 1% canopy cover (one mature tree per hectare) averaged over a minimum area of 10 hectares assuming a random distribution.
Trees that are 30 metres or less apart were considered a group (measured at ground level from main tree trunk to the next main tree trunk) and could not be cleared under this exemption. Native trees could be cleared without development consent on areas of land to which this exemption applied but only if:
• the landholding on which this exemption was to be applied had an extant native vegetation cover of greater than 20% of the area of the landholding (not including that in the Self-Management Zone) with a tree canopy cover greater than 5%, and
• the single trees occurred as individuals (that is, not as groups of 2 or more), at a density of less than 1% canopy cover (that is, one mature tree per hectare, averaged over a minimum area of 10 hectares), and the area with respect to which this exemption was intended to operate (that is, in relation to the proposed clearing event), is less than 200 hectares or a maximum of 10% of the Self-Management zone, and
• the trees were not: hollow bearing trees with a diameter at breast height of more than 30
centimetres; and there was an offset area, 15% of the paddock area of the single tree
clearing or 0.5 ha per tree cleared, whatever is the lesser, to be set aside and maintained as part of the plan’s ‘managed for conservation’ reserve as part of a property agreement.
Exemption: Thinning for regrowth control This aim of this exemption was to improve groundcover and grazing potential, enhance the habitat available for endemic flora and/or fauna, and maintain a mixed age/size structure of woody vegetation. At the completion of thinning, on each 10 ha there should be
• all trees/shrubs not of the species being thinned; • all trees greater than the prescribed dbh of the species being thinned; and • at least 50 trees of each cohort (age/class size) being thinned.
For this exemption regrowth included only the following native trees or shrubs with a dbh smaller than that listed:
Coolibah (Eucalyptus coolabah): 20 cm Briar (Acacia farnesiana): N/A
65

Poplar Box (Eucalyptus populnea): 20 cm Myall (Acacia pendula): 10 cm Belah (Casuarina cristata): 15 cm Black Wattle (Acacia stenophylla): 10 cm Budda (Eremophila mitchellii): 10 cm Black Cypress (Callitris endlicheri): 10 cm White Cypress (Callitris glaucophylla): 10 cm
If thinning was to be carried out, the density of trees was to be changed without changing the vegetation structural formation e.g. a woodland must remain a woodland after thinning, with woodland opaque crown cover range of 20% to 50%. In addition:
• a minimum of 15% of the designated area being representative of the structure and density of the regrowth in that designated area to be retained, and
• a minimum number of five (5) native trees of each cohort (age/size class) being thinned to be retained (in perpetuity) per hectare (averaged over each 10 hectares) of the remaining percentage [see clause (2) (d) (ii)] of the designated area (so there must be more than this number of regrowth native trees on any given hectare before this exemption could operate in the area), and
• there was to be no subsequent thinning of native trees under this exemption in an area retained
3.2.13 Tenterfield Draft RVMP This Regional Vegetation Management Plan (RVMP) was prepared for the Tenterfield Native Vegetation Region (TNVR) which covered the whole of Tenterfield Shire Council. The following were standard conditions that applied to each exemption. Where the exemption/clearing activity was to be undertaken without development consent the following was to be retained or considered.
• Option 1: Trees of a dbh > 70 cm west and 90 cm east of the New England Hwy.
• Option 2: Trees of a dbh > 70 cm west and 90 cm east of the New England Hwy excluding the following species Eucalyptus radiata, E. andrewsii and E. deanei.
• Koala Habitat Trees - If the tree species listed comprised more than 30 % of the canopy, then a koala assessment (SEPP 44) was to be undertaken.
Exemption: Minimal tree cutting This exemption provided landowner/holders with the capacity to carry out normal farm maintenance and activities. This exemption was not designed to encourage forestry or low level logging. It was unresolved by the committee but they provided four options for the public consultation process:
• Option 1: 1 – 3 trees/ha/year • Option 2: 5 trees/ha/yr which could be increased to 10 trees/ha/yr over 10 % of
this area. • Option 3: 7 trees/ha/yr. • Option 4: 10 trees/ha/yr.
This was conditional on:
• 5 hollow bearing trees being retained per hectare;
66

• a recruitment hollow bearing tree being retained for each hollow bearing tree retained;
• all sap feed trees with obvious feed marks or V notches of Squirrel Gliders or Yellow-bellied Gliders being retained;
• a minimum of 3 eucalypt feed trees being retained per hectare where available; • Individuals of Allocasuarina sp. (forest oak) with more than 30 crushed cones
beneath being kept or any damage being minimized; • damage to Xanthorrhoea sp. (Grass Trees) being minimized; • trees with nests or roosts not to be felled or damaged; • where it could be identified that raptor and owl roost and nest trees were
present and there were young in the tree a 20 metre buffer to be maintained. If there were no pairs and the tree could be identified as a nest tree then the tree must be protected;
• stag trees/dead trees of diameter over 20 cm must be retained at a rate of two trees per hectare where available. Stag trees included dead trees.
An individual retained tree could count for more than one tree retention prescription if it had the appropriate characteristics. Exemption: Regrowth Removal This exemption allowed for the removal of native vegetation and exotic woody vegetation on land previously cleared and ploughed for cultivation, pasture or plantation, where disturbance by man was evident or from aerial photos prior to the gazettal of this plan and no earlier than 1984. The regrowth exemption only applied to specific locations in the paddock where prior clearing for pasture, cultivation and plantations occurred or where consent for clearing that included regrowth had been given. It was not the intent of this exemption to allow clearing of the shrub layers in previously uncleared forest or woodlands. If pasture had changed to contain over 50 % of native species since 1984 then pasture could be resown to re-establish a mixed pasture. Regrowth around large paddock trees or clumps (usually regrowth of an even aged appearance) including scattered timbered areas with a predominantly grassy understorey was included and it applied to pasture in selectively cleared woodland or forest where, regrowth could be identified as having emanated from past disturbance. Regrowth that could be cleared was defined by species and size (dbh) and excluded species listed:
• C. glaucophylla, C. endlicheri: 0-30 cm dbh; • C. rhomboida, C. montecola, C. oblonga, LC Class 8 land: excluded; • Leptospermum brevipes, Kunzea obovatus, Leptospermum polygalifolium: No
size limit; • All shrubs and ground covers excluding grasses. Where the land had
previously been cultivated or was open paddocks, regrowth since 1984 could be cleared without consent. Where the land was scattered timber with a shrub layer, then regrowth up to ten years old could be cleared without consent;
• Angophora floribunda, A. subvelutina, Lophostemon confertus, Eucalypt sp. 0-20cm dbh clear or thin, 20-30cm dbh thin only, >30cm dbh requires consent. Retain 10/ha east of the New England Hwy and 5/ha west of the New England Highway where they occur;
67

• A. excel (endemic to Gibraltar Range Area in the South East of Tenterfield Shire) excluded.
• Excluded ROTAP listed Eucalypt spp.; • Acacia implexa, A. dealbata, A. irrorata: No size limit; • Threatened Acacia species excluded; • Primary Koala habitat trees Eucalyptus camaldulensis (River Red Gum),
Eucalyptus amplifolia (Cabbage Gum), Eucalyptus microcorys (Tallowwood), Eucalyptus prava /Eucalyptus bancroftii (Orange Gum), Eucalyptus tereticornis (Forest Red Gum), Eucalyptus dealbata (Tumbledown Red Gum) Eucalyptus viminalis (Ribbon Gum): west of the New England Hwy – 0-10 cm dbh clear, 10-15 cm dbh thin to 15 trees/ha; east of the New England Hwy - 0-20 cm dbh clear, 20-30 cm thin to 30 trees/ha; Where these trees exceed 30% of the canopy a Koala assessment to be undertaken;
• Allocasuarina cunninghamiana (River oak), A. torulosa, (Forest Oak, A. littoralis (Black Sheoak): 0-25 cm dbh thin to 20/2ha, > 25 cm dbh required consent. River Oak outside the riparian zone only.
• A. rigida, A. leumanhiyii, ROTAP and significant vegetation excluded • Banksia integrifolia: 0-25cm dbh thin to 20/2ha, > 25 cm dbh required
consent. • Rainforest species Grevillea robusta (Silky Oak), Lophostemon confertus
(Brushbox), Acacia melanoxylon (Blackwood), Solanum sp. (furry nightshade, Spiny Nightshade): In the general zone, regrowth of rainforest less than 10 years old could be removed.
3.2.14 Walgett Draft RVMP The Region covered the New South Wales local government area of Walgett Shire From recent mapping (1998-1999), the Walgett Native Vegetation Region retains more than 78% of its native vegetation, with around 43% of this in the western section of the shire and 35% in the east. Historically, the native grasslands were targeted for clearing (around 50% of the estimated pre-clearing grasslands remain) as were Coolibah and Black Box communities. Extensive ringbarking, particularly in the western region, has left almost 135,000 hectares of country dominated by standing dead timber. Thresholds developed for vegetation retention in the 54 vegetation communities grouped into 9 broad vegetation types (BVT). The thresholds were based on a maximum development limit of 30% of the pre-modification amount of each BVT, with the exception of ‘Other Coolibah’ at 40% which reflected the capability of these soils for agriculture, ‘Other Poplar Box’ and ‘All Other’ where the 5% and 10% development reflects the lower capability of these soils for agricultural development. The 30% regional limit was considered to have scientific merit, based on CSIRO research (e.g. Freudenberger et al. 1997). In this RVMP thinning was defined as changing the density of trees without changing the vegetation structural formation. It was justified for the improvement of groundcover and grazing potential or to enhance the habitat available for endemic flora and fauna. It did not apply to thinning for the purpose of cultivation. The area of regrowth to be thinned was to be less than 500 hectares and at least 25% of the area which represented the structure and density of the regrowth in the designated area was to be retained.
68

Exemption: Clearing of Single trees Single Trees were defined as isolated trees scattered within land that had previously been cultivated, trees that occurred within cultivation paddocks at densities of less than 1% canopy cover (one mature tree per hectare) averaged over a minimum area of 10 hectares assuming a random distribution. These trees were not in clumps, which by default would be described as greater than 1% canopy cover over a 10 hectare area, not distributed randomly. Single native trees could be cleared without development consent on areas of land if the landholding had an extant native vegetation cover of greater than 30% of the area of the landholding occurring in zones other than the Self Management Zone. The area covered by this exemption was to be less than 500 hectares in a 12 month period. These trees could not include hollow bearing trees with a diameter at breast height of more than 50 centimetres, and there was to be an offset area established 12 months prior to clearing, where revegetation or regeneration had been established. Exemption: Thinning of regrowth Coolibah and Black Box Regrowth Coolibah and Black Box referred to those cohorts that had grown following specific flood events and were < 20 cm dbh. Coolibah (Eucalyptus coolabah) and Black Box (E. largiflorens) dominated woodlands, could be thinned if the trees were not hollow bearing trees, living trees with a diameter at breast height of more than 20 centimetres, or dead trees greater than 15 centimetres dbh. At least 40 native trees of mixed age/size class on any given hectare of the remaining 75% of the designated area were to be retained in perpetuity. Exemption: Thinning of regrowth white/black cypress Regrowth Cypress referred to those cohorts that had grown following specific events, and were < 15 cm dbh. White Cypress (Callitris glaucophylla) and Black Cypress (C. endlicheri) dominated woodlands could be thinned if the trees are not hollow bearing trees, or trees with a diameter at breast height of more than 15 centimetres. At least 156 native trees of mixed age/size class were to be retained in perpetuity on any given hectare of the remaining 75% of the designated area. Exemption: Minimal tree cutting for on-farm use This allowed for the cutting (sawing or hewing, not by other means such as poisoning, burning or bulldozing) of no more than 2 trees per hectare, with a maximum of 15 trees per property, in any 12 month period of for on-farm uses, including fence posts and domestic firewood. Trees with a diameter at breast height of more than 30 centimetres or hollow bearing trees were not to be cut. Exemption: Clearing of Woody Weeds Clearing land where greater than 50% of the total native vegetation cover is dominated by ‘woody weeds’, which, for the purpose of this plan, are Turpentine Eremophila sturtii, Budda or False Sandalwood Eremophila mitchellii, Broadleaf Hopbush Dodonaea viscosa subsp. Spatulata, Narrowleaf Hopbush Dodonaea viscosa subsp. Angustissima, Punty Bush Senna artemisioides subsp. filifolia and Silver Cassia Senna artemisioides subsp. artemisioides.
69

This clearing did not include trees (single, clumps, or woodland), or other groups of shrubs that occupied greater than 5% of the surface area within the affected area, such as Chenopods and Acacia species. 3.3 Management Prescriptions of State Forests of New South
Wales. Unless otherwise indicated these prescriptions are taken from the State Forests of NSW Ecologically Sustainable Forest management, Native Forest Silviculture Manual. 3.3.1 Silvicultural Procedures The overall aim of the SFNSW forest management policy is to enhance timber productivity, biodiversity, conserve soil, water and cultural heritage. Definitions: Thinning: a system applied to even aged regrowth stands to harvest some trees commercially and redistribute the site resources to the remaining trees Spacing (non-commercial thinning): system in which some trees are removed at a relatively young age from regrowth stands to promote growth of those retained. Culling (Timber Stand Improvement TSI): removal of unmerchantable mature and advance growth trees competing with established regeneration by felling ringbarking or poisoning. 3.3.2 Coastal and Tablelands Region This region contains a wide range of tree species and forest types. The forests extend from sea level to 1400m asl and rainfall in this area is 700 to 2400mm. The area is not subjected to regular drought, flooding or snowfalls. Favoured species include Tallowwood (on the north coast), Spotted Gum, Blackbutt (mainstay of the hardwood industry since the early 20th Century) and Mahoganies, Ironbarks, Grey Gums used for poles, girders, sleepers etc. The dry Ash / Stringybark forests of the south coast had little timber value except for sleeper cutting and some milling but they are now the basis of the Eden pulpwood industry. These forests are either irregular forests with a range of age classes or relatively even aged regrowth forests resulting from intensive post war harvesting. Thinning is used in addition to the specific silvicultural techniques for harvesting. Thinning from below removes smaller, less vigorous, less valuable trees to enhance the growth of the retained trees. Harvesting plans are required to indicate an appropriate stocking range or retained regrowth trees but supervisors base their selection on dominance, form and defect. Other methods of thinning are ‘thinning from beside’ (harvesting for poles while enhancing other individuals) and ‘thinning from above’ (used to favour intolerant species). On the north coast, thinning may remove no more that 60% of the pre-existing basal area and single tree selection harvesting may remove no more than 40%.
70

3.3.3 Alpine Ash Region Alpine Ash is confined to the Snowy mountains area in NSW where it grows at altitude of 1000 – 1500m. Selective logging in early 20th Century produced mixed aged stands with a large proportion of ‘defective’ trees; even aged stands were produced by TSI with heavy logging, and these were subsequently spaced by thinning. Although self thinning is efficient, commercial thinning to 250 to 350 stems per ha at 30 years old, followed by a second thinning 15 years later could be a good strategy for these forests. 3.3.4 River Red Gum After a period of harvesting and some dense regeneration, TSI and spacing was carried out in the 1890’s to develop these regeneration stands into more productive forests. The majority of red gum forests are the stands which regenerated in the late 19th Century and were successively thinned during the 20th Century. They are now well stocked mature forests. Openings equivalent to at least 3 mature crown widths are required to allow effective regeneration. Spacing of red gum regrowth should be done when they are 20-30 cm dbh. About 170 to 220 crop trees /ha should be retained. Thinning guidelines in Murray Management Plans for older commercial stands. Minimum basal areas of useful trees 16sq m to 25sq m /ha. Figure 3.1 demonstrates the basal area response to thinning determined from Forestry Commission trials. Figure 3.1 River Red Gum basal area response to thinning (Forestry Commission
1986).
71

3.3.5 White Cypress White Cypress grows on moderate to flat topography, in the 350 – 700mm rainfall belt with, frequent droughts, generally on well drained soils without shallow ground water. White Cypress is dominant on lighter soils, western hardwoods are more prevalent on heavier soils and rockier sites. Black Cypress favours rocky and broken topography. Mixed cypress and hardwood forests with a shrubby understorey are more common in the north. Seedling establishment is more regular in the north.
Spacing: unthinned pre-commercial stands 30 years old should be thinned to <500 stems/ha (4.5m) to optimise growth and potential sawlogs; stands >30 yrs old with basal area > 12m2/ha or stem density 500 to 700 stems/ha will respond well to thinning. Thinning to about 6m2 - 8m2 usual. Good quality hardwood stands will benefit from thinning to similar densities since they grow in a similar environment. Spacing to about 6m x 6m (stand density of about 280 trees/ha, 4-6m tall) currently considered to be the minimum treatment that will allow cypress to grow to a thinnable sawlog stand in a reasonable time (Figure 3.2). Harvesting should not reduce the stocking below 100 trees per ha (Forestry Commission 1986). Figure 3.2: White Cypress basal area response to thinning (Horne and Robinson
1989).
3.4 Other Suggested Thinning Prescriptions 3.4.1 White Cypress Several thinning studies have been carried out by State Forests which have informed the thinning strategy described above. These are detailed in Appendix 2. Retained trees should be chosen with the largest/tallest, straightest stem, smaller limbs, without double leaders or bends, without damage. First commercial thinning should be done
72

when dbhob is 14-24cm (Nicholson 1997). Optimal thinning treatments and resulting productivity are site and stand specific and should be determined based on economic considerations. As a consequence, spacing recommendations vary from 2-3 m (Horne 1990b) to 4.5m (Knott 1995), 4.9 (Horne 1990a) and 6m (Nicholson 1997). A cypress thinning experiment has been carried out at the Western Plains Zoo, Dubbo (Cameron, in prep). The vegetation was a dense regrowth forest of White Cypress and some sporadic clumps and stands of Black Cypress with various eucalypts including Mugga Ironbark, Tumbledown Red Gum and Blakeley’s Red Gum scattered amongst the cypress. Other woodland communities are also present in the mosaic found on the site. Cypress that has regenerated since about 1950 was thinned to a spacing of about 8m. Trees of good form and vigour were selected for retention and included a range of age and size classes. An unthinned control site was retained. Thinned trees were left on the ground and not cleaned out. Vegetation increased in structural and species diversity. There appeared to be a response by birds and some of the small macropods held by the Western Plains Zoo in their Sanctuary but no systematic studies were carried out. 3.4.2 Ironbark-Cypress Forests Ironwood harvesting prescriptions in the Pilliga forests from 1986 to 1993 required the minimum retention of 2 hardwood trees per ha (ironbarks and other eucalypts) to provide faunal habitat and the minimal retention of one mature individual of each overstorey species per ha. This was changed in 1993 to the retention of all non ironbark eucalypts, 2 mature ironbarks (>60 cm dbh) and 2 recruit ironbarks (40-60 cm dbh) per ha where available. Mature Casuarina and Allocasuarina can be harvested to 50% of original canopy cover and with minimal disturbance. 3.4.3 Box-Ironbark Forests Parks Victoria (2004) has developed an Ecological Management Strategy for the Box – Ironbark forests which includes the strategy of Ecological Thinning. This is in response to the results of several studies in Victoria that suggest that there are possible advantages in thinning of coppice and regrowth. In particular it is seen as a method of increasing the speed of restoring large mature trees to the landscape (Traill 1993, Doherty 1998, Parks Victoria 2004). The intent of the Ecological Thinning strategy is to retain trees of all forms and sizes in addition to a patchy distribution of stems. Timber harvesting prescriptions in Victoria require the retention of 6-14 living habitat trees per ha with at least 2 large (>60 cm dbh), 2 medium (40-60 dbh) and 2 small (20-40 cm dbh) habitat trees (DNRE Vic 1998). 3.4.4 Grassy Box Woodlands These woodlands are commonly thinned to enhance grass growth for grazing leaving open woodlands or scattered trees. Thinning prescriptions for areas of dense regeneration need to account for landscape and temporal parameters (McIntyre 2002, Windsor 2000). 3.4.5 River Red Gum Silvicultural treatment has been imposed on Red Gum forests since the 1890’s along the Murray River and 1926 in the Murrumbidgee area. This involved the culling of larger commercially unproductive competing trees (Forestry Commission 1986).
73
Without intervention red gum stands have been found to self thin to a stocking rate of about 500 to 700 trees per ha. Self thinning occurs from below by retarding the development of new trees while the overstorey thickens. After management thinning the tree density was 140 ‘healthy young trees’ per ha (Donovan 1997). A basal area of 13-16m2 per ha in pole sized stands produces optimal growth for harvesting. No tree larger than 170cm dbh is to be felled, thinning for stand improvement to no less than 16m2 basal area per ha, at least one and up to five suitable mature trees with hollows per ha to be retained in addition to all such trees within 20m of any stream, 10m of lagoons, and 60m of the Murrumbidgee and Lachlan Rivers (Forestry Commission 1986). In Victoria proposed harvesting prescriptions in River Red Gum woodlands require the retention four habitat trees per ha and all trees >150 cm dbh. This is only one quarter of the trees of that size recorded by Bennett et al. (1994) in remnants supporting healthy vertebrate populations. For these authors the key question was ‘Are there sufficient hollows in the right place at the right time?’. 3.4.6 Coolibah and Black Box The impact of thinning on the faunal diversity of Coolibah and Black Box communities has been considered by Briggs and Tooth (1994) and Maher (1995). The transition between thinning and clearing is difficult to define but preliminary data collected by Briggs and Tooth (1994) suggest that a threshold density of about 25 trees per hectare (tree spacing of 20m) may have little or no adverse affects on the avian biodiversity. However, as the level of thinning increases, so will the probability of species being lost. Maher (1995) concludes that the thin line between thinning and clearing will be determined by changes in the composition of the faunal communities. In State Forests it has been suggested that Black Box harvested for fence posts should be felled at a stump height of 20cm to encourage useable coppice growth (Forestry Commission 1986). The thinning prescriptions that have been proposed for these communities are: Soil Conservation Service 1967 thinning conditions: Black Box and Coolibah trees
rung out to a minimum of 5/ac (12 trees/ha) with retention of well distributed 10-18 inches (25-45 cm) dbh and not less than 5 well established juvenile trees to permit replacement of trees lost by over maturing etc. No timber to be destroyed within beds or within strips one chain (20 metres) wide along banks of all main watercourses, and 5 chains (100 metres) wide on major rivers and creeks.
NPWS thinning recommendations for all land systems except for Wombeira in about 1986: minimum of 20 mature Coolibah/Black Box per ha be retained with even spacing (not clumped and at proportions as found in the existing vegetation), 15 regenerating Coolibah/Black Box per ha at least 5m high (not clumped and at proportions as found in the existing vegetation) and less common trees not to be thinned; no clearing within 500m of the River.
Thinning expectations: Landholders – final density 5-12 trees / ha of mixed ages (individual strategies vary);
74
CaLM – final density 10-20 trees / ha, modified to include mature and juvenile trees (25/ha) and must include all trees with large hollows, 50% of trees with small hollows, 50% of stems 21-40 cm dbh and 41-80 cm dbh, 25% stems in 5-10 cm dbh and 11-20 cm dbh retained, 50% total area of macrohabitat (vegetation) type to be permanently protected, tree spacing and % tree cover remains above minimum levels for particular species, some areas not to be thinned also to be designated; NPWS – 35 trees/ ha of mixed ages except for special sites.
Preliminary natural thinning curve determined. At the densest site with trees from 1970’s floods: 1913 live + 975 standing
dead stems/ha. Plots from 1950’s floods: 128, 170, 150, 320 / ha. For the 1890 flood: 82-84/ha.
Maher (1995) concluded that the density of trees remaining alive after treatment should reflect the variability in the pre-treatment densities. He suggested a percentage based system in preference to a fixed density across the landscape. The advantage of a percentage based system was considered to be that it takes into account biodiversity needs in the landscape. He presented three possible protocols:
1. WISE: In addition to basic conservation principles (conserving sites of significance, existing protected areas and connectivity thinning is possible provided that all trees with large hollows are retained, at least 50% of trees with small hollows are retained, at least 50% of stems in the 21-40 and 41-80 cm dbh are retained, at least 25% of stems in the 5-10 and 11-20 cm dbh are retained, tree spacing and the percentage cover does not fall below the minimum levels for particular species.
2. Green System: No original trees to be removed and 2 regrowth trees to be retained close to an original tree, maximum average spacing of all trees to be retained at 30m (10/ha), no gaps to be greater then 50m between trees, clumps of untreated regrowth to be retained within any treated area to be at least 25% of the total area, at least 5 ha in size and scattered through the total area.
3. THIN – a simplified and less restrictive version of WISE. For faunal protection: No thinning within 500 m of major watercourses, all trees with large hollows (>10cm wide and >20cm deep) to be retained, all trees with mistletoe to be retained, average distance between stems to be a maximum of 25m (approx 20 trees/ha > 40 years old), all treated trees to be left standing. To protect the integrity of the Coolibah woodlands: density of live coolibah/black box after thinning to reflect pre-thinning density (a percentage based reduction system), at least 50% of trees with small hollows (>3cm wide and >10cm deep, usually the larger trees), strips 250m either side of floodrunners unthinned, 50% of woodland unthinned (preference to heavily channellised areas). Protection of viability of protected species populations: No thinning within 200m of relict floodplain dunes or 500m of wetlands and connected with corridors, associated tree species to be retained.
75

3.4.7 Rainforest In the Wiangarie State Forest in north-eastern NSW, silvicultural treatments were applied to the natural density of 284 stems per ha of trees >20 cm dbh. Overall the removal of 26% of the basal area was valuable from a forestry perspective and also caused the least disturbance to the canopy (Burgess et al. 1975) 3.4.8 Wet Sclerophyll Forest The study by King (1985) was an investigation of natural regeneration in a wet sclerophyll forest after logging. Regeneration was most successful on plots where the soil had been disturbed by fire after logging.
76

4. Thinning: Density Manipulation to a Benchmark. 4.1 Introduction This assessment of stem densities and thinning protocols has been undertaken to provide background information for the development of stem density benchmarks for ‘Biometric’ (Terrestrial Biodiversity Assessment Tool for the NSW Property Vegetation Plan Developer, Gibbons et al. 2005). Biometric is a tool designed to assess the positive and negative impacts on terrestrial biodiversity of applications for clearing and incentives in native vegetation under the NV Act (2003). ‘Clearing (thinning only)’ is described in ‘Biometric’ as maintaining environmental outcomes, and not requiring offsets if the thinning results in stem densities at or above a pre-determined benchmark for the vegetation type, remaining vegetation is minimally disturbed and occurs over less than 80% of the proposed area. The vegetation proposed for thinning does not include ‘invasive scrub’ (Gibbons et al. 2005). The complexity of the issues involved in the development of thinning protocols from benchmark stem densities for the Keith (2004) vegetation classes has been demonstrated by this review. Our knowledge of the structure of pre-European vegetation communities is very limited, relies on a subjective interpretation of historical documents and rarely includes ecological parameters (e.g. ecological succession). In addition there is a paucity of stem density data and the data that does exist has been collected for a range of different purposes, is presented in a variety of forms and is not necessarily a representation of the 1750 benchmark. It is also difficult to unequivocally assign the various studies to specific Keith vegetation classes. Thinning has been used extensively by forestry and grazing managers over the last 150 years. Foresters use it to enhance the growth rates of trees for harvesting while the thinning of trees in grazing lands is a technique for promoting grass growth. The level of thinning employed has varied from almost complete removal of native vegetation with only a few trees being retained, to more limited thinning without disturbance of the ground cover. The perceived value of thinning as a management technique is clearly evident from the detailed prescriptions developed for the Regional Vegetation Management Plans that have been summarised in this review. The added requirement in the RVMPs that the stump be left in the ground to cause minimal ground disturbance and to distinguish thinning from clearing is also evidence that the purpose of this procedure was viewed quite differently from clearing. Where thinning protocols have been developed (e.g. RVMPs and silvicultural management plans) the requirements have been designed to serve that particular purpose. The demand for thinning as a vegetation management tool is also variable across NSW, as demonstrated by the different approaches adopted by the Regional Vegetation Committees when developing RVMPs. It was a far more significant issue for inland vegetation management than for coastal committees and the species of greatest concern also varied, with River Red Gum regrowth, for example, being a
77
more significant issue in southern NSW and cypress regrowth more significant further north. In addition, it is important to note that thinning has not necessarily been a high priority for land managers, as indicated by the fact that only 4% of all applications to DIPNR for clearing in the Lower Macquarie Castlereagh under the NVC Act were for thinning. Alternatively, there may be opportunities to substitute thinning for clearing in the development of Property Vegetation Plans. The primary aim of this review of stem density data is to determine whether there is sufficient data to define stem density benchmarks for Keith (2004) vegetation classes as required for ‘Biometric’. When deriving benchmarks and thinning protocols, it is also essential to ensure that they meet the basic requirement of improving or maintaining environmental outcomes, especially for biodiversity. For this reason, the impact of thinning on faunal and floristic biodiversity is briefly assessed below. 4.2 Impact of thinning on faunal and floristic biodiversity Thinning is believed to have a minimal or even a positive impact on biodiversity, but there is little quantitative data to support this hypothesis. The impact of thinning will differ between vegetation communities and research to define the benchmarks which will distinguish thinning from clearing is very limited. The differences between vegetation communities are even more strongly evident when the management history of the extensively cleared landscapes of the slopes and plains west of the Great Dividing Range, where fragmentation of habitat is a significant issue, are compared with the more continuous cover of the forests of the coast and Great Dividing Range. There are few studies that specifically address the impact of particular thinning regimes on faunal and floristic biodiversity. A number have examined the impact of logging on faunal distribution and abundance (e.g. Braithwaite 1983, Braithwaite et al. 1983, Date and Paull 2000, Kavanagh et al. 1985, Recher et al.1985) and birds have been the focus of other studies (e.g. Burgess et al. 1975). Studies addressing the impact of any form of clearing (including thinning and logging) on reptile fauna have been very limited. Given this paucity of information, results of studies addressing the loss of tree cover on biodiversity are also relevant in the discussion of the impact of thinning strategies on biodiversity. The impact of logging and thinning on avifauna has been shown to be variable. In northern Victoria the woodland avifauna declined dramatically once tree cover fell below 10%. In addition, the loss of birds shows a lag time after the loss of habitat. Many species can persist in areas where 10 – 30% of habitat has been retained but population sizes become reduced, imperilling the species (McAlpine et al. 2002). Briggs and Tooth (1994) have also suggested that thinning of Coolibah to a threshold density of 25 trees per ha (no dbh indicated) may have little or no impact on bird diversity and abundance. In the Pilliga forests of central western NSW, Date and Paull (2000) found that while some shrub-dependent bird assemblages were affected by high levels of logging of cypress and ironbark, others seem to benefit from regrowth following the logging. But where logging had occurred in moderate to high levels in mixed understorey / open woodland habitats, shrub-dependent species appeared to decline. This is contrary to
78
results of studies by Kavanagh et al. (1985) in the Eden forests where shrub-dependant species preferred post-logging shrubby habitats while hollow dependent species, species that forage in the canopy and those that forage in leaf litter around large fallen logs were adversely affected. In the sub-tropical rainforest of the Wiangarie State Forest, Burgess et al. (1975) assessed the impact of thinning on the avifauna. Silvicultural treatments applied to natural density of 284 stems/ha >20cm dbh were assessed. They found that the removal of 26% basal area was worthwhile from a forestry perspective and caused the least disturbance to the canopy and the bird assemblages. It is important to separate the results of thinning for forestry production from thinning for enhancement of grazing production. Within remnant vegetation along benchmark roadside and road reserve sites in northern Victoria, van der Ree and Bennett (2001) recorded a density of 14 stems per ha of trees greater than 70 cm dbh but in box-ironbark forests with a logging history, a density of only 2 stems per ha of trees greater than 60 cm dbh remains. The density of large trees recorded by their study was also four times higher than the recommended retention rates from forestry management plans of 2 per ha for trees >60 cm dbh in the Bendigo box-ironbark forests and 4-6 per ha for trees >50 cm dbh, plus all trees greater than 150 cm dbh in the River Red Gum forests in the mid-Murray management area (Bennett et al. 1994, van der Ree and Bennett 2001). The loss of the larger trees that provide habitat for a wide variety of fauna dependent on hollows is a serious consequence of clearing and thinning of forests and woodlands in the past. In addition to the loss of this habitat, trees that would replace these trees and the habitat they provide are also in very limited supply in many areas. This regeneration gap will add additional stress to the survival of hollow dependent fauna, one quarter of which is already listed as threatened (Gibbons and Lindenmayer 1997, Cutten and Hodder 2002). In the development of benchmarks and protocols for thinning as a vegetation management technique, issues such as those highlighted by these studies, and others, need to be incorporated if there is to be a neutral impact on biodiversity. One impact of silvicultural management has been the production of more homogeneous, even aged communities than would be expected without a silvicultural regime (Date and Paull 2000). In order to maintain and potentially enhance biodiversity it will be important to ensure the heterogeneity of vegetation communities, both across the landscape and through time. This issue has been addressed in the complex thinning strategy (THIN) developed by Maher (1995) for Coolibah and Black Box (see Section 3). Change to the structure of a community, if taken beyond an appropriate benchmark will result in a change to microhabitats and microclimate, and a consequent change to the biodiversity of the site (Saunders et al. 1991). There will be a threshold tree and shrub density appropriate to each community which will define potential change in the faunal and floristic communities. It is also critical to retain all tree species and their relative abundances. It has been demonstrated by Keatley et al. (1999) that the flowering times of eucalypt species in Victorian box-ironbark Forests are asynchronous but overlapping. This would have provided pollen and nectar for
79

nectivorous vertebrates throughout the year in complete forests but selective logging has resulted in the loss or serious reduction of some tree species producing a seasonal food shortage for some species. 4.3 Stem density benchmarks Benchmarks have been defined in a variety of ways but the definition used in the ‘Biometric Operations Manual’ is:
‘Benchmarks are quantitative measures that describe the range of variability in condition in vegetation with relatively little evidence of alteration, disturbance of modification by humans since European settlement.’
(Gibbons et al. 2005 and Ayers et al. in prep). This differs from the definition used for the vegetation quality assessment procedures developed in Victoria, in which a benchmark is defined as a reference point representing the ‘average characteristics of a mature and apparently long-undisturbed state of the same vegetation type’ (DSE 2004). A key difference between the two approaches is the inclusion of the range of variability in the NSW vegetation planning process (Gibbons et al. 2005). In this context, unmodified vegetation has been described as having ‘minimal timber harvesting (few stumps, coppicing, cut logs), minimal firewood collection, minimal exotic weed cover, minimal grazing and trampling by introduced or overabundant native herbivores, minimal soil disturbance, minimal canopy dieback no evidence of recent fire or flood, not subject to high frequency burning and with natural recruitment of native species, by minimal dense recruitment of native species following high levels of anthropogenic disturbance or sudden release from high levels of anthropogenic disturbance.’ (Ayers et al. in prep). The vegetation density data available in the literature is very variable in methodology and quality with stem density being used less commonly than cover estimates such as projected foliage cover, crown cover or subjective descriptive terms such as ‘dense’ or ‘sparse’. In addition, when stem densities have been used there is no standardised approach. Some studies quote total stem densities, others divide these into tree size (dbh) classes but these classes are not consistently defined across all studies. This relative lack of stem density data and, where it does exist, lack of consistency in presentation limits the ability to determine strongly defined benchmarks. In order to significantly increase the data available for the development of stem density benchmarks, the possibility of developing conversion factors between other canopy density estimates and stem densities should be investigated. For the vegetation quality assessment procedure developed by DSE (2004), density of the canopy is assessed in terms of % canopy cover with stem density being used only for large trees. A benchmark stem density for large trees (diameters varying from 50 to 90 cm dbh depending on the species being assessed) is provided for each Ecological Vegetation Class within each Bioregion and the site ‘condition score’ is dependent on the proportion of that number present on the site. Stem densities of younger cohorts of trees are not used for the condition assessment. A benchmark for the percentage canopy cover for tree and understorey species has been determined and the ‘site condition’ calculated from this (DSE 2004).
80
There are advantages in using stem densities as an indicator of vegetation density for vegetation management procedures to be used by a wide range of land managers. They are readily assessed and understood by land managers, many of whom have a great deal of trouble comprehending and measuring canopy cover values and they can be readily translated into management protocols. The disadvantages are that the growth rates of stems vary with local factors such as forest type and management history, climatic conditions and fire history. The most appropriate way of overcoming these disadvantages is to use a combination of stem density and size (dbh) when establishing benchmarks and thinning protocols. What stem size classes are appropriate for this purpose? The definition of a ‘stem’ in the Plantations and Reafforestation (Code) Reg 2001 is one that is greater than or equal to 20 cm dbh. Suitable classifications could include:
1. Regrowth (<20cm), hollows developing (20-30cm), with hollows (30-80cm) and >80cm; or
2. Broad divisions such as regrowth and mature trees. The selection of a preferred standard for collection and analysis of stem density data must also reflect faunal habitat requirements. The first of these two classifications is more valuable for this purpose. But the question needs to be asked: Are stem densities an appropriate measure for ‘vegetation quality’ and a condition benchmark (Oliver et al. 2002)? Stem density is an easily measured structural element which allows the development of quantifiable thinning protocols but these do need to incorporate post European disturbance history and an understanding of the natural processes driving each community. Ecosystem diversity and landscape and habitat patchiness must be retained. While the definition of benchmarks for the NSW management tool does seek to incorporate the range of variability present in each vegetation class this may not always be evident on the ground. The successional stage and disturbance history of the vegetation being assessed also needs to be determined. For coastal forests it would be appropriate to separate ‘candidate old growth forest’ from logged and managed forests as suggested by the Richmond and Manning Regional Vegetation Committees when determining management prescriptions. Other distinctions include ‘derived’ versus ‘natural’ communities and ‘early regeneration’ versus ‘mature’ communities. Some communities also persist in a particular successional state as a result of imposed management strategies, for example the problem of invasive scrub. The benchmarks, as defined, reflect a climax community and are not necessarily inclusive of all successional stages. 4.4 Development of stem density benchmarks and thinning protocols 4.4.1 Stem Densities Plant species or communities with sufficient data and understanding of their ecological status are limited but include Cypress Pine, River Red Gum, Coolibah/Black Box and Victorian box-ironbark woodlands. Thinning prescriptions for areas of dense regeneration need to take the landscape and temporal parameters into account (Windsor 2000). In this section, benchmark values have not been
81
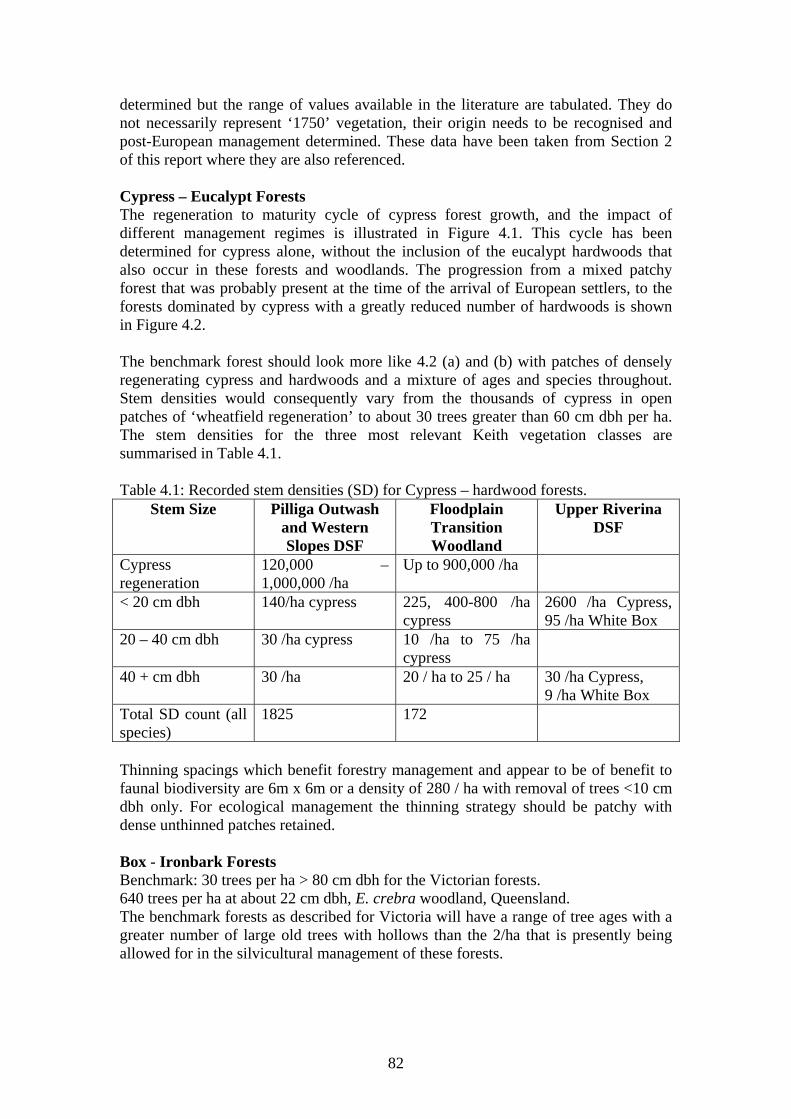
determined but the range of values available in the literature are tabulated. They do not necessarily represent ‘1750’ vegetation, their origin needs to be recognised and post-European management determined. These data have been taken from Section 2 of this report where they are also referenced. Cypress – Eucalypt Forests The regeneration to maturity cycle of cypress forest growth, and the impact of different management regimes is illustrated in Figure 4.1. This cycle has been determined for cypress alone, without the inclusion of the eucalypt hardwoods that also occur in these forests and woodlands. The progression from a mixed patchy forest that was probably present at the time of the arrival of European settlers, to the forests dominated by cypress with a greatly reduced number of hardwoods is shown in Figure 4.2. The benchmark forest should look more like 4.2 (a) and (b) with patches of densely regenerating cypress and hardwoods and a mixture of ages and species throughout. Stem densities would consequently vary from the thousands of cypress in open patches of ‘wheatfield regeneration’ to about 30 trees greater than 60 cm dbh per ha. The stem densities for the three most relevant Keith vegetation classes are summarised in Table 4.1. Table 4.1: Recorded stem densities (SD) for Cypress – hardwood forests.
Stem Size Pilliga Outwash and Western Slopes DSF
Floodplain Transition Woodland
Upper Riverina DSF
Cypress regeneration
120,000 – 1,000,000 /ha
Up to 900,000 /ha
< 20 cm dbh 140/ha cypress 225, 400-800 /ha cypress
2600 /ha Cypress, 95 /ha White Box
20 – 40 cm dbh 30 /ha cypress 10 /ha to 75 /ha cypress
40 + cm dbh 30 /ha 20 / ha to 25 / ha 30 /ha Cypress, 9 /ha White Box
Total SD count (all species)
1825 172
Thinning spacings which benefit forestry management and appear to be of benefit to faunal biodiversity are 6m x 6m or a density of 280 / ha with removal of trees <10 cm dbh only. For ecological management the thinning strategy should be patchy with dense unthinned patches retained. Box - Ironbark Forests Benchmark: 30 trees per ha > 80 cm dbh for the Victorian forests. 640 trees per ha at about 22 cm dbh, E. crebra woodland, Queensland. The benchmark forests as described for Victoria will have a range of tree ages with a greater number of large old trees with hollows than the 2/ha that is presently being allowed for in the silvicultural management of these forests.
82

Grassy Eucalypt Woodlands Western Slopes Grassy Woodlands Benchmark: 30-40 large trees per ha.
At present there is little regrowth and few young trees. Grey Box Woodlands Floodplain Transition Woodlands Benchmark: 40 large trees per ha. Table 4.2: Recorded stem densities for Grey Box woodlands in northern Victoria DBH Saplings 11 - 30 cm 30 – 70 cm >70 cm 46 – 65 cm Stem Density /ha
0-860 17 – 517 18 - 111 7 - 36 > 400 (Qld)
Observations from Beadle (1948) indicate spatial variation in the density of the tree layer of the community. Poplar Box Open Woodlands Most of the studies that have provided these stem densities were designed to determine the optimum thinning levels to maximise grass cover for grazing. These woodlands had been heavily grazed for probably 100 years and as this had significantly modified the native vegetation communities the stem densities are unlikely to represent 1750 benchmarks. The densities of these production woodlands are listed in Table 4.3. Table 4.3: Tree densities from grazed Poplar Box Woodlands in NSW and Queensland Keith Vegetation Class Tree Density /ha NSW Tree density /ha Qld North-west Floodplain Woodlands
109 170
Floodplain Transition Woodlands
50, 3 - 180 100
Western Peneplain Woodlands
150, 45, average 100, 20 – 30 mature trees 36 trees + 4,800 shrubs
200-500 (Tallwood)
Brigalow Clay Plain Woodlands Most of the stem densities for this vegetation community are also from altered communities that have been managed for grazing. There is also some data from the Brigalow Research Station in Queensland which is more likely to represent a benchmark condition. This is a Brigalow – Silver-leafed Ironbark community in which the density of Brigalow had vastly increased within a period of 22 years while the ironbark density had remained the same. The change in the 22 year period for both species in two plots is presented in Table 4.4. Table 4.4: Stem densities of Brigalow and Silver-leafed Ironbark in the same plot sampled 22 years apart. Date Acacia harpophylla Eucalyptus melanophloia 1968 Plot 1: 725 / Plot 2: 0 Plot 1: 125 / Plot 2: 50 1990 Plot 1: 1125 / Plot 2: 550 Plot 1: 100 / Plot 2: 50
83

Self thinning was also observed in which the sucker density was halved in a period of 30 years from 28000/ha 9 months after burning. Other stem densities for possible benchmark communities are:
• 310 to 325 / ha (‘intact’ Brigalow). • 530 /ha with Poplar Box - some open woodlands with 270 /ha. • Mature Brigalow stands: 4-6 thousand stems /ha (about half of these were >2.5
cm dbh) Coolibah – Black Box Woodlands Germination in these communities is driven by the occurrence of flood events, producing an episodic cycle of regeneration. Inland Floodplain Woodlands The stem densities and thinning strategies determined by Maher (1995) are a sound basis for the development of a benchmark for the Inland Floodplain Woodlands with the natural thinning curve being based on the flood method of aging Coolibah and Black Box. The data are, however, based on a limited range of sites, assume that all trees in each plot germinated at the same time and age estimates are accurate. This natural cycle of succession is illustrated in Figure 4.3. Tree densities:
Post 1970’s flood (20 year old trees): Site with highest density - 2900 Coolibah per ha (1913 live stems / ha + 975 dead stems /ha);
Plots dominated by trees germinated by the 1950’s flood (45 year old trees): Mean 194 (range 128 – 320) stems / ha
Plots with trees from the 1890 flood: 84/ha and 82/ha in addition to 60 River Cooba / ha.
The density of trees germinated before 1890 is about 2/ha. Densities also vary from an open woodland to a closed canopy in narrow belts separated by small treeless areas. The thinning protocol preferred by Maher (1995) is:
No thinning within 500 m of major watercourses, all trees with large hollows (>10cm wide and >20cm deep) to be retained, all trees with mistletoe to be retained, average distance between stems to be a maximum of 25m (approx 20 trees/ha > 40 years old), all treated trees to be left standing;
Density of live coolibah/black box after thinning to reflect pre-thinning density (a percentage based reduction system), at least 50% of trees with small hollows (>3cm wide and >10cm deep, usually the larger trees), strips 250m either side of floodrunners unthinned, 50% of woodland unthinned (preference to heavily channellised areas);
No thinning within 200m of relict floodplain dunes or 500m of wetlands and connected with corridors, associated tree species to be retained.
84

Inland Riverine Forests Dense sapling growth is also produced by flood events in the Black Box communities that occur in the slightly drier, more elevated parts of the Inland Riverine Forests (Figure 4.4).
Regeneration (>5cm high to 20cm dbh): Varied from 331/ha to 39/ha between the different Black Box communities.
Inland Riverine Forests (River Red Gum Forests and Woodlands) The density of River Red Gums varies substantially within this vegetation class, from narrow bands along watercourses to tall forests and extensive woodlands (Figure 4.4). With such a degree of variation in stem density, benchmarks for trees >20cm dbh would need to be developed for each vegetation community. Stem densities for regeneration have been more frequently collected. As for Coolibah and Black Box communities, germination in the Red Gum communities is driven by flood events, producing an episodic cycle of regeneration.
Trees >80 cm dbh: 15/ha (Victorian Floodplain Riparian Woodland benchmark)
Trees >90 cm dbh: 20/ha (Victorian Murray Fans Bioregion benchmark) Trees >80 cm dbh: >10 /ha to 1/ha (Murrumbidgee management area) ‘Old non-merchantable timber’: 20/ha 40 – 50 cm dbh: 17.5/ha Sapling germination: 5,000 /ha Regeneration (>5cm high to 20cm dbh): Varied from 957/ha to 185/ha
between the different River Red Gum communities Thinning of young trees and removal of ‘unmerchantable’ timber has been part of the forest management strategy of these forests along the Murray River since the 1890’s. Thinning prescriptions developed for silvicultural management: trees are thinned when 20-30 cm dbh to 170 – 220 crop trees per ha. Sub-Tropical Rainforest The Big Scrub (5 locations)
Historical densities: > 30 – 40 cm dbh: 123.8 trees / ha (range 32 – 248) Extant tree densities:
• >10 cm dbh: 320 – 540 stems/ha • >30 cm dbh: 140 – 280 stems/ha • >40 cm dbh: 80 – 180 stems/ha
Barrington Tops
Trees, saplings and shrubs: 19,156 (13,043 – 25,986) / ha. Wet Sclerophyll Forest North Coast Wet Sclerophyll Forest
40 to 65 trees per ha. Southern Escarpment Wet Sclerophyll Forest
22 hollow bearing trees per ha in unlogged forest 3 hollow bearing trees per ha in logged forest
85
Other Vegetation Classes Insufficient data has been collated to determine stem density benchmarks for any further Keith (2004) Vegetation Classes. Of the stem densities that have been collated, it has most frequently been from only one area or there is a ten-fold variation in stem densities between studies. This is especially the case for the coastal forests and probably results from aggregation of both species and size classes. The mallee communities create an added element of complication with the number of stems per tree in these multi-stemmed species varying in addition to the variation in density of individual trees between species and sites. 4.4.2 Ecological Thinning Parks Victoria (2004) is developing an ecological management strategy which is designed to maintain a mosaic of box – ironbark forest types in terms of species and age composition. By doing this they hope to provide a diversity of habitats for the long term protection of endemic and characteristic fauna of these forests. At this stage it is only being implemented as a 20 year trial in a small area which will investigate whether manipulating the structure of older growth forest using ‘ecological thinning’ will expedite the development of tree hollows, woody debris on the ground and habitat patchiness required for the survival of many of the rare and threatened species that depend on these systems. Self thinning through time would reduce the stem density resulting from mass germination events but older trees with hollows and other necessary habitat elements have been severely reduced in abundance within the forest. By reducing stem densities, the hypothesis is that the growth rate of trees will increase and the regeneration gap between younger trees and hollow trees will be reduced. 4.5 Conclusion and Recommendations The data available for establishing stem density benchmarks in the Keith (2004) vegetation classes of New South Wales are limited and variable in detail and extent. This data base could be expanded with the collation of data from permanent growth plots established by NSW Forestry and vegetation plot data from surveys by NPWS (DEC data base) and DIPNR and other studies such as Seddon et al. (2002). The data from these plots will need to be carefully assessed in terms of their disturbance history. Plots for NPWS surveys are likely to be from sites with a less disturbed history while the majority of survey plots from DIPNR are frequently from pre-clearing assessments of heavily disturbed sites (T. Mazer, pers. comm.). In addition, if canopy cover estimates could be converted into an estimated stem density, the database could be expanded significantly and enable earlier observational data to be included. If all the fundamental requirements for thinning to improve or maintain environmental (including biodiversity) outcomes are to be met, thinning protocols will need to be detailed and complex, as demonstrated by the thinning strategies proposed by Maher (1995) and the Regional Vegetation Committees. The strategies will need to address the following issues and conditions:
86
• Thinning will modify tree densities within a vegetation community without changing the overall structural formation of the community (e.g. a woodland should not become an open woodland).
• Thinning strategies should vary between vegetation classes and between each size class of trees. In particular, the retention of all trees >30-35 cm dbh should be recommended (i.e. no thinning of trees above that size). This would reduce the loss of habitat for arboreal vertebrates and help to reduce the regeneration gap of trees required to replace the large old hollow trees that are senescent or have already been removed from the landscape. Conversely, the very dense stands of small regenerating trees (e.g. cypress, River Red Gum) could probably be thinned to benefit both biodiversity and production.
• Relative proportions of tree species (as defined by a benchmark) will need to be retained.
• Thinning protocols need to ensure that remaining habitat is uneven in age and spacing in order to maximise faunal habitats as well as ensuring the survival of plant diversity. A proportion should be left unthinned.
• There should be little or no disturbance of the ground cover, preferably with stumps left in the ground.
• Landscape variation needs to be incorporated into thinning protocols e.g. there will be different benchmarks for parts of a vegetation community with high conservation areas, threatened species habitat protection, protection of riparian zones etc.
It will be critical to know the point at which thinning becomes clearing when determining stem density benchmarks. This ‘thin line between thinning and clearing will be determined by the fauna – when its composition changes. That can only be determined by monitoring, preferably using manipulative experimentation.’ (Maher 1995).
87

Figure 4.1: Cycles of regeneration and growth of White Cypress Pine (after Allan 1997). Natural thinning and senescence continue to occur with the added impact of irregular fires and forest management practices.
88

Figure 4.2: Changes in the structure of Cypress and Eucalypt forests as a result of European management.
89

Figure 4.3: Structural change in Coolibah woodlands as a result of recruitment after flood events followed by self-thinning (after Maher 1995).
90

Figure 4.4: Profile of change in River Red Gum vegetation communities illustrating the variation from narrow bands along watercourses to floodplain forests and the occurrence of Black Box communities (from Margules Report 1990, p19).
91

92

References Adamson, D. A. and Fox, M. D. (1982). Change in Australasian Vegetation since
European Settlement. In A History of Australasian Vegetation (ed J. M. B. Smith), McGraw Hill Sydney.
Allen M. R. (1998). Forest History Projects for State Forests of New South Wales. Case studies of three cypress pine forests in the Lachlan and Bogan River catchments, Forbes Forestry District on Back Yamma, Euglo South and Strahorn State Forests. Published by State Forests of NSW.
Allen, R. J. (1983). Tree decline in western New South Wales: fact or fiction? Australian Forestry 46: 303-310
Austin, M. P. (1978) Vegetation. Ch 5 In Land Use on the South Coast of New South Wales. A study in Methods of Acquiring and Using Information to Analyse Regional Land Use Options. Vol 2 Bio-physical background studies. (ed R. H. Gunn). CSIRO
Austin, T. P. (1918). Birds of the Cobborah district. Australian Zoologist 1(5): 109-137.
Ayers, D., Seddon, J., Briggs, S., Doyle, S. and Gibbons P. (in prep). Interin Benchmarks for the Biometric Tool. Department of Environment and Conservation, NSW.
Beadle, N. C. W. (1948). The Vegetation and Pastures of Western New South Wales with Special Reference to Soil Erosion. Dept of Conservation NSW. Govt. Printer, Sydney.
Beetson, G. R., Walker, P. J., Purdie, R. and Pickard, J. (1980). Plant communities of the poplar box (Eucalyptus populnea) lands of eastern Australia. Australian Rangelands Journal 2:1-30
Bennett, A. F. (1993) Fauna conservation in box and ironbark forests: a landscape approach. Victorian Naturalist 110:15-23
Bennett, A. F. and Ford, L. A. (1997). Land use, habitat change and the conservation of birds in fragmented rural environments: a landscape perspective from the Northern Plains, Victoria, Australia. Pacific Conservation Biology 3:244-61
Bennett, A. F., Lumsden, L. F. and Nichols, A. O. (1994). Tree hollows as a resource for wildlife in remnant woodlands: spatial and temporal patterns across the northern plains of Victoria, Australia. Pacific Conservation Biology 1:222-235.
Benson, D. H. (1986). The vegetation of the Gosford and Lake Macquarie 1:100,000 map sheet. Cunninghamia 1:467-490. [Uses Specht 1972 classification]
Benson, D. H. (1992). The natural vegetation of the Penrith 1:100,000 map sheet. Cunninghamia 2: 541-596.
Benson, J. (1991). The effect of 200 years of European settlement on the vegetation and flora of New South Wales. Cunninghamia 2:343-370.
Benson, J. (1999). Setting the Scene. The Native Vegetation of New South Wales. Native Vegetation Advisory Council of New South Wales, Background paper No 1. 40pp
Benson, J. (ND) Conservation of flora in western New South Wales. National Parks Journal.
Benson, J. S. and Ashby, E. M. (2000). Vegetation of the Guyra mapsheet, New England Bioregion, NSW. Cunninghamia 6: 747-872.
Benson J. S. and Redpath, P. A. (1997). The nature of pre-European native vegetation in south-eastern Australia: a critique of Ryan, D. G., Ryan, J. R. and Starr, B.
93

J. (1995) The Australian Landscape – Observations of Explorers and Early Settlers. Cunninghamia 5(2): 285-328.
Bradstock, R. A. and Cohn, J. S. (2002). Fire Regimes and Biodiversity in Semi-arid Mallee Ecosystems. In Flammable Australia: The Fire Regimes and Biodiversity of a Continent (ed. R. A. Bradstock, J. E. Williams, and A. M. Gill). pp. 238-258 Cambridge University Press, Cambridge.
Braithwaite L. W. (1983). Studies on the arboreal marsupial fauna of eucalypt forests being harvested for woodpulp at Eden, New South Wales. I. The species and distribution of mammals Australian Wildlife Research 10:219-29.
Braithwaite, L. W., Dudzinski, M. L. and Turner, J. (1983). Studies on the arboreal marsupial fauna of eucalypt forests being harvested for woodpulp at Eden, New South Wales. II. Relationship between the fauna density, richness and diversity, and measured variables of the habitat. Australian Wildlife Research 10: 231-47.
Bren, L. (1990). Red Gum Forests. Ch 14, pp231-244 In: The Murray Eds: N. Mackay and D. Eastburn. MDBC Canberra.
Bren, L. J. (1992). Tree invasion of an intermittent wetland in relation to changes in the flooding frequency of the River Murray, Australia. Aust. J. Ecology 17:395-408.
Briggs S. V. and Tooth, I. (1994). Terrestrial birds in uncropped and cropped lakebeds and surrounding woodlands. Ch 5 In Ecological Management of Lakebed Cropping. (ed. S. V. Briggs)
Brooker, M. I. H. and Kleinig, D. A. (1999). Field Guide to Eucalypts. South-eastern Australia. Volume 1. Second Edition. Bloomings Books Australia.
Brooker, M. I. H., Slee, A. V., Connors, J. R. and Duffy, S. M. (2002). EUCLID: Eucalypts of Southern Australia (Electronic Resource). CSIRO Publishing.
Burgess, I. P., Floyd, A., Kikkawa, J. and Pattenmore, V. (1975). Recent Developments in the Silviculture and Management of Sub-tropical Rainforest in New South Wales. In Managing Terrestrial Ecosystems (ed J Kikkawa and H. A. Nix). pp 74-84 Vol 9 Proceedings of the Ecological Society of Australia.
Burrows, G. E. (1999). A survey of 25 remnant vegetation sites in the south western slopes, New South Wales. Cunninghamia 6: 283-314.
Calder, M. (1993). The box and ironbark communities of the northern slopes of Victoria. Victorian Naturalist 110: 4-6.
Cambage, R. H. (1900a). Notes on the botany of the interior of New South Wales. Part I – From the Darling River at Bourke to Cobar. Proceedings Linnean Society of NSW
Cambage, R. H. (1900b). Notes on the botany of the interior of New South Wales. Part II – From Cobar to the Bogan River above Nyngan. Proceedings Linnean Society of NSW 25:708-20
Cambage, R. H. (1900c). Notes on the botany of the interior of New South Wales. Part III – From Bogan to Mount Hope. Proceedings Linnean Society of NSW
Cambage, R. H. (1900d) Notes on the botany of the interior of New South Wales. Part IV – From Mount Hope to Parkes. Proceedings Linnean Society of NSW ??:317-335
Cambage, R. H. (1900). Notes on the botany of the interior of New South Wales. Part V – From Parkes to Marsden. Proceedings Linnean Society of NSW ??:685-702
94

Cameron, P. (in prep). Actively Managing for Biodiversity. Some observations of the benefits of thinning cypress stands and discussion of management options for western forests and woodlands.
Campbell, D. (1994). Clearing and cultivation in the Western Division. In. Future of the Fauna of Western New South Wales. (ed. D. Lunney, S. Hand, P. Reed, and D. Butcher), Transactions of the Royal Zoological Society of New South Wales. Sydney
Cox, J. D. and Hamilton, A. G. (1889). A list of birds of the Mudgee District, with notes on their habits, etc. Proceedings of the Linnean Society of NSW. 2 (4): 395-424.
Cox, S. J., Sivertson, D. P., and Bedward, M. (2001). Clearing of native woody vegetation in the New South Wales northern wheatbelt: extent, rate of loss and implications for biodiversity conservation. Cunninghamia 7(1): 101-155.
Croft, M., Goldney, D. and Cardale, S. (1997). Forest and woodland cover in the central western region of New South Wales prior to European settlement. Pp 394-406 In Conservation Outside Nature Reserves. (ed. P. Hale and D. Lamb). Conference Proceedings, University of Qld, Feb 5-8-, 1996.
Curby, P. (1997). Forest History Project for State Forests of New South Wales. Narrandera Study on Buckingbong, Gilenbah and Matong State Forests. Published by State Forests of NSW.
Cutten, J. L. and Hodder, M. W. (2002). Scattered Tree Assessment. Streamlining guidelines for assessment and rural industry extension. Report prepared for SA dept Industry, Science and Tourism.
Date, E. M. and Paull, D. C. (2000). Forestry in Western New South Wales. Fauna Survey on the North-west Cypress / Ironbark Forests. State Forests of New South Wales NSW Government.
Denny, M. (1992). Historical and ecological study effects of European settlement on inland New South Wales. A report for the Nature Conservation Council of New South Wales to the Heritage Council of New South Wales.
Department of Natural Resources and Environment, Victoria (1998). Box-Ironbark Timber Assessment Project. Bendigo Forest Management Area and Pyrenees Ranges. Forests Service Technical Report 98-3. 40pp
Doherty, M. (1998). The Conservation Value of Regrowth Native Plant Communities: A Review. Final report. Report prepared for the NSW Scientific Committee. CSIRO Australia.
Donovan, P. (1997). A History of the Millewa Group of River Red Gum Forests. Report prepared for State Forests of New South Wales, Pennant Hills Sydney NSW.
Douglas, M. (1997). Forests of East Gippsland before the Europeans. Ch 19 pp232-246. In Australia’s Ever Changing Forests III. Proceedings of the Third National Conference on Australian Forest History. Ed by J. Dargavel. CRES Canberra
DSE (2004). Native Vegetation: Sustaining a Living Landscape. Vegetation Quality Assessment Manual – Guide lines for applying the habitat hectares scoring method. Version 1.3. Department of Sustainability and Environment, Victoria www.dse.vic.gov.au
Fallding, H. and Benson, J. S. (1985). Natural vegetation and settlement at Macquarie Pass, Illawarra Region NSW. Cunninghamia 1:255-312 [vegetation density expressed as dense, sparse etc, no stem densities]
95
Fensham, R. J. and Holman, J. E. (1998). The use of the land survey record to assess changes in vegetation structure. A case study from the Darling Downs, Queensland, Australia. Rangelands Journal 20:132-42.
Fisher, H. J. (1985) The structure and floristic composition of the rainforest of the Liverpool Range, New South Wales, and its relationships with other rainforests. Australian Journal of Ecology 10: 315-25.
Forestry Commission of NSW (1984). Management Plan for Griffith Management Area.
Forestry Commission of NSW (1986). Management Plan for the Murrumbidgee Management Area.
Fox, M. D. (1990). Composition and richness of New South Wales mallee. In The Mallee Lands: A Conservation Perspective. (ed. J. C. Noble, P. J. Joss and G. K. Jones). CSIRO Melbourne.
Fraser, L. and Vickery, J. W. (1938). The ecology of the upper Williams River and Barrington Tops districts. II The Rainforest Formations. Proceedings of the Linnean Society of NSW 63: 139-84
Freudenberger, D., Noble, J. and Morton, S. (1997). A comprehensive, adequate and representative reserve system for the Southern Mallee of NSW: Principles and Benchmarks. CSIRO, Canberra.
Gibbons, P., Ayers, D. Seddon, J., Doyle, S. and Briggs, S. (2005) Biometric Version 1.8. A Terrestrial Biodiversity Assessment Tool for the NSW Property Vegetation Plan Developer: Operations Manual. Department of Environment and Conservation, NSW http://www.nationalparks.nsw.gov.au/npws.nsf/Content/biometric_tool
Gibbons, P. and Lindenmayer, D. B. (1997). Conserving hollow-dependant fauna in timber-production forests. Environmental Heritage Monograph Series No 3. Forest Issues 2. NSW NPWS.
Gill, A. M. and Catling, P. C. (2002). Fore regimes and biodiversity of forested landscapes of southern Australia. In Flammable Australia: The Fire Regimes and Biodiversity of a Continent (ed. R. A. Bradstock, J. E. Williams, and A. M. Gill). pp 351-369 Cambridge University Press, Cambridge.
Goldingay, R. L. and Eyre, T. J. (2002). Structural habitat preferences of the feathertail glider on the mid-south coast of New South Wales. In The Biology of Australian Possums and Gliders. (ed. R. L. Goldingay and S. M. Jackson). pp 290-97 Surrey Beatty & Sons, Chipping Norton, Sydney, Australia.
Hall, N., Johnson, R. D. and Chippendale, G. M. (1975). Forest Trees of Australia. AGPS Canberra
Harrington, G. (1979). Estimation of above-ground biomass of trees and shrubs an a Eualyptus populnea F. Muell. woodland by regression of mass on trunk diameter and plant height. Australian Journal Botany 27: 135-43.
Harrington, G. N. and Johns, G. G. (1990). Herbaceous biomass in a Eucalyptus savanna woodland after removing trees and/or shrubs. Journal of Applied Ecology 27: 775-787.
Hobbs, R. (2002). Fire regimes and their effects in Australian temperate woodlands. In Flammable Australia: The Fire Regimes and Biodiversity of a Continent (ed. R. A. Bradstock, J. E. Williams, and A. M. Gill). pp305-326 Cambridge University Press, Cambridge.
Hobbs, R. and Yates, C. J. (2000). Temperate Eucalypt Woodlands in Australia: Biology, Conservation, Management and Restoration. Surrey Beatty and Sons, Chipping Norton NSW.
96
Horne, R. (1990a). Stand height response following variable spacing of wheatfield white cypress pine regeneration in New South Wales. Australian Forestry 53: 47-54
Horne, R. (1990b). Early espacement of wheatfield white cypress pine regeneration: The effect on secondary regeneration, limb size, and stand merchantability. Australian Forestry 53: 160-167
Horne, R. and Robinson, G. (1987). White cypress pine in NSW: growth patterns and optimal thinning regimes for 60 to 08 year old stands. Australian Forestry 50: 216-223
Hunter, J. T. and Clarke, P. J. (1998). The vegetation of granite outcrop communities on the New England batholith of eastern Australia. Cunninghamia 5: 547-618. [Summed abundances within each community]
Johns, G. G. (1981). Hydrological processes and herbage production in shrub invaded Poplar Box (Eucalyptus populnea) woodlands. Australian Rangelands Journal 1981 pp 45-55.
Johnson, R. W. (1997). The impact of clearing on brigalow communities and consequences for conservation. In Conservation of Nature Reserves. (ed. P. Hale and D. Lamb) Ch 67 pp359-363 Centre for Conservation Biology, The University of Queensland.
Kavanagh, R. P., Shields, J., Recher, H. F. and Rohan-Jones, W. G. (1985). Bird populations of a logged and unlogged forest mosaic at Eden, NSW. In Birds of Forests and Woodlands: ecology, conservation and management. (ed. A Keast, H. Recher, H. Ford and D. Saunders). pp 273-81. Royal Australasian Ornithologists Union/Surrey Beatty & Sons, Chipping Norton.
Keatley, M. R., Hudson, I. l. and Fletcher, T. D. (1999). Flowering records in Victorian box-ironbark forests. In Australia’s Ever Changing Forests IV. (ed. J Dargavel and B. Libbis) Ch 22, pp311-328. Proceedings of the Fourth National Conference on Australian Forest History. Published by CRES ANU, Canberra.
Keith, D. (2004). Ocean Shores to Desert Dunes. The Native Vegetation on New South Wales and the ACT. Department of Environment and Conservation (NSW).
King, G. C. (1985). Natural regeneration in wet sclerophyll forest with an overstorey of Eucalyptus microcorys, E. saligna and Lophostemon confertus. Australian Forestry 48: 54-62.
Knott, J. (1995). White Cypress Pine Thinning Trials of the Western Region. Overview of the research program. Detailed findings from individual trials. Thinning Strategies to Optimise Productivity. Research Paper N0. 27 State Forests of NSW
Lindenmeyer, D. B. and Gibbons, P. (2004). On charcoal, the increased intensity of logging and a flawed environmental assessment process In The Conservation of Australia’s Forest Fauna (second edition) (ed. D. Lunney). pp 56 – 62 Royal Zoological Society of New South Wales, Mosman, NSW Australia.
Lunney, D. and Leary, T. (1988). The impact on native mammals of land-use changes and exotic species in the Bega district, New South Wales, since settlement. Australian Journal of Ecology 13:67-92.
Lunt, I. D. (1991). Management of remnant lowland grasslands and grassy woodlands for nature conservation: a review. Victorian Naturalist 108: 56-66.
97
Lunt, I. D. (1995). European management of remnant grassy forests and woodlands in south-eastern Australia – past, present and future? Victorian Naturalist 112: 239-249.
Lunt, I. D. (1997). Tree densities last century on the lowland Gippsland plain, Victoria. Australian Geographical Studies 35:342-348.
Lunt, I. D. (1998). Two hundred years of land use and vegetation change in a remnant coastal woodland in southern Australia. Australian Journal Botany 46:629-647
Lunt, I. D. (2002). Grazed, burnt and cleared: how ecologists have studied century-scale vegetation changes in Australia. Australian Journal Botany 50: 391-407.
Lunt, I., Parker, D. and Robinson, W. (2001). Assessing changes in cypress pine forests from old stumps. In Perfumed Pineries Environmental History of Australia’s Callitris Forests. (ed. J. Dargavel, D. Hart and B. Libbis). pp 56 – 62 Published by Centre for Resource and Environmental Studies, ANU Canberra.
Maher, M. (1995). A thin line: Should densities of Coolibah and Black Box be controlled in the Western Division of New South Wales. Report to the NSW Department of Conservation and Land Management.
Margules Report (Margules and Partners, P and J Smith Ecological Consultants, Dept Cons, Forests & Lands) (1990) Riparian Vegetation of the River Murray. Report prepared for the Murray-Darling Basin Commission.
Martin, T. G., Best, K. M., McIntyre, S., McIvor, J. G. and MacLeod, N. D. (2000). Four Grazing Properties in Southeast Queensland: pattern of land use and ecological status. CSIRO Tropical Agriculture: Brisbane.
McAlpine, C. A., Fensham, R. J. and Temple-Smith, D. E. (2002). Biodiversity conservation and vegetation clearing in Queensland: principles and thresholds. Rangelands Journal 24: 36-55
McIntrye, S. (2002) Trees. In Managing and Conserving Grassy Woodlands (ed. S. McIntyre, J. G. McIvor and K. M. Heard). Chapter 5 pp 79-110. CSIRO Publishing, Australia.
McDonald, R. C., Isbell, R. F., Speight, J. G., Walker, J. and Hopkins, M. S. (1990). Australian Soil and Land Survey Field Handbook. Second Edition. Dept. Primary Industries and Energy and CSIRO Australia.
McIntyre, S., McIvor, J. G. and Heard K. M. (2002). eds. Managing and Conserving Grassy Woodlands CSIRO Publishing, Australia.
McIvor, J. G. and McIntrye, S. (2002). Understanding Grassy Woodland Ecosystems. In Managing and Conserving Grassy Woodlands (ed. S. McIntyre, J. G. McIvor and K. M. Heard). Chapter 1 pp 1-23 CSIRO Publishing, Australia.
McRae, R. D. H. and Cooper, M. G. (1985). Vegetation of the Merriwa area, NSW. Cunninghamia 1: 351-370 [vegetation density expressed as dense, sparse etc, no stem densities]
Mills, K. (1988). The clearing of the Illawarra rainforests: Problems in re-constructing pre-European vegetation patterns. Australian Geographer 19: 230-240.
Mitchell, P. B. (1991) Historical perspectives on some vegetation and soil changes in semi-arid New South Wales. Vegetatio 91: 169-182.
Morris, E. C. and Myerscough, P. J. (1988). Survivorship, growth and self-thinning in Banksia ericifolia. Australian Journal Ecology 13: 181-189
Myerscough, P. J. and Carolin, R. C. (1986). The vegetation of the Eurunderee sand mass headlands and previous islands in the Myall Lakes area, NSW. Cunninghamia 1: 399-466 [uses Specht 1972 structural classification]
98

Neldner, V. J. (1986). Vegetation of the Australian Mulga Lands. In The Mulga Lands. (ed P. S. Sattler). pp20-26. Royal Society of Queensland.
Newman, L. A. (1961). The Box-Ironbark Forests of Victoria, Australia. Forests Commission of Victoria, Melbourne.
Nicholson, D. (1997). Managing Cypress Pine on your Property. Booklet produced by State Forests of NSW for the North-wet Catchment Management Committee
Noble, J. C. (1997). The Delicate and Noxious Scrub CSIRO studies on the native tree and shrub proliferation in the semi-arid woodlands of eastern Australia. CSIRO Canberrra
Norris, E. H., Mitchell, P. B. and Hart, D. M. (1991) Vegetation changes in the Pilliga forests: a preliminary evaluation of the evidence. Vegetatio 91:209-218
Oliver, I., Smith, P. L., Lunt, I. And Parkes, D. (2002). Pre-1750 vegetation, naturalness and vegetation condition: what are the implications for biodiversity conservation? Ecological Management & Restoration 3:176-178
Oxley, John (1820). Journals of two expeditions into the interior of New South Wales Undertaken by Order of the British Government in the Years 1817-1818. With maps and views of the interior, or newly discovered country. Part II. John Murray, London.
Parke, D. and Lunt, I. D. (2000). Stand structure and recruitment patterns in Callitris-Eucalyptus woodland in Terrick Terrick National Park, Victoria. Victorian Naturalist 117: 207-213.
Parks Victoria (2004) Box-Ironbark Parks. Box-Ironbark Ecological Management Strategy and Ecological Thinning. http://www.parkweb.vic.gov.au
Paull, D. (2001). Stump count analysis of the pre-European Pilliga forests. In Perfumed Pineries. Environmental History of Australia’s Callitris Forests. (ed J. Dargavel, D. Hart, and B. Libbis). Published by Centre for Resource and Environmental Studies, ANU Canberra.
Pickard, J. and Norris, E. H. (1994). The natural vegetation of north-western New South Wales: notes to accompany the 1:1000000 vegetation map sheet. Cunninghamia 3:423-464.
Porteners, M. F. (1993). The natural vegetation of the Hay Plain. Booligal-Hay and Deniliquin-Bendigo 1:250,000 maps. Cunninghamia 3:1-122..[Uses Specht 1981 and Walker and Hopkins 1984 structural classifications]
Prober, S. M. and Brown, A. H. D. (1994). Conservation of the grassy white box woodlands: population genetics and fragmentation of Eucalyptus albens. Conservation Biology 8: 1003-13.
Pulsford, I. (1991). The history of disturbances in the white cypress pine (Callitris glaucophylla) forests of the lower Snowy River Valley, Kosciusko National Park. MSc Thesis. Australian National University, Canberra.
Pulsford, I. F., Banks, J. C. G. Hodges, L. (1993). Land Use History of the White Cypress Pine Forests in the Snowy Valley, Kosciusko National Park. In Australi’s Ever Changing Forests II, Proceedings of the Second National Conference on Australian Forest History. (ed. J. Dargavel and S. Feary). Ch 7 pp86-104. CRES Canberra
Recher, H. F., Allen, D. and Gowing, G. (1985). The impact of wildfire on birds in an intensively logged forest. In Birds of Forests and Woodlands: Ecology, Conservation and Management. (ed. A Keast, H. Recher, H. Ford and D. Saunders). pp 293-90. Royal Australasian Ornithologists Union/Surrey Beatty & Sons, Chipping Norton.
99

Reid, N. and Landsberg, J. (2000). Tree decline in agricultural landscapes: what we stand to lose. In Temperate Eucalypt Woodlands in Australia: biology, conservation, management and restoration. (ed. R. J. Hobbs and C. J. Yates). pp. 127-66. Surrey Beatty & Sons: Chipping Norton, NSW.
Robinson, D. (1993). Lest we forget to forge. Victorian Naturalist 110: 6-10 Robertson, J. A. and Young, N. D. (1976). Thinning Eucalyptus microcarpa
woodlands. Tropical Grasslands 10: 129-32 Rolls, E. C. (1981). A Million Wild Acres: 200 Years of Man and an Australian Forest
Thomas Nelson, Melbourne. Ryan, D. G., Ryan, J. R. and Starr, B. J. (1995). The Australian Landscape –
Observations of Explorers and Early Settlers. Murrumbidgee Catchment Management Committee: Wagga Wagga NSW.
Ryan, K., Fisher, M. and Schaeper, L. (1996). The natural vegetation of the St Albens 1:100,000 map sheet. Cunninghamia 4: 433-482.
Saunders, D. A., Hobbs, R. J. and Margules, C. R. (1991). Biological consequences of ecosystem fragmentation: a review. Conservation Biology 5: 18-32.
Seddon, J., Briggs, S and Doyle, S. (2002). Little River Catchment Biodiversity Assessment. A Report for the TARGET project. NPWS.
Shelly, D. (1998). Survey of vertebrate fauna and habitats in a cypress pine-ironbark forest in central-west New South Wales. Australian Zoologist 30:426-436
Sivertsen, D. (1993). Conservation of remnant vegetation in the box and ironbark lands of New South Wales. Victorian Naturalist 110: 25-29.
Sivertsen, D. P. and Metcalf, L. M. (1995). Natural vegetation of the southern wheat-belt (Forbes and Cargelligo 1:250 000 map sheet). Cunninghamia 4: 103-208.
Soderquist, T. R. (1999). Tree Hollows in the Box-Ironbark Forest. Analyses of ecological data from the Box-Ironbark timber assessment in the Bendigo forest management area and Pyrenees Ranges. Department of Natural Resources and Environment, Victoria. Forests Service Technical Reports 99-3.
Soderquist, T., Lumsden, L. and Bennett, A (1999) Size does matter. Large old trees in box-ironbark forests. Wildlife in box-ironbark forests , linking research and biodiversity management 5. Arthur Rylah Institute for Environmental Research, Heidelberg, Victoria.
Specht, R. L. (1970). Vegetation. In The Australian Environment. (ed. G. W. Leeper). pp 44-67, 4th edition. CSIRO and Melbourne University Press, Melbourne.
Specht, R. L. (1972). The Vegetation South Australia. 2nd Edition. Govt Printer: Adelaide.
Specht, R. L. (1981) Major vegetation formation in Australia. In: Ecological Biogeography of Australia. (ed A Keast). pp 163-298. Junk, The Hague.
Specht, R. L. and Specht, A. (1999). Australian Plant Communities. Dynamics of Structure, Growth and Biodiversity. Oxford University Press, Melbourne.
Spooner, P. G. and Lunt, I. D. (2004). The influence of land-use history on roadside conservation values in an Australian agricultural landscape. Australian Journal Botany 52: 445-458
Spooner, P., Lunt, I. and Robinson, W. (2002). Is fencing enough? The short-term effects of stock exclusion in remnant grassy woodlands in southern NSW. Ecological Management and Restoration 3: 117-126.
Spooner, P. G., Lunt I. D., Briggs S. V. and Freudenberger, D. (2004). Effects of soil disturbance from roadworks on roadside shrubs in a fragmented agricultural landscape. Biological Conservation 117: 393-406
100

State Forests of NSW (ND). Ecologically Sustainable Forest Management, Native Forest Silviculture Manual.
Stevens, H. (2001). Declining biodiversity and unsustainable agriculture production – common cause, common solution. Research Paper No 2 2001-02. Department of the Parliamantary Library, Information and Research Services
Stubbs, B. J. and Specht, A. (2002). Historical Records of Tree Density in the ‘Big Scrub’. Australia’s Ever Changing Forests V. Proceedings of the Fifth National Conference on Australian Forest History. (ed. J Dargavel, D. Gaughwin and B. Libbis). Ch 17 pp253-273. CRES Canberra.
Sturt, Charles (1833). Two Expeditions into the Interior of Southern Australia During the Years 1828, 1829, 1830, 1831. With Observations on the Soil, Climate and General Resources of the Colony of New South Wales. Smith, Elder & Co: London.
Traill, B. J. (1991). Box-Ironbark forests: tree hollows, wildlife and management. pp 119-123 in: Conservation of Australia’s Forest Fauna. (ed D. Lunney). Royal Zoological Society of NSW Sydney.
Traill, B. J. (1993). Forestry, birds, mammals and management in box and ironbark forests. Victorian Naturalist 110:11-14.
Tunstall, B. R., Torsell, B. W. R., Moore, R. M., Robertson, J. A. and Goodwin W. F. (1981). Australian Rangelands Journal 3:123-32.
Tunstall, B. R. and Walker, J. (1975). The Effect of Woodland Disturbance on Soil Water. In Managing Terrestrial Ecosystems (ed. J. Kikkawa and H. A. Nix). Vol 9 Proceedings of the Ecological Society of Australia.
Tzaros, C. (2005). Wildlife of the Box_Ironbark Country. CSIRO Publishing Melbourne Vic.
van der Ree, R and Bennett, A. F. (2001). Woodland remnants along roadsides: a reflection of pre-European structure in temperate woodlands? Ecological Management and Restoration 2:224-226.
van Kempen, E. (1997). A History of the Pilliga Cypress Pine Forests. Report for State Forests of NSW
Walker, J., Bullen, F. and Williams, B. G. (1993). Ecohydrological changes in the Murray-Darling Basin. I. The number of trees cleared over two centuries. Journal of Applied Ecology 30: 265-273.
Walker, J., Crapper, P. F. and Penridge, L. K. (1988). The crown-gap ratio (C) and crown cover: the field study. Australian Journal Ecology 13:101-108.
Walker, J. and Hopkins, M. S. (1984). Vegetation. Australian Soil and Land Survey Field Handbook (ed. R. C. McDonald, R. F. Isbell, J. G. Speight, J. Walker and M. S. Hopkins). pp 44-67. Inkata Press, Melbourne.
Walker, J., Robertson, J. A., Penridge, L. K. and Sharpe, P. J. H. (1986). Herbage response to tree thinning in a Eucalyptus crebra woodland. Australian Journal Ecology 11:135-140
Wellington, A. B. (1989). Seedling regeneration and the population dynamics of Eucalypts. In Mediterranean Landscapes in Australia. Mallee Ecosystems and their Management. (ed. J. C. Noble and R. A. Bradstock) Chapter 10 pp: 155-167 CSIRO, Australia.
Westbrooke, M. E., Miller J. D. and Kerr, M. C. K. (1998). The vegetation of the Scotia 1:100,000 mapsheet western NSW. Cunninghamia 5:665-684.
Western Lands Commission (WLC) (1969) Report of the Inter-departmental Committee on Scrub and Timber Regrowth in the Cobar-Byrock District and Other Areas of the Western Division of NSW.
101

Whalley, R. D. B. and Curtis, D. J. (1991). Natural regeneration of eucalypts on grazing lands on the northern tablelands of NSW, Australia. In: ivth International Rangeland Congress, Montpellier, France. Volume 1, pp. 581-4.
Whelan, R. J., Rodgerson, L., Dickman, C. R. and Sutherland, E. F. (2002). Critical life cycles of plants and animals: developing a process based understanding of population changes in fire prone landscapes. In Flammable Australia: The Fire Regimes and Biodiversity of a Continent (ed. R. A. Bradstock, J. E. Williams and A. M. Gill). pp 94-124 Cambridge University Press, Cambridge.
Wilson, B. A., Neldner, V. J. and Accad, A. (2002). The extent and status of remnant vegetation in Queensland and its implications for statewide vegetation management and legislation. Rangeland Journal 24: 6-35.
Wilson, N. (1989). River Red Gum in New South Wales. A review of landuse and management. Report Prepared for the Nature Conservation Council under NEGS grant No 30.
Windsor, D. M. (2000). A review of factors affecting regeneration of box woodlands in the Central Tablelands of New South Wales. In Temperate Eucalypt Woodlands in Australia. Biology, Conservation, Management and Restoration. (ed. R. J. Hobbs and C. Yates). Surrey Beatty & Sons Sydney.
Woinarski, J. C. Z. (1989). Broombush harvesting in southeastern Australia. In: Mediterranean Landscapes in Australia. Mallee Ecosystems and their Management. (ed. J. C. Noble and R. A. Bradstock). Chapter 25 pp: 362-378 CSIRO, Australia.
Woodgate, P. and Black, P. (1998). Forest Cover Changes in Victoria 1869-1987 Dept of Conservation Forests and Lands: Melbourne.
102
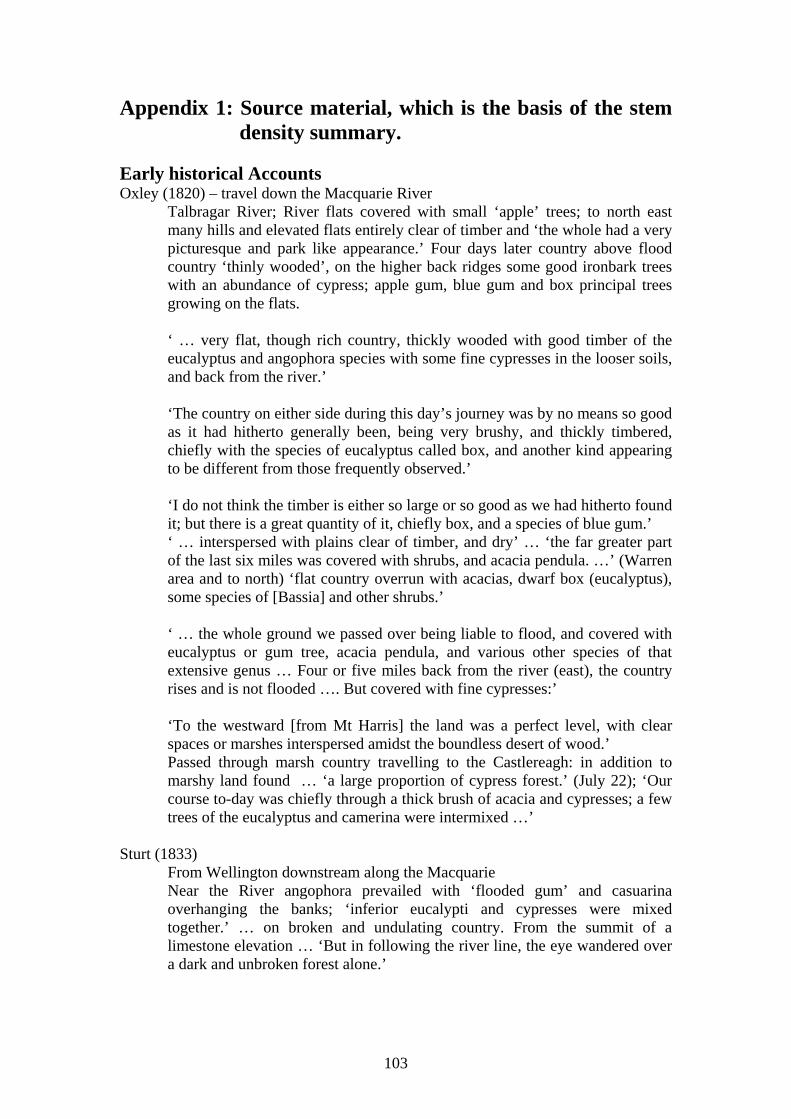
Appendix 1: Source material, which is the basis of the stem density summary.
Early historical Accounts Oxley (1820) – travel down the Macquarie River
Talbragar River; River flats covered with small ‘apple’ trees; to north east many hills and elevated flats entirely clear of timber and ‘the whole had a very picturesque and park like appearance.’ Four days later country above flood country ‘thinly wooded’, on the higher back ridges some good ironbark trees with an abundance of cypress; apple gum, blue gum and box principal trees growing on the flats. ‘ … very flat, though rich country, thickly wooded with good timber of the eucalyptus and angophora species with some fine cypresses in the looser soils, and back from the river.’ ‘The country on either side during this day’s journey was by no means so good as it had hitherto generally been, being very brushy, and thickly timbered, chiefly with the species of eucalyptus called box, and another kind appearing to be different from those frequently observed.’ ‘I do not think the timber is either so large or so good as we had hitherto found it; but there is a great quantity of it, chiefly box, and a species of blue gum.’ ‘ … interspersed with plains clear of timber, and dry’ … ‘the far greater part of the last six miles was covered with shrubs, and acacia pendula. …’ (Warren area and to north) ‘flat country overrun with acacias, dwarf box (eucalyptus), some species of [Bassia] and other shrubs.’ ‘ … the whole ground we passed over being liable to flood, and covered with eucalyptus or gum tree, acacia pendula, and various other species of that extensive genus … Four or five miles back from the river (east), the country rises and is not flooded …. But covered with fine cypresses:’ ‘To the westward [from Mt Harris] the land was a perfect level, with clear spaces or marshes interspersed amidst the boundless desert of wood.’ Passed through marsh country travelling to the Castlereagh: in addition to marshy land found … ‘a large proportion of cypress forest.’ (July 22); ‘Our course to-day was chiefly through a thick brush of acacia and cypresses; a few trees of the eucalyptus and camerina were intermixed …’
Sturt (1833)
From Wellington downstream along the Macquarie Near the River angophora prevailed with ‘flooded gum’ and casuarina overhanging the banks; ‘inferior eucalypti and cypresses were mixed together.’ … on broken and undulating country. From the summit of a limestone elevation … ‘But in following the river line, the eye wandered over a dark and unbroken forest alone.’
103

‘We were protected from the sun by the angophora trees, which formed a hanging wood around us ….’ ‘Pursuing our journey in a N.W. direction, we soon left the rich and undulating grounds bordering the river behind us. A poor, level, and open country, succeeded them. The soil changed to a light red, sandy loam, on which eucalypti, cypresses, and casuarinae, were intermixed with minor shrubs; of which the latter, the cherry tree (exocarpus cupressiformis) was the most prevalent.’ Further north Myall was the most common tree. Northwest from Mt Harris ‘My eye instinctively turned to the north-west, and the view extended over an apparently endless forest.’ ‘We made for Morrisset’s chain of ponds [west of the Castlereagh], and travelled over rich and extensive plains, divided by plantations of cypress, box, and casuarina, in the early and latter period of the day. About noon we entered a dense forest of cypresses, which continued for three miles, when the cypresses became mixed with casuarina, box and mountain-gum, …’ At the Castlereagh – ‘The soil covering the space was of the richest quality, and the timber upon it consisted of box, mountain gum, and the angophora lanceolata, a tree that is never found except on rich ground.’
Lunt (1998)
Changes in density of dominant species through time in disturbed remnant coastal woodland – community changed from grassland with sparse tree cover to dense Acacia pycnantha thickets to eucalypt, casuarina (Allocasuarina) wattle and banksia woodland, finally being taken over by dense growth of Allocasuarina thickets. The community was in an early colonisation post-disturbance phase for about 100 years as a result of rotational harvesting for the wattle bark industry. Fire had been excluded from the time aboriginal people were removed in about 1830. Observations by Batman in 1834: 6/ac = 15 trees/ha – no tree sizes provided. From survey maps drawn in the 1850’s tree densities ranged from 16 trees/ha in the ‘heathy’ zone to 6-10 trees/ha in areas with ‘tolerable forest soils,’ 3-8 trees/ha in the ‘lightly timbered’ zone and 6-10 trees/ha in the Clifton Springs-Port Arlington area. This method of density estimation is prone to under-estimation. Allocasuarina littoralis was apparently very rare in 1894 as it was omitted from a species list compiled by the director of the Melbourne Botanical Gardens. In 1996 (100 years later) this species exceeded 3,500 plants/ha. Wattle growth: ‘ … I have repeatedly tried to keep the wattles down; they grow like weeds, and all my efforts to extirpate them were unavailing… For every wattle that was growing on my land twenty years ago there are at least a score now … there are many thousands now growing where thy were unknown a few years ago.’ Robert McDonald of Swan Bay (quoted by Lunt).
104

Observations by Mr James Dickinson of Portarlington (quoted by Lunt). A patch of 2-year old trees, 5 to 6 feet high, contained 12 in the yard … 60,000 per acre; A patch of 3 year old trees, 10-12 feet high, contained 5 in the yard … 25,000 per acre; A patch of 4 year old trees, 15-18 feet high, contained 4 in the yard … 20,000 per acre.’ The reserve was described as open (you could walk right through it) and all gum trees with lots of grass trees and scrub in the early 1900’s. 1960’s: ‘flat lightly timbered country with an understorey of native grasses and small shrubs’ (Internal Govt report, Landy 1960) 1971: ‘A fairly mature layered woodland of Eucalyptus, Casuarina [=Allocasuarina], Acacia and Banksia, in which both eucalypts and acacias are dying out. Eucalyptus species is virtually absent, whilst that of [Allocasuarina] littoralis is relatively prolific. (Withers and Ashton). 1996: Large Allocasuarina, Banksia and Eucalyptus trees (>0.6m dbhob) – 198 trees/ha (259 trees/ha including dead trees) – mostly Sheoaks and most were at least 50 years old; Younger trees – 5648 trees/ha of younger saplings and seedlings (including 2224 small saplings <3cm dbhob).
Vegetation of Western NSW Beadle 1948
Vegetation associations described ‘as near as possible to their respective climaxes, though in many cases one associes may be seral to a number of climaxes.’ p38. Dry Sclerophyll Forest Subformation: canopy is continuous, not usually interlacing – Eucalyptus dealbata – E. sideroxylon association. Tall woodland subformation: E. woollsiana (microcarpa), to 70 feet high, commonly closely packed with branches interlacing; Callitris glauca where present is usually a lower layer tree. In the ‘virgin’ condition timber densities were high but few virgin areas left in 1948, due to clearing and thinning. Savannah woodland subformation: Canopy interrupted, tree crowns being separated by a distance equal to or slightly greater than the diameter of the crown. E. melanophloia association – 20 to 30 ft high, crowns separated by a distance of a few yards E. coolabah association – 30-40 ft high, ‘typical savannah woodland’. E. bicolor (largiflorens) association – Trees widely separated by a distance equal to or slightly less than the diameter of the canopy or massed into narrow belts separated by a small area of treeless country Acacia harpophylla association – can reach 15 ft, crowns touch and interlace. Shrub woodland subformation: Canopy is interrupted, tree crowns being separated by a distance greater than the crown. E. populifolia – Callitris glauca; with E. woollsiana on eastern margins and E. intertexta to the west. Density generally conforms with the definition of the
105

formation but occasionally trees of box and pine grow closely together, excluding tall shrubs. Both species to 40 ft high.
Casuarina – Atalaya. Density of the stand varies from open with a savannah woodland appearance to closed with branches interlacing. Geijera – Flindersia (+/- Eremophila mitchellii, Apophyllum anomalum, Atalaya hemiglauca). Density varies greatly - canopy can be dense with branches sometimes interlacing with wilga and buddah, open community with leopardwood dominant. E. populifolia – Geijera - Eremophila; shrub-woodland and the frequency of Poplar Box trees varies considerably from crowns touching to widely separated + dense shrub stratum.
E. populifolia – Acacia; shrub woodland. In very few cases only do the crowns of the trees touch, density and height of the eucalypts decreases from east to west with corresponding increase in density of tall shrubs. Smaller shrubs may form dense thickets. Mallee formation: E. oleosa – E. dumosa. Invariably a dense community. Scrub Formation: Climax communities dominated by shrubs or small trees, canopy generally continuous or interlacing, well developed herbaceous layer. Acacia – Eremophila association: Usually very dense but by 1948 somewhat modified by clearing and thinning; 15-20 ft high. Density of the herbaceous stratum varies with the density of the canopy.
Acacia cambadgei: on river alluvium forms dense pure stands with branches interlacing; mixed community occurs with distance from the river with belah, warrior bush and others depending on soils. Gidgee is a poor fodder species with only the pods being edible so thinning or complete clearing of the dense stands occurred, allowing the ‘migration’ of a ‘false herbaceous layer’.
Casuarina - Heterodendron: Belah, Rosewood and pine ‘scrub’ to 20ft. Commonly each of the species occurs in a pure stand depending on soil type. Density varies considerably from timberless areas to being so dense that the herbaceous stratum is completely suppressed. High densities increased by suckering from exposed roots. Acacia aneura: On stable dunes – Before the introduction of stock A. aneura, Hakea leucoptera, Callitris glauca, Heterodendron, Flindersia formed dense and almost impenetrable scrub, broken only by the treeless claypan areas. 15 to 20 ft high. On rocky hills – ‘The Barrier, Coko and Grey Ranges …. once supported a dense scrub of Mulga very similar in general appearance to the scrub of the stabilised dunes.’ Beadle also discusses ‘Saltbush Formation’ and Grasslands Formation’.
WLC (1969)
Cobar – Byrock area first settled in the 1870’s followed by ‘much ringbarking and clearing’. Two major invasions of scrub and timber regrowth have been recorded: in the early 1890’s after a period of well above average rainfall – much of which was destroyed by an extensive bushfire from near Louth towards Nyngan in 1921; 1950’s again after above average rainfall 1950-1956
106
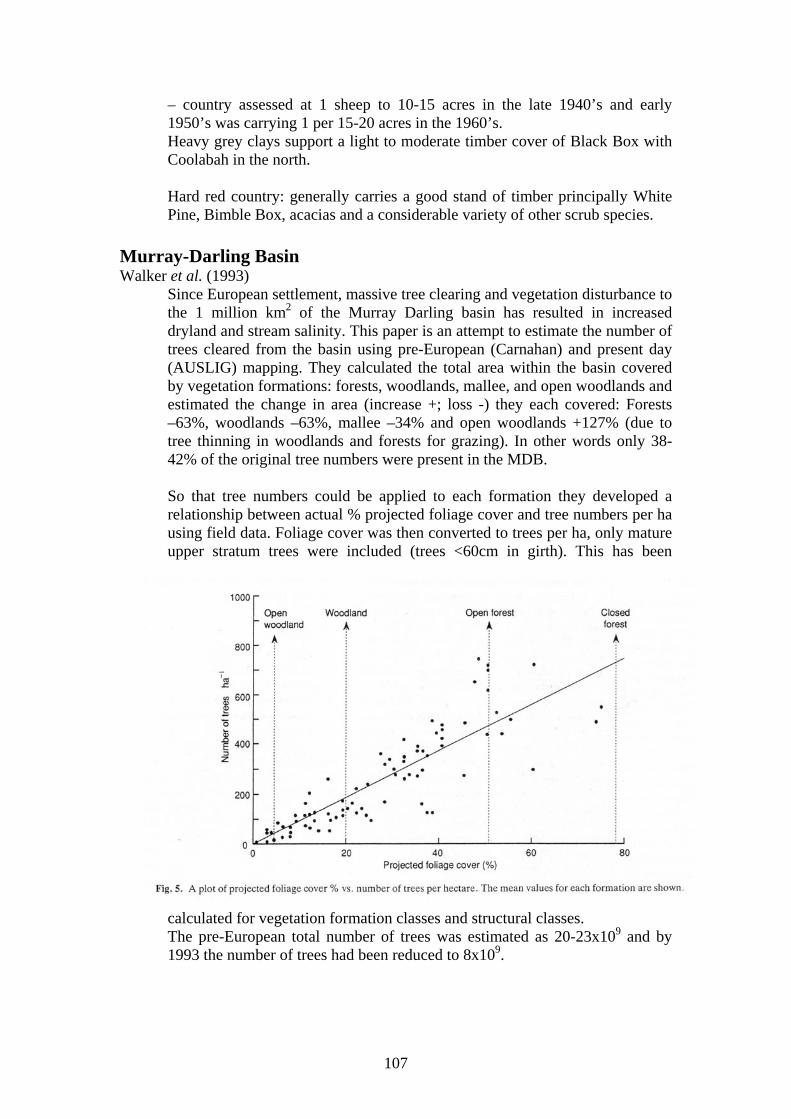
– country assessed at 1 sheep to 10-15 acres in the late 1940’s and early 1950’s was carrying 1 per 15-20 acres in the 1960’s. Heavy grey clays support a light to moderate timber cover of Black Box with Coolabah in the north. Hard red country: generally carries a good stand of timber principally White Pine, Bimble Box, acacias and a considerable variety of other scrub species.
Murray-Darling Basin Walker et al. (1993)
Since European settlement, massive tree clearing and vegetation disturbance to the 1 million km2 of the Murray Darling basin has resulted in increased dryland and stream salinity. This paper is an attempt to estimate the number of trees cleared from the basin using pre-European (Carnahan) and present day (AUSLIG) mapping. They calculated the total area within the basin covered by vegetation formations: forests, woodlands, mallee, and open woodlands and estimated the change in area (increase +; loss -) they each covered: Forests –63%, woodlands –63%, mallee –34% and open woodlands +127% (due to tree thinning in woodlands and forests for grazing). In other words only 38-42% of the original tree numbers were present in the MDB. So that tree numbers could be applied to each formation they developed a relationship between actual % projected foliage cover and tree numbers per ha using field data. Foliage cover was then converted to trees per ha, only mature upper stratum trees were included (trees <60cm in girth). This has been
calculated for vegetation formation classes and structural classes. The pre-European total number of trees was estimated as 20-23x109 and by 1993 the number of trees had been reduced to 8x10⁹.
107

Regrowth Doherty (1998)
Definition: Regrowth vegetation (in terms of plant community and habitat values) represents a process of secondary succession after disturbance. Regrowth occurs after clearing and thinning, fire, cessation of grazing, logging and mining. Regrowth after clearing is mostly viewed in terms of its economic impact (e.g. woody weeds) and the habitat value to native fauna and flora has rarely been assessed. Quoted Benson 1992: for the Coastal Grey Box/Forest Red Gum woodland (E. moluccana – E. tereticornis) that mean tree density in many areas is now higher than reported for the early days of settlement as a result of the denser regrowth resulting from clearing or disturbance.
Johnson (1997)
Brigalow regrowth monitored for 30 years after pulling and burning: Pre-clearing – 4000-6000 stems/ha; sucker regrowth 9 months after burning - 28000 Brigalow stems/ha; significant loss 27-32 years post clearing to 14000 stems/ha. Most of the pre-existing understorey and canopy species were present in the regrowth but at lower densities and all ground species present in untouched surrounding areas also found in regrowth.
White Pine Mitchell (1991)
Pine scrub regeneration did not occur at the same time across NSW – earlier in the southern parts of the state (due to fire, drought and long term seed storage) than in the north.
Noble (1997) Modification of the original fire regime by European settlers encouraged regeneration by fire-sensitive species such as Cypress Pine. Pine proliferation in the western plains occurred early because they were already used for
108

pastoralism during the early settlement phase of the 1860’s to 1880’s, major reduction in fire frequency due to Aborigines being actively discouraged from lighting fires and grazing reduced fuel availability and patchiness, decreasing the spread of fires. Wet years: 1952 – 56 and 1973 – 74; with widespread ringbarking of eucalypts encouraged ‘wheatfield regeneration. In Central Division stand densities from 900,000 to 3,250,000/ha were recorded with 125,000 /ha after 20 years (quoting Hodgkinson & Griffin 1982). Pine protection Act 1882 prevented landholders from cutting pine scrub under 30cm at the butt – repealed 1884
SFNSW
Species is extremely tolerant of shade and competition, e.g. a 40 year old stand of wheatfield regeneration with 100 000 trees/ha 2m tall and 3cm dbh. Younger stands of thinned trees: 10m tall, 15cm dbh
Lunt et al. (2001)
Callitris forest Terrick Terrick National Park Vic – estimates using measurement of cut and standing trees in 178 20x20 m forest quadrats 1860’s: 50/ha with 86% (43/ha) < 20cm dbh and 7/ha > 2020cm dbh. 1998: 172/ha trees and saplings. See Table 2 & Figure 1 (pp58, 59) In 1860’s forest described as open forest lightly timbered with box, Callitris, sheoak and shrubbery. Substantial regeneration pulse in late 1800’s.
With Fine Leafed Ironbark Paull (2001) Pilliga
Quotes Rolls that western Pilliga had Callitris density of 4/ha + 25 young trees in 1877 (quotes a forester John Ward); E. crebra also present. Callitris: central Pilliga west state forest (Eastern Grassy woodland) – >60 cm dbh – 4.8/ha with 24.7/ha Narrow-leafed Ironbark; 1923 forestry records (District Forester Burrow) 12.5 @ >30 cm dbh; 1929 forestry records (B. Priestman) 20.4 @ 25 cm dbh.
Van Kempen (1997) Pilliga Forest Study
High cypress regeneration occurs after a succession of high rainfall years and survival depends on low fire frequency and grazing intensity. Germination: 100% at 150C, nil at 250C. 1880 – 1905: massive regeneration due to rainfall, possibly also clearing produces openings exploited by cypress seedlings. Massive seedling survival with concurrent decrease in fire frequency due to overgrazing. 1905 – 1952: drier period, seedlings palatable to stock and rabbits, no further major germination events 1952 – present: Flooding rains in 1952 and Myxo introduced and wiped out rabbits, major regrowth. Stands of 120,000/ha; 1 million seedlings/ha (wheatfield regeneration). Massive pollination vent in 1973 (clouds)
109

Grazing has been used to manipulate / reduce stand regeneration and density. Oxley records perhaps 5 or 6 large trees /ha of grassland Many accounts about how grazing country became covered with thick scrub: 1837-1848; 1882 in portions of Murrumbidgee and Lachlan districts; 1885 in Nymagee, Condobolin & Forbes area (6.35 million / ha in areas with uninhibited growth, not mixed forests); 1890 ‘The pine scrub has already taken possession of what was at one time splendid pastoral country.’ (Botanist F Turner); 1880’s 1890’s ‘pine came up after drought breaking rain’ p44; 1899 pine thinning in the Corowa and Grenfell Districts. Density estimates: p48 10 milling trees/acre; average ‘mature trees’ 2/acre up to a maximum of 25/acre; West Pilliga 1923 5/ha 25-30cm dbh, 2/ha >30cm dbh, ironbark 7.2/ha 50-100cm dbh; 1929 (Priestman p62) pine 20/ha >25cm dbh – in 1926 100/ha @ 10x10m spacing, 156/ha @ 8x8m spacing; west boundary Pilliga-Coonamble Road 1929 Cypress 9/ha@ >25cm dbh, 50/ha @ 10-13cm dbh, ironbark – mature with sparse young trees 4/ha; Merriwindi SF Barradine Ck west to TSR cypress 80/ha 10-13cm dbh + 60/ha 13-25cm dbh + 3/ha 25cm max dbh (total 144/ha compare with 82/ha in the west). Acacias – 43 species - Acacia burrowii grew in thousand hectare profusion until at least the 1880’s, replaced by other species now. Cyclical nature of the environment: p12 ‘Whether it is Bull Oak or Acacia that comes away after fire seems a matter of chance. Both of these plants builds up nitrogen in the soil which benefits those that follow. Acacias die out in 15 to 20 years, Bull Oak in 50 to 70 years. Pilliga subjected to ‘silvicultural treatment’ producing ‘timber stand improvement’ + ‘ringbarked defective competing eucalypts’. Culling of ‘competing eucalypts and the thinning of 1890’s regrowth continued until 1982. Now 1950’s regrowth being thinned. NB impact of selective logging of both cypress and ironbarks on the ‘Natural’ forest characteristics. Ironbarks heavily logged for railway sleepers (sent to India etc), some areas to total removal of larger trees. One ‘Old Grey’ at Gulargambone carbon dated to 250-300 yrs old.
Date & Paull (2000) Cypress Ironbark forests – Pilliga area. Cypress logging – initially the largest and oldest cypress were logged (>60cm dbh, >100 years old). Trees this size now almost completely gone. During 1940’s minimum size for cutting reduced to 25 cm dbh, and seed trees to be retained. Thinning to prevent ‘locking up’ began as early as 1895 in some areas. Thinning prescription was to 3m or 6m spacing. Prescription in 1995: Minimal disturbance of ‘Old Grey’ cypress trees, eucalypts and casuarinas. Commercial thinning to include merchantable trees with no further potential. In the absence of adequate regeneration of ‘Old Greys’ at least 5 well spaced seed trees per ha to be left.
110

Ironbark Logging – mainly for sleepers which began from1880. Before the arrival of railways large areas of old eucalypts and cypress were ringbarked by pastoralists and the remaining hardwoods were removed for sleepers. Most hardwood supplies (especially ironbarks) were depleted by the 1950’s. Regeneration of ironbarks between the 1890’s and 1950’s was limited by rabbit plagues but since then has been adequate or even prolific. Most stands contain a ‘generation gap’ with few old trees and many young trees (too young to log or to become conservation value). Ironbarks include Narrow-leafed Ironbark (most targeted), as well as Broad-leaved and Mugga Ironbarks. Insultimber (droppers for electric fences) cutting of all 3 ironbark species began 1979 in the Pilliga and Goonoo – usually old growth or mature trees with ‘pipes’ or hollows and smaller trees with growth defects (fauna habitat trees). Some parts of Pilliga forests are almost devoid of healthy ironbarks >40 cm dbh. From 1986 to 1993, 2 large habitat trees (any species) retained during logging. Now it is the same as for sleeper cutting. More recently hardwood logging is of small trees with growth defects and mostly restricted to Narrow-leafed Ironbark. More recently hardwood logging is of small trees with growth defects and mostly restricted to Narrow-leafed Ironbark. Pp127-129 - the impact of this forest utilisation on fauna is discussed.
Norris et al. (1991)
Pilliga forest was claimed by pastoralists by 1880’s, little evidence that the core of the forest east of Barradine Creek was ever heavily grazed, or even entirely occupied. Survey maps from this area from the 1870’s and the 1930’s map the veg boundaries in this core area which are remarkably similar to today. Thick scrub and pine regeneration is described and recorded for other times. Rolls asserts that settlement of the Pilliga was more or less complete by the 1870’s and there had been no regular burning for 25 years. Provides evidence to question Rolls statements regarding the weather patterns in the 1870’s. Several consecutive wet years suggested as necessary for pine regeneration are more likely to have occurred in the period 1889 to 1892/94. Other periods of pine regeneration were at Gilgandra in 1917/1918, 1932/34 in east Pilliga. Journals of Oxley, Sturt and Mitchell all specifically mention on many occasions the presence of dense scrubs including Callitris on the lighter red soils. Also provides other evidence of thick scrubs in the Pilliga area. Generally evidence suggests that vegetation has been remarkably stable over the past century; important to differentiate between the core of the forests and the riverine areas and edges. Early tree ring evidence suggests that regeneration is well spread and not confined to 2 main events.
Shelly (1998)
Goonoo Forest – total tree and shrub density 1825 stems/ha. With mixed Box species Parker and Lunt (2000)
Terrick Terrick National Park – largest stand of White Cypress Pine in Victoria. Aerial photos showed little change in Callitris distribution since the 1940’s. Dense regeneration 92,500 saplings/ha occurred in small plots fenced
111

in 1958. Additional regeneration occurred after the heavy rains in the 1970’s and recruitment appears to be ongoing in some areas. Stand class analysis demonstrated that Eucalyptus species recovered more abundantly than Callitris recently – recruited after removal of stick and cessation of eucalypt culling since being declared a State Park in 1988.
Curby (1997) Narrandera Forest Study
White cypress pine with Box (yellow, white, grey) + Buloke Matong State Forest: woodland with grass understorey, open box woodland, with some Boree, Yarran, and Cypress + denser patches; Intensive management for about 120 years. Buckingbong & Gillenbah State Forest: 1852 ‘pine scrub’ ie woodland with dense regeneration or dense regeneration with few or no mature trees + box & shrubs; 1921 – almost entirely cypress and scattered box. Preliminary stump counts – 20/ha @ 50-60 cm dbhob (logged by 1900), 20/ha @ 30-40 cm dbhob (logged by 1920), regeneration emerging since late 1860’s, non-commercially thinned 1895-7, sawlogs 1920. Ganmain State Forest: Early 1870’s ‘open box forest with large pines scattered in clumps before it was ringbarked; area which had had no silvicultural treatment – eucalypts the major component of canopy, mature cypress sub-dominant, scattered shrubs. Earliest years of settlement, little impact on forest vegetation until boom in cattle in the 1850’s to supply the Victorian goldfields; Aborigines ‘defeated’ in 1840; growth of pine in the Riverina dated to the ‘drought’ of 1866 - “whole forests of this pine have been known to die in times of drought”; enormous loss of timber by ringbarking, forests were part of pastoralists runs and there was great disagreement between pastoralists who wanted to ring all the scrub and foresters who could see the potential value of the timber if managed properly
Forest Management Plan (1984) Griffith
Lists density as medium, dense or scattered e.g. • 5 ha med. Pine in NW; 110 ha med box; 6 ha hill type; 12 ha scattered
pine. • 105 ha med. Box - scattered pine; 18 ha dense pine; 64 ha med – pine –
box etc. With Box and oak Allen (1997): Forbes District Forests
This is the most comprehensive study of the ecology and history of the cypress forests of the central west, providing a detailed analysis of ecological cycles and the influence of disturbance by natural forces or management, edaphic factors etc.
112

The appearance of dense pine scrub across many areas in this part of the colony occurred in the late 1870’s and early 1880s. The region was being overcome by rabbits by the 1890’s. The forest reserves of the 19th century were mixed stands of pine (some large and >>100 years old), box and Casuarina. Today’s forests are largely the product of the past 50 years dominated by young pine, few box and oak. Records of the early explorers including botanist Allan Cunningham described the early 19th century landscape as a mosaic of plains ‘scrubs’ and open and dense forests (including cypress from young regrowth to mature trees). The natural cypress life cycle is probably 200 to 300 years from dense regrowth to individual old trees but the cycle can be compressed to 100 years using forestry practices. All three pine forests examined contain vastly fewer hardwoods than pre-European forests. 1880’s – concern being expressed at the depletion of useful fodder trees in western NSW – Govt moved to control ringbarking on crown lands “stop ‘wanton and reckless waste of 1st class timber’. Very important observations by early explorers – vegetation in the area north of the Lachlan varies considerably over quite short distances. Land occupation – from 1835/40 very sparse occupation – 1870’s huge sheep numbers. Early 1880’s – dense scrub growth mostly pine on lands that were reputedly open box, kurrajong and scattered large pines, 1950’s+ - massive pine regeneration (+ rain – rabbits); culling (ringbarking and felling) mostly eucalypts and pines and casuarina carried out sporadically in cypress forests over the last 60 years, especially in the late 1960’s and early 1970’s. Back Yamma 1881 – cypress scarce as building timber, large quantity small pine and large trees and plenty box – many thousands large trees; 1999 – small seedlings to > 20cm, manually thinned 3 to 6m spacing, hardwoods eliminated except for ‘green breaks’. Random counts in green breaks 40-60 box trees/ha >100 years old++ 1886 thickly timbered with box and pine as well as ironbarks in the north-east. Massive reduction of eucalypts – early reference to box, pine and patches of ironbarks. Box trees >100 years old 40-60/ha + 500 pines / ha + many thousands of large pines>100 yrs old cut for milling by 1882. Summary: forest of uneven aged box 40-60 trees/ha + dense sapling pine 400-800 stems/ha – size varying with site quality, smaller on poorer gravely ridges. Ironbark in the NE + dense box dominated forest in SE. Density of shrubs related to density of tree stand. Strahorn: Mitchell describes dense woods with White or Yellow Box. 1883 – 2 @ 20inch/acre + 4 @ 12inch/acre + 120 pine saplings <12 inch/acre; <12inch 40/acre + bigger stumps. Early post WWII ringbarking of eucalypts/oaks that had survived earlier felling or grown since. Relief labour schemes through 60’s and 70’s – major programme of tree poisoning to
113
eliminate hardwoods from areas where pine will grow. Most of what was destroyed was coppice growth from earlier ringbarking or felling - ‘They tell the story of having once been ringbarked to improve the grass and later being poisoned to improve the trees’ p79. Box becoming more dominant after no poisoning for the last 15 years in previously pine dominant areas. Drought thinned pines – greater mortality in unthinned than thinned areas; 6000 sleepers from ‘straight box’ (yellow box) + pines. Mature trees 10/acre of 150 years old. Natural thinning can produce a stand of different size classes though of much the same generation. Pre-settlement times density of box would have been as great or greater than 100 yrs ago & certainly far greater than it is today after concerted efforts at ringbarking and poisoning. Summary: Mixed box of varying ages and well spaced maturing cypress pines with a predominance of the hardwood or cypress depending on site soil conditions + casuarina, grass, wattles, hopbush, budda. Euglo: first settled 1851; fire through the area; 1915 young pine well thinned and all useless timber destroyed thick pine 120/acre, 90/acre 6-8 inch dbhob, 30/acre 8-11inch dbhob. Plot with grazing excluded totally – dense seedlings + grass reappearing; fire 1957 heavy loss cypress, eucalypts & wattles re-emerged in dense stands – young cypress still rare in early 1970’s, 1980; >50 box trees/ha in early 19th century. Box stump counts up to 50/ha >180 years ago. Summary: a forest of relatively open pine (60-80/ha) + box trees of much the same density in the north but fewer in the south and a grassy understorey with areas of Yarran and Rosewood in the west. Pre-European forests - Cunningham – lots of various sizes and dimensions from seedlings generally growing in clumps to lofty trees of about 60ft. Phases differed between forests. ‘The explorers found a mosaic of vegetation across the central western region, and today’s forests were part of that mosaic though not necessarily as we see them now … long term natural cycle influenced to a greater or lesser degree by Aboriginal burning. … To pick out any one date (1750) … ignores the fact that forests are and were dynamic systems, and fails to give a true picture of process’ (p131). ‘A cycle which may naturally take 300 ars or more without major interference in being compressed into a third of that period, and at the same time, across almost the whole of the forests, one species has been deliberately promoted at the detriment of the others.’ (p132). NB figures of natural cycles and changes through the last 200 years.
Snowy Mountains (Upper Riverina DSF) Pulsford (1991)
Fire frequency increased during the second half of the 1800’s and declined only after the 1940’s – increase coincides with the pastoral use of the Snowy Mountains when fires were used to increase new growth for stock but this also caused massive erosion especially in the 1800’s. Regrowth stands were established between 1870 and 1885 – a period preceded by several major fires
114

before the arrival of rabbits in about 1890. Further regeneration events were minor and only occurred when climatic conditions were suitable and rabbits few.
Pulsford et al. (1993)
Snowy River, just north of Victorian/NSW border. ‘Callitriss from four to five feet in circumference grew amid shrubs of every tint. The country is well grassed and abounds with cattle …’ (Mackaness 1941) By 1954 Costin reported that there were dense regenerating thickets of White Cypress Pine and bare eroded soils. Young pine wheatfield regeneration also occurred in 1878. Stem density data from transects demonstrated that the woodland structure varied with location – drier slopes differed from sheltered slopes. Scattered White Box with cypress mostly in clumps. On the northerly aspect there was 30 trees/ha old growth White Cypress, White Box 9/ha, dense regrowth 2600 trees/ha and 95/ha white box. White Cypress dominated the northerly aspect, white box dominated the southerly aspect. Tree density graph (p91).
115

NW NSW Denny (1992)
White Pine had almost disappeared form the north-west corner compared with the observations of the explorers – probably due to the large number of trees removed by the needs of early settlers.
Box / Ironbark Forests and Woodlands Soderquist et al. (1999)
In the box-ironbark forests of Victoria, large old trees have been reduced to less than a tenth of that reported to have occurred naturally. Estimate of up to 30 very large trees with dbh >80cm. Now an average of only 2 trees >60cm dbh / ha remain. Most are located away from the centres of human activity and about 2/3 of the forest is devoid of any large trees. The best patches of remnant forest have 12 per ha – well short of pre-European estimates.
Newman (1961) 30 very large trees (>80 cm dbh) per ha in Victoria but quantitative data scarce (quoted in van der Ree & Bennett 2001).
Bennett (1993)
Changes to age structure of box-ironbark forests of south eastern Australia: Relative proportions of older and younger trees show marked variation through the landscape. In Victoria, forests on public land are biased towards younger age classes, old trees are scarce after a history of felling - animal species are greatly reduced in these forests; Remnants and isolated trees on private lands are frequently biased to older age-classes – lack of regeneration is of concern. Time-lag in experiencing the full effects of past changes; lack of tree regeneration on farmland will not be fully experienced for many decades until old trees die and woodland cover disappears; immediate cessation of timber harvesting in an ironbark forest will not result in an immediate increase in availability of tree hollows; decline and extinction of wildlife species is not a sudden event – moves from widespread to uncommon, restricted range, scarce localised populations, rare sightings, extinction.
Robinson (1999) Box-ironbark lands of NSW include Poplar Box, White Box and Yellow Box, Brigalow, Carbeen, Myall, Belah and River Red Gum communities.
Traill (1991)
Chiltern Forest (Red Ironbark, Red Stringybark, Red Box, Grey Box, White Box and Blakely’s Red Gum; sparse understorey of Acacia pycnantha, Exocarpus polyanthemos, patchy sparse groundcover of grasses and low shrubs): Most of the land was totally cleared for gold mining during the 1850’s. Regrowth dating from this time has been intensively managed for timber production. Most of the remaining mature trees were removed in the 1930’s and 1950’s to improve the growth of commercially valuable younger trees (‘liberation treatment’). Licensed post cutters still operating in the 1990’s
116
plus firewood and illegal cutting. 50 ha had not been subjected to ‘liberation treatment’ and has many mature trees and abundant hollows. The Donkey Hill site had only 2 mature trees in about 80ha.
Large areas of Victorian box-ironbark forest have a similar silvicultural history resulting in large areas devoid of trees with hollows and therefore the hollow dwelling fauna.
Traill (1999)
Structure of the forest has changed from open stands of probably 30-40 trees/ha of mostly large mature trees >1m dbh to current structure of much denser stands of immature trees, very little remnant standing or fallen dead timber remains – for faunal survival, need to permanently retain at least 10 large (habitat) trees/ha in production areas.
Paull (2001) Pilliga E. crebra: central Pilliga west state forest (Eastern Grassy woodland) – >64 cm dbh – 24.7/ha plus 4.8 White Cypress per ha.; 1923 forestry records (District Forester Burrow) 7.2 @ >50 cm dbh; 1929 forestry records (B. Priestman) 5.6 @ 25 cm dbh.
Austin (1918)
Cobborah Estate, 8,000 acre grazing estate, with Talbragar River running through the middle. On either side of the river there were very rich flats; the country abruptly changed beyond the river flats to sandy country or ironstone ridges and hills, ‘wild sandstone hills’ north of river on western boundary and on from this country for 40 miles the country hadn’t been occupied at that time. Practically all of this country was very heavily timbered mostly with fine large ironbarks from which hundreds of sleepers had been cut in 1915-1917. Mostly thick scrub under these trees, in some parts it is almost smothered with young pines; in others bullions, wattles, Blackheath, stringybark saplings and other eucalypt seedlings and suckers that have ‘sprung up’ after bushfires. The timber on the estate has been mostly killed, enough left to provide stock shelter. Along the Talbragar River there were many large River Red Gums and River Oaks, most of the flats were ‘lightly timbered’ with White Box, Yellow Box, Angophora; away from the flats the timber is similar with the addition of a few pines and ironbarks in places, most dead trees left standing.
Cox and Hamilton (1889)
Mudgee district; east of Cobborah, head of the Talbragar valley. ‘The whole of the country now much cleared, was originally timbered, in places very heavily, principally with Eucalypts and apple-trees (Angophora intermedia).
Walker et al. (1986)
E. crebra woodland in the South Burnett region of Queensland: original tree density of 640 trees/ha, trees all about 70cm girth, 18m high, canopy width 5m.
Grassy Box Woodlands Benson (1999)
117

Grassy box woodlands in drier coastal valleys, tablelands and western slopes (400-900mm rainfall belt) – average 30 large trees/ha
McIntyre (2002)
The definition of the optimal tree density of a woodland is difficult to determine. The productivity of a site is used as a surrogate without fire, grazing, clearing, or dieback. The number of saplings after regeneration is greater than the number that will survive to maturity - self-thinning will produce a density at which all adult trees can obtain sufficient nutrients and water to mature. Prober and Brown (1994 quoted by McIntyre 2002) found a density of 30-40 trees per ha to be ecologically optimal in a white box (E. albens) woodland as woodlands with a density less than 30 were more highly inbred, leading to a loss of genetic diversity. Minimum patch size: how large do eucalypt populations need to be to prevent inbreeding – for White Box minimum population of 500 trees needed for genetic diversity (Prober and Brown 1994 in McIntyre 2002). At a density of 30-40 trees per ha this would require a patch of 12.5 to 17 ha. The density of 30 mature trees per ha is equivalent to a spacing of one crown width between the edges of the canopies with a range of two and a half crown widths – smaller trees would be more widely spaced. Crown separation (Crown Separation Ratio = CSR) defined as a method for describing tree density:
Open Forest: Mid-dense (touching – slight separation), CSR 0-0.25; Woodland: Sparse (clearly separated), CSR 0.25-1; Open woodland: Very sparse (well separated), CSR 1-20; Scattered trees: Isolated trees, CSR >20.
Natural regeneration: lignotubers allow young trees to survive defoliation by re-sprouting repeatedly – these can be suppressed for many years due to shade, insect attack, grazing, disease or fire but will grow when released from these pressures. Without the presence of lignotubers, regeneration occurs from seed and the adult trees need to be healthy to produce seed – trees stressed by insect related dieback will not flower if they have only epicormic growth present (Whalley and Curtis 1991 quoted by McIntyre 2002). Retain trees of different ages within stands to retain the long term viability of tree populations: A typical population structure of grazed woodlands is a scattering of mature trees with few or no saplings – no replacement, especially when these scattered trees suffer from dieback symptoms which are more likely to appear where pasture improvement has been undertaken (Reid and Landsberg 2000 quoted by McIntyre 2002). ‘If you don’t have a tree regrowth problem, you have a tree decline problem.’ (R. W. Johnson).
Lunt (1991)
118

Native grasslands and grassy woodlands once covered about 1/3 of Victoria – now less than 0.5% left. Similar situation in NSW. Quotes Woodgate and Black (1998) – that density of trees in Victoria has declined considerably since European settlement and many of the original woodlands are now treeless or only sparsely treed. Prior to European settlement tree densities were controlled by a range of factors – climate, soil-type, drainage, aboriginal burning, browsing by native herbivores. Stock have prevented the regeneration of trees in many grassy woodlands. Where trees remain, considerable regeneration can occur when grazing is removed.
Lunt (1995)
Gippsland Plain (Traralgon area) – Found Themeda grasslands along rail-lines and in some cemeteries – used old survey maps to estimate tree densities. Areas mapped in 1860’s as grassy forest and woodland. ‘Judging from the density of stumps at some sites, tree density is probably considerably greater now than at the time of European settlement.’ Plant composition was directly related to long term site management.
Spooner et al. (2004)
Analysis of roadside disturbance shrub vegetation (Acacias) in an area of open eucalypt woodland (E. microcarpa, E. melliodora, E. blakelyi, E. albens) and mixed Eucalyptus, Callitris glaucophylla, Allocasuarina leumannii which has been mostly cleared. Acacia pycnantha, A. montana and A. decora were counted in age/size classes and presented in % frequency classes. Stem densities not provided for this disturbance community but the type of information provided – a size class distribution – is notably absent from almost all stem density information in the literature.
119

Windsor (2000) Regeneration and revegetation in box woodlands. Pre-European box woodlands described as “relatively open woodland, with a somewhat clumped distribution of trees … with a grassy understorey” (Croft et al.) In the central west of NSW two alliances are dominant: Yellow Box and White Box which form mosaics across the landscape. Grassy box woodland are also the more fertile soils and therefore good farmland and were cleared in the late 1800’s mostly for agriculture. Only 24% original woodland cover remains as small fragmented islands and of these many are seriously degraded by tree dieback, lack of recruitment and premature senescence. Dense regrowth stands in the CWR appear to be the result of trigger events with many regeneration areas having even aged stands of saplings or a series of distinct ages. This indicates that germination and establishment events are limited.
Victorian Gum and Box woodlands & others Lunt (1997)
Lowland Gippsland plain – mixed Eucalypt woodlands with red gum, box, she oak (Eucalyptus and Allocasuarina) as described on historical plans. Tree density estimates determined from these 16 areas on 15 historical map sheets. These varied from areas described as ‘open plain’ and ‘forest’ on the maps.
2-9 trees per ha in ‘open plains good agricultural land’ 59 trees per ha on ‘ good agricultural land liable to be flooded in very
wet seasons 34 trees per ha in Stratford township. 18-30 trees per ha ‘thickly timbered … gum and she oak.
Suggests that calculated tree densities are extremely low (<30 trees / ha) compared with tree densities in vegetation remnants along roadsides (e.g. 285 trees in one fifth of a ha in a flora reserve in the same region – this represents regrowth timber. (NB – no age classes provided) “The over-riding impression from all calculations is of very low tree densities, even in areas annotated as ‘thickly’ or ‘heavily timbered.’” 3 examples: 8-13 trees per ha south of the Dennison Plain annotated as ‘generally light soil, heavily timbered with gum, she-oak and honeysuckle; 20-24 trees’ /ha from Sale township ‘very poor white clay land, heavily timbered with large red gum, box and a few oaks and cherry trees; 18-30 trees/ha near Denison ‘gum and she-oak forest and wet marshy land thickly timbered with gum and she-oak’. Notions of ‘light’ and ‘heavy’ timber are relative and likely to have changed over the last century.
Bennett et al. (1994)
Remnant woodlands across northern Victorian plains – analysis of tree hollows. Vegetation associations included are: River Red Gum, Black Box, Grey Box, mixed Box/Stringybark, Yellow Box and Cypress Pine with Box. Tree density provided in relation to size of remnant patch and size classes (see tables below). Density and distribution of hollow bearing trees: 10.2% of trees >10cm dbh contained hollows. Overall mean of 16.7 hollow bearing trees per ha but there
120
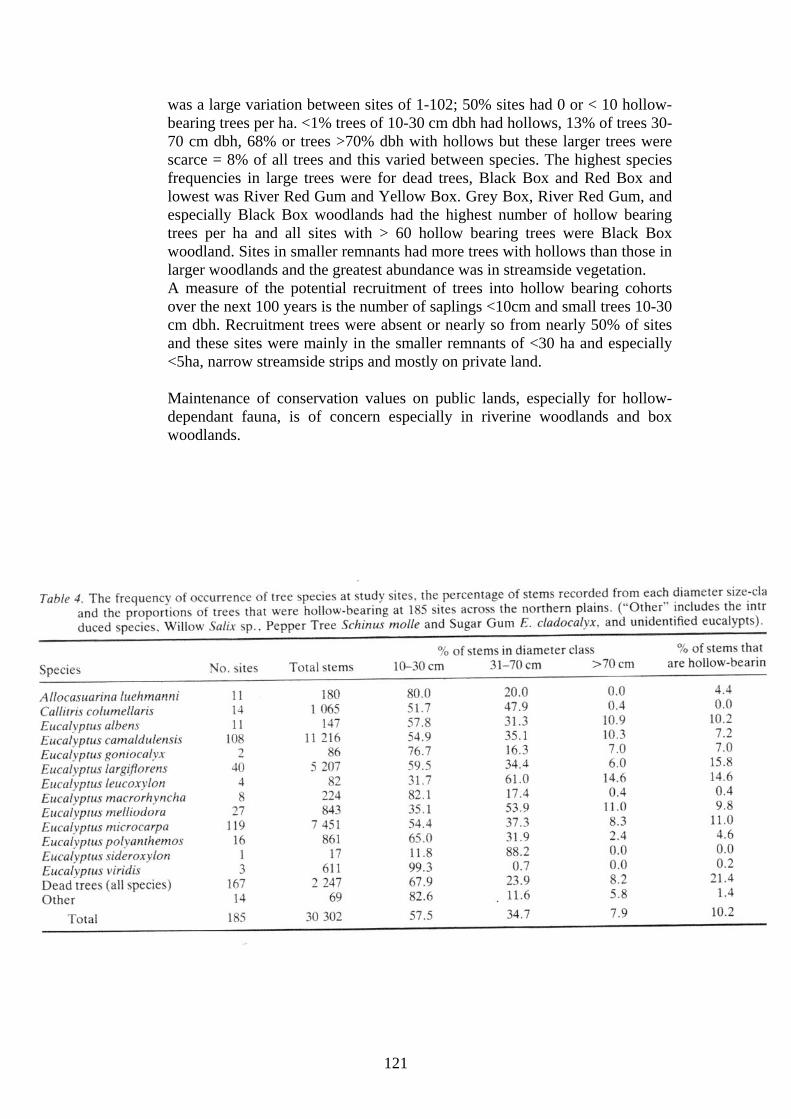
was a large variation between sites of 1-102; 50% sites had 0 or < 10 hollow-bearing trees per ha. <1% trees of 10-30 cm dbh had hollows, 13% of trees 30-70 cm dbh, 68% or trees >70% dbh with hollows but these larger trees were scarce = 8% of all trees and this varied between species. The highest species frequencies in large trees were for dead trees, Black Box and Red Box and lowest was River Red Gum and Yellow Box. Grey Box, River Red Gum, and especially Black Box woodlands had the highest number of hollow bearing trees per ha and all sites with > 60 hollow bearing trees were Black Box woodland. Sites in smaller remnants had more trees with hollows than those in larger woodlands and the greatest abundance was in streamside vegetation. A measure of the potential recruitment of trees into hollow bearing cohorts over the next 100 years is the number of saplings <10cm and small trees 10-30 cm dbh. Recruitment trees were absent or nearly so from nearly 50% of sites and these sites were mainly in the smaller remnants of <30 ha and especially <5ha, narrow streamside strips and mostly on private land. Maintenance of conservation values on public lands, especially for hollow-dependant fauna, is of concern especially in riverine woodlands and box woodlands.
121
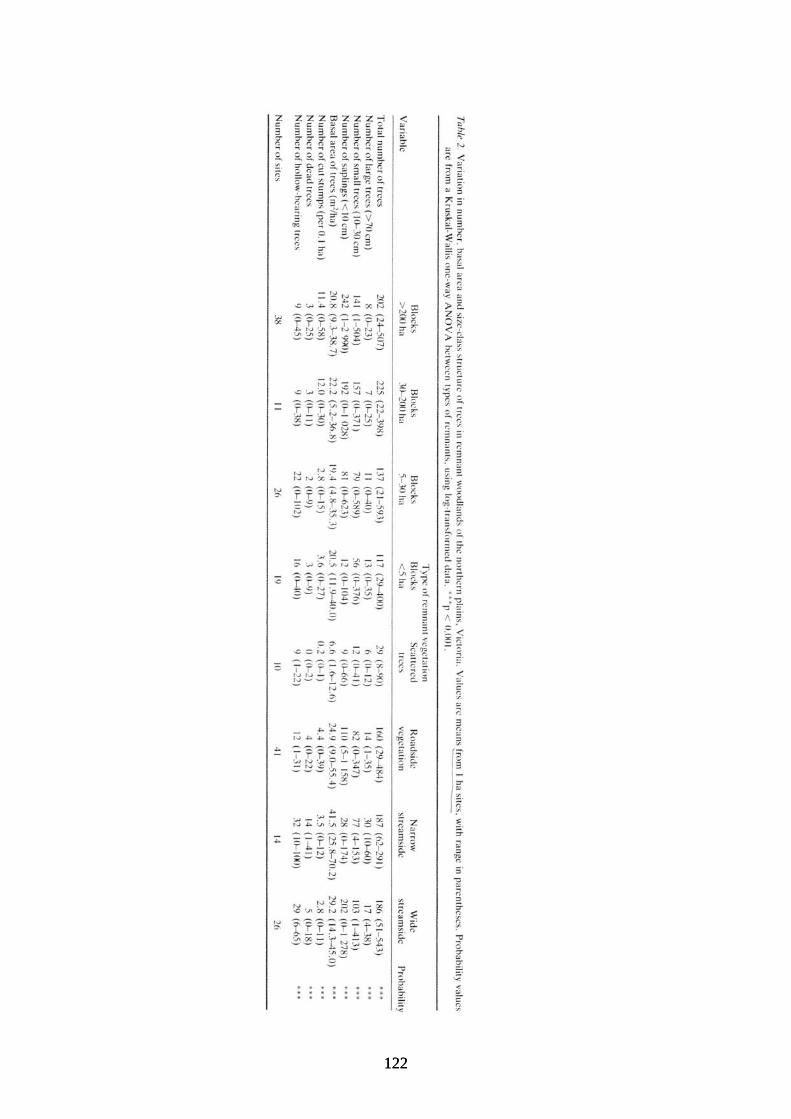
122 122

Douglas (1997) At the time of European arrival East Gippsland was completely covered in forest and a few small areas of open plain. Based on historical descriptions the forests included: • Open forests or woodlands: Red Gum and box on Lake margins and
plains, the box woodlands of inland valleys and gum woodlands of the tablelands. Open with a grassy understorey.
• Dense Forests: foothills, mountain and coastal areas. Had a range of tree sizes and ages. The extensive forests of very large old trees known from South Gippsland were not noted from East Gippsland.
Grey Box (E. microcarpa) Robertson & Young (1996)
Grey box (E. microcarpa) in southeast Qld commonly >400 trees per ha. Low grass production. Poisoning experiment with all trees except saplings removed - most were 46-65 cm dbh.
van der Ree & Bennett (2001)
Composition and structure of the remaining severely depleted temperate eucalypt woodlands has been significantly modified. It is essential to identify the appropriate habitat structure for the maintenance of biodiversity values. Vegetation community: linear strips of woodland along roads and unused road reserves, dominated by Grey Box (E. microcarpa) with an understorey of Golden Wattle (Acacia pycnantha) over a grassy or herbaceous ground layer. Landscape scale survey using 1 ha plots + local scale analysis using 21.8 km in 50 m segments, of continuous woodland along road reserves. Results: see table from paper below.
Large trees (>70 cm dbh): 1 ha sites – 7-36 stems/ha; linear sites – 0-70 stems/ha. Trees with canopy hollows: 1 ha sites – 11.8/ha; linear sites 21.3/ha. Saplings (<10 cm dbh) – density highly variable: absent where reserve had been grazed regularly but abundant in other areas. Presence of small (10-30 cm dbh) and medium (30-70 cm dbh) trees reflected mixed aged structure present in the absence of grazing by stock.
123
Underlying fact significant in this discussion: Growth rate of Grey Box estimated at 3.5mm/year therefore trees >70cm dbh are >200 years old and pre-date pastoral settlement by at least 40 years. They represent pre-European regeneration processes and are not the result of post-European management. The rates of growth into large size classes will be the same as pre-European times – if self-thinning is less severe post settlement (eg due to fire reduction) then there should be a higher density of large trees but post settlement felling reduced this density of large trees. Little evidence of felling in the areas selected for this study.
Poplar Box (E. populnea) WLC (1969)
Cobar-Byrock area - once carried Bimble Box at 5-15 yard spacing – then ringbarked. 10-20 trees/acre or 10-15 yards spacing.
Noble (1997)
Density of 2-6 trees/ha prevents max herbage production Beetson et al. (1980)
7 communities defined – Poplar Box as a dominant +/-grasses, shrubs, other Eucalypts, Acacias, Callitris; Poplar Box as a sub-dominant.
• Poplar Box with grassy lower layer: in Qld and NSW the most common structural types are woodland and open woodland. Tree density averaged 100/ha in Qld and 50/ha in NSW
• E. populnea with shrubs: Qld 170 trees/ha over Buddah; in NSW structural form varies from open forest, open woodland, and woodland – tree density average 109/ha - and shrub layer composition variable
• E. populnea with E. melanophloia or pilligaensis: no densities given • E. populnea with intertexta, western plains of NSW: average tree
density 45/ha + shrub layer. • E. populnea / E. woollsiana (microcarpa): woodland to open forest 3-
180 trees/ha, variable shrub layer, occurs from Tamworth/Cobar to Griffith
• E. populnea with Mulga A: SW Qld and NW NSW. In NSW mainly low woodland with some open forest and low open forest average density 150 trees/ha, E. intertexta and White Cypress also sometimes present. Shrubs frequent.
• E. populnea with Mulga B: Tree density average 108/ha in NSW • Acacia harpophylla – E populnea: Dominated by Brigalow, average
tree density of 530/ha; communities with the 2 species co-dominant are woodlands with some open woodlands 270 trees/ha.
• E. populnea with Casuarina cristata: open woodland with 20 trees/ha • Casuarina cristata – with Brigalow and Poplar Box: average tree
density in NSW 50/ha. • Casuarina cristata and Heterodendrum oleifolium: at the western limit
of E. populnea average density 30/ha. Poplar Box usually confined to drainage lines.
• White Cypress dominant with Poplar Box: open forest, low open forest, woodland and open woodland average density 100 trees/ha.
124

• E. populnea and Callitris: density extremely variable from 1 to 780/ha. The brief descriptions in this paper emphasize a wide range of variation in the large number of E. populnea communities.
Tunstall et al. (1981)
Sites near Tallwood in southern Qld. Grazed for >80 years by sheep and cattle. Poplar Box shrub woodlands 200-500 trees per ha in intact stands. Thinning experiment:
• Livestock in intact woodlands reduced grass diversity and increased scalds and forbs between trees.
• Killing trees (i.e. thinning) increased herbage growth due to increase in water and nitrogen but increased sheep numbers then caused soil compaction which then decreased water penetration and increased salt.
Tunstall and Walker (1975)
Sites near Tallwood in southern Qld: intact Poplar Box 300-515 trees per ha. Johns (1981)
Poplar Box woodland on ‘Oakvale’ 30 km west of Coolabah NSW. Approx 36 eucalypts per ha; Shrubs – approx 4,800 per ha.
Harrington and Johns (1990)
Site near Bourke, Cobar-Byrock Pediplain – Poplar Box 10-15 m in height with a mean density of 36 trees /ha and a canopy cover of about 15%.
Adamson & Fox (1982)
‘The management objective of the primary producer in the Poplar Box lands is to reduce the production of trees and woody shrubs, and increase production of the herbaceous layer under them. The range of techniques which are used to produce more herbage include tree felling, thinning of woody layers ….’
Brigalow (Acacia harpophylla) Tunstall and Walker (1975)
Sites near Tallwood in southern Qld: intact Brigalow 310-325 trees per ha. Johnson (1997)
At the time of European settlement Brigalow communities occupied about 6.5 million ha south from about Charters Towers into northern NSW, mainly in the 500-750mm annual rainfall belt, summer dominant. 30 regional ecosystems with Brigalow are now threatened and most are endangered. Over the past 100 years the dynamics of Brigalow and adjoining communities have changed with Brigalow increasing in density in mixed Brigalow-grassland mosaics and in Poplar Box and Silver-leaved Ironbark woodlands but it has died out in stands invaded by softwood scrub or semi-evergreen vine thicket species. Long term monitoring at the Brigalow Research Station. 182 20x20m plots classified as Silver-leaved Ironbark measured in the 1960’s and 18 plots becoming dominated by Brigalow remeasured in 1990. Plot 140: 1968 density A. harpophylla 275/ha + E. melanophloia 125/ha
125
1990 density A. harpophylla 1125/ha + E. melanophloia 100/ha Plot 150: 1968 density A. harpophylla 0/ha + E. melanophloia 50/ha 1990 density A. harpophylla 550/ha + E. melanophloia 50/ha
In an area of Brigalow regrowth following pulling and burning, density of Brigalow suckers was initially 28000 suckers/ha 9 months after burning. After 30 years the population had halved and grown to 7 metres in height, including a significant loss of stems between 27 and 32 years (drought conditions + competition). Densities in mature stands of Brigalow woodland similar to those at the time of clearing were 4000-6000 stems/ha including 2500-3000 trees >2.5 cm dbh and canopy heights of 12-15m. Coolibah (E. coolabah) and Black Box (E. largiflorens) Maher (1995)
Coolibahs – stand estimated to be from the 1890 flood, density 84/ha + 60 River Cooba – 40% had small or large hollows (Birrie River floodplain) Stand from 1950’s floods, density 128/ha – photo of clump with 25 stems, 9 of which have dies from natural causes (Birrie). Stand from 1950’s floods, density 320 stems/ha; stand thought to be from 1970’s floods, density 1913/ha (Culgoa River floodplain). Dense regrowth of these species is an issue mainly on the Nidgery, Wombeira, and Eurie landsystems. Ecological processes on the floodplains: Floods are the exception but are also the driving force behind the ecology of the floodplains. Frequency, duration and timing of floods determine the vegetation that grows on the floodplain – Coolibah is entirely dependent on flooding for germination, Black box is enhanced – chances for germination for these species is infrequent, establishment is rare. Limited distribution of age classes within floodplain eucalypts – establishment dates are pre- 1890, 1890, 1955-56, 1974-6 and 1983-4 establishment opportunities in the last 105 years. Natural thinning occurs during periods of stress. As the degree of thinning increases so does the likelihood of some species disappearing. The thin line between thinning and clearing will be determined by the fauna – when its composition changes.
Allen (1983)
There was a substantial growth of Coolibah seedlings after a series of floods in the 1970’s on the flooded black soil plains around Walgett, also along the north side of the Barwon River from Collarenebri to Brewarrina after the 1890 flood
River Red Gum (E. camaldulensis) Forestry Commission (1986)
In the Murrumbidgee management area River Red Gums >80cm dbh range from >10/ha to a minimum of 1.
126

‘When the first settlers came to the district the bulk of the River Red Gum forests were more of an open woodland than today’s relatively dense forest, strongly suggesting the effects of frequent burning. … Many of these forests were leased, and ringbarking of trees for pasture improvement was encouraged by way of Improvement Lease conditions. With the cessation of Aboriginal burning, extensive regeneration began to dominate much of this lower flood country and led to a drastic change in the structure of the forests. The year 1911 is identified as the origin of extensive regeneration over the area, although, it is probable that the occurrence of the regeneration was spread over a decade or so about this time.’
Availability of soil moisture is the single most important determinant of stand growth and development. Red Gums form dominants on high quality sites but not so readily on lower quality sites. River regulation has resulted in less frequent conditions for successful regeneration, reduced growth rate of River Red Gums, less healthy trees from more insect and fungal attack.
Wilson (1989)
In general terms River Red Gums may not have been as extensively cleared for agriculture due to the flood prone nature of the community. There has none-the-less been extensive clearing for timber getting, earthworks (flood control) etc. Timber extraction: History – see Forestry Commission reports, Hamilton 1979 Silvicultural approach to timber extraction began in about the 1890’s or from 1926 in the Murrumbidgee management area. This involved ringbarking or removal of ‘over-mature’ trees and thinning of the often dense stands of regrowth for ‘stand improvement’. Theoretical sustained yield basis used for management.
Bren (1990)
River Red Gums form dense forests along Rivers and streams of the Murray Darling Basin and there are numerous smaller River Red Gum swamps. It also occurs in extensive woodlands in the higher rainfall regions of the Murray Valley. The forests along the Murray depend upon water from the River for their survival and often have a tree density similar to forests sustained by about 1200mm annual rainfall in an area of about 400mm. European settlement brought substantial changes to the ecology of the River Red Gum Forests – absence of fire, timber utilisation, grazing, settlement and changed water regimes. Flood in 1870 brought the first extensive regeneration over logged areas and many of the trees today are thought to date from that regeneration.
Bren (1992)
Density of River Red Gums varies from a narrow band along banks of watercourses, sometimes in a single or double row, to extensive areas of
127

woodlands or scattered trees (<20m high) and to extensive tall forests along the major rivers of the Murray system, one of the largest being the Barmah-Millewa Forest. Grass plains are also scattered through the forests, historically these were large open areas fringed by red gum. Investigated reports of encroachment of the grass plains by red gum using aerial photography. Density classification: Dense = well stocked forest with small gaps between trees; Scattered = less than 5 trees per ha (<20 trees per 200m grid cell); occasional = <1 per ha (1-3 per 200m grid cell). Demonstrated that the grass plain is being invaded by red gum with a change from about 20% dense forest in 1945 to 37% in 1985 and a reduction of the grassland (no trees) from 37% to 12.5%. The changed flooding regime was a result of water regulation (Hume Weir) is cited as the cause for this increase in distribution and density of red gums.
Denny (1992)
Changes to the riverine environment – quotes Helman and Estella (1983, The conservation status of Riverine Ecosystems in Western NSW. Report to SPCC):
‘The riverine environments of western NSW are undergoing change, This is caused mainly by continued westward movement of intensive irrigate agriculture. This change in land use has resulted in increasing demands for regulation of river flow and dramatic changes to water quality.’
Effects of the alteration of to river ecosystems include increased bank erosion, alteration of floodplain habitats, decline in River Red Gum communities etc.
Donovan (1997)
Assessment of Millewa SF, Gulpa Island SF, Moira SF. River Red Gum is dominant in these forests, almost monospecific on the flooded areas, but there are areas with other species. Sandhills have been colonised by White Cypress Pine and Yellow Box and Common Fringe Myrtle and Dwarf Cherry. On the less frequently flooded areas above the floodplain with lighter better drained soils Black Box and Grey Box occur on the margins of the Red Gum Forests. Dense red gum forests and annual flooding made the low lying parts of the pastoral runs unsuitable for farming without clearing and drainage. Management of the forests: extensive silvicultural management began in the River Red Gum forests in the 1890’s, particularly the thinning of regrowth areas. Thinning was considered necessary because of extensive regrowth of the forest after the establishment of reserves due to the absence of burning by Aboriginal people and successive wet years and regular flooding. Regrowth was dense on areas that had been heavily logged prior to the reservation of that land. Report from surveyor Charles Harnett in 1914:
“On land near the river bank and rarely flooded, which was cleared and cropped after 1870 there is now a forest of young gums from 2ft to 5ft in girth. On Portion 44 Ph Nallam I saw some long-barrelled gum
128

5ft in girth on land which I am credibly informed was absolutely cleared of green timber in 1895.”
The suggestion is that the early forests were a scattered woodland [undefined] with some tall native shrubs. This structure may have been maintained by Aboriginal burning of the undergrowth. ….. The forests are now younger and healthier and probably more heavily stocked than in 1750. After thinning, tree density was 140 ‘healthy young trees’ to the hectare. Ringbarking of gnarled and deformed trees and the thinning of regrowth continued into the early years of the 20th Century. Without intervention it has been shown that River Red Gum stands self thin to a stocking rate of about 500 to 700 trees per ha. Self-thinning occurs from below by retarding the development of new trees while the overstorey thickens. Forestry practices thin from above and encourage development of healthy new trees. Changes in the water regime has also resulted in the invasion by gums of several plains within the forests area and the fringes of swamps such as the Moira lake and reedbeds. Letter from Mr Manton, Inspecting Forester to the undersecretary for Mines and Agriculture, 1895:
“I estimate that there are two matured red gum trees to the acre [5/ha] fit for saw-mill purposes; trees full of growth, but valueless by reason of their being hollow, spongy and winding growth, at about 8 to the acre [20/ha]; young vigorous and healthy trees, varying from 16 in. [40 cm] to 20 in. [50 cm] in diameter, may be reckoned at 7 to the acre [17.5/ha]; while on large areas there is a dense growth of young trees numbering in places over 2,000 to the acre [5000/ha].” “Had the forests been left in their unassisted state, where there are now fifty to sixty such trees to the acre [125 to 150 / ha] there would probably not have been more than five or six [12.5 or 15 / ha].” Where there was one young tree in 1875, when I took charge of the forest reserves, there are now twenty, and all that is required to make these reserves almost practically inexhaustible is the inexpensive work of thinning.” [This suggests a 20 fold increase in the density of harvestable timber]
Allen (1983)
The 1956 floods caused the growth of large areas of river red gum seedlings along the floodplains of the Lachlan, Murrumbidgee and Murray.
Margules Report (1990)
River Murray Riparian Vegetation Survey designed to assess the status of the vegetation along the Murray, to identify causes of degradation and to develop solutions for its rehabilitation and long term stability. Definition of plant communities and structural vegetation classes provided: sixteen structural vegetation classes and four non-vegetation classes (urban, quarries, sand dunes, water bodies) identified by the mapping (see Fig 4.4).
129

Eucalypt health was measured by the condition of the trees and the density of the regeneration. The River was divided into 8 sections: 1. Wodonga to Yarawonga; 2. Yarrawonga to Tocumwal; 3. Barmah area; 4. Deniliquin to Wakool Junction; 5. Wakool to Wentworth; 6. Wentworth to Loxton; 7. Loxton to Mannum; 8. Mannum to Lake Alexandrina. Regeneration (number / ha 5- 20cm dbh) E. camaldulensis: Sect 1: 452; Sect 2: 185; Sect 3: 957; Sect 4: 579; Sect 5: 480; Sect 6: 301; Sect 7: 130; Sect 8: 93. E. largiflorens: Sect 4: 203 Sect 5: 331; Sect 6: 7; Sect 7: 10. Plant Communities: Red Gum Zone: Red-Gum Open Forest (8 communities, floristically distinct): 838/ha 163/ha, 736/ha, 50/ha, 950/ha, 863/ha, 356/ha, 250/ha Red Gum Woodland (5 Communities floristically distinct): 466/ha, 273/ha, 60/ha, 28/ha, 88/ha, Red Gum – Black Box Open Forest: 67 red gum, 428 black box. Red Gum – Lignum: 44/ha. Scrub/Grasssland/Herbland: 525/ha, 558/ha, 4080/ha. Black Box Zone: Black Box Open Forest: Nil; (areas of increased flooding) Black Box – Lignum: 201/ha; 6/ha. Black Box – Salt Bush: 103/ha Rises: Grey Box Open Forest: 625/ha. Yellow Box Woodland: 56/ha White Cypress Woodland: 58/ha (Cypress)
Mulga (Acacia aneura) Neldner (1986)
Mulga associations vary greatly in their structure but reach their highest development as open-forests on the deep loamy red earths, south-east of Charleville. Mulga densities of 1,200 stems/ha (up to 8,000) and heights of 10-15m with a projected foliage cover of 30-40% are typical of these open forests. As the availability of moisture decreases the height and density of the Mulga decreases so that in very arid habitats Mulga only occurs as a scattered shrub (2-3m tall) in a tall open shrubland (p20). A sparse to dense (>350 shrubs/ha) low shrub layer is usually present in the eastern Mulga lands (SW Qld &NSW) with the most diverse shrub communities on the sandplains and residual scarps.
Mallee Fox (1990)
Sites at Mungo, Balranald and Pulletop. Mungo mallee had the highest stem density and clumps had about 6 stems each on average. The stem size was similar at Pulletop where there were 2 stems per plant and many standing dead stems. Relative abundance of each of the 4 Mallee species differed between each site sampled.
Mungo (mostly E. socialis): 1510 stems/ha (5.8 stems/plant)
130
Balranald (E. gracilis, E. oleosa, E. dumosa similar densities): 630 stems/ha (2 stems/plant)
Pulletop (mostly E. dumosa+ E. gracilis): 1030 stems/ha (2.1 stems/plant)
Wellington (1989)
Eucalyptus incrassata: With fire - seedling density 100,000 per ha after germination, juveniles 10,000 per ha, adult <10,000 per ha; without fire – germination 1,000 per ha per year with adult density of <10,000 per ha. With observed mortality rates the maintenance of existing population densities requires some seedling regeneration at least every few decades.
Woinarski (1989)
Broombush vegetation in mallee communities: Number of woody plant species/quadrat 2.5 (depauperate) to 10.3 (floristically rich).
Bradstock & Cohn (2002)
The Mallee overstorey varies little between whipstick (2-5m tall) and bull mallee (5-10m tall) but the understorey is more variable. The average density and cover of eucalypts are commonly insufficient for propagation of fires for many decades after fire. In Mallee communities on heavier textured soils eucalypt density may be insufficient for fire spread irrespective of time since last fire.
Woodlands / Forests of Tablelands Adamson & Fox (1982)
Eucalypt mortality due to woodland clearing and grazing + dieback - tree death due to earlier environmental changes
Northern Tablelands Forests Northern Tablelands Draft RVMP (2002)
Details descriptions by explorers. Surveyor John Oxley and his party were the first Europeans to set foot on the Tablelands. Coming from the west, they passed over the Moonbi Range and crossed the southern part of the Tablelands on their way to the coast in September 1818. Oxley made frequent mention of the forests and woodlands they passed through with descriptions such as “noble forests of stringybark”, “stately stringybark trees”, “Open forest land”, “Country either side of river open forest country”, “Country perfectly open…much fallen timber”, “finest stringybark ever saw…”, “fine open country”, and so on. ‘It is important to understand that the trees they saw were on average probably much bigger than is common in the area now (mostly being from regrowth). Mature woodland eucalypts can have a crown with a diameter of 20 metres. Trees of that size could be spaced 20 metres or more apart (the width of a wide road), and have a density of only 20 – 25 trees per hectare. At that density they would still give a woodland with an almost continuous crown cover, while being fairly “open” and easy to traverse underneath.’
131
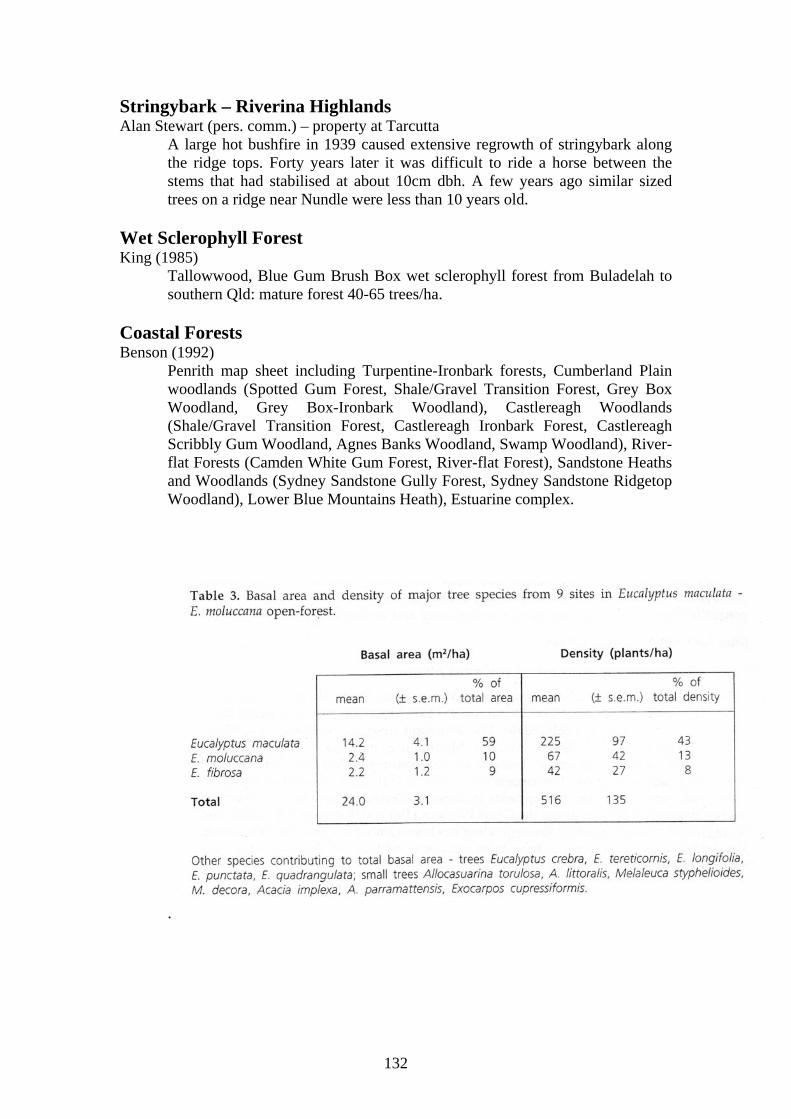
Stringybark – Riverina Highlands Alan Stewart (pers. comm.) – property at Tarcutta
A large hot bushfire in 1939 caused extensive regrowth of stringybark along the ridge tops. Forty years later it was difficult to ride a horse between the stems that had stabilised at about 10cm dbh. A few years ago similar sized trees on a ridge near Nundle were less than 10 years old.
Wet Sclerophyll Forest King (1985)
Tallowwood, Blue Gum Brush Box wet sclerophyll forest from Buladelah to southern Qld: mature forest 40-65 trees/ha.
Coastal Forests Benson (1992)
Penrith map sheet including Turpentine-Ironbark forests, Cumberland Plain woodlands (Spotted Gum Forest, Shale/Gravel Transition Forest, Grey Box Woodland, Grey Box-Ironbark Woodland), Castlereagh Woodlands (Shale/Gravel Transition Forest, Castlereagh Ironbark Forest, Castlereagh Scribbly Gum Woodland, Agnes Banks Woodland, Swamp Woodland), River-flat Forests (Camden White Gum Forest, River-flat Forest), Sandstone Heaths and Woodlands (Sydney Sandstone Gully Forest, Sydney Sandstone Ridgetop Woodland), Lower Blue Mountains Heath), Estuarine complex.
.
132

133

Lindenmeyer and Gibbons (2004)
22 hollow bearing trees/ha in unlogged sites near Eden dominated by Messmate (E. obliqua), Brown Barrel (E. fastigata) and Mountain Grey Gum (E. cypellocarpa) compared with 3/ha on logged sites – predicts a downward trend in the number and diameter distribution of trees retained on logged sites.
Austin (1978)
Tree species density and dbh collected from 50x20m plots, floristic plots 50x10m. South-coast of NSW - Sclerophyll open-forest with 68 communities. E. agglomerata – E sieberi Community: Overall stem density: 33.6/plot, (3360/ha) most in dbh classes <20 & 20-40 cm dbh. E. muellerana - E sieberi community: overall stem density 30.2/plot (3020/ha) most in dbh classes <20 & 20-40 cm dbh. E. cypellocarpa – E. muellerana community: overall stem density 19.6/plot (1960/ha) most in dbh classes <20 & 20-50 cm dbh.
Lunney and Leary (1988)
Bega Valley – Forest Red Gum (E. teretecornis) in valleys, box and Spotted Gum (E. maculata) in valleys and on slopes, stringybarks and E. longifolia. Early descriptions: ‘undulating forest lightly timbered’, ‘thickly timbered’, ‘very scrubby’, ‘open forest’. Timber abundant throughout. Wattles were harvested for their bark and the Director General of forests in 1891 said ‘portions of the country carry 200-400 trees/acre.’ Not indicated whether this is just wattles or all trees.
Goldingay and Eyre (2004)
Nowra: Grey Gum (Eucalyptus punctata) dominant or co-dominant. Included a range of forest ages from about a 1 year regrowth to >150 year old growth forest. Circular plots 20m radius (.1256 ha). Dominant tree species (>50cm dbh) in the study area (total stems counted) included Corymbia gummifera (904), Eucalyptus punctata (600), Syncarpia glomulifera (425), E. agglomerata (276), E. eugenioides (229),and C.
134

maculata (226), Angophora floribunda (109), E. paniculate (101), E. pilulatis (92), E. globoidea (83), E. sclerophyla (57), E. sparsifolia (47), E. robusta (25), E. pilularis hybrid (24), E. piperata (23), E. longifolia (20), E. fibrosa (17), E. scias (15), E. crebra (5), C. maculata hybrid (4), E. imitans (3), E. eximia (2) and E. saligna (2). All shrubs greater than 1m in height - included a total of 14 species of acacia -(2.2/site), average of 180 stems per ha per site (range 0-1134). Other common shrubs: Hakea spp (0-975 s/ha), Kunzea ambigua (0-816 s/ha), Macrozamia communis (0-530 s/ha), Banksia spinulosa (0-424 s/ha), Persoonia spp (0-403 s/ha), Lambertia formosa (0-289 s/ha), Allocasuarina littoralis (0-289 s/ha) and Leptospermum spp (0-196 s/ha).
Rainforest Fraser and Vickery (1938)
Sub-tropical rainforest: Density is variable over areas of apparently homogeneous habitat. Trees, saplings, shrubs and Alsophila. Total per 100 sq ft – range 11.74 to 23.39, mean 17.24. Sub-Antarctic Rain-forest (Beech Forest): Nothofagus moorei dominant throughout as the only large tree. Grows to 150ft and occurs with a frequency of 2.4 per 100 sq ft, evenly distributed – continuous canopy cover. Density per 100 sq ft: total 6.1 (trees 2.4, saplings 2.7, shrubs 1.1)
Burgess et al. (1975)
Sub-tropical rainforest in NSW, Sheepstation Creek Wiangarie State Forest. Trees >20 cm dbh mean stem density 284 / ha (range 227-363/ha); 44 species but dominated by 9 species (2/3). Actual stem density is presented in the table below from Burgess et al. (1975).
Fisher (1985)
1290 s/ha >10 cm girth at breast height; 870 >20 cm girth at breast height. This is at the higher end of the range of densities from other rainforests at similar latitudes and montane temperate and subtropical rainforests in NSW. Other densities are shown in the table below from Fisher (1985).
135
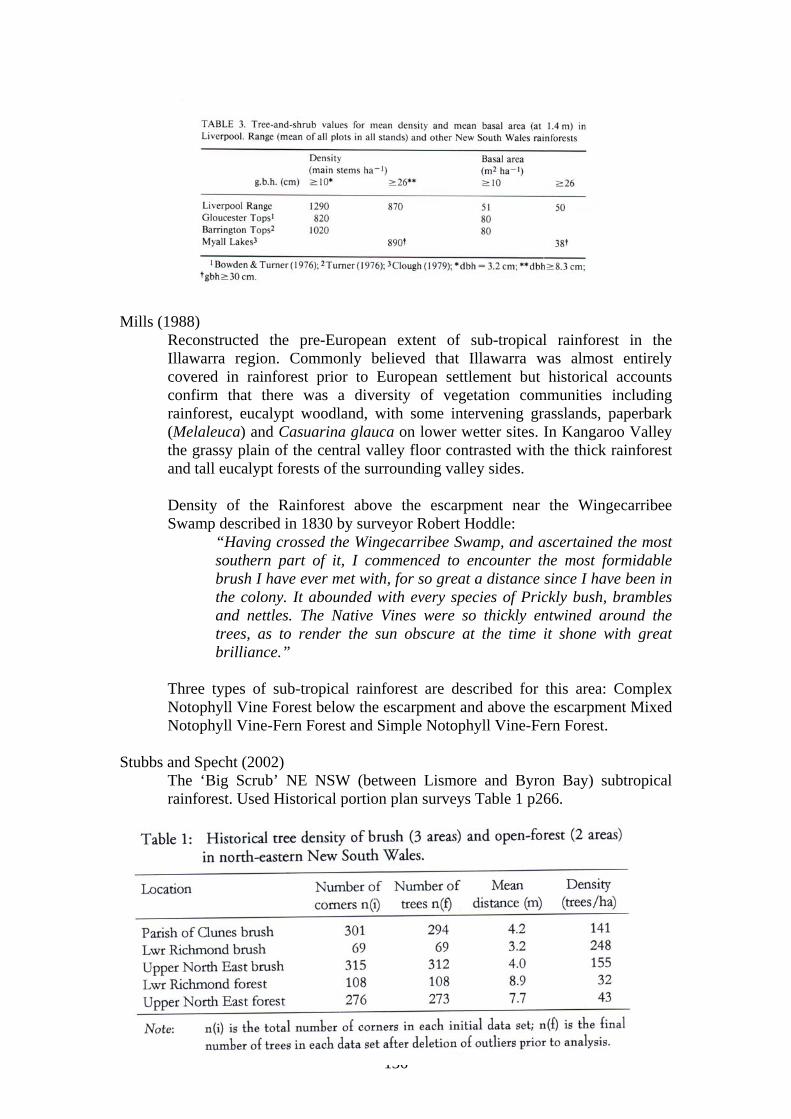
Mills (1988)
Reconstructed the pre-European extent of sub-tropical rainforest in the Illawarra region. Commonly believed that Illawarra was almost entirely covered in rainforest prior to European settlement but historical accounts confirm that there was a diversity of vegetation communities including rainforest, eucalypt woodland, with some intervening grasslands, paperbark (Melaleuca) and Casuarina glauca on lower wetter sites. In Kangaroo Valley the grassy plain of the central valley floor contrasted with the thick rainforest and tall eucalypt forests of the surrounding valley sides. Density of the Rainforest above the escarpment near the Wingecarribee Swamp described in 1830 by surveyor Robert Hoddle:
“Having crossed the Wingecarribee Swamp, and ascertained the most southern part of it, I commenced to encounter the most formidable brush I have ever met with, for so great a distance since I have been in the colony. It abounded with every species of Prickly bush, brambles and nettles. The Native Vines were so thickly entwined around the trees, as to render the sun obscure at the time it shone with great brilliance.”
Three types of sub-tropical rainforest are described for this area: Complex Notophyll Vine Forest below the escarpment and above the escarpment Mixed Notophyll Vine-Fern Forest and Simple Notophyll Vine-Fern Forest.
Stubbs and Specht (2002)
The ‘Big Scrub’ NE NSW (between Lismore and Byron Bay) subtropical rainforest. Used Historical portion plan surveys Table 1 p266.
136

The actual tree density of remnant subtropical rainforest in NE NSW and SE Qld is shown on the Table below (Table 2 p266, Stubbs and Specht 2002)
Practical requirements of a surveyors reference tree: permanence, stability, and visual prominence; led to the selection of larger trees eg 30cm – 40 cm dbh. The conclusion is supported by actual tree densities in remnants areas of similar vegetation. Suggests Lunt (1997, 1998) who obtained lower than expected tree densities using a similar technique, did not consider the surveyors tree selection needs in his interpretation.
Coastal Heathland Morris and Myerscough (1988)
Royal National Park Banksia ericifolia regeneration after wildfire; plot densities varied from 192 / m2 (dense) to 32 / m2 (sparse). Self thinning was only observed in the high growth dense plots.
137

138

Appendix 2: Source material, which is the basis of the thinning prescription summary.
Silvicultural procedures (SFNSW)
Aims: enhance biodiversity, conserve soil, water and cultural heritage. Thinning: a system applied to even aged regrowth stands to harvest some trees commercially and redistribute the site resources to the remaining trees Spacing (non-commercial thinning): system in which some trees are removed at a relatively young age from regrowth stands to promote growth of those retained. Culling (Timber Stand Improvement TSI): removal of unmerchantable mature and advance growth trees competing with established regeneration by felling ringbarking or poisoning.
Coastal and Tablelands Region (SFNSW)
Rainfall 700 to 2400mm – sea level to 1400m above sea level, not subjected to regular drought or flooding. Spotted Gum, Blackbutt, Mahogany, Ironbark, Grey Gum – different uses; dry-Ash Stringybark forests use by pulpwood industry – use Single tree selection or Australian group selection methods – thinning – allows more dominant trees to grow in even aged stands. Thinning may remove no more that 60% of the pre-existing basal area
Alpine Ash Region (SFNSW)
Snowy Mountains area – selective logging in early 20th century produced mixed aged stands with a large proportion of ‘defective’ trees; even aged stands produced by TSI with heavy logging, subsequently spaced and thinned. Self thinning is efficient, commercial thinning to 250 to 350 stems per ha at 30 years old + further thinning 15 years later.
River Red Gum (SFNSW)
Harvested selectively for local use during settlement and agriculture in the Riverina. Dense regeneration ‘with cessation of Aboriginal burning and suppression of natural fires after European settlement, a series of wet years in the 1870’s allowed dense regeneration in the formerly open red gum forests.’ During the 1890s TSI and spacing was carried out to speed development of the ‘regeneration’ stands into productive forests.’ First half of the 20th century rabbits prevented effective regeneration after harvesting or clearing in the River Red Gum forests. Openings equivalent to at least 3 mature crown widths are required to allow effective regeneration. Spacing of red gum regrowth should be done when they are 20-30 cm dbh. About 170 to 220 crop trees /ha should be retained. Thinning guidelines in Murray Management Plans for older commercial stands. Minimum basal areas of useful trees 16sq m to 25sq m /ha.
139
Box / Ironbark Forests Traill (1993)
Possible advantages of thinning coppice growth in conservation areas – refers to forestry report (Kellas et al. 1988) which reports increased growth rates in the remaining trees when thinning of surrounding growth occurred in a Bendigo Ironbark Forest – might increase the speed of restoring large mature trees to the landscape.
Parks Victoria (2004) Box-Ironbark Ecological Management Strategy (EMS) and Ecological Thinning Ecological thinning included within the ECC recommendations and National Parks (Box-Ironbark and Other Parks) Bill 2002 mean that the first trial will investigate the effectiveness of ecological thinning as a management tool. The objective of the EMS is to maintain a mosaic of box-ironbark forest types (ie species and age composition of structurally dominant trees) that support a diversity of habitats to provide long-term protection for the fauna and flora that characterise the system and maintain its function. Ecological Thinning: will retain trees of all forms and sizes, leave stems in a patchy distribution (clumps of high tree density will be retained within a general mosaic of wider spaced trees) and competition is reduced to address the low proportion of larger trees in these forests. Supporting evidence: Early successional stages with high stem densities of eucalypts common in many locations – suggests regeneration from clearing. Narrower range of habitats and lacking in hollows and woody debris. Aim of Ecological thinning i.e. to speed up the natural ageing process. Succession processes reduce stem density through self-thinning. Aim is to enhance habitat diversity to support threatened species by mimicking natural succession.
DNRE Vic (1998)
Box-ironbark forests with Grey Box, Red Ironbark, Yellow Gum, Red Box, Red Stringybark and Long-Leaved Box as principal tree species. The average stocking level across all sampled strata within the project area was 499 stems/ha, hollows 25.6 per ha. Timber harvesting prescriptions require the retention of 6 to 14 living habitat trees per ha with at least 2 large (>60cm dbh), 2 medium (40-60 cm dbh) and 2 small (20-40 cm dbh) habitat trees.
Grassy Box Woodland McIntyre (2002)
In grazing lands it is common for trees to be thinned leaving open woodlands or scattered trees (Martin et al. 2000 quoted in McIntyre 2002).
Windsor (2000)
Thinning prescription for areas of dense regeneration need to take the landscape and temporal parameters into account.
140
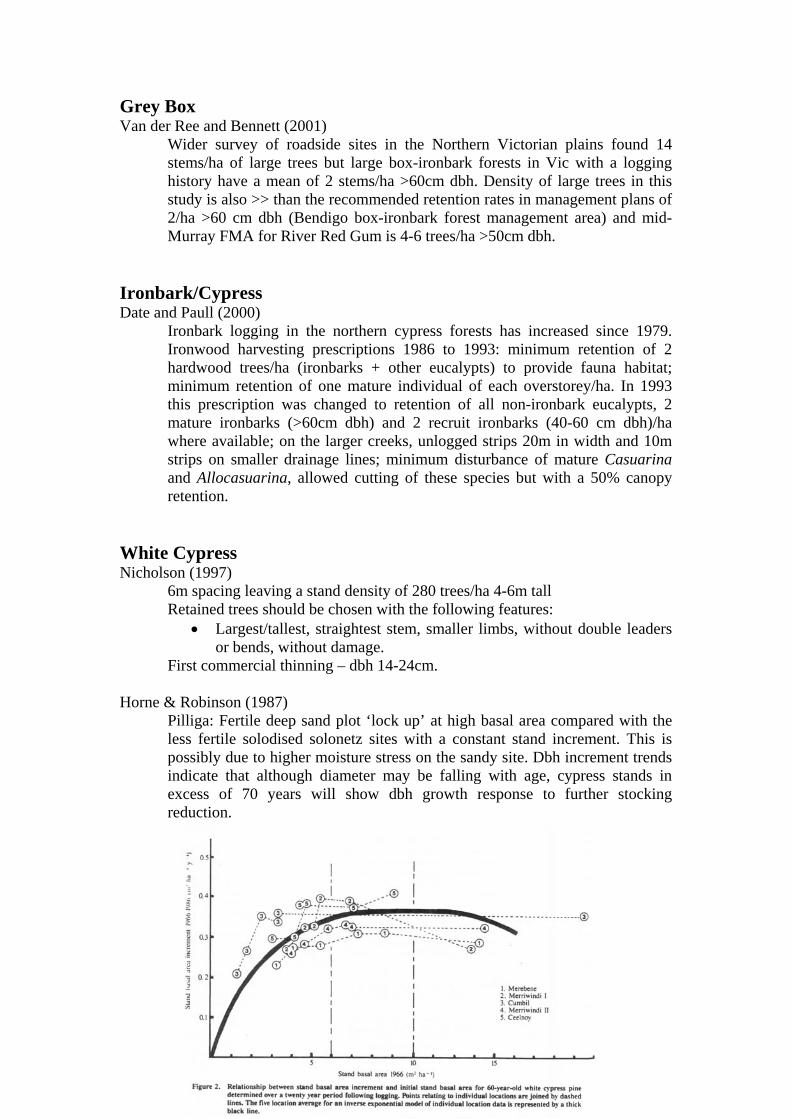
Grey Box Van der Ree and Bennett (2001)
Wider survey of roadside sites in the Northern Victorian plains found 14 stems/ha of large trees but large box-ironbark forests in Vic with a logging history have a mean of 2 stems/ha >60cm dbh. Density of large trees in this study is also >> than the recommended retention rates in management plans of 2/ha >60 cm dbh (Bendigo box-ironbark forest management area) and mid-Murray FMA for River Red Gum is 4-6 trees/ha >50cm dbh.
Ironbark/Cypress Date and Paull (2000)
Ironbark logging in the northern cypress forests has increased since 1979. Ironwood harvesting prescriptions 1986 to 1993: minimum retention of 2 hardwood trees/ha (ironbarks + other eucalypts) to provide fauna habitat; minimum retention of one mature individual of each overstorey/ha. In 1993 this prescription was changed to retention of all non-ironbark eucalypts, 2 mature ironbarks (>60cm dbh) and 2 recruit ironbarks (40-60 cm dbh)/ha where available; on the larger creeks, unlogged strips 20m in width and 10m strips on smaller drainage lines; minimum disturbance of mature Casuarina and Allocasuarina, allowed cutting of these species but with a 50% canopy retention.
White Cypress Nicholson (1997)
6m spacing leaving a stand density of 280 trees/ha 4-6m tall Retained trees should be chosen with the following features:
• Largest/tallest, straightest stem, smaller limbs, without double leaders or bends, without damage.
First commercial thinning – dbh 14-24cm. Horne & Robinson (1987)
141
Pilliga: Fertile deep sand plot ‘lock up’ at high basal area compared with the less fertile solodised solonetz sites with a constant stand increment. This is possibly due to higher moisture stress on the sandy site. Dbh increment trends indicate that although diameter may be falling with age, cypress stands in excess of 70 years will show dbh growth response to further stocking reduction.
Horne (1900a) Strahorn State Forest – 1952-1956 pine regrowth of >500 000 seedlings /ha (wheatfield regeneration). Optimal spacing treatment of later treatments was 4.9m x 4.9m (420 trees/ha) and cypress regeneration retained an ability to respond markedly to a delayed release from a ‘locked’ situation. A 6.1m x 6.1m spacing did not further improve height growth. ‘Wheatfield regeneration’ in Back Yamma SF 900 000 to 3 250 000 trees/ha + densities in excess of 125 000 trees/ha common 20 years after germination. Early and accelerated spacing treatment was considered necessary to promote development of sawlog sized trees (18cm dbhob) in a reasonable time
Horne (1990b)
White Cypress has an ability to withstand high levels of competition without an accompanying high mortality – stagnating unmerchantable forests. First thinning prescription – 1911 NSW Lands Dept – pine seedlings less than 7.6 cm (3”) at 3 ft (dbh) thin to five feet distance (keep the best for preservation) - after 3 years thin again to a distance of 7 feet apart (approx 2,200 trees/ha). This was later reduced to wider spacing at 1680 trees/ha. Thinning in the first 14 years produces a commercial sized stand in a time more dependent on final spacing and site qualities than initial spacing or number of thinnings, secondary growth after the first thinning reduced the rate of growth, optimal spacing appeared to be 2-3m resulting in a merchantable age of about 60 years. Spacings up to 6m were acceptable.
Knott (1995)
Thinning to a stocking rate of <500 trees/ha (4.5m x 4.5m) allows for a significant dbhob increment over 20-30 years. Optimal thinning treatments and resulting productivity are site/stand specific and should be determined from economic analyses of a range of thinning scenarios (commercial and non-commercial). The costs associated with different thinning strategies and control of secondary regeneration (and eucalypts) also require investigation. Under ideal climatic and site conditions germination is massive (>1,000,000/ha) and establishment (>100,000 /ha) = wheatfield regeneration. Very little regeneration will occur under sub-optimal climatic, site and stand conditions. Species is fire sensitive – especially the young regeneration. Young regeneration (for 6 to 8 years) is also detrimentally affected by grazing especially in drought years.
SFNSW
Grows on moderate to flat topography, rainfall 350 – 700mm, frequent droughts, generally well drained soils without shallow ground water – Cypress dominant on lighter soils, western hardwoods more prevalent on heavier soils and rockier sites. Black Cypress favours rocky and broken topography. Mixed
142

cypress and hardwood forests with a shrubby understorey are more common in the north. Seedling establishment is more regular in the north. Spacing: unthinned pre-commercial stands 30 years old should be to <500 stems/ha (4.5m) to optimise growth and potential sawlogs; stands >30 yrs old with basal area > 12m2/ha or stem density 500 to 700 stems/ha will respond well to thinning. Thinning to about 6m2 - 8m2 usual. Good quality hardwood stands will benefit from thinning to similar densities since they grow in a similar environment. Spacing to about 6m x 6m (about 280 trees/ha) currently considered to be the minimum treatment that will allow cypress to grow to a thinnable sawlog stand in a reasonable time
Forestry Commission (1986)
Harvesting shall not reduce stockings below 100 trees/ha. Thinnings should aim to reduce stands to a basal area of immature stems of 7-10 m2/ha.
Date & Paull (2000)
White Cypress Pine woodlands today are productive for timber only if fire is infrequent, regeneration is moderated by grazing to occur every 30 years on average and young stands thinned non-commercially to a spacing of 280 to 400 stems/ha (6-10m spacing). Culling of non-merchantable hardwoods began in the 1930’s and was often integrated with cypress thinning. Culling of eucalypts ceased in 1982 after 90,000 ha in Pilliga, 35000 ha in Dubbo and 9,000 ha in Inverell districts had been culled. Regeneration of culled non-commercial eucalypts and casuarinas has occurred since the 1980’s and SFNSW is considering the implementation of non-commercial thinning of these species within 10 years.
River Red Gum Forestry Commission (1986)
Silvicultural treatment began in 1926 with thinning and culling of larger commercially unproductive competing trees. Mostly done during 1930’s. Logging of mature stands prior to 1983 was generally highly selective with few trees removed and a large number of ‘defective, overmature trees’ were left. Mature / overmature stands form about half the red gum type. For the greater part the higher quality stands have only been lightly logged over the past 60 years and are in an overstocked condition. Future volume growth would be greatly improved by a logging to remove a proportion of the overmature trees. 13-16m2 /ha in pole sized stands produces optimal growth. No tree larger than 170cm dbh to be felled, thinning for stand improvement to no less than 16m2 basal area / ha; at least 1 and up to 5 suitable mature trees with nesting hollows per ha to be retained and in addition all such trees located within 20m of any stream, 10m of lagoons and 60m of the Murrumbidgee and Lachlan Rivers shall be retained. If not present additional trees with the highest probability of developing such hollows in the short term should be retained.
143

Graph of ‘Basal area response to thinning.’
Bennett et al. (1994)
Proposed harvesting prescriptions in River Red Gum woodlands require the retention of 4 habitat trees per ha plus all trees >150cm dbh = ¼ of the number of hollow bearing trees recorded by this study. The key question is ‘Are there sufficient hollows in the right place at the right time?”
Donovan (1997)
After thinning, tree density was 140 ‘healthy young trees’ to the hectare. Ringbarking of gnarled and deformed trees and the thinning of regrowth continued into the early years of the 20th Century. Without intervention it has been shown that red gum stands self thin to a stocking rate of about 500 to 700 trees per ha. Self-thinning occurs from below by retarding the development of new trees while the overstorey thickens.
Coolibah and Black Box Briggs & Tooth (1994)
Impacts of thinning, as distinct from clearing on terrestrial birds need to be assessed. Preliminary data suggest that there is a threshold density of trees below which the number of bird species falls. The threshold density is about 25 trees per ha (average distance between trees of about 20m). Thinning to such a threshold density may have little or no adverse impact on birds. Light thinning could be also used as a management technique to increase growth rates of larger individual trees, and maximise tree size diversity.
Maher (1995)
144

Soil Conservation Service conditions for thinning in 1967 – Box trees (including Coolibah) might be rung out provided not less than 5/ac, well distributed 10-18” dbh are retained together with not less than 5 well established juvenile trees to permit replacement of trees lost by over maturing etc. No timber to be destroyed within beds or within strips one chain wide along banks of all main watercourses, and 5 chains wide on major rivers and creeks. NPWS thinning recommendations for all land systems except for Wombeira were (in about 1986): minimum of 20 mature Coolibah/Black Box per ha be retained with even spacing (not clumped and at proportions as found in the existing vegetation); 15 regenerating Coolibah/Black Box per ha at least 5m high (not clumped and at proportions as found in the existing vegetation); less common trees not to be thinned; no clearing within 500m of the River. Thinning expectations: Landholders – final density 5-12 trees / ha of mixed ages (individual strategies vary); CaLM – final density 10-20 trees / ha, modified to include mature and juvenile trees (25/ha) + all trees with large hollows, 50% of trees with small hollows, 50% of stems 21-40 cm dbh and 41-80 cm dbh, 25% stems in 5-10 cm dbh & 11-20 cm dbh retained, 50% total area of macrohabitat (veg)type permanently protected, tree spacing & % tree cover remains above minimum levels for particular species, some no thin areas also designated; NPWS – 35 trees/ ha of mixed ages except for special sites. Preliminary natural thinning curve determined (see Figure below). At the densest site with trees from 1970’s floods 1913 live + 975 standing dead stems/ha, Plots from 1950’s floods – 128, 170, 150, 320 / ha, for the 1890 flood densities were 82-84/ha.
145

CaLM interim thinning policy proposed for early 1995 – WISE or CaLM/NPWS prescriptions? See table below and 3 possible thinning protocols
Forestry Commission (1986) Black Box harvested for fencing or other products should be felled at a maximum stump height of 20cm to encourage useable coppice growth.
Rainforest Burgess et al. (1975)
Sub-tropical rainforest, Wiangarie State Forest: Silvicultural treatments applied to natural density of 284 stems/ha >20cm dbh. Clear cutting removed over 70% of the standing basal area, selection systems less severe. Regeneration of species of potential forestry interest: Geissois benthamii (1992 stems/ha), Ackama paniculate (1455 s/ha), Cryptocarya erythroxylon (1455 s/ha), Melicope octandra (1379 s/ha), Heritiera spp (1072 s/ha). Tended to be clumped. Conclusion: from a forestry perspective, the removal of 26% basal area was worthwhile and also caused the least disturbance to the canopy.
Regrowth Wet Sclerophyll Forest King (1985)
Investigation of natural regeneration in wet sclerophyll forest dominated by E. microcorys (Tallowwood), E. saligna (Blue Gum), Lophostemon confertus (Brush Box) related to known silvicultural histories and stocking densities. This community occurs from Buladelah into southern Qld. Management strategies based on the results are assessed.
146

894 plots which had been burnt after logging: median regeneration stocking was 977 trees/ha (291- 2384/ha). 1196 plots had no follow-up post-logging burn: median 290 trees/ha (63-574 /ha).
The regeneration was significantly higher on plots where soil disturbance had occurred. The mature overstorey of this forest (40-65 trees/ha) rarely form a closed canopy and the gaps vary in size.
Doherty (1998)
Kellas, Jarrat, Morgan (1988) found a change in potential overstorey species composition after shelterwood cutting in the Wombat SF (Vic) – effectively a form of thinning the operation was designed to assist the regeneration of Messmate (E. obliqua) but instead allowed suppressed lignotuberous growth of peppermints (E. dives and E. radiata) to be released – change in harvesting technique produced a change in species dominance in this forest.
147

148

Appendix 3: Vegetation Legislation in NSW Native Vegetation Act 2003 Part 2 Key concepts 6 Meaning of native vegetation
(1) For the purposes of this Act, native vegetation means any of the following types of indigenous vegetation: (a) trees (including any sapling or shrub, or any scrub), (b) understorey plants, (c) groundcover (being any type of herbaceous vegetation), (d) plants occurring in a wetland.
(2) Vegetation is indigenous if it is of a species of vegetation, or if it comprises species of vegetation, that existed in the State before European settlement.
(3) For the purposes of this Act, native vegetation does not include any mangroves, seagrasses or any other type of marine vegetation to which section 205 of the Fisheries Management Act 1994 applies.
7 Meaning of clearing native vegetation
For the purposes of this Act, clearing native vegetation means any one or more of the following: (a) cutting down, felling, thinning, logging or removing native vegetation, (b) killing, destroying, poisoning, ringbarking, uprooting or burning native vegetation.
Note. See Division 3 of Part 3 for the exclusion of routine agricultural management and other farming activities from constituting the clearing of native vegetation if the landholder can establish that any clearing was carried out for the purpose of those activities. 8 Meaning of broadscale clearing
For the purposes of this Act, broadscale clearing of native vegetation means the clearing of any remnant native vegetation or protected regrowth. Note. See sections 14 (3) and 29 and the provisions of sections 18–25.
9 Meanings of remnant native vegetation and regrowth
(1) For the purposes of this Act, remnant native vegetation means any native vegetation other than regrowth. (2) For the purposes of this Act, regrowth means any native vegetation that has regrown since the earlier of the following dates:
(a) 1 January 1983 in the case of land in the Western Division and 1 January 1990 in the case of other land, (b) the date specified in a property vegetation plan for the purposes of this definition (in exceptional circumstances being a date based on existing rotational farming practices).
(3) In subsection (2) (b), existing rotational farming practices means rotational farming practices:
149

(a) that are reasonable and in accordance with accepted farming practice, and (b) that have been in place since the date specified in the plan.
(4) Regrowth does not include any native vegetation that has regrown following unlawful clearing of remnant native vegetation or following clearing of remnant native vegetation caused by bushfire, flood, drought or other natural cause.
10 Meaning of protected regrowth
(1) For the purposes of this Act, protected regrowth means any native vegetation that is regrowth and that is identified as protected regrowth for the purposes of this Act in: (a) a property vegetation plan, or (b) an environmental planning instrument, or (c) a natural resource management plan of a kind prescribed by the regulations, or (d) an interim protection order under this section.
(2) For the purposes of this Act, protected regrowth also includes any native vegetation that is regrowth and that has been grown or preserved (whether before or after the commencement of this Act) with the assistance of public funds granted for biodiversity conservation purposes.
(3) Before native vegetation is identified as protected regrowth in an instrument referred to in subsection (1) (a)–(c), the person or body making or approving the instrument must be satisfied that, based on available scientific evidence, the preservation of the vegetation is consistent with State-wide natural resource management standards and targets adopted for the purposes of the Catchment Management Authorities Act 2003.
(4) Before native vegetation is identified as protected regrowth in a property vegetation plan, the Minister is to have regard to the social and economic implications of the preservation of the vegetation.
(5) The Minister may make and publish an interim protection order for the purpose of protecting regrowth from being cleared pending an assessment of whether it should be identified as protected regrowth.
(6) The regulations may make provision for or with respect to the making, duration and revocation of, and other matters relating to, interim protection orders under this section.
(7) The landholder of any land affected by an interim protection order under this section may appeal to the Land and Environment Court against the making of the order.
11 Meaning of routine agricultural management activities
(1) For the purposes of this Act, routine agricultural management activities mean any of the following activities on land carried out by or on behalf of the landholder: (a) the construction, operation and maintenance of rural infrastructure:
(i) including (subject to the regulations) dams, permanent fences, buildings, windmills, bores, air strips (in the Western Division), stockyards, and farm roads, but
150

(ii) not including rural infrastructure in areas zoned as rural-residential under environmental planning instruments or on small holdings (as defined in the regulations),
(b) the removal of noxious weeds under the Noxious Weeds Act 1993, (c) the control of noxious animals under the Rural Lands Protection Act 1998, (d) the collection of firewood (except for commercial purposes), (e) the harvesting or other clearing of native vegetation planted for commercial purposes, (f) the lopping of native vegetation for stock fodder (including uprooting Mulga in the Western Division in areas officially declared to be drought affected), (g) traditional Aboriginal cultural activities (except commercial activities), (h) the maintenance of public utilities (such as those associated with the transmission of electricity, the supply of water, the supply of gas and electronic communication), (i) any activity reasonably considered necessary to remove or reduce an imminent risk of serious personal injury or damage to property.
(2) The regulations may make provision for or with respect to extending, limiting or varying the activities that are routine agricultural management activities, and subsection (1) is to be construed accordingly.
Native Vegetation Conservation Act 1997 Definitions These are the definitions that were in use at the time the Regional Vegetation management Plans were being drafted. Refer to these when in relation to the Thinning prescriptions from the RVMP’s discussed in Section 3. Clearing: "a. cutting down, felling, thinning, logging or removing native vegetation, b. killing, destroying, poisoning, ringbarking, uprooting or burning native vegetation c. severing, topping or lopping branches, limbs, stems or trunks of native vegetation, d. substantially damaging or injuring native vegetation in any other way Clearing native vegetation, does not include sustainable grazing. Sustainable grazing is the level of grazing that, in the opinion of the Director-General DLWC, the vegetation concerned is capable of supporting without resulting in a substantial long-term modification of the structure and composition of the vegetation". Native Vegetation "Any of the following types of indigenous vegetation: trees; understorey plants; groundcover; and plants occurring in a wetland (Section 6 (1) of Native Vegetation Conservation Act 1997). Native vegetation does not include any mangroves, seagrasses or any other type of marine vegetation within the meaning of the
151
Fisheries Management Act 1994 (Section 6 (3) Native Vegetation Conservation Act 1997)". Vegetation on Protected Land "Any native vegetation on the protected land, and any tree on the protected land (regardless of whether it is dead or alive, standing or fallen, or whether it is indigenous), but does not include any type of non-indigenous vegetative groundcover".
152