colin mccrow - abf costing - queensland health - the impact of coding chronic disease patients
TRANSCRIPT

The Impact of Chronic
Disease in ABF Environments
Colin McCrow
Manager
ABF Costing

Objectives
• In this session we will
• Outline the impacts of Chronic Disease in
an ABF Funding Environment.
• Review issues that affect our ability to
accurately undertake variance analysis
when searching for opportunities for
improvement.

OVERVIEW Impact of Chronic Disease in ABF Environments

Overview • The accurate identification of patients with
chronic disease, along with the introduction
of planned management programs, provides
a number of challenges to the data analysis
team.
• Yet this is an area where we can have a real
impact on patient outcomes and where we
can objectively analyse the reasons
underlying variance between outliers and
the norm.

Overview
• This paper will review what the data tells
us about the current status of the impact of
chronic disease.
• It will outline how we can measure some
chronic disease outcomes
• It will outline the challenges we need to
conquer in an ABF environment.

Research reports • Chronic disease accounts for over 70% of
Australian disease burden, measured by
disability-adjusted life-years, and is
expected to increase to 80% by 2020.
• Recent evidence demonstrates that
prevalence of disease in Australia is
associated with high health care utilization
and increasing medical expenditures. (1)

Research reports • The length of time patients spend in hospital
for specific conditions has a large impact on
overall health system costs. Although longer
hospital stays can be due to factors outside
a hospital’s control, it is also likely there are
considerable opportunities to increase
efficiency by reducing longer hospital stays,
provided patients are not put at risk by being
sent home too soon.(2)
Research reports • COPD is a chronic debilitating, progressive
deteriorating and incurable disease. Patients
with this pathological condition experience
different levels of breathlessness, air hunger
and activity intolerance. Apart from the
patient's outcome, COPD also brings about
an overwhelming impact on health service
utilization. This disease causes considerable
morbidity and hospital readmission
worldwide. (3)
COST IMPACT Impact of Chronic Disease in ABF Environments
Cost Impact • We know that patients who stay longer cost
more.
• We know that patients who use more health
services cost more.
• We know that patients who are more
frequently hospitalised are more likely to
contract hospital acquired conditions.
Data Build Notes
• In order to be able to identify patients with
one or more chronic diseases for this
study admitted patients who had been
coded with one or more chronic disease
conditions where identified. Using their
facility code and patient master index
number we were then able to identify all
ED and outpatient records for that patient.

Admitted (Including Boarders)
Emergency Presentation
Outpatients (Inlcuding Unlinked)
$- $5,000,000,000.00 $10,000,000,000.00 $15,000,000,000.00 $20,000,000,000.00 $25,000,000,000.00
Admitted (Including Boarders) Emergency Presentation Outpatients (Inlcuding Unlinked)
Total Cost $20,247,221,376.97 $2,702,851,889.30 $6,637,227,988.70
CDM Cost $3,072,201,462.84 $292,365,429.43 $388,008,368.49
CDM Costs as part of total Costs by Epsiode Type NHCDC 09-10 to 12-13

85%
15%
NHCDC 09-10 to12-13 Cost Impact Admitted
Admitted No Chronic Disease Admitted With Chronic Disease
89%
11%
NHCDC 09-10 to12-13 Cost Impact Emergency Presentations
ED No Chronic Disease ED With Chronic Disease
94%
6%
NHCDC 09-10 to12-13 Cost Impact Outpatients
Outpatients no Chronic Disease Outpatients with Chronic Disease
As can be seen the cost
impact of patients having
one or more chronic
diseases has a significant
impact on the health care
organisation

09-10 10-11 11-12 12-13
Cost $482,525,945.52 $713,182,379.29 $1,324,654,126.36 $1,232,212,809.59
$-
$200,000,000.00
$400,000,000.00
$600,000,000.00
$800,000,000.00
$1,000,000,000.00
$1,200,000,000.00
$1,400,000,000.00
All flagged Chronic Disease Encounters QLD Total Cost 09-10 to 12-13
Staffing cuts
impacted costs
A number of
smaller facilities
not included in
09-10 NHCDC

$-
$100,000,000.00
$200,000,000.00
$300,000,000.00
$400,000,000.00
$500,000,000.00
$600,000,000.00
$700,000,000.00
$800,000,000.00
$900,000,000.00
$1,000,000,000.00
Cost- All flagged Chronic Disease by HHS Of residence 09-10 to 12-13
Cost

Cairns and Hinterland 5.66%
Cape York 0.16%
Central Queensland 4.69%
Central West 0.15%
Darling Downs 5.24%
Darling Downs/Central Queensland
0.01%
Gold Coast 6.98%
Mackay 3.66%
Metro North 23.47%
Metro North / West Moreton 0.13%
Metro South 18.89%
North West 1.11%
No mapped Postcode 0.06%
Outside QLD 1.23%
South West 0.19%
Sunshine Coast 8.36%
Torres Strait-Northern Peninsula 0.14%
Townsville 6.27%
West Moreton
5.75%
Wide Bay 7.86%
Cost- All flagged Chronic Disease by HHS Of residence 09-10 to 12-13

1
10
100
1,000
10,000
100,000
1,000,000
10,000,000
100,000,000
1,000,000,000
Dia
be
tes
Angin
a
Dia
be
tes C
VD
CV
D C
KD
RH
D
Dia
be
tes C
OP
D C
VD
Angin
a C
CF
Dia
be
tes C
KD
Dia
be
tes C
VD
CC
F
Dia
be
tes C
VD
CK
D C
CF
Dia
be
tes C
OP
D C
VD
CK
D C
CF
Dia
be
tes A
ngin
a A
naem
ia
Dia
be
tes C
OP
D C
VD
CC
F
CC
F H
yp
ert
en
sio
n
CO
PD
Hypert
ensio
n
CO
PD
CC
F A
na
em
ia
CV
D H
ype
rtensio
n
Dia
be
tes C
OP
D C
KD
Angin
a A
sth
ma
Dia
be
tes C
VD
CK
D C
CF
An
aem
ia
Dia
be
tes C
VD
Nu
tritio
na
l_deficie
ncie
s
Dia
be
tes C
OP
D A
ngin
a A
na
em
ia
Dia
be
tes A
ngin
a A
sth
ma
CV
D C
KD
RH
D
Dia
be
tes C
OP
D C
VD
CK
D A
ngin
a C
CF
CO
PD
CV
D C
KD
Angin
a
CO
PD
RH
D
CO
PD
Angin
a A
na
em
ia
CV
D C
KD
Angin
a C
CF
CO
PD
CK
D A
ngin
a
Dia
be
tes C
VD
CK
D A
ngin
a H
ypert
ensio
n
CK
D A
nae
mia
CV
D N
utr
itio
na
l_deficie
ncie
s
Dia
be
tes C
OP
D C
KD
Asth
ma
CC
F
Anae
mia
Nu
tritio
na
l_d
eficie
ncie
s
CC
F N
utr
itio
nal_
de
ficie
ncie
s
CO
PD
CV
D A
ngin
a H
yp
ert
en
sio
n
Dia
be
tes C
OP
D A
ngin
a A
sth
ma A
nae
mia
CO
PD
CV
D C
KD
Anae
mia
CO
PD
Asth
ma R
HD
Dia
be
tes C
OP
D C
VD
Angin
a A
naem
ia
CO
PD
CV
D H
ype
rte
nsio
n
CO
PD
Asth
ma C
CF
CO
PD
Angin
a H
yp
ert
en
sio
n
Angin
a A
naem
ia R
HD
Dia
be
tes C
OP
D C
VD
CK
D H
ype
rtensio
n
Asth
ma
Hypert
en
sio
n
CV
D A
ngin
a A
naem
ia
Dia
be
tes C
OP
D C
VD
Asth
ma
Angin
a A
sth
ma H
ype
rtensio
n
Chronic Disease Cost (Log scale)
$-
$2,000,000.00
$4,000,000.00
$6,000,000.00
$8,000,000.00
$10,000,000.00
$12,000,000.00
$14,000,000.00
$16,000,000.00
$18,000,000.00
$20,000,000.00
Am
ou
nt
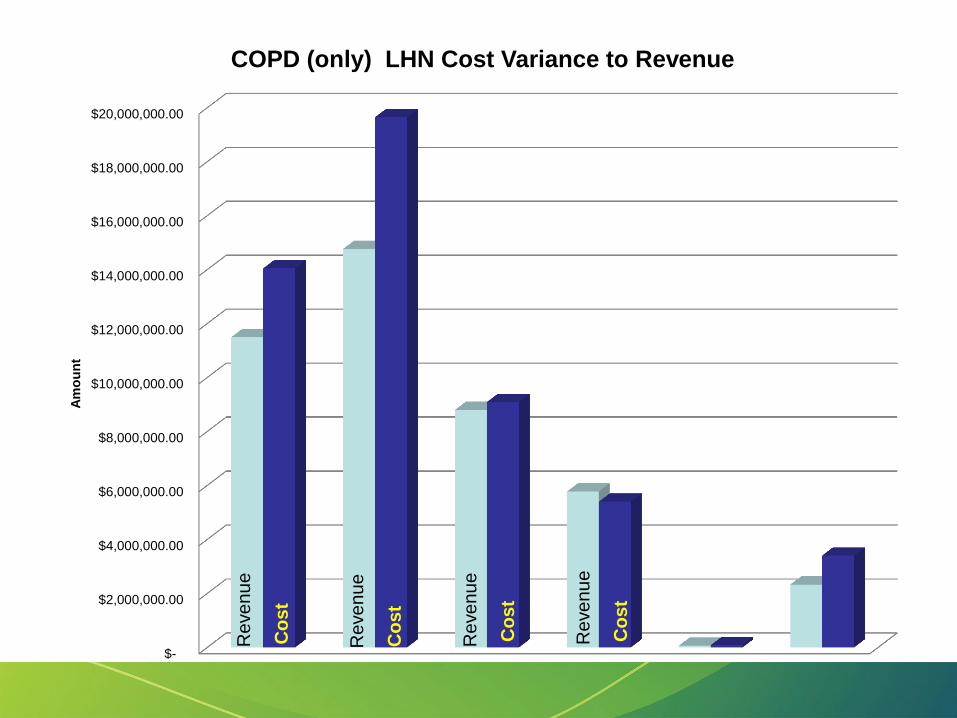
COPD (only) LHN Cost Variance to Revenue
Re
ve
nu
e
Re
ve
nu
e
Re
ve
nu
e
Re
ve
nu
e
Co
st
Co
st
Co
st
Co
st

RBWH Prince Charles Redcliffe Caboolture KilcoyTreated at Non MN
Hospitals
Cost_Var $(379.24) $(597.64) $(84.25) $122.28 $(1,630.55) $(727.46)
$(1,800.00)
$(1,600.00)
$(1,400.00)
$(1,200.00)
$(1,000.00)
$(800.00)
$(600.00)
$(400.00)
$(200.00)
$-
$200.00
$400.00
Var
ian
ce t
o r
eve
nu
e
COPD Only LHN Average Cost Variance 11-12 & 12-13

ACUITY & SERVICE VOLUME
IMPACT
Impact of Chronic Disease in ABF Environments
Service Volume Impacts of
Chronic Disease • Patients with chronic diseases will require
more healthcare intervention and support
regardless of length of stay.
• This impact can be seen across all service
settings.
• The higher the % of your population with
Chronic disease the bigger the impost on
service need.

09-10 10-11 11-12 12-13
Encounters 307108 424668 613658 670575
0
100000
200000
300000
400000
500000
600000
700000
800000
No
of
serv
ice
en
cou
nte
rs
All flagged Chronic Disease Encounters QLD Total Volume 09-10 to 12-13
A number of
smaller facilities
not included in
09-10 NHCDC

Cairns and Hinterland 6.03% Cape York
0.16% Central Queensland
5.83%
Central West 0.10%
Darling Downs 4.38%
Darling Downs/Central Queensland
0.01%
Gold Coast 7.00%
Mackay 4.68%
Metro North 21.08%
Metro North / West Moreton 0.11%
Metro South 17.02%
North West 1.17%
No mapped Postcode 0.03%
Outside QLD 0.73%
South West 0.10%
Sunshine Coast 8.05%
Torres Strait-Northern Peninsula 0.12%
Townsville 8.61%
West Moreton 5.31%
Wide Bay 9.48%
Encounter Volume % All Flagged Chronic Disease by HHS of residence 09-10 to 12-13

0%
10%
20%
30%
40%
50%
60%
70%
80%
90%
100%
Admitted (Including Boarders)
Emergency Presentation
Outpatients (InlcudingUnlinked)
Admitted (Including Boarders) Emergency Presentation Outpatients (Inlcuding Unlinked)
Total Vol 3915184 4656179 17166147
CDM VOL 655639 361345 999025
CDM Health Interactions as % of Total Interactions NHCDC 09-10 TO 12-13
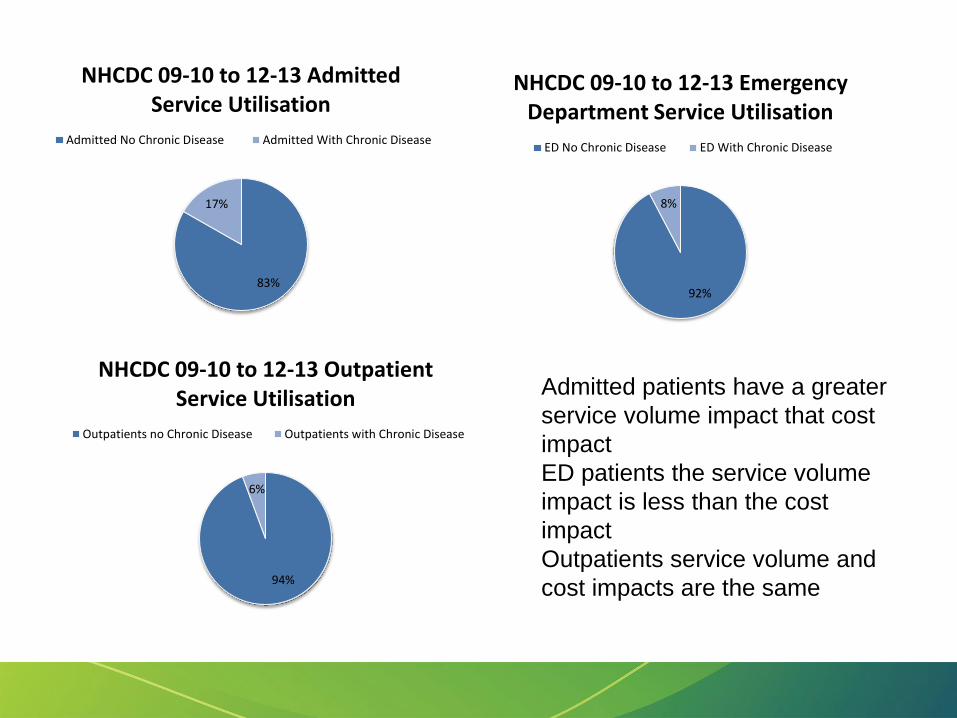
83%
17%
NHCDC 09-10 to 12-13 Admitted Service Utilisation
Admitted No Chronic Disease Admitted With Chronic Disease
92%
8%
NHCDC 09-10 to 12-13 Emergency Department Service Utilisation
ED No Chronic Disease ED With Chronic Disease
94%
6%
NHCDC 09-10 to 12-13 Outpatient Service Utilisation
Outpatients no Chronic Disease Outpatients with Chronic Disease
Admitted patients have a greater
service volume impact that cost
impact
ED patients the service volume
impact is less than the cost
impact
Outpatients service volume and
cost impacts are the same

1
10
100
1,000
10,000
100,000
1,000,000D
iab
ete
s
CV
D
Dia
be
tes
An
gin
a
CV
D C
KD
CO
PD
CC
F
Dia
be
tes
CO
PD
CV
D
CO
PD
Ast
hm
a
CO
PD
An
aem
ia
CC
F A
nae
mia
Dia
be
tes
CV
D A
ngi
na
Dia
be
tes
CO
PD
An
gin
a C
CF
An
gin
a A
nae
mia
CV
D C
KD
CC
F
CV
D A
sth
ma
Dia
be
tes
CO
PD
CV
D C
CF
CO
PD
An
gin
a C
CF
Hyp
ert
ensi
on
An
aem
ia
Dia
be
tes
CO
PD
CV
D C
KD
An
gin
a
CO
PD
CV
D A
ngi
na
CV
D A
ngi
na
CC
F
Dia
be
tes
Ast
hm
a C
CF
Dia
be
tes
CO
PD
An
aem
ia
Dia
be
tes
An
gin
a C
CF
Hyp
erte
nsi
on
CV
D R
HD
Dia
be
tes
CV
D C
KD
An
gin
a C
CF
CK
D A
ngi
na
CO
PD
CK
D A
ngi
na
CO
PD
RH
D
CO
PD
An
gin
a C
CF
An
aem
ia
CO
PD
Nu
trit
ion
al_
def
icie
nci
es
Dia
be
tes
CV
D A
ngi
na
An
aem
ia
CV
D C
CF
An
aem
ia
Dia
be
tes
CO
PD
Hyp
ert
ensi
on
An
aem
ia
Dia
be
tes
CV
D N
utr
itio
nal
_def
icie
nci
es
Dia
be
tes
CV
D A
ngi
na
Hyp
ert
ensi
on
Dia
be
tes
CO
PD
CV
D A
nae
mia
CO
PD
CK
D C
CF
Dia
be
tes
CO
PD
An
gin
a A
sth
ma
An
aem
ia
CO
PD
CV
D C
KD
Hyp
erte
nsi
on
An
aem
ia
Dia
be
tes
An
gin
a A
sth
ma
CC
F
Dia
be
tes
CV
D C
KD
Hyp
ert
ensi
on
An
aem
ia
CO
PD
Ast
hm
a R
HD
Dia
be
tes
CO
PD
Hyp
ert
ensi
on
Dia
be
tes
CV
D C
KD
RH
D
Dia
be
tes
CK
D A
ngi
na
CC
F
Dia
be
tes
CV
D R
HD
CO
PD
CV
D A
ngi
na
Hyp
erte
nsi
on
Dia
be
tes
CO
PD
CV
D A
sth
ma
CV
D A
ngi
na
An
aem
ia
Dia
be
tes
CK
D H
yper
ten
sio
n
Chronic Disease Encounters (Log scale)

11.48%
35.72%
7.67% 4.13%
41.00%
total rd 14 (09-10)
"A" DRG B" DRG "C"DRG D" DRG "Z"DRG
DRG Profile Changes
9.99%
37.87%
7.72% 4.06%
40.36%
total rd 15 (10-11)
"A" DRG B" DRG "C"DRG D" DRG "Z"DRG
11.14%
37.68%
7.91% 3.87%
39.40%
total rd 16 (11-12)
"A" DRG B" DRG "C"DRG D" DRG "Z"DRG
12.90%
36.70%
14.91% 3.68%
31.82%
total rd 17(12-13)
"A" DRG B" DRG "C"DRG D" DRG "Z"DRG
Version
5.2
Version
6.0x
Version
6.0x Version
6.0x

12.88%
36.32%
15.82% 3.53%
31.45%
total rd 18 (13-14)
"A" DRG B" DRG "C"DRG D" DRG "Z"DRG
DRG Profile Changes
Version
7.0
The proportion of A DRG’s has been
rising over the last four years. This
may be due to four factors:
• Increase in real acuity
• Greater number of patients with
Chronic Disease.
• Improved documentation and
coding of comorbid conditions
with the introduction of ABF
• Improved Classification (note
slight reduction in A DRG’s with
introduction of version 7.0 DRG’s
for whole Jurisdiction data)
Note: some LHNs did not show a drop in A DRG’s for 13-14 they continue to
has a rise in overall A DRG percentage

ISSUES AFFECTING
ANALYSIS
Impact of Chronic Disease in ABF Environments

Analysis Issues
• Formal Coding only in admitted settings,
Data from other settings need to be
matched first to build a patient profile.
• Changes in coding rules regarding chronic
disease makes baseline and time series
analysis difficult.
• Remote settings with less admitted
services may not be able to identify all
chronic disease patients from coded data.

Documentation & Coding
Impacts
94%
6%
Numbers of Chronic Diseases 09-10-12-13
One Chronic Disease Multiple Chronic Diseases
38%
62%
Missing Chronic Diagnosis09-10 to 12-13
Chronic Diagnosis not identified in subseqent episode
Chronic Diagosis On subsequent episode
Note: For patients with multiple chronic diseases once identified on
some future presentation each prior chronic disease may not be
coded. For example a patient with Diabetes and COPD may only
have diabetes coded as a comorbid condition on subsequent
admissions.

DISCUSSION Impact of Chronic Disease in ABF Environments

Discussion Points
• What can we do about improving the
identification, documentation and coding of
comorbid conditions?
• Do new information systems provide the
answer ?
• How do we manage the significant lack of
coding data in ambulatory care ?
CONCLUSIONS Impact of Chronic Disease in ABF Environments

Conclusions • Management in an ABF environment
requires us to understand fully the patient
journey. This is a data driven exercise. We
need to ensure that we can accurately
collect and classify the data across the
continuum of care.
• Chronic Disease has a significant impact on
health service provision and we need to be
able to respond to the challenges this brings.

References
1. 2013, Hamar,G.B.,Rula, E.Y., Wells, A., Coberley, C., Pope, J.E. &
Larkin, S., “ Impact of Chronic Disease Management Programs on
Hospital Admissions and Readmissions in An Australian Population wit
Heart Disease or Diabetes”, Population Health Management, Vol 16.
No. 2 (http://www.aph.gov.au/DocumentStore.ashx?id=70f68540-
226d-455e-aefb-0e4511511fa1)
2. 2013,National Health Performance Authority “ Hospital Performance;
Length o stay in public Hospitals in 2011-12”
(http://www.myhospitals.gov.au/docs/default-source/our-report-
pdfs/HP_LengthOfStay_2011-12_RPT.pdf)

References
3. 2013,Henry, P.C.L, Man,C.S.,Fung,Y.S., “ Effectiveness of nurse-led
disease management programs on health outcomes and health service
utilisation in adult patients with chronic obstructive pulmonary disease:
A systematic review protocol”, JBI Database of Systematic Reviews
and Implementation reports, Vol 11. No 1.
(http://www.joannabriggslibrary.org/jbilibrary/index.php/jbisrir/article/v
iew/615/988)

Questions & Contact
Information
Please direct any questions to:
Colin McCrow
Manager ABF Costing
Healthcare Purchasing & System Performance Branch
Queensland Health
Email : [email protected]