cold venting and fugitive emissions from norwegian ... · cold venting and fugitive emissions from...
TRANSCRIPT

M-515|2016
Cold venting and fugitive emissions from Norwegian offshore oil
and gas activities
Summary report
Prepared for the Norwegian Environment Agency
Geir Husdal Lene Osenbroch Özlem Yetkinoglu
Andreas Østebrøt
12 April 2016

COLOPHON
Executive institution
Add Novatech AS
Project manager for the contractor Contacts at the Norwegian Environment Agency
Geir Husdal Sissel Wiken Sandgrind/Bjørn A Christensen
M number Year Number of pages Norwegian Environment Agency contract number
M-515|2016 2016 26 14088187
Publisher Financed by
Norwegian Environment Agency Norwegian Environment Agency
Authors
Geir Husdal, Lene Osenbroch, Özlem Yetkinoglu and Andreas Østebrøt
Title
Cold venting and fugitive emissions from Norwegian offshore oil and gas activities – summary report
Summary
The report presents a survey and mapping of direct methane and NMVOC emissions from Norwegian offshore
installations, an updated estimate of emission inventories, proposals for improved future quantification of the emissions
and an assessment of emission abatement opportunities. A total of 48 potential emission sources were identified. A
small number of these sources contributed a dominant proportion of the emissions. Annual direct emissions were
estimated to be about 12 500 tonnes of methane and 7 500 tonnes of NMVOC (2014), significantly lower than previously
reported. However, the level of uncertainty is high, and particularly the contribution from fugitive emissions. New
generic quantification methodologies are proposed for the major proportion of the emission sources. However,
installation-specific quantification methods are recommended for some emission sources. It is proposed to compensate
for emissions from sources making an insignificant contribution by adding a standard mark-up. Techniques and methods
which enable total elimination of emissions from some of the major sources were identified. These techniques, which
are already implemented on some of the installations currently in operation, can reduce the emissions significantly if
implemented on future new installations. However, implementing emission abatement measures on existing
installations can be costly.
4 Subject words
Offshore installations, emissions, methane, NMVOC
Front page photo
Heimdal. Source: Statoil, photographer: Øyvind Hagen

Cold venting and fugitive emissions from Norwegian offshore petroleum activities
1
Summary
Offshore oil and gas production on the Norwegian continental shelf (NCS) leads to direct emissions of methane and non-methane volatile organic compounds (NMVOC). Emissions consist partly of fugitive emissions and gas leaks and partly of operational emissions (cold venting). The current methodology for quantifying these emissions has been in use for some 20 years, and its accuracy and ability to cover all emission sources is questionable. The Norwegian Environment Agency (NEA) therefore engaged Add Novatech AS to conduct a study assessing emission status. The assignment had the following objectives.
1. Survey offshore installations and identify sources of direct methane and NMVOC emissions 2. Suggest new methods for quantifying emissions 3. Prepare new and better emission estimates 4. Assess best available techniques (BAT) 5. Assess methods and techniques for emission reduction
The study was carried out in several phases (modules) and separate sub-reports were prepared for each phase. The study was conducted in close collaboration with the industry and government agencies (the NEA, the Norwegian Petroleum Directorate and the Petroleum Safety Authority Norway).
All permanent offshore oil and gas facilities on the NCS were surveyed to identify potential emission sources. Fifteen of these were chosen for a thorough review, conducted as full-day meetings for each facility together with relevant specialists from the operator (primary survey). The remaining 53 facilities responded to a questionnaire (secondary survey) developed on the basis of results from the primary set. These surveys demonstrated that the current (old) emission quantification methodology was incomplete where emission sources are concerned and also resulted in inaccurate calculation of emission inventories from some of the sources. The study identified a total of 48 potential sources of cold venting and fugitive emissions – ie, far more than the 13 which operators have previously reported from. This is partly because the former emission sources have been broken down into sub-sources and partly because new sources have been identified. The contribution from several of the "new" potential emission sources was found to be insignificant. A new inventory estimate of annual emissions for 2014 was compiled. This was established partly by using the new quantification methodology proposed as part of this study and partly by using other available methods. The operators contributed actively to this work.
Table 1 Estimated emission inventories of methane and NMVOC for 2014 by main source [tonnes].
Main source: Methane NMVOC VOC % of total
Dry compressor seals 2 500 1 100 3 600 19%
Vent header (measured values) 1 950 1 350 3 300 17%
Produced water treatment 2 300 600 2 900 15%
HC purge and blanket gas 1 100 1 300 2 400 12%
Gas leaks/fugitives 1 250 950 2 200 11%
Flare gas not burnt 1 500 600 2 100 11%
Glycol regeneration 550 1 000 1 550 8%
Compressor wet seals 900 300 1 200 6%
Other sources 300 250 550 3%
Total 12 350 7 450 19 800 100%
The new estimates indicate that total emission inventories are significantly lower than those reported using the "old" quantification methodology. Reported emissions for 2014 were 24 922 tonnes of methane and 13 553 tonnes of NMVOC. However, significant uncertainties are also associated with

Cold venting and fugitive emissions from Norwegian offshore petroleum activities
2
the new estimates in Table 1 above. The uncertainty is particularly high for gas leaks/fugitives. This reflects the huge inherent uncertainties in any methodology available for estimating emissions from these sources. Despite the uncertainties, the emission inventory presented in Table 1 is more accurate and far more consistent – and thereby better – than those calculated using the "old" methodology. The sources included under "Other sources" in Table 1 contribute very low emissions. The contribution from some of them is far below 0.1 per cent of the total. No emissions were found for a few of the identified potential emission sources. Based on the outcome of the survey, a new methodology for quantifying emissions has been proposed. Dedicated methods are recommended for the individual emission sources and sub-sources. Generic methods are recommended for the dominant proportion of the emission sources. These methods reflect the parameters which control the emissions. The use of generic methods will ensure consistency in the calculations over time and across facilities. Installation-specific emission quantification methods are recommended for a few of the emission sources. These exist on only one or a few installations, and are so complex that a generic quantification method would not be adequate. Where nine of the identified sources are concerned, the estimated emission inventories are very small (about 0.1 per cent in all of total direct methane and NMVOC emissions). The proposal is that operators do not need to quantify and report emissions from these sources individually, but instead cover all nine with a single percentage mark-up based on the sum of all other direct emissions from the facility – one per cent of the total, for example. Many of the predominant emission sources produce waste hydrocarbon (HC) gases which can theoretically be recycled. The study has shown that recovery of such waste gases is a well-proven technique. The survey also found that the choice has been made on almost all installations on the NCS to emit methane and NMVOC from one or more of these sources, even though recovery could be an option. On the other hand, recovery is the chosen disposal solution for many of these emission sources on some installations. Technical or cost-related restrictions on the facilities without recovery may have made such action unfavourable. Where some of these facilities are concerned, direct methane emissions were not considered a climate challenge when the emission solution was chosen. Where new installations are concerned, the recommendation is that waste gas recovery should be established as the BAT for emission sources/processes where recovery is feasible. Excluding small gas leaks and fugitive emissions, waste gas recovery could limit the direct release of methane and NMVOC from most of the new facilities to well below 10 tonnes per year per installation. In the case of existing installations, recycling waste gas currently being emitted to the air will require technical modifications to processing plants. The associated costs may vary considerably from facility to facility. If the volumes of natural gas which can be recycled are small, the resulting income will be small and the abatement cost high. The recommendation is therefore that the industry applies a fictitious emission price in abatement cost calculations, based on the GWP100 (global warming potential) of methane and NMVOC measured in CO2 equivalents, combined with a CO2 price consisting of CO2 tax and the CO2 emission allowance price. It is recommended that abatement cost calculations or assessments be done by the individual operators. Both abatement cost and an abatement assessment are included in requirements put by the NEA to the operators, with a deadline for response by 1 July 2016. The emission reduction potential of existing facilities is regarded as limited, but an overall target of a 10 per cent reduction in direct methane and NMVOC emissions within a few years is assumed to be realistic. Reaching this target may be easier for some installations than for others.

Cold venting and fugitive emissions from Norwegian offshore petroleum activities
3
Contents
Summary…………………………………………………………………………………………………………………………………………………..…. Error! Bookmark not defined.
Abbreviations ................................................................................................................................................... 4
1 Introduction ............................................................................................................................................. 5
1.1 Background ............................................................................................................................................. 5
1.2 Objectives ................................................................................................................................................ 6
1.3 Study organisation .................................................................................................................................. 6
1.4 Reports .................................................................................................................................................... 6
2 Method and study execution .................................................................................................................... 7
3 Direct HC gas emission sources ................................................................................................................. 8
3.1 Current methodology for quantifying the emissions ............................................................................... 8
3.2 Updated sources for direct emission of methane and NMVOC ............................................................... 8
4 Emission inventory estimates ................................................................................................................. 11
4.1 Emission of methane and NMVOC by main source ............................................................................... 11
4.2 Emissions from other sources ................................................................................................................ 12
4.3 Impact of emissions on the climate ....................................................................................................... 13
4.4 Uncertainty in the estimates ................................................................................................................. 13
4.5 Comparison with previously reported emission data ............................................................................ 15
5 Proposed principles for a new emission quantification methodology ..................................................... 16
5.1 Main quantification principles............................................................................................................... 16
5.2 Emission sources with minor contribution ............................................................................................ 18
5.3 Contribution from international work ................................................................................................... 18
5.4 Quantification of emissions from small leakages / fugitive emissions .................................................. 18
5.5 Flow rate metering ................................................................................................................................ 19
5.6 Split between methane end NMVOC ..................................................................................................... 19
6 Emissions abatement opportunities ....................................................................................................... 20
6.1 Emission sources which can theoretically be eliminated by gas recovery ............................................. 20
6.2 Use of nitrogen (N2) instead of HC gas .................................................................................................. 20
6.3 New technology ..................................................................................................................................... 21
6.4 Emission sources which are difficult to eliminate .................................................................................. 21
6.5 Best available techniques (BAT) ............................................................................................................ 22
6.6 New versus existing facilities ................................................................................................................. 24
7 References .............................................................................................................................................. 25
Appendix 1 The study work group .................................................................................................................. 26

Cold venting and fugitive emissions from Norwegian offshore petroleum activities
4
Abbreviations
BAT Best available techniques BREF Best available techniques reference document CAPP Canadian Association of Petroleum Producers CH4 Methane CFU Compact flotation unit CO2 Carbon dioxide CONCAWE Association of oil companies which aims in part to improve understanding of
the health and environmental aspects of refinery operations DBB Double block and bleed DIAL Differential absorption lidar EEMS Environmental and emissions monitoring system FPSO Floating production, storage and offloading Fugitives Or fugitive emissions: minor gas leaks through gaskets, stuffing boxes, etc GM Generic methodology GRI Gas Research Institute (the company which developed GRI_GLYCalc) GWP Global warming potential HC Hydrocarbon IR Infrared FSM Facility specific methodology LDAR Leak detection and repair MEG Monoethylene glycol NMVOC Non-methane volatile organic compounds NCS Norwegian continental shelf NEA Norwegian Environment Agency NOx Nitrogen oxides NS-EN 15446 Norwegian standard for fugitive emission calculations N2 Nitrogen OGI Optical gas imaging O2 Oxygen P&ID Piping and instrumentation diagram Survey Thorough assessment of offshore facilities performed as a part of the study TEG Triethylene glycol US EPA United States Environmental Protection Agency VOC Volatile organic compounds (methane + NMVOC) IPCC UN Intergovernmental Panel on Climate Change
Cold venting and fugitive emissions from Norwegian offshore petroleum activities
5
1 Introduction
1.1 Background
Methane (CH4) is a powerful greenhouse gas. It has a greenhouse effect (GWP) of 25 times the CO2 equivalent in a 100-year perspective. Combined with relatively large emissions, this makes methane the dominant greenhouse gas after CO2, both globally and in Norway. Norwegian methane emissions came to
217 000 tonnes in 2013 (Ref: 15), corresponding to 5.4 million tonnes of CO2 equivalents, which was about
10 per cent of the country’s greenhouse gas emissions in that year. NMVOC are volatile organic compounds other than methane, which have regional environmental impacts through the formation of ground-level ozone from their interaction with nitrogen oxide (NOX) emissions. It also has an indirect greenhouse effect through conversion to CO2 in the atmosphere. Petroleum activities on the NCS lead to greenhouse gas emissions. These are split for reporting purposes into methane and NMVOC. They derive from three main groups of sources/processes:
a. unburnt natural gas from gas turbines, gas engines, boilers and gas flares b. vapour emitted from shuttle tankers when loading oil from offshore installations c. direct emissions, which comprise operational emissions (also called cold venting) and fugitive emissions and
natural gas leaks.
Direct emissions of HC gases (item c above) contributed 80 per cent of methane and 26 per cent of NMVOC emitted by the Norwegian offshore oil and gas industry in 2013. Operational emissions are waste gases containing HC which are purposely routed to the atmosphere from processes and sub-processes on the facility. Emissions usually take place through dedicated piping systems (cold vents) from where the gas is released to the atmosphere at a safe location. Motives for releasing these gases as emissions to the atmosphere include:
safety
high content of inert gases, making it difficult to recover and flare the waste gas
pressure conditions, requiring added compression for recovery/flaring
unacceptably high cost of implementing waste gas recycling or flaring
a combination of these reasons.
Fugitive emissions are small gas leaks through valve seals, flanges, flexible hoses and so forth. They can and do occur everywhere in processing facilities where gas is handled under pressure. Such emissions are difficult to localise, quantify and mitigate. Annual inventories of direct methane and NMVOC emissions are reported by the operating oil companies to the Norwegian Environment Agency (NEA) in their annual emission and discharge reports. Emission inventories are established using a generic methodology which has been in place since the mid-1990s. Based on a set of predefined emission sources and simple emission factors, the methodology is described in the emission reporting guidelines published by the Norwegian Oil and Gas Association (Ref: 16). Questions have been raised over several years about the relevance and accuracy of this methodology, whether all relevant sources are covered, whether the results are acceptable and whether the reported emission inventories can be trusted. Based on the above, the NEA engaged Add Novatech AS to improve understanding of direct methane and NMVOC emissions from oil and gas facilities on the NCS and to provide background information on this subject.

Cold venting and fugitive emissions from Norwegian offshore petroleum activities
6
1.2 Objectives
The objectives of the study were as follows.
1. To conduct a thorough survey in order to identify all sources of direct methane and NMVOC emissions from oil and gas production facilities on the NCS.
2. To investigate and evaluate how these emissions can best be quantified and to suggest a quantification
methodology which can be used by the industry as a basis for future reporting. 3. To prepare a new and better emission inventory estimate. 4. To evaluate methods and techniques for emission mitigation, what can be regarded as BAT, and the potential
for reducing emissions.
1.3 Study organisation
The study originally consisted of three modules.
Module 1 mapped sources of direct methane and NMVOC emissions.
Module 2 covered a review and revision of the quantification methodology and emission factors for future reporting, and aimed to establish a better emission inventory estimate.
Module 3 highlighted emission abatement opportunities, including an assessment of what can be regarded as BAT for reducing direct methane and NMVOC emissions from offshore petroleum activities.
A fourth module was added at a late stage in the study. This sought to check and verify (if possible) some available emission factors for quantifying fugitive emissions by using measured emission data from land-based oil and gas processing facilities. The study started in October 2014 and was completed in March 2016. A work group (study reference group) was established for this study with participants from the NEA, Norwegian Oil and Gas, the Norwegian Petroleum Directorate, the Petroleum Safety Authority Norway and operating oil companies in Norway. The members of the work group are presented in Appendix 1. This group held six meetings during the course of the study.
1.4 Reports
In addition to this summary report, which is available in both Norwegian and English, a total of five sub-reports have been produced which are available in Norwegian only:
Module 1 – Surveying installations to identify potential emission sources
Module 2 – Emission estimates and quantification methods
Module 3 – Best Available Technique (BAT) assessments
Module 3B – Potential for emission abatement and reduction
Module 4 – Verification of emission quantification methods for fugitive emissions and small gas leaks

Cold venting and fugitive emissions from Norwegian offshore petroleum activities
7
2 Method and study execution
The study started with a thorough survey of all Norwegian offshore facilities handling oil and gas. The purpose of the survey was as follows.
To identify "all"1 sources of direct methane and NMVOC emissions. “Sources” in this context mean those which generate waste gas containing methane and NMVOC.
To establish a background for and understanding of why and how the emission sources arise.
To establish an understanding of how emissions from individual sources can be quantified. This can involve measurement, direct or indirect calculation, or other quantification methods.
To establish an overview of how waste gases from emission sources are disposed of on offshore oil and gas facilities, and of the disposal options which may be available on these. “Disposal” in this context means emitting the waste gas directly to the atmosphere, flaring it – thereby releasing it to the atmosphere as combustion gases (mainly CO2) – or recycling it back to the process for recovery.
To establish an overview of what the industry has done and could do to reduce direct methane and NMVOC emissions at the individual facilities and to set a more general industry objective for the future.
Work was conducted in two phases. Phase 1 involved comprehensive reviews of 15 offshore facilities. These were conducted as full-day meetings attended by the operator's environmental coordinators and their process and facility engineers with in-depth knowledge of the process plants concerned. Specialists in certain areas were called on as required. Hydrocarbon systems were thoroughly analysed using flowcharts and P&IDs in order to identify potential emission sources. Waste gas disposal solutions were evaluated and potential emission quantification methods discussed, including future methods as well as ad hoc solutions which could be used in this study to establish better emission estimates. An action list was prepared, including work to be followed up by the operators after the meetings. Based on the findings of phase 1, a questionnaire was prepared for phase 2 and sent to the operators of the remaining 53 offshore oil and gas facilities on the NCS. In addition to installations in operation, facilities being developed were also included. All operators responded. Inaccuracies in the responses were followed up and clarified via phone and e-mail. The information obtained through these surveys provided the background for the emission source overview, the proposed new emission quantification methodology and the evaluation of emission reduction potentials presented in this report. That base was drawn on to develop a new emission quantification methodology for most of the emission sources, and a new emission inventory estimate was prepared. The emission inventory should be regarded as temporary, since it will be replaced by new data once the new emission quantification methodology has been adopted by the industry. Where a few of the emission sources were concerned, information from the surveys was insufficient to develop new quantification methods and to prepare emission estimates. In these cases, the operators were requested to provide supplementary data. Taken together, this information has helped to establish better and more complete emission estimates, and provides the basis for developing a better emission quantification methodology for future reporting. Only indirect and rather uncertain emission quantification methods were found to be available for small gas leaks. To verify these methods, an additional study was initiated. Four land-based petroleum processing plants in Norway were surveyed. Total methane and NMVOC emissions in dedicated areas at these plants were measured using the differential adsorption lidar (DIAL) method. Dedicated point sources (vents), combustion gases and fugitive emissions/small gas leaks were included. This supplementary work provided only limited constructive feedback to the study, owing to the short time available for the operators to establish emission estimates for the point sources (cold vents).
1 "all" means sources which can yield significant emissions.

Cold venting and fugitive emissions from Norwegian offshore petroleum activities
8
3 Direct HC gas emission sources
3.1 Current methodology for quantifying the emissions
A methodology for quantifying direct methane and NMVOC emissions was established in the mid-1990s by Aker Engineering (Ref: 6). This was based on 13 predefined potential emission sources. Several of these sources do not exist on most of the facilities. The methodology applies generic emission factors for methane and NMVOC emitted from each source. Emissions are calculated for each source using a source emission factor and an activity factor which, in the majority of cases, is the amount of gas processed in the facility. The following predefined sources were included
glycol regeneration
waste gas from the produced water system
gas dissolved in liquid from the scrubber
wet seal oil for compressors
leakage through dry compressor seals
equipment depressurisation
purge and blanket gas
flushing of instrument bridles
extinguished flares
small leakages
annulus bleed from production strings
drilling
start gas for turbines. The calculation methodology forms part of the emission reporting guidelines established by Norwegian Oil and Gas (Ref: 16). As described in Section 1.1, this methodology is not very precise and directly inaccurate for some emission sources. That has also been documented in a report prepared by Add Novatech for Norwegian Oil and Gas in 2014 (Ref: 17). Apart from the inadequacy of the quantification methodology, the list of predefined sources is incomplete and to some extent imprecise. The need for a better quantification methodology has therefore been acknowledged, which will provide a more complete list of potential emission sources, more accurate quantification methods, and an overview of how direct methane and NMVOC emissions can be mitigated and reduced.
3.2 Updated sources for direct emission of methane and NMVOC
"All" potential sources were registered during the survey, regardless of the magnitude of their emissions, because it is as important to document that a source is small (or negligible) as it is to document that it is large. As a result, several "new" emission sources not covered in the current reporting regime were identified. Of equal importance was the discovery that many of the "old" sources consist in reality of several partly or fully independent sub-sources. The survey identified the importance of splitting some sources into such sub-sources – partly because the waste gas they emit was handled differently and partly because some of the sub-sources account for significant emission quantities. The survey also established that some of the "new" sources/processes have historically been under the operator’s radar. This may explain why information available from the operator for evaluating emissions from these sources was less relevant than for sources which had previously been in focus. A total of 48 processes/sub-processes producing HC waste gases which could potentially be emitted to the atmosphere were identified during the survey.

Cold venting and fugitive emissions from Norwegian offshore petroleum activities
9
Table 2 Identified potential emission sources.
Main emission source/process Sub-source/sub-processes
Triethylene glycol (TEG) regeneration
TEG degassing tank
TEG regenerator
Stripping gas for TEG regeneration
Produced water treatment
Produced water degassing tank
Produced water flotation unit (off-gas from water) t) Flotation gas (where HC gas is used)
Discharge caisson
Low pressure scrubbers
Compressor seal oil (wet seals)
Degassing pots
Seal oil holding tanks
Seal oil storage tanks
Dry compressor seals
Primary seal gas (primary vent)
Secondary seal gas (secondary vent)
Leakage of primary seal gas to secondary seal vent
Gas freeing of process systems
Purge and blanket gas
Depressurisation/gas freeing of instruments/instrument bridles
Flare gas not burnt
Extinguished flare
Delayed flare ignition
Non-combustible flare gas
Open cold flare purged with N2
Gas leaks in the process Large gas leaks (requiring investigation)
Small gas leaks/fugitives
Production riser annulus bleed
Drilling Shale shaker
Mud separator
Direct emissions from gas turbines
Start gas for gas turbines
Purging turbine at startup
Depressurising turbines at shutdown
Monoethylene glycol (MEG) regeneration
MEG degassing tank
MEG regenerator
Stripping gas for MEG regeneration
Amin regeneration Amin degassing tank
Amin regenerator
Reciprocating compressors Separator chamber
Crankshaft housing
Screw compressors
Liquid ring compressors
Stripping gas for injection water
Gas analysers and test/sample stations
Pig launchers and receivers
Corrosion coupons
Flexible riser annulus bleed
Gas freeing from oil storage tanks on FPSOs Inspection of storage tanks
Abnormal operating conditions
Consumption oil tanks (diesel, lubricating oil, etc)
Double block and bleed (DBB) valves

Cold venting and fugitive emissions from Norwegian offshore petroleum activities
10
The sources shown in Table 2 represent an attempt at standardisation. Some of the processes generating HC waste gases may have facility-specific solutions which could differ from the distribution shown in the table. As mentioned in Chapter 1.1, direct methane and NMVOC emissions may occur either as fugitive emissions/gas leaks or as operational emissions (cold venting). Fugitive emissions/gas leaks of methane and NMVOC occur on all facilities handling HC in gaseous form and can happen anywhere in the processing plants. Operational emissions of methane and NMVOC from the individual potential sources which have been identified occur from dedicated emission points (cold vents). None of the facilities on the NCS emit from all the sources listed in Table 2. This is because many facilities, for various reasons, do not possess the processes or sub-processes which generate waste gas containing methane and NMVOC. Furthermore, certain facilities with emission sources send the waste gas to recovery or flaring. Some registered sources are present on only a few facilities. Potential amounts of waste gas from the individual processes vary enormously. While dominant emission sources may have the potential to produce waste gas quantities in excess of 100 tonnes per annum, some processes on the same facility generate no more than a few kilograms. This illustrates the importance of concentrating attention on the processes and sources which dominate the emissions.

Cold venting and fugitive emissions from Norwegian offshore petroleum activities
11
4 Emission inventory estimates
4.1 Emission of methane and NMVOC by main source
The inventory of direct methane and NMVOC emission was recalculated/re-estimated. This was done partly using the emission quantification methodology recommended in this report (Chapter 5), and partly by Add Novatech and the industry jointly using the best available methodology for the relevant conditions. These have included supplier data, process simulations and measurements. Emissions were calculated for all installations handling HC gas and for all relevant sources. Where sources potentially producing very small emissions are concerned, calculations were carried out for a few installations or as examples to demonstrate that emissions will be small. These emissions were then scaled up to become representative for all facilities on the NCS. Emission estimates by main source are shown in Table 3 (2014).
Table 3 Emissions of methane and NMVOC for 2014 by main source [tonnes].
Main source: Methane NMVOC VOC % of total
Dry compressor seals 2 500 1 100 3 600 19%
Vent header (measured values) 1 950 1 350 3 300 17%
Produced water treatment 2 300 600 2 900 15%
HC purge and blanket gas 1 100 1 300 2 400 12%
Gas leaks/fugitives 1 250 950 2 200 11%
Flare gas not burnt 1 500 600 2 100 11%
Glycol regeneration 550 1 000 1 550 8%
Compressor wet seals 900 300 1 200 6%
Other sources 300 250 550 3%
Total 12 350 7 450 19 800 100%
Table 3 shows that the eight main sources contribute 97 per cent of total direct methane and NMVOC emissions. This indicates which sources should be given attention. To obtain a full understanding of the table, the following comments on the individual main sources should be noted.
1. Dry compressor seals
Used HC seal gas is emitted to the air from some facilities, resulting in high emissions. Most installations utilising HC seal gas send it to recovery or flaring after use.
2. Vent header (measured flow rate)
Waste gas from many of the direct emission sources are collected in a vent header, routing the waste gas to the atmosphere at a emission point in a safe location (also called the “common vent”) on the majority of the facilities The gas flow through the common vent is metered on some installations. In such circumstances, the metered gas volume is used to express the amounts of methane and NMVOC emitted rather than calculating this from the individual contributors (sources). Real emissions from some sources are therefore higher than the table indicates. Two installations in particular contribute to the high emission estimate for the vent header.
3. Produced water treatment
The discharge caisson (discharge pipe to the sea) is the principal source for methane and NMVOC emissions from the produced water handling system. These emissions derive from depressurisation of the produced water discharged.
4. Hydrocarbon purge and blanket gas
Fuel gas is used as purge and blanket gas on some facilities. The rather high level of emissions is attributable to a small number of installations.

Cold venting and fugitive emissions from Norwegian offshore petroleum activities
12
5. Gas leaks/fugitives
The uncertainty in emission estimates from small gas leaks and fugitives is very great, depending on the calculation method and emission factors used. See Section 4.4.
6. Flare gas not burnt
Some flares operate partly or wholly as cold. The principal contributor to unburnt flare gas is cold flares purged with inert gas. Delayed flare ignition represents another emission sub-source. No data are currently available, making it impossible to estimate emissions from this sub-source.
7. Glycol regeneration
This includes both TEG and MEG regeneration.
8. Compressor wet seals
Compressor seal oil is an emission source because of the solubility of methane and NMVOC in the oil. Wet compressor seals were a common technology in compressors installed before 1995. Establishing good quantification methods for these emissions has been very difficult, and the operators are still working on this problem. The emission data in the table should therefore be regarded as preliminary.
9. Other sources
These comprise emissions from all other identified sources (see Section 4.2). As shown in Table 3, total direct methane and NMVOC emissions represented a loss of 0.018 per cent from total Norwegian gas production in 2014.
4.2 Emissions from other sources
"Other sources" in Table 3 cover several minor sources, as presented in Table 4.
Table 4 Emissions of methane and NMVOC from other sources [tonnes].
Emission source Methane NMVOC VOC % of total
Amine regeneration 95 40 135 0.68%
Gas analysers and test/sample stations 71 54 125 0.63%
Drilling 57 57 114 0.57%
Gas freeing from oil storage tanks on FPSOs 71 55 126 0.64%
Gas freeing from process plants 18 16 33 0.17%
Double block and bleed (DBB) valves 1.2 1.1 2.3 0.01%
Low-pressure scrubbers 2.6 1.8 4.4 0.02%
Flexible risers 2.3 1.8 4.0 0.02%
Oil tanks (diesel, lubricating oil, etc) - 3.5 3.5 0.02%
Pig launchers and receivers 3.6 2.3 6.0 0.03%
Direct emissions from gas turbines 0.5 0.5 1.1 0.01% Depressurisation/gas freeing from instruments/instrument manifolds 0.05 0.04 0.09 < 0.01%
Corrosion coupons 0.01 0.00 0.02 < 0.01%
Annulus bleed in production riser 0.00 0.00 0.01 < 0.01%
Total 322 232 554 2.8%
Only one facility has emissions from amine regeneration. Each of the nine emission sources marked in orange contribute well under 0.1 per cent of total emissions.

Cold venting and fugitive emissions from Norwegian offshore petroleum activities
13
Emissions from gas analysers and test/sample stations come from a few facilities taking gas samples for analysis from a slipstream bleeding off to the atmosphere on a continuous basis. Emissions from analysers and from samples sent to land are insignificant. Emissions from drilling are calculated on the basis of 227 exploration and production wells completed in 2014 and the recommended emission factors provided in the Module 2 report (Ref: 2). Calculations can be somewhat conservative, since the emission factors assume that the wells penetrate HC-bearing formations, which is not the case for most exploration wells.
4.3 Impact of emissions on the climate
Methane is a powerful greenhouse gas with a GWP (global warming potential) of 25 times the CO2
equivalent2. This means the greenhouse contribution made by direct methane emissions from offshore installations amounts to some 300 000 tonnes of CO2 equivalents, corresponding to 2.5 per cent of total greenhouse gas emissions from Norway’s offshore oil and gas facilities. Similarly, NMVOC emissions contribute indirectly to the greenhouse effect since these gases are oxidised to CO2 in the atmosphere. NMVOC has a GWP of 4.5 times the CO2 equivalent.
4.4 Uncertainty in the estimates
By their nature, direct methane and NMVOC emissions are difficult to quantify. Extensive use must be made of indirect quantification methods. This can be done by utilising emission factors combined with a specified activity factor or with other methods. Typical examples of using emission factors include:
methane emissions from drilling can be calculated with a fixed emission factor per wellbore drilled:
methane emission (tonnes) = number of wellbores x emission factor for methane (tonnes/wellbore)
emission of NMVOC from the produced water discharge caisson can be calculated using an emission factor, the produced water discharge volume and pressure loss from the upstream degassing tank:
NMVOC emission (tonnes) =
produced water discharge volume (m3) x pressure loss (bar) x emission factor for NMVOC (tonnes/bar/m3)
An example of emissions calculated using other methods might be:
emissions from glycol regeneration can be estimated by using the GRI_GLYCalc emission calculation programme.
Accurate quantification methods are difficult to find for some sources. This indicates that uncertainties in the emission inventory can be large and difficult to quantify. Among the larger emission sources, uncertainty is assumed to be greatest for small gas leaks/fugitive emissions. Fugitive emissions are gas leaks through flanges, valves and so forth which are (generally) smaller than 0.1 kg per second and not considered to constitute a safety threat at the facility. Fugitive emissions are often so small that they cannot be detected using stationary gas detectors or portable detectors during regular inspection of processing plants. Such emissions are very difficult to quantify, but a few methods do exist. One is "bagging", where the component is isolated in a plastic bag and emissions (if present) are measured over time. Another method is soap spraying and counting gas bubbles. This method is somewhat more uncertain. Were these methods alone to be applied for all components with leakage potential on a facility, the work and cost involved would exceed the level which is feasible in practical and economic terms.
2 100-year perspective

Cold venting and fugitive emissions from Norwegian offshore petroleum activities
14
The Dial method, involving remote measurement of methane and NMVOC concentrations, is used at land-based gas plants but cannot be applied on offshore facilities. Quantification methods using a gas sniffer in combination with statistics are recommended in a protocol from the US Environmental Protection Agency (EPA) (Ref: 9). This covers all types of industrial plants with a potential to produce fugitive HC gas emissions. The protocol forms the basis for much of the subsequent efforts to establish practical methods for quantifying fugitive emissions and small gas leaks. This includes work done by the Canadian Association of Petroleum Producers (CAPP) for 120 upstream land-based oil and gas installation in the provinces of Alberta and British Columbia. These facilities contain more than 270 000 valves, flanges and other components which are potential gas leak sources. Canada implements a standardised programme for inspection, identification and repair of leakage points (also called LDAR). This largely corresponds with the programme used on Norwegian offshore facilities. The CAPP has developed average emission factors per component type through surveys of the 120 facilities. These average factors, combined with an estimated number of components per component type for all Norwegian offshore installations, are used as the basis for estimating emission inventories from small gas leaks as presented in Table 3. The number of components was extrapolated from 11 Norwegian offshore installations which conducted component counts. The protocol from the US EPA forms the basis of a European standard for quantifying gas leaks and fugitive emissions, which has also been adopted as a Norwegian standard (NS-EN 15446: 2008). According to this standard, all components which could leak HC gases must be sniffed but with "default" factors for use with inaccessible components. As a check, small gas leaks from Norwegian offshore facilities were also calculated using these default factors, as presented in Table 5.
Table 5 Methane and NMVOC emissions in 2014 by main source, with small gas leaks calculated on the basis of Norwegian standard NS-EN 15446 [tonnes].
Main source: Methane NMVOC VOC % of total
Dry compressor seals 2 500 1 100 3 600 12%
Vent header (measured values) 1 950 1 350 3 300 11%
Produced water treatment 2 300 600 2 900 10%
HC purge and blanket gas 1 100 1 300 2 400 8%
Gas leaks/fugitives 7 100 5 400 12 500 41%
Flare gas not burnt 1 500 600 2 100 7%
Glycol regeneration 550 1 000 1 550 5%
Compressor wet seals 900 300 1 200 4%
Other sources 300 250 550 2%
Total 18 200 11 900 30 100 100%
Table 5 shows that calculations using the default factors in the NS-EN 15446 yield emissions from small gas leaks which are almost six times higher than when calculated with the CAPP’s average factors. One reason may be that the default factors in the Norwegian standard are deliberately conservative, since they are only to be used for components which are inaccessible for sniffing. A review of four land-based petroleum installations (Kollsnes, Kårstø, Nyhamna and Melkøya) were also analysed. One objective was to compare the results of emission measurements using the Dial method, where emissions are calculated using component counts from these facilities together with the emission factors in the CAPP report and the Norwegian standard. To achieve this, emissions from all point sources (operational emissions) had to be established and then deducted from total measured emissions to find the contribution from small gas leaks/fugitives. Owing to the short time available, a complete overview of operational emissions (vents) could not be achieved. Despite these problems, it became clear that gas leak emissions measured with Dial at the land-based plants were significantly higher than those calculated using emission factors from both the CAPP report and the Norwegian standard for the same plants. The deviations were up to several hundred per cent.

Cold venting and fugitive emissions from Norwegian offshore petroleum activities
15
Statoil has provided supplementary information to this study by making available the results of gas leak measurements on the two Draupner installations (Ref: 14). These measurements were made by scanning all valves and flanges with an infrared (IR) camera (the OGI method) to identify leaks. All those detected were then measured with soapy water and bubble count using a standardised method. This yielded emission results which were a 10th or less of the emission results obtained using the factor methods from the CAPP report and the Norwegian standard. The comparisons above indicate that quantifying small gas leaks and fugitive emissions is associated with very considerable uncertainties. Simple factor-based methods will therefore fail to provide reliable emission inventory estimates for small gas leaks. This is taken into account in the recommended new emission quantification methodology (see Chapter 5). This indicates that uncertainty in total emissions is linked largely to fugitive emissions and small gas leaks. The overall uncertainty of the total emissions shown in Table 3 is qualitatively estimated to be in the order of tens of percentage points. Unlike the previously reported emission inventories, however, the emission inventory estimates given in the table are established by using more consistent methods and should therefore provide more accurate results.
4.5 Comparison with previously reported emission data
Figure 1 shows the development of direct methane and NMVOC emissions reported in the annual emission reports to the NEA using the old calculation methodology (see Chapter 3.1).
Figure 1 Reported methane and NMVOC emissions from 1997 to 2014. Table 6 compares total direct emissions of methane and NMVOC inventories reported for 2014 with new emission estimates, where small gas leaks are calculated using average factors from NS-EN 15446 and the CAPP report respectively.
Table 6 Emissions in 2014. Reported emission inventories compared to new estimates.
Calculation method Methane [tonnes] NMVOC [tonnes]
Reported emissions (old method) 24 922 13 553
New estimate (NS-EN 15446) 16 700 10 800
New estimate (CAPP) 10 850 6 350
The table indicates that emissions were overestimated using the old quantification methods. However, it should also be borne in mind that the uncertainty of new estimates for small gas leaks is very high.

Cold venting and fugitive emissions from Norwegian offshore petroleum activities
16
5 Proposed principles for a new emission quantification methodology
5.1 Main quantification principles
The survey demonstrated that using processed gas volumes as an activity factor (the approach taken by the current methodology) is inadequate for most emissions sources/processes. Emissions are controlled by other conditions and parameters, making the real emission inventories from some of the sources substantially different from those previously reported. On the basis of the survey results and the potential emission-generating processes and sub-processes (emission sources) identified in Module 1 of this study, new principles for a future emission quantification methodology were developed and proposed. None of the facilities which handle oil and gas have emissions from all of the identified sources, but all facilities have emissions from some of them. The proposed emission quantification methodology will therefore apply only to those installations which possess the relevant potential emission source and, in addition, route the waste gas from that source to the atmosphere. Generic quantification methods are proposed for the majority of the emission sources. These are regarded as favourable because they ensure consistency between different operators, and make it possible to obtain consistent data trends year by year. Moreover, generic methods simplify the emission inventory calculation work for the operators. However, facility-specific quantification methods are recommended for some processes. That applies particularly to emission sources with such great variations and complexity that generic methods might easily yield inaccurate results, and to those found only on one or a few facilities. Facility-specific quantification methods should be established by the relevant operating oil company. It is recommended that the operator should demonstrate the accuracy/adequacy of the proposed method. Using generic quantification methods where available is recommended. Should an operator prefer to apply a facility-specific method because it would give a better and more accurate emission inventory, however, this should be accepted providing documentation substantiating the proposal is provided. New, not yet identified emission sources may be anticipated on future installations. In such cases, the recommendation is that the relevant operator establishes new facility-specific emission quantification methods for the source(s) in question. For some processes/sub-processes, a combination of emission factors and activity factors is recommended. The activity factor which control emissions could, for example, be produced water volume and the number of wellbores. Otherwise, the methods may vary widely:
measurement/sampling
process simulations / use of special computer programmes
utilising available registered measurement data
logging of incidents (for batch emissions)
supplier data.
Two alternative generic methods are proposed for some of the sub-processes. This is because one of the methods requires the use of specific commercial software. Table 7 presents an overview of the recommended categories of quantification methods for the various sources. In the method category column, GM stands for generic method and FSM for facility-specific method.

Cold venting and fugitive emissions from Norwegian offshore petroleum activities
17
Table 7 Overview of proposed emission quantification methods by potential emission source.
Main source Sub-source Method category
General definition
Triethylene glycol (TEG) regeneration
TEG degassing tank FSM Dedicated computer programme (GRI-GLYCalc, for example)
TEG regenerator GM Analysis of TEG solution, alternatively the GRI-GLYCalc software
Stripping gas GM Stripping gas flow rate
Produced water treatment
Produced water degassing tank
GM Based on the pressure reduction and produced water volume
Flotation tank / CFU GM Based on upstream pressure and produced water volume
Flotation gas GM Hydrocarbon flotation gas flowrate
Discharge caisson GM Based on the upstream pressure and produced water discharge volume
Compressor seal oil (wet seals)
Degassing pots FSM Established by each operator
Seal oil holding tank FSM Established by each operator
Seal oil storage tank FSM Established by each operator
Reciprocating compressors Separator chamber FSM Simulations, vendor data, etc
Crank house FSM Simulations, vendor data, etc
Dry compressor seals
Primary seal gas GM Seal gas metering/supplier data
Secondary seal gas GM Seal gas metering/supplier data
Leakage of primary sealing gas to secondary vent
GM Seal gas metering/supplier data
Flare gas not burnt
Extinguished flare and delayed flare ignition
GM Logging of time with unignited flaring/flare gas metering
Non-combustible flare gas FSM Established by each operator
Open cold flare purged with inert gas
GM Flare gas metering
Leakages in the process
Large gas leaks GM Emission rate, duration, volume (current practice)
Small gas leaks/fugitive emissions
GM OGI "leak/no leak" method
Cold vent GM Waste gas metering/determining flow rate
Purge and blanket gas GM Purge/blanket gas metering/flow rate determination
Monoethylene glycol (MEG) regeneration
MEG degassing tank GM Recognised computer programmes (GRI-GLYCalc, MultiPro Scale, etc)
MEG regenerator GM Recognised computer programmes (GRI-GLYCalc, MultiPro Scale, etc)
Stripping gas GM Stripping gas flow rate
Amine regeneration Amine degassing tank FSM Established by each operator
Amine regenerator FSM Established by each operator
Gas analysers and test/sample stations GM Slipstream flowrate
Drilling GM Emission factor per completed wellbore
Gas freeing of FPSO oil storage tanks GM Storage tank volume
Gas freeing of process plants GM Volume of process plant
The proposed new methodology would ensure that future emission inventory reports are more consistent and correct than the estimates provided in Chapter 4 of this report. However, the nature of direct methane and NMVOC emissions indicates that substantial uncertainties should continue to be expected after the proposed new quantification methodology has been implemented.
Cold venting and fugitive emissions from Norwegian offshore petroleum activities
18
Implementing the proposed quantification methodologies will ensure that the quality of emission inventory reports for direct methane and NMVOC emissions from offshore facilities will be significantly better than in previous reports, and at least as good as in comparable countries.
5.2 Emission sources with minor contribution
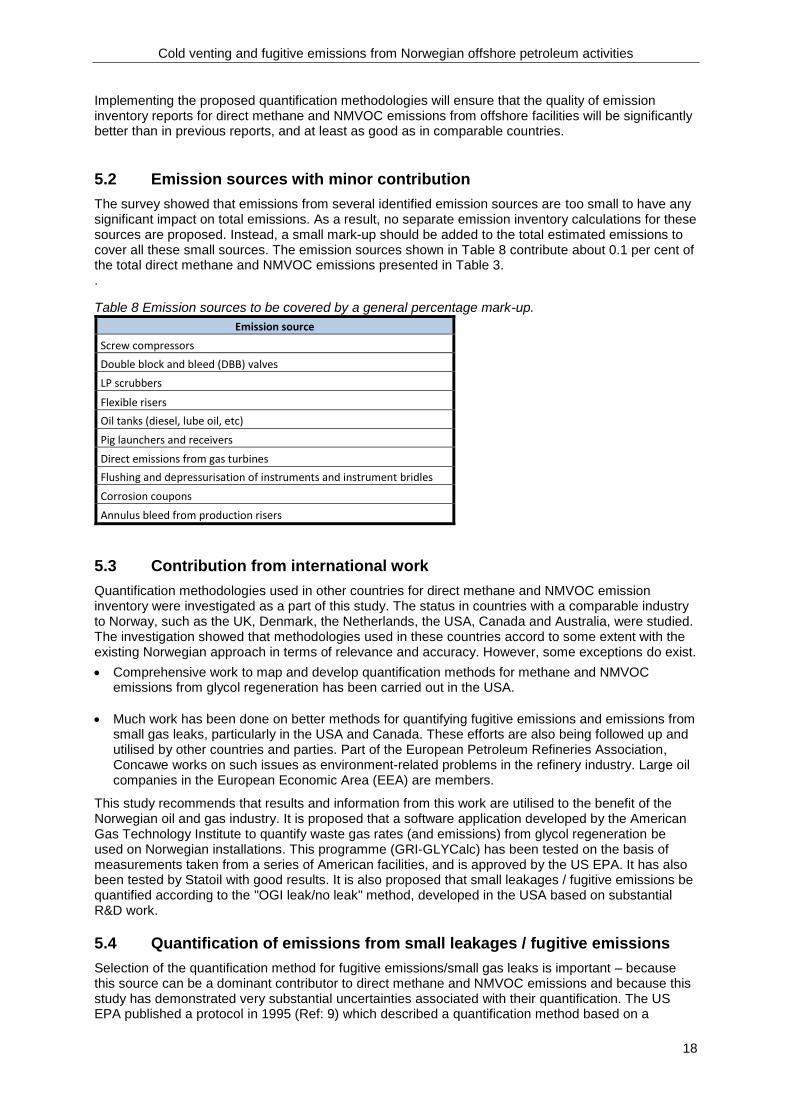
The survey showed that emissions from several identified emission sources are too small to have any significant impact on total emissions. As a result, no separate emission inventory calculations for these sources are proposed. Instead, a small mark-up should be added to the total estimated emissions to cover all these small sources. The emission sources shown in Table 8 contribute about 0.1 per cent of the total direct methane and NMVOC emissions presented in Table 3. .
Table 8 Emission sources to be covered by a general percentage mark-up.
Emission source
Screw compressors
Double block and bleed (DBB) valves
LP scrubbers
Flexible risers
Oil tanks (diesel, lube oil, etc)
Pig launchers and receivers
Direct emissions from gas turbines
Flushing and depressurisation of instruments and instrument bridles
Corrosion coupons
Annulus bleed from production risers
5.3 Contribution from international work
Quantification methodologies used in other countries for direct methane and NMVOC emission inventory were investigated as a part of this study. The status in countries with a comparable industry to Norway, such as the UK, Denmark, the Netherlands, the USA, Canada and Australia, were studied. The investigation showed that methodologies used in these countries accord to some extent with the existing Norwegian approach in terms of relevance and accuracy. However, some exceptions do exist.
Comprehensive work to map and develop quantification methods for methane and NMVOC emissions from glycol regeneration has been carried out in the USA.
Much work has been done on better methods for quantifying fugitive emissions and emissions from small gas leaks, particularly in the USA and Canada. These efforts are also being followed up and utilised by other countries and parties. Part of the European Petroleum Refineries Association, Concawe works on such issues as environment-related problems in the refinery industry. Large oil companies in the European Economic Area (EEA) are members.
This study recommends that results and information from this work are utilised to the benefit of the Norwegian oil and gas industry. It is proposed that a software application developed by the American Gas Technology Institute to quantify waste gas rates (and emissions) from glycol regeneration be used on Norwegian installations. This programme (GRI-GLYCalc) has been tested on the basis of measurements taken from a series of American facilities, and is approved by the US EPA. It has also been tested by Statoil with good results. It is also proposed that small leakages / fugitive emissions be quantified according to the "OGI leak/no leak" method, developed in the USA based on substantial R&D work.
5.4 Quantification of emissions from small leakages / fugitive emissions
Selection of the quantification method for fugitive emissions/small gas leaks is important – because this source can be a dominant contributor to direct methane and NMVOC emissions and because this study has demonstrated very substantial uncertainties associated with their quantification. The US EPA published a protocol in 1995 (Ref: 9) which described a quantification method based on a

Cold venting and fugitive emissions from Norwegian offshore petroleum activities
19
combination of leak detection by sniffer (using a specific procedure) and statistical distributions of emission rates for different components with a leak potential (control valves, other valves, flanges and so forth). Sniffing is a complicated, demanding and expensive operation. New techniques are now emerging. Among these is the OGI "leak/no leak" method, which has received considerable attention. This is based on using an IR camera for leak detection in combination with a database containing all components with a potential for HC gas leaks. All components in the database are "scanned" for leakage by the IR camera. Component leak factors developed statistically are used to calculate emissions from all leaking components (high leak factor) and for all non-leaking components (low leak factor). Components with no documented leak also do leak. Concawe has completed a comprehensive project which concluded that the OGI method provides comparable results to the sniffing approach. It was also checked against controlled leak measurements using the bagging technique, and found to provide comparable or more conservative results. The OGI method has several advantages over sniffing. Leaks from components inaccessible to sniffing can be detected, for example. The method is faster, less resource-intensive, far cheaper, and likely to replace sniffing eventually. The OGI method is therefore recommended for quantifying fugitive emissions and small gas leaks from Norwegian offshore facilities.
5.5 Flow rate metering
Where some of the sources are concerned, a proposed method for quantifying emissions is the gas flow rate. This applies to processes where HC gas is added to the process and subsequently emitted (by gas stripping, for example). The method could also apply to emissions through common cold vents which contain waste gases from various sources. Where smaller gas volumes are concerned, the flow rate could be determined by simple calculations. Metering is recommended for more substantial emissions. Some facilities have already installed flow meters on their common vents to the atmosphere, but retrofitting a flow meter on a facility in operation can be costly. Ultrasonic flow meters were found to represent the most attractive metering principle. The use of ultrasonic flow meters may also nable the gas phase to be split the into methane and NMVOC. Ultrasonic meters can be installed on HC gas piping by hot tapping. These units can also be installed externally as a clamp-on meter. That applies primarily to feed streams under pressure, such as stripping gas, purge gas and so forth. Clamp-on meters are not recommended today for low-pressure emission streams. In most cases, waste gases emitted through common cold vents contain varying quantities of other gases, such as CO2, water vapour and N2. These will be included in the metered results. In cases where flow meters are used for quantification, non-HC gases should be quantified, documented and subtracted from the total.
5.6 Split between methane end NMVOC
The composition of emission gases varies from source to source, and from facility to facility. Since direct emissions must be reported as methane and NMVOC, the gas composition needs to be known. The exact composition of many waste gases is unknown. However, the survey indicated that waste gas composition from many sources does not differ much from fuel, flare or sales gas composition. Since the composition of these gases is determined by regular sampling and analyses, it is recommended that fuel, flare or sales gas composition be used in many cases. Each operator should therefore assess which of these gas analyses is most representative, and use this as the basis for establishing the distribution of methane and NMVOC from individual sources. However, gas emitted from some sources may differ radically in composition from fuel, flare or sales gas. In such cases, composition could be determined by specific calculations or simulations. Typical examples are waste gases from produced water treatment and from MEG or TEG regeneration. Where some other sources are concerned, such opportunities do not exist and separate gas sampling and analyses may be required. However, this can be complicated and expensive. The recommendation in such cases is therefore that sampling and analyses be limited to waste gases making a significant contribution to total emissions, and only if satisfactory data on composition cannot be obtained by other and simpler methods.

Cold venting and fugitive emissions from Norwegian offshore petroleum activities
20
6 Emissions abatement opportunities
Direct methane and NMVOC emissions to air from some sources/processes also occur because they cannot be eliminated or significantly reduced. This applies to fugitive emissions and to some operational emissions. However, many of the latter can theoretically be eliminated with the use of simple techniques:
off-gas can be recycled back to the process and recovered
N2 can be used as stripping and flotation gas instead of HC gas
N2 can be used as secondary seal gas in compressors instead of HC gas
N2 can be used as purge and blanket gas instead of HC gas.
These solutions are already selected and in use on many existing Norwegian facilities. Such sources account for a significant share of direct methane and NMVOC emissions from offshore installations.
6.1 Emission sources which can theoretically be eliminated by gas recovery
The table below gives an overview of sources producing waste gas which can in theory be recovered.
Table 9 Emission sources which can theoretically be eliminated with recirculation and recovery.
Main source Sub-source
Glycol regeneration All sub-sources
Produced water treatment
Produced water degassing tank
Flotation tank
Flotation gas
Compressor seal oil All sub-sources
Dry compressor seals Vent from primary barrier
Vent from secondary barrier (when HC gas is used)
Gas analyses and sampling Slipstreams continuously emitted
These are significant emission sources. In addition come many small sources (see Table 4). Recovery of waste gas from these sources and sub-sources has been implemented on many facilities on the NCS. On some of these, the waste gas is flared. This eliminates direct methane and NMVOC emissions, but emits more CO2 and other combustion products, including NOx and particles. A number of reasons may exist for routing waste gases to direct emission, including a lack of attention to reducing methane and NMVOC emissions in the conceptual design phase. Facility-specific conditions which show that recovery is more complicated and expensive than emitting waste gases may also have been decisive. Based on the information collected in this study, no clear tendency can be seen towards recovering off-gases on new installations which came on stream after 2000 compared with older installations.
6.2 Use of nitrogen (N2) instead of HC gas
Using HC gas as flotation, stripping, purge and blanket and secondary seal gas in compressors creates no emission problems if the waste or used gas is recovered. Problems only arise if it is released to the air. The study revealed that many facilities use HC gas as stripping gas in glycol regeneration systems and route the waste gas to the air. Some installations had initially used N2 for stripping, but replaced this with HC gas after a period. The reason was that small amounts of O2 in the N2 gas caused oxidation and degeneration of the glycol solution. One solution to this problem could be purer (and more expensive) N2.

Cold venting and fugitive emissions from Norwegian offshore petroleum activities
21
Some facilities use HC gas instead of N2 as a secondary barrier gas in the dry compressor seal system. Some operators reported that HC gas was selected because N2 caused corrosion in the seals owing to trace amounts of oxygen. Again, purer N2 could be a solution.
6.3 New technology
Where most emission sources are concerned, existing well-proven technology is capable of eliminating or reducing emissions. But new or improved technology is required for some sources. Direct emission of HC gas from the flare prior to ignition (delayed flare ignition) occurs mainly because of inefficient ignition technology. Some information collected through the survey indicates that the ballistic ignition system, which involves shooting a pellet along a guide tube to a spark plate at the flare tip, leads to faster and more secure ignition than ignition using a signal gun. The industry is therefore recommended to check this out more closely.
6.4 Emission sources which are difficult to eliminate
Unlike the emission sources mentioned above, several cannot be eliminated in practice. The most important of these are listed in Table 10.
Table 10 Emission sources which are difficult to eliminate.
Main source Sub-source Methane + NMVOC emissions (tonnes)
Small gas leaks 2 200
Produced water treatment Discharge caisson 2 150
Flare gas not burnt Open cold flare purged with N2 1 750
Amin regeneration 135
Depressurising oil storage tanks on FPSOs 126
Drilling 114
Depressurisation/gas freeing from instruments/instrument bridles 33
Flaring Extinguished flare and late ignition Unclarified
Double block and bleed (DBB) valves 2
Flare gas not burnt Delayed flare ignition 4
Depressurisation/gas freeing from instrument bridles < 1
Gas analysers and sampling < 1
Flare Non-combustible flare gas See note
Note: only one facility has flare gas which is not combustible. The corresponding emissions are reported under amine regeneration. Three emission sources predominate in Table 10.
Small gas leaks cannot be eliminated, but can be reduced through continuous and effective monitoring, control and repair. Internationally, this is covered by the term LDAR. Operators on the NCS monitor gas leaks continuously with procedures which are in line with LDAR.
Emissions from produced water discharge caissons occur mainly on facilities where substantial produced-water discharges are combined with a large pressure drop from the closest upstream degassing tank to the discharge point. Emissions can be reduced by lowering pressure in the degassing tank, and by reinjecting some or all of the produced water.
Emissions from an open cold flare purged with inert gas occur on very few facilities. Where this flare concept has been selected, emissions cannot be eliminated but only reduced. Switching to

Cold venting and fugitive emissions from Norwegian offshore petroleum activities
22
another flare concept can be very expensive or impossible on practical grounds for some of these facilities.
Comments for the other sources.
Emissions from drilling cannot be eliminated, merely reduced to some degree. A large part of drilling activity takes place on mobile rigs, which do not have flares or processing facilities which enable gas recovery.
Emissions related to gas freeing from process systems and crude oil storage tanks on FPSOs cannot be reduced nor eliminated in a practical way. The tanks and process systems are purged with N2 as a part of the gas-freeing process, thereby gradually increasing the N2 concentration in the waste gas emitted. Separating HC gas from N2 will be very expensive, especially given the small gas volumes involved.
Emissions from delayed flare ignition can be reduced to some extent – but not eliminated – by using better ignitions techniques.
Emissions from gas analyses and sampling are small, but can be reduced significantly by modifying slipstreams which continuously emit gas to the atmosphere. Remaining emissions will then be negligible.
6.5 Best available techniques (BAT)
No "best available techniques reference (BREF) documents" are available which specifically cover BAT related to direct HC gas emissions from the oil and gas industry. However, the EU has initiated a process to establish such a document for petroleum production. With reference to the identified emission sources, this report proposes that techniques and solutions which eliminate methane and NMVOC emissions and are already implemented on Norwegian facilities should be regarded as BAT.
The study documented that recovering waste gases by recycling back to the process is a well-proven technique which can be used for most of the potential emission sources (processes and sub-processes) producing waste gases with methane and NMVOC. Where processes enabling waste gas recovery are concerned, that solution has been chosen for several Norwegian facilities. The survey also found that almost all existing Norwegian installations send waste gases with methane and NMVOC to the atmosphere as emissions from one or more sources, even if recovery is an option. On some installations, the emission option is selected for several of the processes generating potentially recoverable HC waste gases. However, technical or cost-related restrictions on these installations could favour the emission option. It should also be borne in mind that the environmental aspects of methane and NMVOC were not well known and not given much attention when some of these installations were designed and built. Where the construction of new offshore production facilities is concerned, recovery of HC waste gas from the majority of sources with a potential for substantial emissions should be regarded as BAT. Table 11 presents an overview of proposed BAT for the major direct sources of methane and NMVOC emissions.

Cold venting and fugitive emissions from Norwegian offshore petroleum activities
23
Table 11 Proposed BAT for new installations.
Main source Sub-source Proposed BAT, new installations
Purge and blanket gas Use N2 if recovery is impossible in practical terms
Glycol regeneration All sub-sources Waste gas recovery Use N2 as stripping gas
Produced water treatment
Produced water degassing tank Waste gas recovery
Flotation tank Waste gas recovery
Flotation gas N2 as flotation gas Waste gas recovery (when HC is used as flotation gas)
Discharge caisson Re-inject all produced water Low pressure in the upstream degassing tank
Compressor seal oil (wet seals)
Degassing pots, oil tanks, separator chambers
Waste gas recovery
Dry compressor seals
Vent from primary barrier Waste gas recovery
Vent from secondary barrier Use N2 as seal gas Waste gas recovery (when HC is used as seal gas)
HC gas leakage to secondary vent
Use leak-proof seal gas system (internal labyrinth)
Gas turbines
Start gas Do not use HC start gas (not used today)
Purge of turbines at startup Waste gas recovery
Depressurising residual gas at turbine tripping
Waste gas recovery
Gas analysers and test/sample stations Recovery of slipstream gas
Low pressure scrubbers Waste gas recovery
Pig launchers and receivers Waste gas recovery
Annulus bleed in production riser Waste gas recovery
Annulus bleed in flexible riser Waste gas recovery
However, recovery is not possible for some emission sources with currently available techniques. Gas leaks are the most important of these. The BREF document for oil and gas refineries refers to LDAR as a systematic method for reducing fugitive gas leaks. It states:
"Fugitive VOC emissions can be reduced by the detection and subsequent repair or replacement of leaking components. This is achieved by adopting a structured approach, commonly known as a leak detection and repair (LDAR) programme. A LDAR programme includes two fundamental steps:
identification of the leaking components;
repair of these leaks in order to minimise losses."
The survey of the Norwegian installations showed that the operators use the LDAR method to monitor and inspect gas leaks, even if this is not covered by industry guidelines. Considering LDAR as a BAT for inspecting and controlling gas leaks is recommended. Since cost also forms part of the BAT concept, techniques regarded as BAT for new installations are not necessarily BAT for existing facilities. In some cases, technical modifications to implement BAT solutions can become very expensive. Piping systems may have to be converted, LP compressors could need to be installed, and safety and technical challenges must be solved. Since each facility is designed and constructed differently, the cost of modifications to solve supposedly the same problem

Cold venting and fugitive emissions from Norwegian offshore petroleum activities
24
may vary significantly from one facility to another. This means that a measure which has a low abatement cost for one facility may cost much more on another. Since such modifications could involve hot work in process areas, conversion and modification work may have to be carried out when production is shut down. If the work cannot be done during normal turnarounds, production may have to be suspended specifically for such work. Giving priority to the measures with the lowest abatement costs is recommended if existing installations are to be upgraded to meet the recommended BAT solution. In most cases, this would involve curbing the sources with the greatest emissions.
6.6 New versus existing facilities
Using the recommended emission-free techniques on new installations can significantly reduce direct methane and NMVOC emissions compared with facilities on stream today. The additional cost of implementing such measures on new installations is considered to be small or non-existent, but facility-specific exceptions may occur. Disregarding small gas leaks, annual emissions could be limited to less than 10 tonnes of HC gas (methane plus NMVOC) per facility for installations without crude-oil storage. Installations with such storage (eg, FPSOs) will have somewhat higher emissions because of the need to gas-free the tanks for inspection. The position is completely different for existing rather than new facilities. Implementing emission-free techniques on existing installations is also technically feasible, but the considerable conversion work which might be required would yield high abatement costs. Since the scope of such conversion might vary significantly from one facility to another because of different designs and conditions, costs cannot be calculated on a general basis for each abatement measure. No good basis therefore exists for calculating a realistic potential for emission reductions. Based on a qualitative assessment per emission source, however, it should be possible to reduce emissions from existing installations by at least 10 per cent over a few years. That would very much depend on the industry's future operating conditions. The uncertainty is considered to be substantial. Abatement costs are difficult to calculate because modification costs are unknown and methane and NMVOC emissions do not have a defined price. This study recommends that the industry uses a fictitious price for waste gases in its abatement cost calculations. This should be based on the GWP100 of methane and NMVOC measured in CO2 equivalents, combined with a CO2 price consisting of CO2
tax and CO2 emission allowance price. It is recommended that the abatement cost for each facility be calculated or assessed by the operating companies, with attention directed at the dominant emission sources.

Cold venting and fugitive emissions from Norwegian offshore petroleum activities
25
7 References
Ref: 1 “Kaldventilering og diffuse utslipp fra petroleumsvirksomheten offshore - Modul 1 Kartlegging av utslippskilder” Add Novatech AS for the NEA, 2015.
Ref: 2 “Kaldventilering og diffuse utslipp fra petroleumsvirksomheten offshore - Modul 2 Utslippsmengder og kvantifiseringsmetodikk” Add Novatech AS for the NEA, 2015.
Ref: 3 “Kaldventilering og diffuse utslipp fra petroleumsvirksomheten offshore - Modul 3A "Forslag til BAT", Add Novatech AS for the NEA, 2015.
Ref: 4 "Kaldventilering og diffuse utslipp fra petroleumsvirksomheten offshore Modul 3B Tiltaksmuligheter og reduksjonspotensialer", Add Novatech AS for the NEA, 2015.
Ref: 5 "Kaldventilering og diffuse utslipp fra petroleumsvirksomheten offshore Modul 4 -Kontrollsjekk av beregningsmetoder for diffuse utslipp og smålekkasjer", Add Novatech AS for the NEA, 2015.
Ref: 6 “Direct Hydrocarbon Emissions”, Aker Engineering, 1993.
Ref: 7 2013 IPCC AR5 p 714 (with climate-carbon feedbacks).
Ref: 8 "Best Available Techniques (BAT) Reference Document for the Refining of Mineral Oil and Gas", 2015, and Commission Implementing Decision of 9 October 2014 establishing BAT conclusions, under the Industrial Emissions Directive 2010/75/EU.
Ref: 9 EPA-453/R-95-017 ”Protocol for Equipment Leak Emission Estimates”, November 1995.
Ref: 10 "Techniques for detecting and quantifying fugitive emissions – results of comparative facility studies", Concawe report 6/15, October 2015.
Ref: 11 "Update of Fugitive Equipment Leak Emission Factors", Canadian Association of Petroleum Producers (CAPP), February 2014.
Ref: 12 "Diffuse utslipp av felles betydning for industrisektoren – Måling av diffuse utslipp av flyktige forbindelser fra lekkasjer i utstyr og rør", Norwegian standard NS-EN 15446:2008.
Ref: 13 "EEMS-Atmospheric Emissions Calculations", Version 1.10, Department of Energy and Climate Change, UK.
Ref: 14 "Quantified fugitive emissions" - Statoil, Draupner, November 2015.
Ref: 15 "Greenhouse Gas Emissions 1990-2013, National Inventory Report", NEA, 2015.
Ref: 16 "044 Anbefalte retningslinjer for utslippsrapportering", Norwegian Oil and Gas, 2 March 2015.
Ref: 17 "Screening study - Direct Emissions of CH4 and nmVOC – Status and mitigation opportunities", Add Novatech AS for Norwegian Oil and Gas, 2013.

Cold venting and fugitive emissions from Norwegian offshore petroleum activities
26
Appendix 1 The study work group
The project had a work group with the following members. Sissel Sandgrind, NEA Bjørn A Christensen, NEA Tor Fadnes, Norwegian Petroleum Directorate (first half of the study) Halvard Hedland, Norwegian Petroleum Directorate (second half of the study) Espen Landro, Petroleum Safety Authority Norway Hildegunn T Blindheim, Norwegian Oil and Gas Association Odd-Arne Follum, Statoil Bjørnar Lassen, ExxonMobil Erik Husby, Norske Shell Eirik Høvring, Engie Ole Bakkevold, Repsol Øyvind Hille, Det Norske Anne Kristine Norland, ConocoPhillips (second half of the study)