cold start studies in a pemfc stack for automotive fuel cells slides... · evs28 kintex, korea, may...
TRANSCRIPT
EVS28 KINTEX, Korea, May 3-6, 2015
Cold start studies in a PEMFC stack for
automotive fuel cells
Sungho Lee1, Sunbo Shim, Joonguen Park 1 Hyundai motor, 104 Mabuk-dong, Giheung-gu, Youngin-si, Gyeonggi-do,
446-912, Korea, Korea Corresponding Author Email :
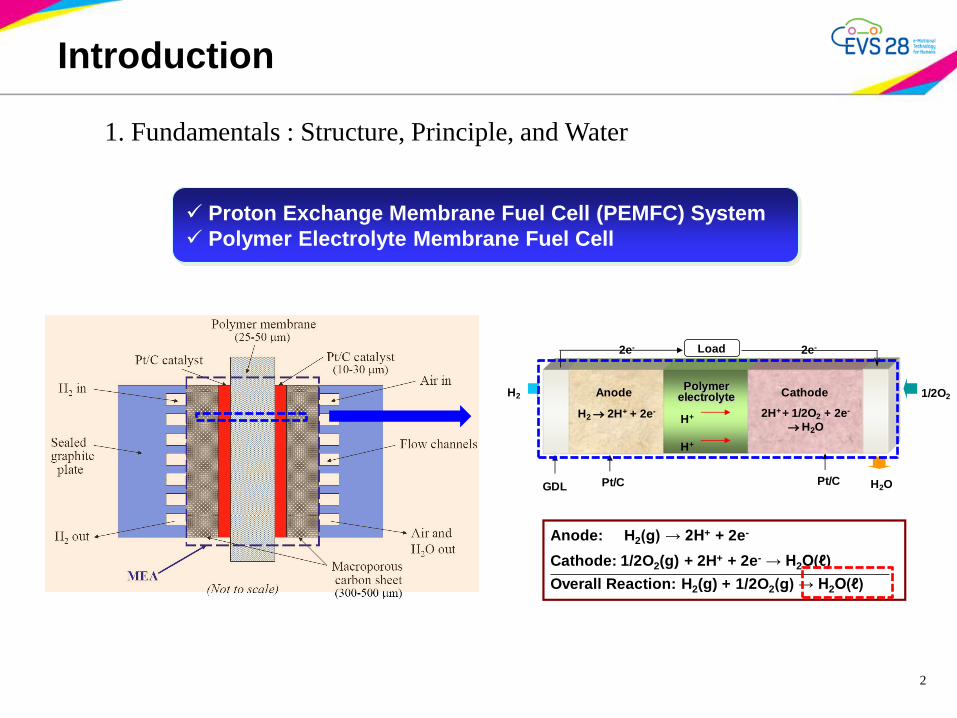
1. Fundamentals : Structure, Principle, and Water
Introduction
2
Proton Exchange Membrane Fuel Cell (PEMFC) System
Polymer Electrolyte Membrane Fuel Cell
H2 2H+ + 2e- 2H+ + 1/2O2 + 2e-
H2OH+
H+
Load
Anode CathodePolymer
electrolyteH2 1/2O2
2e- 2e-
H2OPt/CGDLPt/C
Anode: H2(g) → 2H+ + 2e-
Cathode: 1/2O2(g) + 2H+ + 2e- → H2O(ℓ)
Overall Reaction: H2(g) + 1/2O2(g) → H2O(ℓ)

Introduction
3
in Sweden (Jan., 2012)
2. Cold start
: one of the main hurdles for a commercialization of FCEV

Measurements
1. Measuring points
4
Thermocouple
anode
cathode
coolant
GDL+MEA
7
8
9
10
1
2
3
4
5
6 11
12
13
Cross section of a real stack
Thermocouple mounting points in a bipolar plate
Flow channels, GDL, MEA and thermocouple in a cross section of fuel cell stack

5
Measurements
2. Measuring system for stack temperature: wiring, wire mapping, …

Measurements
3. Thermal behavior of fuel cell stack
: natural cooling, and convection heat transfer coefficient
1) Governing equation and solution
2) Comparing the measured T(t)
with analytic solution,
where, Ti = 60℃, T∞ = 25℃.
6
)( TThAdt
dTmc
005.0mc
hA
t
mc
hATTTT i exp)(

7
Measurements
Time(hr)
-10 ℃
-25 ℃ T∞=-10℃ T∞=-25℃
4. Soaking for cold start in a environment chamber
1) After 24 hr soaking,
Tmax = -6.6℃ @ T∞ = -10℃
Tmax = -14.4℃ @ T∞ = -25℃.
2) From the analytic solution with
measured T(t),
it needs time „t∞‟ to reach T∞ that
t∞ ≈ 34hr @ T∞ = -10℃
t∞ ≈ 57hr @ T∞ = -25℃.

5. Stack temperatures during the cold start: Ti(t)
The speed of temperature increasing: ③ > ⑤ > ④ > ⑧ >① > ②
※ the other points were lost (6, 7, 9, 10, 11, 12, 13)
8
52sec 101sec
50% rated Power Start
End of cold start
Time (sec)
7
8
9
10
1
2
3
4
5
611
12
13
Measurements

6. Temperature distribution in a bipolar plate at the end of a cold start
9
Measurements
: Sub-zero area
7
8
9
10
1
2
3
4
5
611
12
13
T∞ =-10℃
7
8
9
10
1
2
3
4
5
611
12
13
T∞ =-25℃
: Tmax
: Tmin
T∞ (℃)
Temperature(℃
)
Ti vs. T∞ at the end of the cold start

7. Temperature distribution on a bipolar plate during the cold start
: at T∞ = 10℃, Δt = 20 sec
Measurements
10
Air

Cold-start simulation
1. Governing equations
11
Ahrae Jo, Sungho Lee, Whangi Kim , Johan Ko , Hyunchul Ju a, “Large-scale cold-start
simulations for automotive fuel cells”, international journal of hydrogen energy 40 (2015)
1305 -1315
2 2
2
2 2 2 2
2
2 2
when
when
when
w
0
> &
& 0
0
sat
H O H O
H Osat sat
desub H O H O H O H O freeze
sgH Osat
sub H O H O freeze
C C
R C C C C T TS
R C C T T s
2hen & 0
H O
freezeT T s

Cold-start simulation
2. Model Geometry
12
Air in, -20℃
H2 in, -20℃
Air
GDL_anode catalyst_anode
membrane
catalyst_cathode
GDL_cathode Air
H2 H2
bipolar plate
coolant
coolant
bipolar plate

Cold-start simulation
13
Wall : Convection (T∞ = -20℃)
Symmetry condition
Air H2
GIF Animation
3. Results
: Temperature distributions on a bipolar plate during a cold start

Cold-start simulation
3. Results
: Comparing the Experiment and Simulation temperature
14
11 [℃] -20 0 -10
-5 10 [℃] 0 5
Modeling at t=110 s, T∞=-20℃
Measuring at t=52 s, T∞=-10℃

Conclusions
The temperatures on a bipolar plate of a PEMFC stack have been revealed
by measurements and large scale simulation models during a cold start.
1. Even in a overnight soaking, a stack doesn‟t reach the environment
temperature T∞ in a cold start test.
2. The maximum temperature Tmax is on the middle of a bipolar plate
during a cold start.
3. At the end of a cold start, there could be sub-zero areas according to the
cold start strategy.
It‟s needed to minimize this sub-zero region for a better cold start.
15