coke reactivity under blast furnace condition and in the ...1010477/fulltext01.pdf · coke...
TRANSCRIPT
COKE REACTIVITY UNDER BLAST FURNACE CONDITION AND IN THE CSR/CRI TEST
Maria Lundgren1, Bo Björkman1, Lena Sundqvist Ökvist2
1Luleå University of Technology, SE-971 87 Luleå, Sweden
2 MEFOS, Box 812, SE-971 25 Luleå, Sweden
Abstract The present work aims to study the high-temperature strength of coke. Mechanisms of disintegration were evaluated using basket samples charged into LKAB's experimental blast furnace prior to quenching and dissection. Coke charged into basket samples were analysed with CSR/CRI tests and compared with treated coke from the blast furnace. Results from tumbling tests, chemical analyses of coarse and fine material, as well as light optical microscopy studies of original and treated coke have been combined and evaluated. The results indicate a correlation between the ash composition and the CSR values. Differences in the texture of the coke were noted with light optical microscopy, and a significant change in the coke texture during the CSR/CRI test conditions was found. The results suggest that the main reaction between coke and CO2 took place in isotropic areas, which was especially pronounced in coke with a low CSR. Signs of degradation were apparent throughout the coke pieces that have undergone CSR/CRI testing, but were less observable in coke reacted in the blast furnace. The results indicate that reaction with CO2 is generally limited by the chemical reaction rate in the CSR/CRI test, while in the blast furnace the reaction is limited by the diffusion rate. Coke degradation is therefore mostly restricted to the coke surface in the blast furnace.

Introduction Coke rates can be reduced via increased coal injection (PCI), or input of other reduction agents, through the blast furnace tuyeres. The consequences of this are fewer coke windows for the passage of reducing gas, less coke to support the burden and a longer residence time in the blast furnace. These conditions promote coke degradation and increase the fines generation in the blast furnace [1]. Given that economic and environmental concerns have prompted efforts to decrease coke rates, the optimisation of coke quality has become a focus for researchers worldwide. The most widespread test for characterising coke degradation potential in a blast furnace is the Nippon Steel Cooperation (NSC) CSR/CRI test. This is a standardised test to determine the coke reactivity according to the endothermic solution loss reaction (C+CO2↔CO) and the coke mechanical strength after reaction. A coke sample of 200 grams with a particle size between 19-22.5 mm is placed in a reactor and heated to 1100°C in inert atmosphere. Subsequently, the coke is degassed isothermal for two hours in 100% CO2 gas atmosphere and then cooled with nitrogen gas. After cooling, the coke is weighed and tumbled for 600 revolutions in an I-drum followed by sieving the material through screens with mesh sizes of +10 and -0.5 mm. The weight loss of coke represents the Coke Reactivity Index, CRI, and the remaining coke on the +10 mm sieve represents the Coke Strength after Reaction, CSR. In the blast furnace, the solution loss reaction starts in the thermal reserve zone at around 960°C. The amount of C reacted is limited by the supply of CO2 gas, which can vary 20-30% due to blast furnace conditions [2], and the pressure in the blast furnace. The nature and degree of the coke degradation by the solution loss depends on the rate limiting step, either chemical reaction kinetics or diffusion into pores. If chemical reaction kinetics is the limiting step, then gasification proceeds throughout the whole coke piece which leads to overall weakening of the coke. If the limiting step is diffusion, then the solution loss reaction mainly takes place on the coke surface and the core of the coke piece remains fairly un-reacted with no considerable losses in strength. The actual coke behaviour in the blast furnace lies between these stages, where the solution loss reaction is restricted to the coke surface layer [2]. The solution loss occurs under a mixed regime in the thermal reserve zone of the blast furnace. When the temperature is raised, the chemical reaction rate increases exponentially and the diffusion rate is limited to the amount of CO2 gas that is penetrating through the pores. The CO gas produced inside the least accessible pores chokes the coke wall surface contribution to solution loss; resulting in a regime where primarily the surface layer reacts. The transition temperature of these reaction regimes is around 1100-1200°C [3]. Alkaline, especially potassium, is known to have a catalytic effect on the solution loss reaction, lowering the threshold temperature to approximately 760°C [2] [4]. Fe, CaO and MgO in coke ash are shown to have a catalytic effect on solution loss as well [5]. Earlier studies have compared coke, with different CSR, between tests according to the CSR/CRI standard and tests in a laboratory furnace with blast furnace gas conditions, where the gas and temperature profiles were based on vertical probe measurements. The study showed that the weight loss was lower under blast furnace conditions and the strength after reaction was independent of the degree of gasification, since the solution loss reaction was limited to the surface of the coke [6]. Since the CSR/CRI test, as compared to the blast furnace, provides a more reactive environment, where the chemical reaction kinetics is limiting, it is also important to study the

differences between coke behaviour in a real blast furnace environment and in the CSR/CRI test. The aim of this work is to study the high-temperature strength of coke by comparing cokes with different CSR values treated in the CSR/CRI test and under actual conditions in the blast furnace. LKAB’s Experimental Blast Furnace, EBF, provides an excellent opportunity to study coke behaviour in the blast furnace. Experimental Material
Cokes with different origin, strength and reactivity have been tested according to the CSR/CRI test. Based on their reactivity and the coke strength after reaction, cokes with different CSR were chosen according to Figure 1. After the CSR/CRI test the sieved materials were analysed chemically (XRF) together with the untreated original feed coke.
Experimental Blast Furnace, EBF
In order to compare results from the CSR/CRI test to blast furnace conditions, 40 basket samples were prepared with 200 grams of coke in the same size as used in CSR/CRI tests. The cylinder-shaped steel basket samples were charged to the EBF through two special feeding valves located at the top of the blast furnace. The basket samples descend with the charged material until the blast furnace is stopped. The EBF is quenched with nitrogen gas injected from the top to prevent heat from moving upwards and to prohibit further reactions. More detailed information regarding the EBF is described elsewhere [7]. The subsequent excavation of the EBF takes place about three weeks later, when all layers are carefully measured, examined and photographed. Only 18 basket samples were found, seven of these are included in this investigation. Figure 2 shows the location of the coke basket samples found in the EBF and their distance from the top. Three samples were
46,9
54,2
61,9
70,3
19,923,4
27,3
37,538,235,0
54,7
64,9
0
10
20
30
40
50
60
70
80
A B C D E FCoke
%
CRI CSR
Figure 1. CRI and CSR of tested coke.
Figure 2. Location of the coke basket samples during the excavation of the EBF.
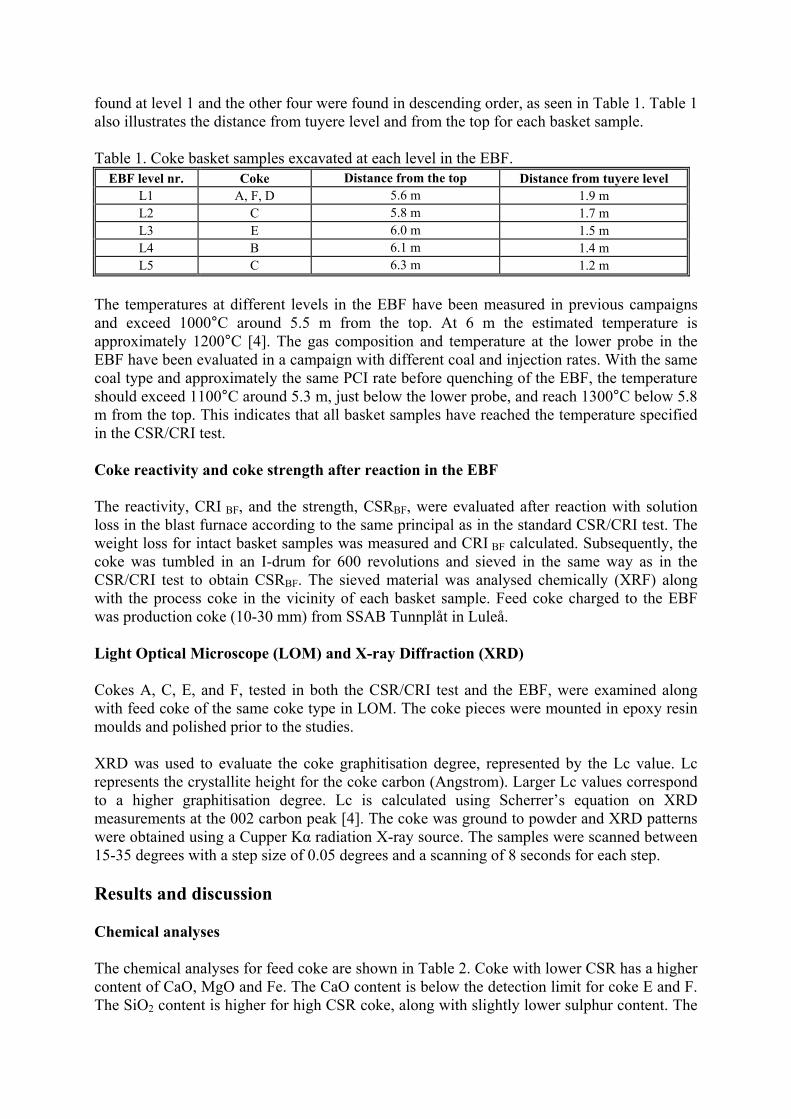
found at level 1 and the other four were found in descending order, as seen in Table 1. Table 1 also illustrates the distance from tuyere level and from the top for each basket sample. Table 1. Coke basket samples excavated at each level in the EBF.
EBF level nr. Coke Distance from the top Distance from tuyere level L1 A, F, D 5.6 m 1.9 m L2 C 5.8 m 1.7 m L3 E 6.0 m 1.5 m L4 B 6.1 m 1.4 m L5 C 6.3 m 1.2 m
The temperatures at different levels in the EBF have been measured in previous campaigns and exceed 1000°C around 5.5 m from the top. At 6 m the estimated temperature is approximately 1200°C [4]. The gas composition and temperature at the lower probe in the EBF have been evaluated in a campaign with different coal and injection rates. With the same coal type and approximately the same PCI rate before quenching of the EBF, the temperature should exceed 1100°C around 5.3 m, just below the lower probe, and reach 1300°C below 5.8 m from the top. This indicates that all basket samples have reached the temperature specified in the CSR/CRI test. Coke reactivity and coke strength after reaction in the EBF The reactivity, CRI BF, and the strength, CSRBF, were evaluated after reaction with solution loss in the blast furnace according to the same principal as in the standard CSR/CRI test. The weight loss for intact basket samples was measured and CRI BF calculated. Subsequently, the coke was tumbled in an I-drum for 600 revolutions and sieved in the same way as in the CSR/CRI test to obtain CSRBF. The sieved material was analysed chemically (XRF) along with the process coke in the vicinity of each basket sample. Feed coke charged to the EBF was production coke (10-30 mm) from SSAB Tunnplåt in Luleå. Light Optical Microscope (LOM) and X-ray Diffraction (XRD) Cokes A, C, E, and F, tested in both the CSR/CRI test and the EBF, were examined along with feed coke of the same coke type in LOM. The coke pieces were mounted in epoxy resin moulds and polished prior to the studies. XRD was used to evaluate the coke graphitisation degree, represented by the Lc value. Lc represents the crystallite height for the coke carbon (Angstrom). Larger Lc values correspond to a higher graphitisation degree. Lc is calculated using Scherrer’s equation on XRD measurements at the 002 carbon peak [4]. The coke was ground to powder and XRD patterns were obtained using a Cupper Kα radiation X-ray source. The samples were scanned between 15-35 degrees with a step size of 0.05 degrees and a scanning of 8 seconds for each step. Results and discussion Chemical analyses The chemical analyses for feed coke are shown in Table 2. Coke with lower CSR has a higher content of CaO, MgO and Fe. The CaO content is below the detection limit for coke E and F. The SiO2 content is higher for high CSR coke, along with slightly lower sulphur content. The

sum of oxides in the coke assay is in this study assumed to represent the total ash content. The oxide values differ slightly from the ash analyses for coke A, B and D. These cokes might contain oxides which are not detected in the XRF analyses. Figure 3 shows the ash content, with sulphur excluded, for feed coke, basket samples from the EBF and for coke reacted using the CSR/CRI test. The ash content is higher for both +10 mm and -0.5 mm fractions for nearly all coke types after the CSR/CRI test compared to EBF basket samples. The sulphur content, Figure 4, shows little variation at these levels as the coke descends in the EBF, as can be noted for coke in the vicinity of basket samples and coke C at level 2 and level 5 in the EBF. The ash content is lower in +10 mm coke from the EBF compared to the same coke type reacted in the CSR/CRI test, Figure 3. This indicates that the solution loss reaction is less favoured in the blast furnace conditions. Table 2. XRF analyses, in wt-%, of feed coke.
Coke Fe CaO SiO2 P2O5 S Al2O3 MgO Na2O K2O Sum of oxides Ash
A 0.47 0.39 4.98 0.026 0.76 3.39 0.09 0.05 0.08 10.41 12.40 B 0.54 0.52 4.14 0.065 0.68 3.26 0.10 0.05 0.06 9.61 11.50 C 0.65 0.52 3.32 0.136 0.54 2.46 0.21 0.13 0.20 8.30 8.67 D 0.37 0.20 4.66 0.038 0.69 3.53 0.04 0.05 0.07 9.66 12.00 E 0.41 - 6.29 0.019 0.55 2.78 0.05 0.04 0.14 10.45 10.83 F 0.39 - 6.64 0.024 0.52 3.14 0.05 0.04 0.16 11.15 11.50
0
4
8
12
16
20
24
28
L1 L1 L1 L2 L3 L4 L5
Coke A Coke F Coke D Coke C Coke E Coke B Coke C
%
Feed cokeEBF +10 mm basket samplesEBF -0.5 mm basket samplesCSR/CRI test +10 mmCSR/CRI test -0.5 mmCoke in vicinity of the basket samples
Figure 3. Ash content, the sulphur content excluded.
0
2
4
6
8
10
12
L1 L1 L1 L2 L3 L4 L5
Coke A Coke F Coke D Coke C Coke E Coke B Coke C
S %
Feed coke+10 mm EBF-0.5 mm EBF+10 mm CSR/CRI test-0.5 mm CSR/CRI testCoke in vicinity of basket samples
Figure 4. Sulphur content in ash (wt-%), XRF analyses.
The SiO2 content, Figure 5, reveals small changes in levels 1 and 2 for coke in vicinity of basket samples in the EBF. At levels 3 to 5 the SiO2 content has decreased somewhat, indicating losses of Si to the charged material. The tumbled fine fraction (-0.5 mm) has generally increased in ash, with some exceptions, like silicates (SiO2 and Al2O3). The content of Fe and CaO in the tumbled coarse fraction (+10 mm) after the CSR/CRI test and the EBF basket samples, is lower than in feed coke for all coke types, Figure 6 and 7, respectively. As previously mentioned, these elements are known to catalyse the solution loss reaction and contribute to coke degradation. The alkali content, especially K2O in Figure 8, is significantly higher in the ash of coke excavated from the EBF compared to feed coke and the CSR/CRI test. A correlation between the location of the basket sample and K2O content of the ash is noticeable, where samples found further down in the EBF have higher K2O content. This is a result of recirculation of alkali in the blast furnace atmosphere [4].

0
20
40
60
80
100
L1 L1 L1 L2 L3 L4 L5
Coke A Coke F Coke D Coke C Coke E Coke B Coke C
SiO
2 %Feed coke+10 mm CSR/CRI test -0.5 mm CSR/CRI test+10 mm EBF-0.5 mm EBFCoke in vicinty of the basket samples
Figure 5. SiO2 content in ash (wt-%), XRF analyses.
0
2
4
6
8
10
12
L1 L1 L1 L2 L3 L4 L5
Coke A Coke F Coke D Coke C Coke E Coke B Coke C
Fe %
Feed coke+10 mm CSR/CRI test -0.5 mm CSR/CRI test+10 mm EBF-0.5 mm EBFCoke in vicinity of the basket samples
Figure 6. Fe content in ash (wt-%), XRF analyses.
0
2
4
6
8
10
12
L1 L1 L1 L2 L3 L4 L5
Coke A Coke F Coke D Coke C Coke E Coke B Coke C
CaO
%
Feed coke+10 mm CSR/CRI test -0.5 mm CSR/CRI test+10 mm EBF-0.5 mm EBFCoke in vicinity of the basket samples
Figure 7. CaO content in ash (wt-%), XRF analyses
0
5
10
15
20
25
L1 L1 L1 L2 L3 L4 L5
Coke A Coke F Coke D Coke C Coke E Coke B Coke C
K 2O
%
Feed coke+10 mm CSR/CRI test -0.5 mm CSR/CRI test+10 mm EBF-0.5 mm EBFCoke in vicinity to the basket samples
Figure 8. K2O content in ash (wt-%), XRF analyses.
XRD The graphitisation degrees, represented by the Lc values, are shown in Table 3. In a previous study the graphitisation degree showed a linear correlation to the temperature. A higher Lc value corresponds to a higher temperature [4]. The coking temperature for coke E and F was around 1025°C, which is slightly lower than CSR/CRI test temperature of 1100°C. The other coke types’ coking temperature is unknown. However, the Lc values for feed coke in Table 3 are lower than for the same coke type after treatment in the CSR/CRI test, indicating that graphitisation has occurred at a temperature around 1100°C. Table 3. Lc values in Angstrom.
EBF level nr.
Coke in vicinity
of basket samples
Coke Distance from tuyere level
EBF basket samples
CSR/CRI test Feed coke
L1 25,9 A 1.94 m 22.5 22.9 21.4 L1 25,5 F 1.94 m 25.2 25.3 - L1 26,6 D 1.94 m 25.6 23.2 - L2 27,8 C 1.74 m 26.4 26.2 23.3 L3 26,1 E 1.54 m 24.4 21.8 20.9 L4 31,6 B 1.44 m 25.2 21.6 23.1 L5 30,0 C 1.24 m 28.3 26.2 23.3

Compared to the CSR/CRI test results, the graphitisation degree has increased from level 2 to level 5 for all coke basket samples from the EBF. This indicates that the EBF samples must have reached a temperature above 1100°C. For the EBF samples of coke A and F in level 1, the Lc values are slightly lower compared to similar coke treated in CSR/CRI test, but a little higher for coke D. Coke D was recovered below the other two samples also found in level 1, Figure 2. A shift towards higher temperatures at levels 3 to 5 is evident, due to the increased graphitisation degrees in EBF basket samples. Lc values for coke excavated in the vicinity of the basket samples in the EBF show that the coke graphitisation degree increases with higher temperatures when descending to lower parts of the blast furnace, Table 3. Coke reactivity and coke strength after reaction in the EBF Even though fines could have escaped through the mesh in the basket, the reactivity, CRIBF, is considerably lower for all coke types excavated from the EBF compared to the standardised CSR/CRI test, Table 4. The relative reactivity for the two different tests does correlate, i.e. coke with the lowest CRI has the lowest CRIBF, etc. The coke strength after reaction in the EBF, CSRBF, is much higher than in the CSR/CRI test. Correlation between CSR and the CSRBF cannot be stated from these results. According to coke C, both the CRIBF and the CSRBF is increased closer to tuyere level. This may be a result of an elevated temperature closer to tuyere level, and the solution loss reaction regime may have shifted from a mixed regime to more diffusion limited. This leads to degradation on the coke surface and the inner coke matrix is rather unaffected by the solution loss reaction. Table 4. Reactivity and strength for coke treated in the CSR/CRI test and in the EBF.
Coke CRI (%) CSR (%) EBF level nr. Distance from tuyere level CRIBF (%) CSRBF (%)
A 38.2 46.9 1 1.94 m 18.7 72.4 F 19.9 70.3 1 1.94 m 12.9 81.1 D 27.3 61.9 1 1.94 m 14.3 78.7 C 35.0 54.7 2 1.74 m 19.6 78.3 E 23.4 64.9 3 1.54 m 10.3 77.5 B 37.5 54.2 4 1.44 m 15.8 78.9 C 35.0 54.7 5 1.24 m 22.8 79.9
Light optical microscope Feed coke Examples of coke textures in feed coke are shown in Figure 9. Isotropic textures, which are reactive to CO2, are more common in coke with higher CRI and lower CSR, Figures 9a-d. The texture in Figure 9a is relatively apparent in all examined coke types, but not as frequent in coke with high CSR. Molten isotropic texture, Figure 9b, can be found in larger areas of coke C and is reactive in the CSR/CRI test. The anisotropic fine mosaic texture, shown in Figure 9e-f is relatively inert to solution loss reaction and the texture is predominant in coke with high CSR. The fine mosaic texture for coke with low CSR, Figures 9c-d, has an isotropic feature.

Figure 9. Feed coke textures. Low CSR a-d. High CSR e-f. Coke +10mm after tumbling in the I-drum, low CSR Clear signs of coke disintegration are noted for coke with low CSR after reaction in the CSR/CRI test, both in the rim of the coke piece and further in towards the core. Figure 10 shows a comparison between the CSR/CRI test (1 a-b), EBF level 2 (2 a-b) and EBF level 5 (3a-b) for coke C, which has a CSR value of 54.7%. Coke C, reacted in the EBF to level 2 (about 1.7 m above the tuyere level), shows some signs of degradation. Especially in the rim of the coke, the isotropic areas have reacted and appear as the fine molten isotropic texture in Figure 10 (2a). The fine mosaic texture at the core, Figure 10 (2b), is quite unaffected. Further down in the EBF, at level 5, about 1.2 m above tuyere level, isotropic areas have been totally reacted, Figure 10 (3a), as the temperature is most likely higher than in the CSR/CRI test. At this level, even at the core, one can see some reacted coke textures. The fine mosaic texture shows no signs of solution loss attack.
Figure 10. Coke C a. Rim b. Core 1a-b. After CSR/CRI test. 2a-b. EBF level 2. 3a-b. EBF level 5.

Coke +10mm after tumbling in the I-drum, high CSR The high CSR coke shows smaller differences between reaction both in the CSR/CRI test and in the blast furnace when compared to low CSR coke. Although, isotropic areas in coke F, which has a CSR value of 70.3%, do show signs of reaction, both in the CSR/CRI test and for
coke from the EBF at level 1, Figures 11 and 12a, respectively. The anisotropic parts, both in the rim and in the core of the coke, show little or no signs of coke degradation due to solution loss gasification, Figure 12. The major difference between the CSR/CRI test gas conditions and the blast furnace gas atmosphere is the CO2 gas content, which is 100% in the CSR/CRI test and considerably lower in the blast furnace. In a previous trial in the EBF the CO2 content was as low as 5% in the temperature region of 1100°C.
This plus higher pressure in the blast furnace slows down the reaction rate of solution loss. On the other hand, the blast furnace atmosphere contains other gaseous elements like H2/H2O, which also contribute to solution loss (C+H2O↔CO+H2), and recirculation of alkali, which catalyses the solution loss reaction. The LOM study confirms that the CSR/CRI test atmosphere is more aggressive towards coke degradation than the blast furnace atmosphere. The degradation proceeds throughout the whole coke piece in the test, while coke from the EBF primarily shows signs of solution loss gasification in the outer layer of the coke piece. Conclusions Coke of different properties in terms of reactivity, strength after reaction, chemical composition and carbon structure has been tested in laboratory and in an experimental blast furnace. Feed coke and coke treated in the CSR/CRI test and in the EBF have been studied using LOM and XRD together with an evaluation of the chemical changes in coke. The test results are as follows:
• The chemical assay in coke ash shows that feed coke with high CSR has a higher SiO2 content, whereas coke with low CSR has a higher content of Fe, CaO and MgO. Generally, the oxide content is higher for coke reacted in the CSR/CRI test compared to coke samples from the EBF, due to a higher degree of gasification in the CSR/CRI test atmosphere. Since the EBF atmosphere includes gaseous components such as recirculated alkali, the alkali content in blast furnace coke increases as the coke descends in the shaft.
Figure 11. Coke F, CSR/CRI test. a. Rim b. Core
Figure 12. Coke F, EBF level 1. a. Rim b. Core

• The coke graphitisation degree increases with higher temperatures when descending to lower parts of the blast furnace. The temperature at the lower part of the EBF has been shown to be higher than the CSR/CRI test temperature of 1100°C.
• No correlation was found between coke strength for coke reacted in the CSR/CRI test
and in the EBF. The coke strength is considerably higher in coke from the blast furnace, regardless of the CSR value, when compared to the CSR/CRI test.
• LOM studies show that isotropic areas in the coke texture participate to a higher
degree in the solution loss reaction. These areas are more distinct in coke with low CSR.
• Solution loss reaction seems to occur throughout the coke piece during CSR/CRI
testing, while in the blast furnace the reaction tends to occur at the coke surface. Subsequently, the reaction rate in the CSR/CRI test atmosphere is limited by chemical reaction kinetics, while in the blast furnace the limiting reaction is mainly diffusion.
Acknowledgements The authors wish to thank the Swedish National Energy Administration (STEM) for financial support and the members of the Swedish Steel Producers’ Association JK21057 and JK21064 projects for fruitful discussions. Thanks to SSAB Tunnplåt AB for providing coke and chemical analyses along with support and assistance during the completion of this work. A special thanks to LKAB for providing the opportunity to carry out tests in the EBF. References [1] Cheng, A. “Coke Quality Requirements for Blast Furnaces, Part X”. I&SM, Vol.28, No 10, October 2001. [2] Cheng, A. “Coke Quality Requirements for Blast Furnaces, Part VIII”. I&SM, Vol.28, No 8, August 2001. [3] Loison, R, Foch, P, Boyer, A. “Coke Quality and Production”. Second edition (1989). Butterworths Borough Green, Sevenoaks Kent TN15 8PH, England. ISBN 0-408- 02870-X. [4] Hilding, T, Gupta, S, Sahajwalla, V, Björkman, B, Wilström, J-O. ”Degradation Behaviour of a High CSR Coke in an Experimental Blast Furnace: Effect of Carbon Structures and Alkali Reactions”. ISIJ Int, Vol.45, No 7, pages 1041-1050, 2005. [5] Cheng, A. “Coke Quality Requirements for Blast Furnaces, Part III”. I&SM, Vol.28, No 3, March 2001. [6] van der Velden, B, Trouw, J, Chaigneau, R, Van der Berg, J. “Coke Reactivity under Simulated Blast Furnace Conditions”. ISS 58th Ironmaking & 82nd Steelmaking Conference 1999. [7] Eklund, N. Trials with Mixed Burden in the LKAB Experimental Blast Furnace. Scanmet II, Volume 1, 6-9 June 2004, Luleå, Sweden, pages 353-364.