cohen et al. (2012) - mitweb.mit.edu/jlcohen/www/papers/cohenetal_erl12.pdf · arctic warming,...
TRANSCRIPT

Arctic warming, increasing snow cover and widespread boreal winter cooling
This article has been downloaded from IOPscience. Please scroll down to see the full text article.
2012 Environ. Res. Lett. 7 014007
(http://iopscience.iop.org/1748-9326/7/1/014007)
Download details:
IP Address: 209.23.207.1
The article was downloaded on 16/01/2012 at 17:54
Please note that terms and conditions apply.
View the table of contents for this issue, or go to the journal homepage for more
Home Search Collections Journals About Contact us My IOPscience

IOP PUBLISHING ENVIRONMENTAL RESEARCH LETTERS
Environ. Res. Lett. 7 (2012) 014007 (8pp) doi:10.1088/1748-9326/7/1/014007
Arctic warming, increasing snow coverand widespread boreal winter cooling
Judah L Cohen1, Jason C Furtado1, Mathew A Barlow2,Vladimir A Alexeev3 and Jessica E Cherry3
1 Atmospheric and Environmental Research, Inc., Lexington, MA 02421, USA2 Environmental, Earth, and Atmospheric Sciences, University of Massachusetts Lowell, MA 01854,USA3 International Arctic Research Center, University of Alaska Fairbanks, Fairbanks, AK 99775, USA
Received 3 November 2011Accepted for publication 16 December 2011Published 12 January 2012Online at stacks.iop.org/ERL/7/014007
AbstractThe most up to date consensus from global climate models predicts warming in the NorthernHemisphere (NH) high latitudes to middle latitudes during boreal winter. However, recenttrends in observed NH winter surface temperatures diverge from these projections. For the lasttwo decades, large-scale cooling trends have existed instead across large stretches of easternNorth America and northern Eurasia. We argue that this unforeseen trend is probably not dueto internal variability alone. Instead, evidence suggests that summer and autumn warmingtrends are concurrent with increases in high-latitude moisture and an increase in Eurasiansnow cover, which dynamically induces large-scale wintertime cooling. Understanding thiscounterintuitive response to radiative warming of the climate system has the potential forimproving climate predictions at seasonal and longer timescales.
Keywords: winter trends, snow cover, Arctic Oscillation, prediction, global warming
S Online supplementary data available from stacks.iop.org/ERL/7/014007/mmedia
1. Introduction
Global surface temperatures have generally warmed for theentire length of the instrumental record. The most significantand strongest warming occurred in the most recent 40 yr,with Arctic temperatures warming at nearly double the globalrate (Solomon et al 2007, Screen and Simmonds 2010).Coupled climate models attribute much of this warming torapid increases in greenhouse gases (GHGs) and project thestrongest warming across the extratropical NH during borealwinter due to ‘winter (or Arctic) amplification’ (Holland andBitz 2003, Hansen and Nazarenko 2004, Alexeev et al 2005,Langen and Alexeev 2007). Yet, while the planet has steadilywarmed, NH winters have recently grown more extremeacross the major industrialized centres. Record cold snaps andheavy snowfall events across the United States, Europe andEast Asia garnered much public attention during the wintersof 2009/10 and 2010/11 (Blunden et al 2011, Cohen et al2010). Cohen et al (2009) argued that the occurrence ofmore severe NH winter weather is a two-decade-long trendstarting around 1988. Whether the recent colder winters are a
consequence of internal variability or a response to changes inboundary forcings resulting from climate change remains anopen question.
In this letter, we propose that the extensive winter NHextratropical cooling trend amidst a warming planet cannotbe explained entirely by internal variability of the climatesystem. It has been shown that above normal snow coveracross Eurasia in the autumn leads to a negative ArcticOscillation (AO) and cold temperatures across the easternUnited States and northern Eurasia in winter (Cohen andEntekhabi 1999). Therefore, we suggest that a significantportion of the wintertime temperature trend is driven bydynamical interactions between October Eurasian snow cover,which has increased over the last two decades, and thelarge-scale NH extratropical circulation in the late autumn andwinter.
2. Observational data and model output
Observational surface temperature data originate from threesources: (1) the Climate Research Unit land air temperature
11748-9326/12/014007+08$33.00 c© 2012 IOP Publishing Ltd Printed in the UK
Environ. Res. Lett. 7 (2012) 014007 J L Cohen et al
Table 1. List of radiosonde stations from the Integrated Global Radiosonde Archive used for precipitable water trends calculated andpresented in figure 3. The location of the station and the time span of the record from each station are included.
Station ID Location Latitude (◦N) Longitude (◦E) Time span
RS 20674 Ostrov Dikson 73.50 80.42 1948–2011RS 20891 Khatanga 71.98 102.47 1950–2011RS 21824 Bukhta Tiksi 71.63 128.85 1948–2011RS 21946 Cokurdah 70.62 147.88 1965–2011RS 23205 Narian Mar 67.65 53.02 1963–2011RS 23330 Salekhard (Obdorsk) 66.53 66.53 1948–2011RS 23472 Turukhansk 65.78 87.95 1963–2011RS 23884 Podkamennaia-Tunguska 61.60 90.00 1963–2011RS 23955 Aleksandrovskoe 60.43 77.87 1949–2011RS 24266 Verkhoyansk 67.55 133.38 1964–2011RS 24343 Zhigansk 66.77 123.40 1965–2011RS 24641 Viliuysk 63.77 121.62 1950–2011RS 24688 Oimakon 63.47 142.80 1950–2011RS 24959 Yakutsk 62.08 129.75 1957–2011RS 25123 Cherskiy 68.75 161.30 1971–2011RS 25400 Zyrianka 65.73 150.90 1965–2011RS 30309 Bratsk 56.30 101.70 1967–2011RS 30372 Chara 56.92 118.25 1967–2011RS 30715 Angarsk 52.48 103.85 1991–2011RS 30758 Chita 52.02 113.33 1946–2011RS 31004 Aldan 58.62 125.37 1950–2011RS 31369 Nikolayevsk-na-Amure 53.15 140.70 1959–2011RS 31736 Khabarovsk 48.53 135.23 1946–2011
Table 2. The ten CMIP5 models from the historical scenario analysed for this study including the number of ensemble members.
Modelling agency, country Model name Ensemble members
Beijing Climate Centre, China BCC-CSM1-1 3Canadian Climate Centre for Modelling and Analysis, Canada CanESM2 5Meteo-France/Centre National de Recherches Meteorologiques, France CNRM-CM5 10NASA Goddard Institute of Space Studies, United States GISS-E2-H 5NASA Goddard Institute of Space Studies, United States GISS-E2-R 5Institute for Numerical Mathematics, Russia INM-CM4 1Centre for Climate System Research, Japan MIROC4h 3Centre for Climate System Research, Japan MIROC5 1Meteorological Research Institute, Japan MRI-CGCM3 5Norwegian Climate Centre, Norway NorESM1-M 3
data set, version 3 (CRUTEM3; Brohan et al 2006);(2) the Modern-Era Retrospective Analysis for Researchand Applications (MERRA; Rienecker et al 2011); and(3) the National Center for Environmental Protection(NCEP)/National Center for Atmospheric Research (NCAR)Reanalysis Project (Kalnay et al 1996). The CRUTEM3consists of land-based temperature anomalies on a regular5◦×5◦ longitude/latitude grid globally. MERRA temperaturesreside on a 1.25◦ × 1.25◦ grid, and NCEP/NCAR reanalysistemperatures on a 2.5◦ × 2.5◦ grid. Only values over land forMERRA and NCEP/NCAR are used. For all data sets, we usethe same time period (1988–2010). Monthly anomalies fromMERRA and the NCEP/NCAR reanalysis fields are computedby removing the climatological monthly means from the rawdata.
Lower tropospheric moisture over the Arctic is derived byvertically integrating specific humidity from MERRA from1000 to 700 hPa and area-averaging the field poleward of60◦N. The Integrated Global Radiosonde Archive (Durre et al2009, Elliott et al 2002) is also used to compute precipitable
water (table 1). Daily data from soundings for all Octoberswere stacked together and only stations with more than80% available data were used. Both 00Z and 12Z times ofradiosonde launch were used if data coverage was sufficient.Only one time was used if coverage in another one was poorin order to remove the potential influence of the diurnal cycle.
Snow and ice data are derived from two sources. The seaice data source is the Hadley Centre Sea Ice and Sea SurfaceTemperature data set (Rayner et al 2003) which resides on a1◦ × 1◦ grid, and is area-averaged poleward of 65◦N over theArctic Ocean. The October mean snow cover index is derivedfrom satellite-sensed measurements (Robinson et al 1993).
Coupled climate model outputs are provided from theCoupled Model Intercomparison Project Phase 5 (CMIP5)multi-model ensemble archive, available for downloadfrom the Program for Climate Model Diagnosis andIntercomparison (PCMDI) at the Lawrence LivermoreNational Laboratory (more information on the program isprovided online at http://cmip-pcmdi.llnl.gov/cmip5/). Weused available runs of ten models of the historical scenario
2
Environ. Res. Lett. 7 (2012) 014007 J L Cohen et al
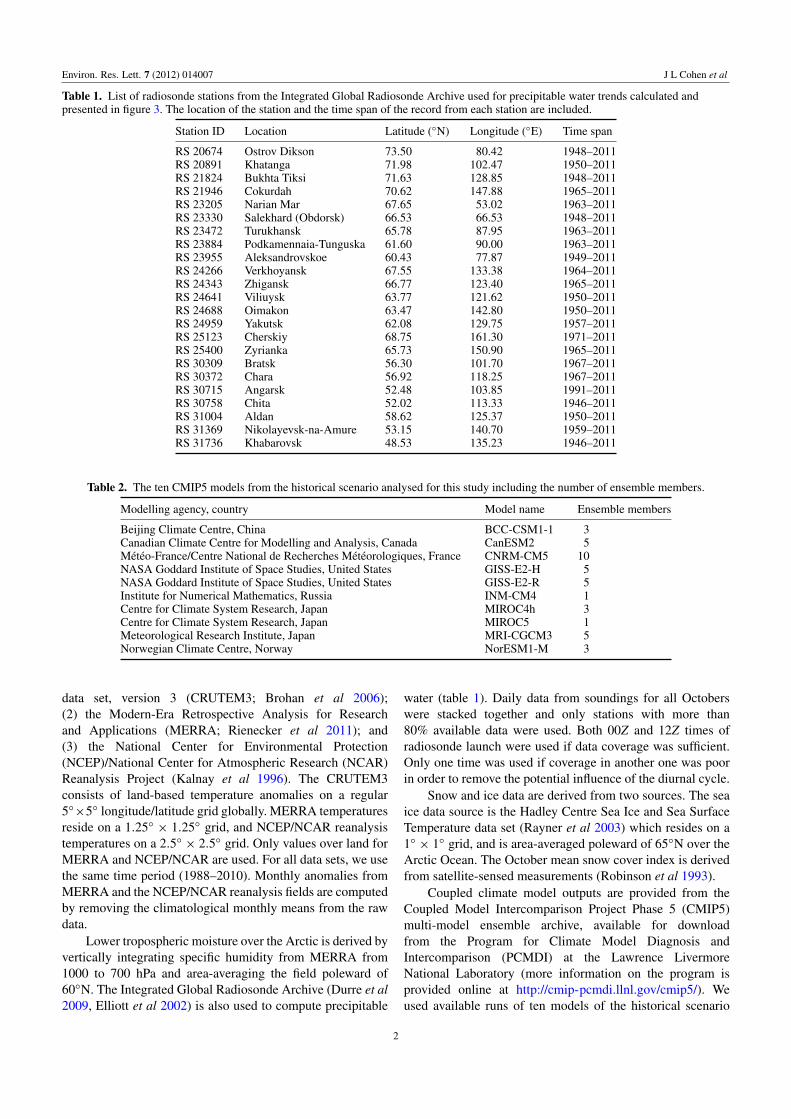
Figure 1. (a) The annual-mean area-averaged land temperatureanomalies (◦C; averaged poleward of 20◦N) from 1988–2010 fromCRUTEM3 (solid red) and the ensemble mean temperature anomalyfrom the historical scenario of the CMIP5 models (solid black).Also shown is the linear trend for the observations (dashed red) andthe CMIP5 ensemble mean (dashed black), including ±1 standarddeviation. A double asterisk (**) indicates trends significant at thep < 0.01 level. (b) As in (a) but for DJF-averaged observedtemperature anomalies (red) and the CMIP5 ensemble mean DJFtemperature anomalies (black). (c) The spatial pattern of lineartrends in DJF surface temperature (◦C/10 yr) from CRUTEM3. In(a) and (b), the plots of model-based anomalies are shifted verticallyso that the anomaly in 1988 matches that from the observations.
(i.e., reconstruction of the climate from 1850 to 2005 usingnatural and anthropogenic forcing) to compute land surfacetemperatures and Eurasian snow cover extent for October (seetable 2 for a list of the models used).
3. Results and discussion
Trend analysis of annual land surface temperatures forthe most recent two decades shows a continuation of theaforementioned warming trend (figure 1(a)). As shown infigure 1(b), for the same period over which annual-meanNH temperatures have increased, boreal winter (December,January and February (DJF)) NH winter land surfacetemperatures exhibit no linear trend. The absence of a
(a)
(b)
(c)
(d)
(e)
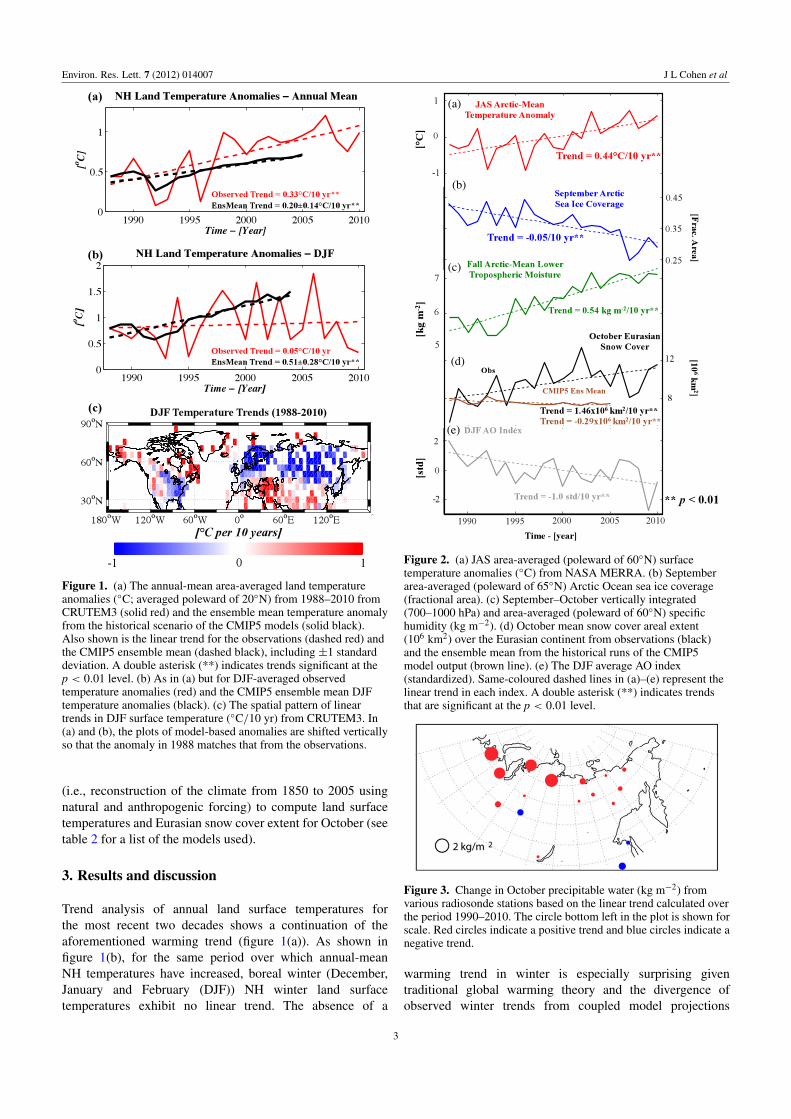
Figure 2. (a) JAS area-averaged (poleward of 60◦N) surfacetemperature anomalies (◦C) from NASA MERRA. (b) Septemberarea-averaged (poleward of 65◦N) Arctic Ocean sea ice coverage(fractional area). (c) September–October vertically integrated(700–1000 hPa) and area-averaged (poleward of 60◦N) specifichumidity (kg m−2). (d) October mean snow cover areal extent(106 km2) over the Eurasian continent from observations (black)and the ensemble mean from the historical runs of the CMIP5model output (brown line). (e) The DJF average AO index(standardized). Same-coloured dashed lines in (a)–(e) represent thelinear trend in each index. A double asterisk (**) indicates trendsthat are significant at the p < 0.01 level.
Figure 3. Change in October precipitable water (kg m−2) fromvarious radiosonde stations based on the linear trend calculated overthe period 1990–2010. The circle bottom left in the plot is shown forscale. Red circles indicate a positive trend and blue circles indicate anegative trend.
warming trend in winter is especially surprising giventraditional global warming theory and the divergence ofobserved winter trends from coupled model projections
3

Environ. Res. Lett. 7 (2012) 014007 J L Cohen et al
Figure 4. (a) Regression of DJF land surface temperature anomalies (◦C) from NCEP/NCAR reanalysis onto the standardized inverted DJFAO index. (b) As in (a) but for regression onto the standardized October Eurasian snow cover index. (c) As in (a) but for regression onto thestandardized inverted September Arctic sea ice index.
(figure 1(b), black line—only trends can be compared, asthe historical experiments are not designed to replicate theactual climate, year by year). While the hemispheric wintertrend is neutral, specific regions have experienced negativetemperature trends. As shown in figure 1(c), spatially, thestrongest winter cooling trends are observed over the easternUnited States, southern Canada and much of northern Eurasia.We repeated the analysis with the MERRA reanalysis data set(see supplementary figure S1 available at stacks.iop.org/ERL/7/014007/mmedia) and the results are qualitatively identical.
Our argument for how a warming trend globally can yieldcolder NH extratropical winters is summarized in figure 2.The July, August and September (JAS) surface temperaturetrend averaged over the Arctic (60–90◦N) illustrates strongwarming (figure 2(a)), which continues through the autumn(see supplementary figure S2 for the temperature trends forall four seasons, available at stacks.iop.org/ERL/7/014007/mmedia). Strong high-latitude warming during the latesummer and early autumn enhances Arctic sea ice melt, asseen with the strongly negative trends in sea ice coverage(figure 2(b)), though the interaction is not one way as lesssea ice also contributes to warmer Arctic temperatures. The
combination of enhanced latent heat flux over the openwaters of the Arctic and the effect of the Clausius–Clapeyronrelationship increases lower tropospheric moisture over theArctic. Indeed, this is what is observed in both MERRA(figure 2(c)) and radiosonde data (Durre et al 2009, figure 3).Recent studies have also linked decreasing sea ice withincreased autumn cloud cover over the Arctic and an increasein precipitating clouds over Siberia (Eastman and Warren2010, Stroeve et al 2011). Furthermore the modelling studiesof Ghatak et al (2010) and Orsolini et al (2011) illustrate thatdecreasing Arctic sea ice can produce increased snowfall overSiberia. How much of the moisture increase is due to increasesin temperature alone versus increased latent heat fluxes fromincreasingly open Arctic Ocean requires further investigation.
An increase in available moisture potentially resultsin higher precipitation efficiency over Siberia, wheretemperatures are still sufficiently cold enough to yield snow,which is consistent with the studies of Ghatak et al (2010)and Orsolini et al (2011). Figure 2(d) illustrates that themean October snow coverage over the Eurasian continenthas increased over the last two decades (figure 2(d); blackcurve), contrary to the expected negative trend predicted
4
Environ. Res. Lett. 7 (2012) 014007 J L Cohen et al
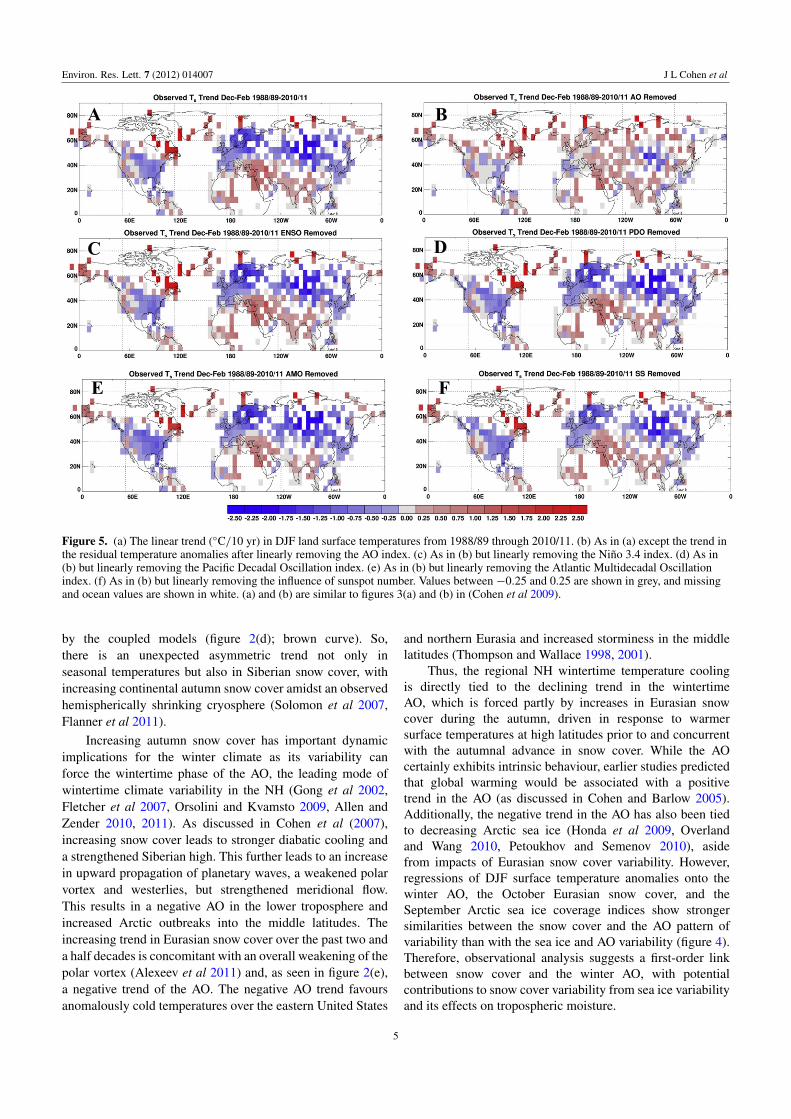
Figure 5. (a) The linear trend (◦C/10 yr) in DJF land surface temperatures from 1988/89 through 2010/11. (b) As in (a) except the trend inthe residual temperature anomalies after linearly removing the AO index. (c) As in (b) but linearly removing the Nino 3.4 index. (d) As in(b) but linearly removing the Pacific Decadal Oscillation index. (e) As in (b) but linearly removing the Atlantic Multidecadal Oscillationindex. (f) As in (b) but linearly removing the influence of sunspot number. Values between −0.25 and 0.25 are shown in grey, and missingand ocean values are shown in white. (a) and (b) are similar to figures 3(a) and (b) in (Cohen et al 2009).
by the coupled models (figure 2(d); brown curve). So,there is an unexpected asymmetric trend not only inseasonal temperatures but also in Siberian snow cover, withincreasing continental autumn snow cover amidst an observedhemispherically shrinking cryosphere (Solomon et al 2007,Flanner et al 2011).
Increasing autumn snow cover has important dynamicimplications for the winter climate as its variability canforce the wintertime phase of the AO, the leading mode ofwintertime climate variability in the NH (Gong et al 2002,Fletcher et al 2007, Orsolini and Kvamsto 2009, Allen andZender 2010, 2011). As discussed in Cohen et al (2007),increasing snow cover leads to stronger diabatic cooling anda strengthened Siberian high. This further leads to an increasein upward propagation of planetary waves, a weakened polarvortex and westerlies, but strengthened meridional flow.This results in a negative AO in the lower troposphere andincreased Arctic outbreaks into the middle latitudes. Theincreasing trend in Eurasian snow cover over the past two anda half decades is concomitant with an overall weakening of thepolar vortex (Alexeev et al 2011) and, as seen in figure 2(e),a negative trend of the AO. The negative AO trend favoursanomalously cold temperatures over the eastern United States
and northern Eurasia and increased storminess in the middlelatitudes (Thompson and Wallace 1998, 2001).
Thus, the regional NH wintertime temperature coolingis directly tied to the declining trend in the wintertimeAO, which is forced partly by increases in Eurasian snowcover during the autumn, driven in response to warmersurface temperatures at high latitudes prior to and concurrentwith the autumnal advance in snow cover. While the AOcertainly exhibits intrinsic behaviour, earlier studies predictedthat global warming would be associated with a positivetrend in the AO (as discussed in Cohen and Barlow 2005).Additionally, the negative trend in the AO has also been tiedto decreasing Arctic sea ice (Honda et al 2009, Overlandand Wang 2010, Petoukhov and Semenov 2010), asidefrom impacts of Eurasian snow cover variability. However,regressions of DJF surface temperature anomalies onto thewinter AO, the October Eurasian snow cover, and theSeptember Arctic sea ice coverage indices show strongersimilarities between the snow cover and the AO pattern ofvariability than with the sea ice and AO variability (figure 4).Therefore, observational analysis suggests a first-order linkbetween snow cover and the winter AO, with potentialcontributions to snow cover variability from sea ice variabilityand its effects on tropospheric moisture.
5
Environ. Res. Lett. 7 (2012) 014007 J L Cohen et al
(a) (b)
(c)
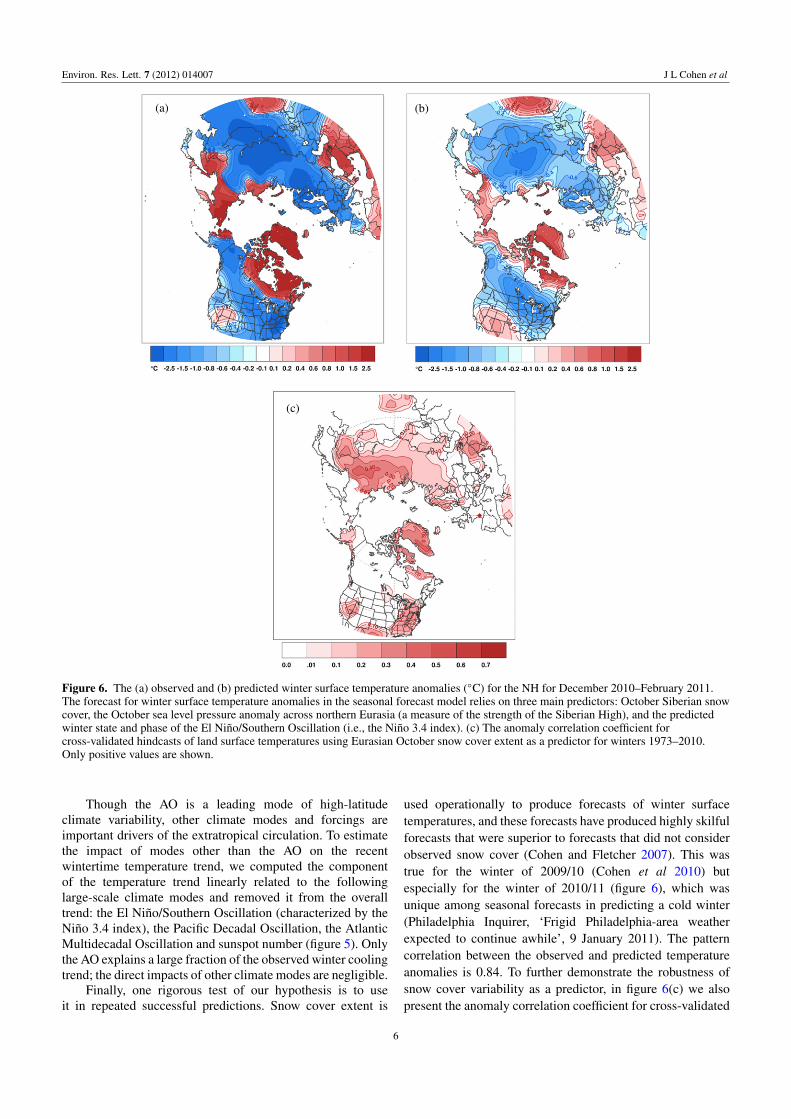
Figure 6. The (a) observed and (b) predicted winter surface temperature anomalies (◦C) for the NH for December 2010–February 2011.The forecast for winter surface temperature anomalies in the seasonal forecast model relies on three main predictors: October Siberian snowcover, the October sea level pressure anomaly across northern Eurasia (a measure of the strength of the Siberian High), and the predictedwinter state and phase of the El Nino/Southern Oscillation (i.e., the Nino 3.4 index). (c) The anomaly correlation coefficient forcross-validated hindcasts of land surface temperatures using Eurasian October snow cover extent as a predictor for winters 1973–2010.Only positive values are shown.
Though the AO is a leading mode of high-latitudeclimate variability, other climate modes and forcings areimportant drivers of the extratropical circulation. To estimatethe impact of modes other than the AO on the recentwintertime temperature trend, we computed the componentof the temperature trend linearly related to the followinglarge-scale climate modes and removed it from the overalltrend: the El Nino/Southern Oscillation (characterized by theNino 3.4 index), the Pacific Decadal Oscillation, the AtlanticMultidecadal Oscillation and sunspot number (figure 5). Onlythe AO explains a large fraction of the observed winter coolingtrend; the direct impacts of other climate modes are negligible.
Finally, one rigorous test of our hypothesis is to useit in repeated successful predictions. Snow cover extent is
used operationally to produce forecasts of winter surfacetemperatures, and these forecasts have produced highly skilfulforecasts that were superior to forecasts that did not considerobserved snow cover (Cohen and Fletcher 2007). This wastrue for the winter of 2009/10 (Cohen et al 2010) butespecially for the winter of 2010/11 (figure 6), which wasunique among seasonal forecasts in predicting a cold winter(Philadelphia Inquirer, ‘Frigid Philadelphia-area weatherexpected to continue awhile’, 9 January 2011). The patterncorrelation between the observed and predicted temperatureanomalies is 0.84. To further demonstrate the robustness ofsnow cover variability as a predictor, in figure 6(c) we alsopresent the anomaly correlation coefficient for cross-validated
6

Environ. Res. Lett. 7 (2012) 014007 J L Cohen et al
hindcasts of surface temperature anomalies (1973–2010) onlyusing October Siberian snow cover as a predictor. Suchsuccessful forecasts and robust hindcasts strongly supportthe argument that increasing snow cover has negated thebackground-warming signal and yielded a neutral borealwinter temperature trend for the last two decades or more.
In summary, large-scale cooling has occurred duringboreal winter over much of the NH landmasses over the lasttwo and a half decades (figure 1(c)). With much attentionon the effects of global warming on the climate system, therecent severe winter weather has heightened global warmingscepticism among the general public. Traditional radiativeGHG theory and coupled climate models forced by increasingGHGs alone cannot account for this seasonal asymmetry.Though we cannot conclude definitively that warming inthe summer and autumn is forcing winter regional cooling,analysis of the most recent observational and modellingdata supports links between strong regional cooling trendsin the winter and warming trends in the prior seasons.A warmer, more moisture-laden Arctic atmosphere in theautumn contributes to an increase in Eurasian snow coverduring that season. This change in snow cover dynamicallyforces negative AO conditions the following winter. Wededuce that one main reason for models failing to capturethe observed wintertime cooling is probably their poorrepresentation of snow cover variability and the associateddynamical relationships with atmospheric circulation trends(Hardiman et al 2008, Jeong et al 2011). Incorporation of thesnow cover–AO relationship into seasonal forecasts is shownto greatly improve their abilities, and hence long-term climatesolutions from coupled climate models may also benefit fromimproved snow–AO relationships.
Acknowledgments
JLC is supported by the National Science Foundation (NSF)grants ARC-0909459 and ARC-0909457, and NOAA grantNA10OAR4310163. MAB was supported by NSF grant ARC0909272. VA and JEC were supported by the NSF grants ARC0909525 and Japan Agency for Marine–Earth Science andTechnology. The authors acknowledge the climate modellinggroups listed in table 2 of this letter, the World ClimateResearch Programme (WCRP) Working Group on CoupledModelling (WGCM), and the Global Organization for EarthSystem Science Portals (GO-ESSP) for producing and makingthe CMIP5 model simulations available for analysis.
References
Alexeev V A, Esau I N, Polyakov I V, Byam S J andSorokina S 2011 Vertical structure of recent Arctic warmingfrom observed data and reanalysis products Clim. Changeat press (doi:10.1007/s10584-011-0192-8)
Alexeev V A, Langen P L and Bates J R 2005 Polar amplification ofsurface warming on an aquaplanet in ‘ghost forcing’experiments without sea ice feedbacks Clim. Dyn. 24 655–66
Allen R J and Zender C S 2010 Effects of continental-scale snowalbedo anomalies on the wintertime Arctic OscillationJ. Geophys. Res. 115 D23105
Allen R J and Zender C S 2011 Forcing of the ArcticOscillation by Eurasian snow cover J. Clim. 24 6528–39
Blunden J, Arndt D S and Baringer M O 2011 State of the climatein 2010 Bull. Am. Meteorol. Soc. 92 S1–S236
Brohan P, Kennedy J J, Harris I, Tett S F B and Jones P D 2006Uncertainty estimates in regional and global observedtemperature changes: a new dataset from 1850 J. Geophys.Res. 111 D12106
Cohen J and Barlow M 2005 The NAO, the AO, and globalwarming: how closely related? J. Clim. 18 4498–513
Cohen J, Barlow M, Kushner P and Saito K 2007Stratosphere–troposphere coupling and links with Eurasianland-surface variability J. Clim. 20 5335–43
Cohen J, Barlow M and Saito K 2009 Decadal fluctuations inplanetary wave forcing modulate global warming in late borealwinter J. Clim. 22 4418–26
Cohen J and Fletcher C 2007 Improved skill for NorthernHemisphere winter surface temperature predictions based onland–atmosphere fall anomalies J. Clim. 20 4118–32
Cohen J, Foster J, Barlow M, Saito K and Jones J 2010 Winter2009/10: a case study of an extreme Arctic Oscillation eventGeophys. Res. Lett. 37 L17707
Cohen J and Entekhabi D 1999 Eurasian snow cover variability andNorthern Hemisphere climate predictability Geophys. Res.Lett. 26 345–8
Durre I, Claude N W Jr, Yin X and Vose R S 2009Radiosonde-based trends in precipitable water over theNorthern Hemisphere: an update J. Geophys. Res. 114 D05112
Eastman R and Warren S G 2010 Interannual variations of Arcticcloud types in relation to sea ice J. Clim. 23 4216–32
Elliott W P, Ross R J and Blackmore W 2002 Recent changes inNWS upper-air observations with emphasis on changes fromVIZ to Vaisala radiosondes Bull. Am. Meteorol. Soc.83 1003–17
Flanner M G, Shell K M, Barlage M, Perovich D K andTschudi M A 2011 Radiative forcing and albedo feedbackfrom the Northern Hemisphere cryosphere between 1979 and2008 Nature Geosci. 4 151–5
Fletcher C, Kushner P and Cohen J 2007 Stratospheric control ofthe extratropical circulation response to surface forcingGeophys. Res. Lett. 34 L21802
Ghatak D, Frei A, Gong G, Stroeve J and Robinson D 2010 On theemergence of an Arctic amplification signal in terrestrial Arcticsnow extent J. Geophys. Res. 115 D24105
Gong G, Entekhabi D and Cohen J 2002 A large-ensemble modelstudy of the wintertime AO/NAO and the role of interannualsnow perturbations J. Clim. 15 3488–99
Hansen J and Nazarenko L 2004 Soot climate forcing via snow andice albedos Proc. Natl Acad. Sci. 101 423–8
Hardiman S C, Kushner P J and Cohen J 2008 Investigating theability of general circulation models to capture the effects ofEurasian snow cover on winter climate J. Geophys. Res.113 D21123
Holland M M and Bitz C M 2003 Polar amplification of climatechange in coupled models Clim. Dyn. 21 221–32
Honda M, Inoue J and Yamane S 2009 Influence of low Arcticsea-ice minima on anomalously cold Eurasian wintersGeophys. Res. Lett. 36 L08707
Jeong J-H, Ou T, Linerholm H W, Kim B-K, Kim S-J, Kug J-S andChen D 2011 The recent recovery of the Siberian highintensity J. Geophys. Res. 116 D23102
Kalnay E et al 1996 The NCEP/NCAR 40-year reanalysis projectBull. Am. Meteorol. Soc. 77 437–71
Langen P L and Alexeev V A 2007 Polar amplification as apreferred response in an aquaplanet GCM Clim. Dyn.29 305–17
7

Environ. Res. Lett. 7 (2012) 014007 J L Cohen et al
Orsolini Y J and Kvamsto N G 2009 Role of Eurasian snow cover inwintertime circulation: decadal simulations forced withsatellite observations J. Geophys. Res. 114 D19108
Orsolini Y J, Senan R, Benestad R E and Melsom A 2011 Autumnatmospheric response to the 2007 low Arctic sea ice extent incoupled ocean–atmosphere hindcasts Clim. Dyn. 114 D19108
Overland J E and Wang M 2010 Large-scale atmospheric circulationchanges are associated with the recent loss of Arctic sea iceTellus A 62 1–9
Petoukhov V and Semenov V A 2010 A link between reducedBarents–Kara sea ice and cold winter extremes over northerncontinents J. Geophys. Res. 115 D21111
Rayner N A, Parker D E, Horton E B, Folland C K, Alexander L V,Rowell D P, Kent E C and Kaplan A 2003 Global analyses ofsea surface temperature, sea ice, and night marine airtemperature since the late nineteenth century J. Geophys. Res.108 4407
Rienecker M M et al 2011 MERRA—NASA’s Modern-EraRetrospective Analysis for Research and Applications J. Clim.24 3624–48
Robinson D A, Dewey F and Heim R Jr 1993 Northern Hemisphericsnow cover: an update Bull. Am. Meteorol. Soc. 74 1689–96
Screen J A and Simmonds I 2010 The central role of diminishingsea ice in recent Arctic temperature amplification Nature464 1334–7
Solomon S et al (ed) 2007 Climate Change 2007: The PhysicalScience Basis (Cambridge: Cambridge University Press)
Stroeve J C, Serreze M C, Barrett A and Kindig D N 2011Attribution of recent changes in autumn cyclone associatedprecipitation in the Arctic Tellus A 63 1–11
Thompson D W J and Wallace J M 1998 The Arctic Oscillationsignature in the wintertime geopotential height andtemperature fields Geophys. Res. Lett. 25 1297–300
Thompson D W J and Wallace J M 2001 Regional climate impactsof the Northern Hemisphere Annular Mode Science 293 85–9
8